1. Introduction
Rivers receive and transport plastic waste, contributing significantly to the pollution of lakes and oceans. Macroplastics are mainly released into the environment and rivers through improperly treated or illegally discharged waste [
1,
2,
3], while microplastics (MPs) might originate from their fragmentation or the discharge of treated or untreated wastewater into rivers [
4]. The number of microplastic studies is rapidly increasing; however, the environmental background of MP transport, deposition and remobilization is often neglected [
5,
6,
7]. The environmental conditions of the sampling (e.g., hydrological events, flow conditions, sampled landform and sedimentological background) are crucial, as they fundamentally influence the number of MP particles in sediment or the water [
7,
8]. Most of the current studies emphasize the role of various chemical methods in MP extraction [
9,
10], or they analyze the chemical composition of the particles [
11,
12], though the sampling environment is the key ignored point.
The concentration of MP particles transported in rivers is neither spatially nor temporally constant [
13,
14], as the points could act as sinks or sources [
6]. Spatial monitoring, e.g., sampling multiple sites within a water system at a given time, is common [
15,
16]. Based on these measurements, the longitudinal variations in MP deposition and their influencing factors could be analyzed [
15,
17,
18]. For example, Ding et al. [
15] found that the MP pollution of sediments is influenced by river width, as along wider sections, the flow conditions change and the lower flow velocity supports the deposition of dense MP particles. Furthermore, MP spatial contamination is highly influenced by point sources [
16,
18] or inflowing, inadequately treated waste water [
15]. Thus, spatial monitoring surveys can identify sources, sinks and hotspots of MPs at a given moment [
10]. The abundant deposition of MPs in sediments leads to the development of MP hotspots, possibly a secondary MP source in the riverine environment [
19]. Despite this, not all sources and sinks are equally active at a given time; thus, not all could be identified, giving only an approximate view of the pollution. However, based on frequent monitoring surveys, the temporal pattern of MP dynamism could be identified; thus, the most suitable points for long-term monitoring could be selected.
Until now, temporal monitoring was limited to a relatively small number of points and short periods. Temporal measurements reveal the seasonality of MP pollution, its hydrological background and the role of changes in run-off conditions [
5,
6]. Unfortunately, the timing of the measurements is frequently not fitted to the regime of the river; thus, no clear conclusions can be drawn. The sediment deposition increases during low stages due to reduced flow velocity, while MP-polluted sediments are mobilized in periods with increased flow velocity; thus, in the water, the MP concentration increases [
5,
7]. From this point of view, the measurements of Mohsen et al. [
7] are outstanding, as they collected water samples at the same site every five days for almost two years. They stated that the MP content of water strongly correlates with suspended sediment concentration and water level. Thus, temporal monitoring studies can reveal the different degrees of pollution related to hydrological changes. However, it should be noted that temporally repeated measurements at a point cannot represent the pollution status of the entire river system due to the possible existence of pollution sources nearby.
There is a limited number of measurements repeated in space and time, as these are very labor- and resource-intensive. Their advantage is that they can capably identify stationery MP sources and support understanding of the spatially and temporally varying environmental processes that govern MP deposition and mobilization. One of the first complex measurements was carried out by Hurley et al. [
13], who found that floods effectively redistribute MP pollution within a river system, though this is not spatially uniform. A similar redistribution was observed by Rodrigues et al. [
20] and Kiss et al. [
14,
21]. Thus, spatially and temporally repeated measurements could be used to identify MP sources and the origin of the pollution, transport and mixing of MPs, their accumulation, hotspot deployment and the main driving factors of these processes.
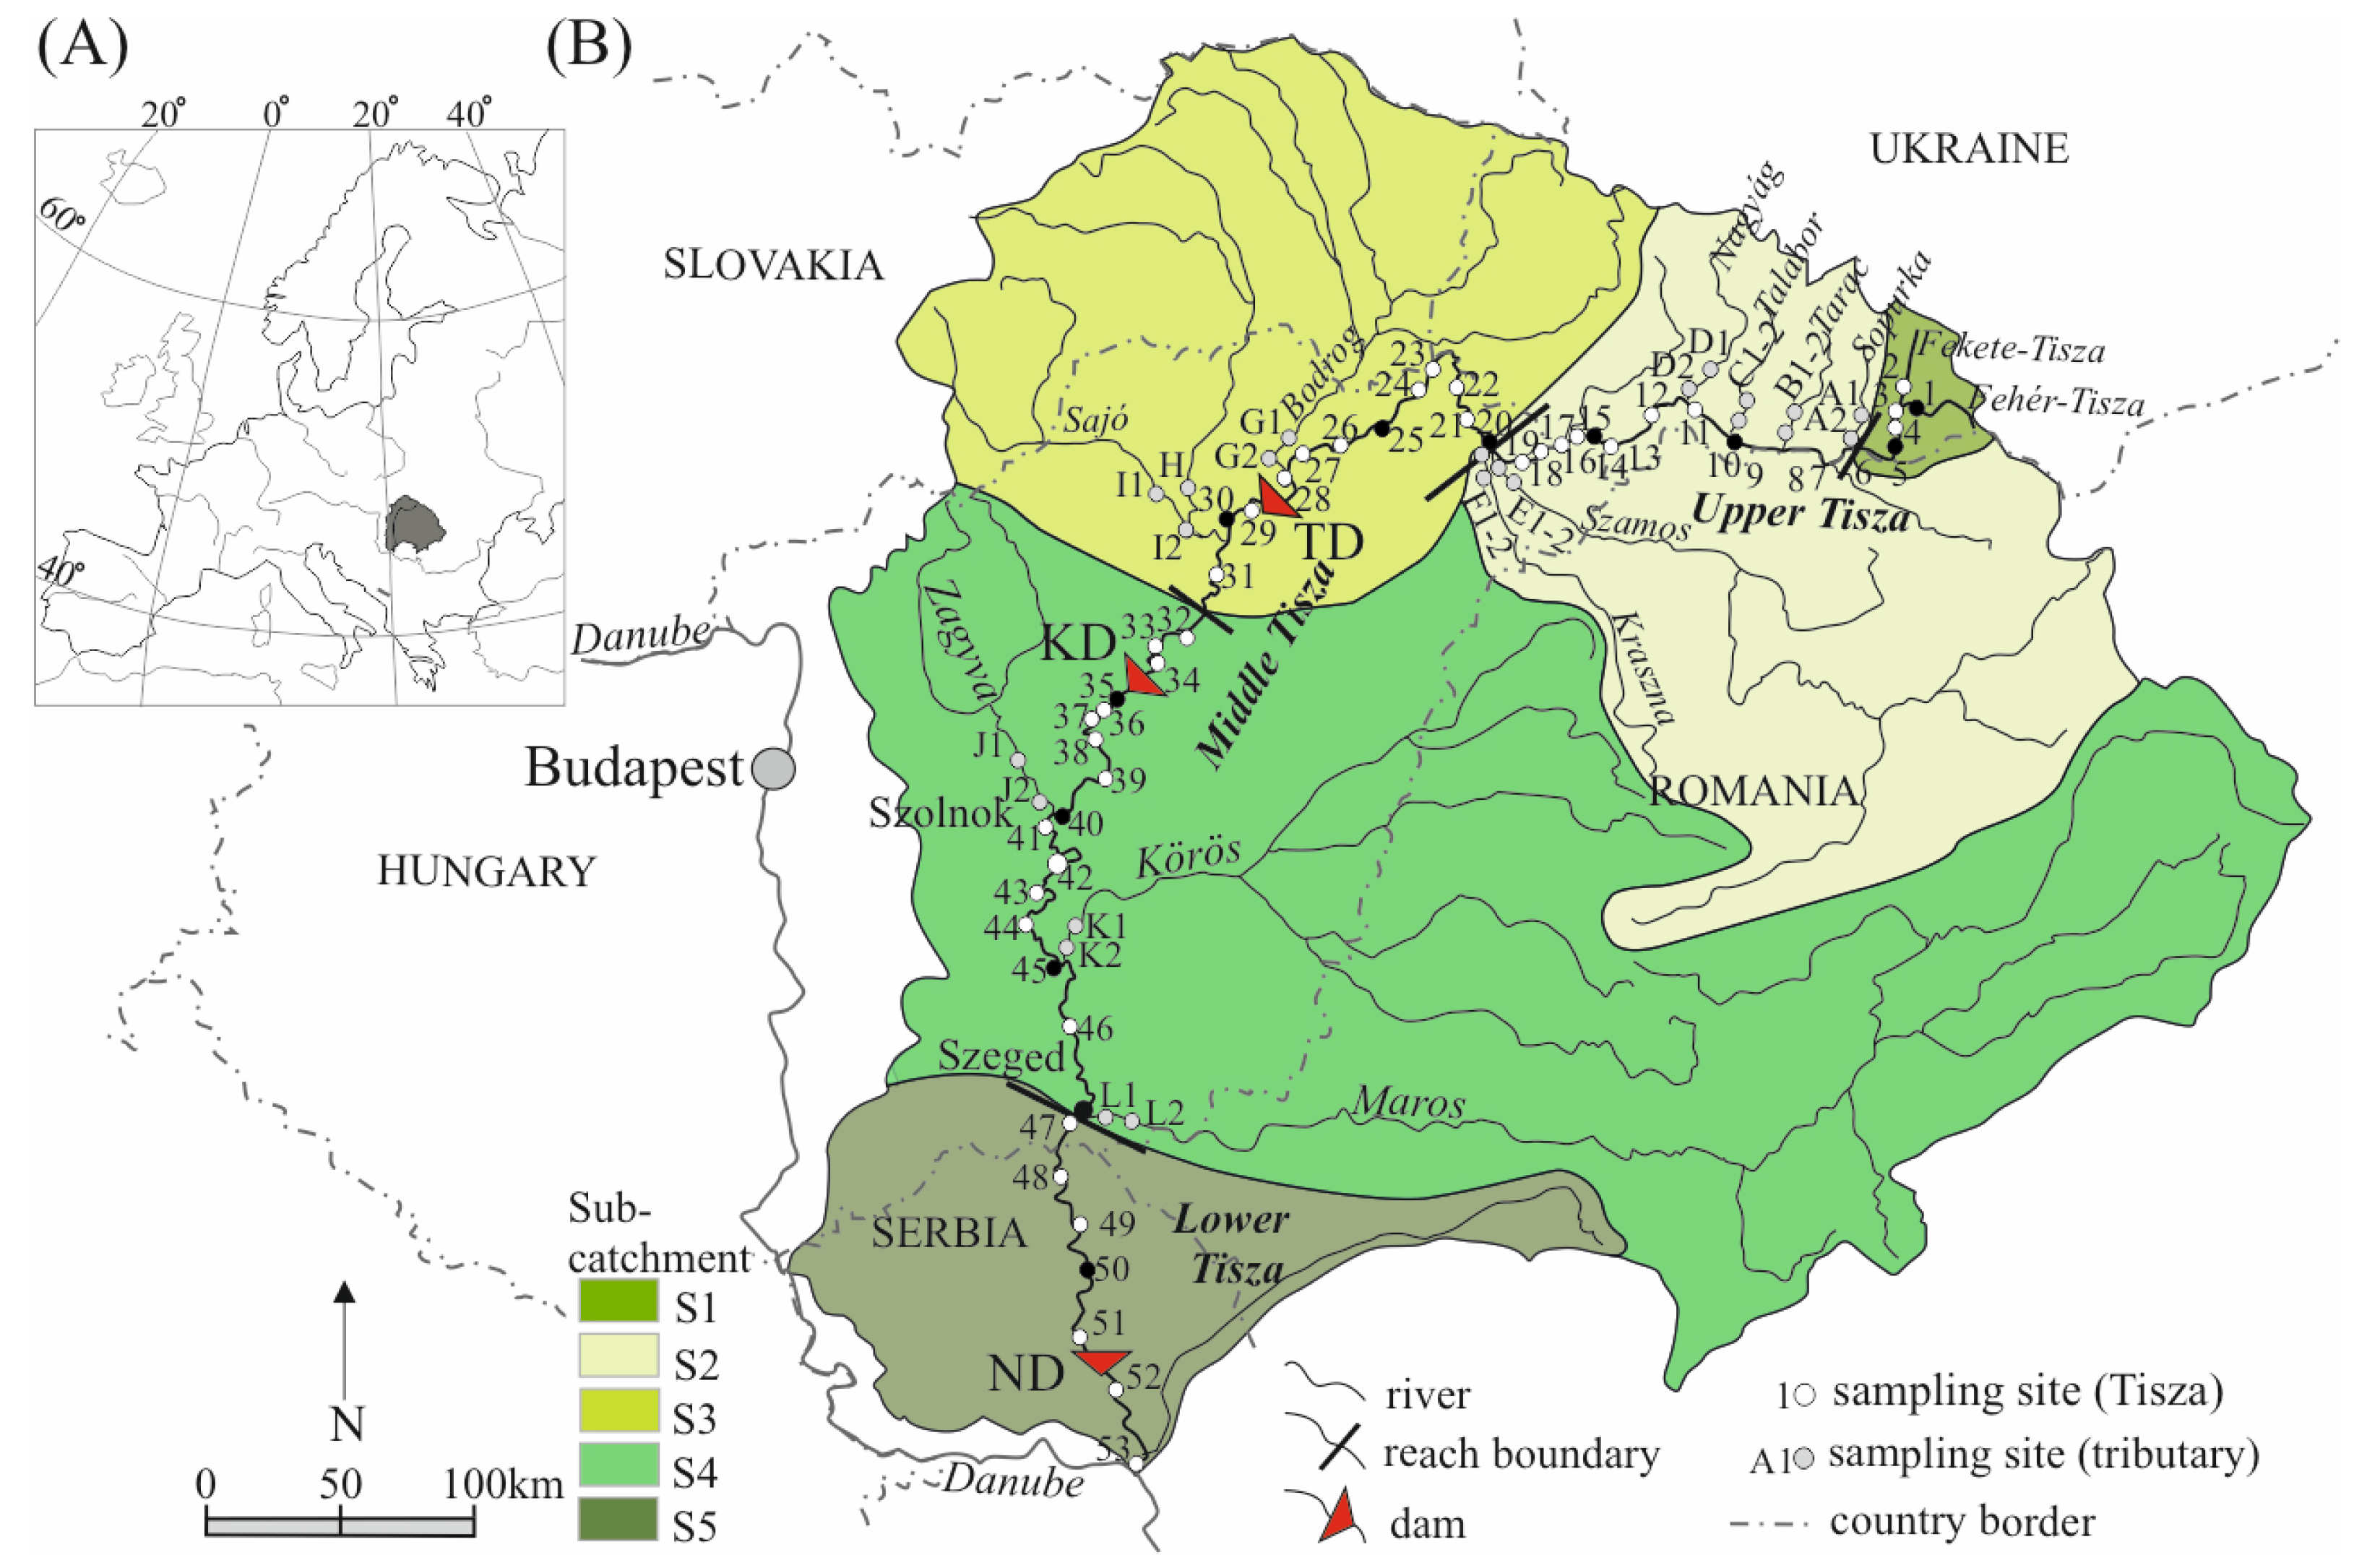
As presented above, MP monitoring over several hundreds of kilometers reaching across several years is very rare, as it is very labor-intensive and expensive. However, snapshot-like surveys might lead to false conclusions, as the fluvial processes (including MP transport, deposition and remobilization) are influenced by spatially and temporally hanging factors. Therefore, our goal was to understand the spatiotemporal changes in MP deposition and their driving factors. The previous results of the MP pollution of the Tisza River [
7,
14,
21,
22] suggest that the mobilization of MP in the water system could be significant, leading to dynamic changes in hotspots. The aim of the present study was to analyze the long-term temporal and spatial evolution of MP contamination of freshly deposited sediments in the river system of the Tisza River by analyzing clayey sediments collected in 2021–2022 and using previous data (2019 and 2020). Since our previous results proved that the MP content in very fine-sandy, silty or clayey sediments (≤0.1 mm) independent of grain size [
14], in the present study, only freshly deposited clayey sediments were used to evaluate the long-term longitudinal changes. In this way, the MP content was not dependent on downstream changes in slope, flow velocity and grain size. The freshly deposited clay was easily separable and always deposited in the falling limb of floods. Thus, by analyzing the clayey samples, we aimed to investigate (1) the dynamism of the MP pollution of the Tisza River and its sections over three years, (2) the redistribution of the MP hotspots, (3) the effect of tributaries on the pollution of the Tisza River and (4) the influencing factors of longitudinal variations in MP content. Our study is outstanding from the point of view of its scale: it covers several subsequent years and analyzes sediments at over 53 locations along a reach over 744 km long.
3. Results
3.1. Section-Scale Longitudinal Changes in the Microplastic Content of the Clayey Sediments
After the preliminary survey of 2019, 2020 could be considered the baseline survey, as the MP measurements were complemented with more sites, grain size analyses and suspended sediment measurements [
7,
14,
21,
22,
31]. The results of the 2020 measurements [
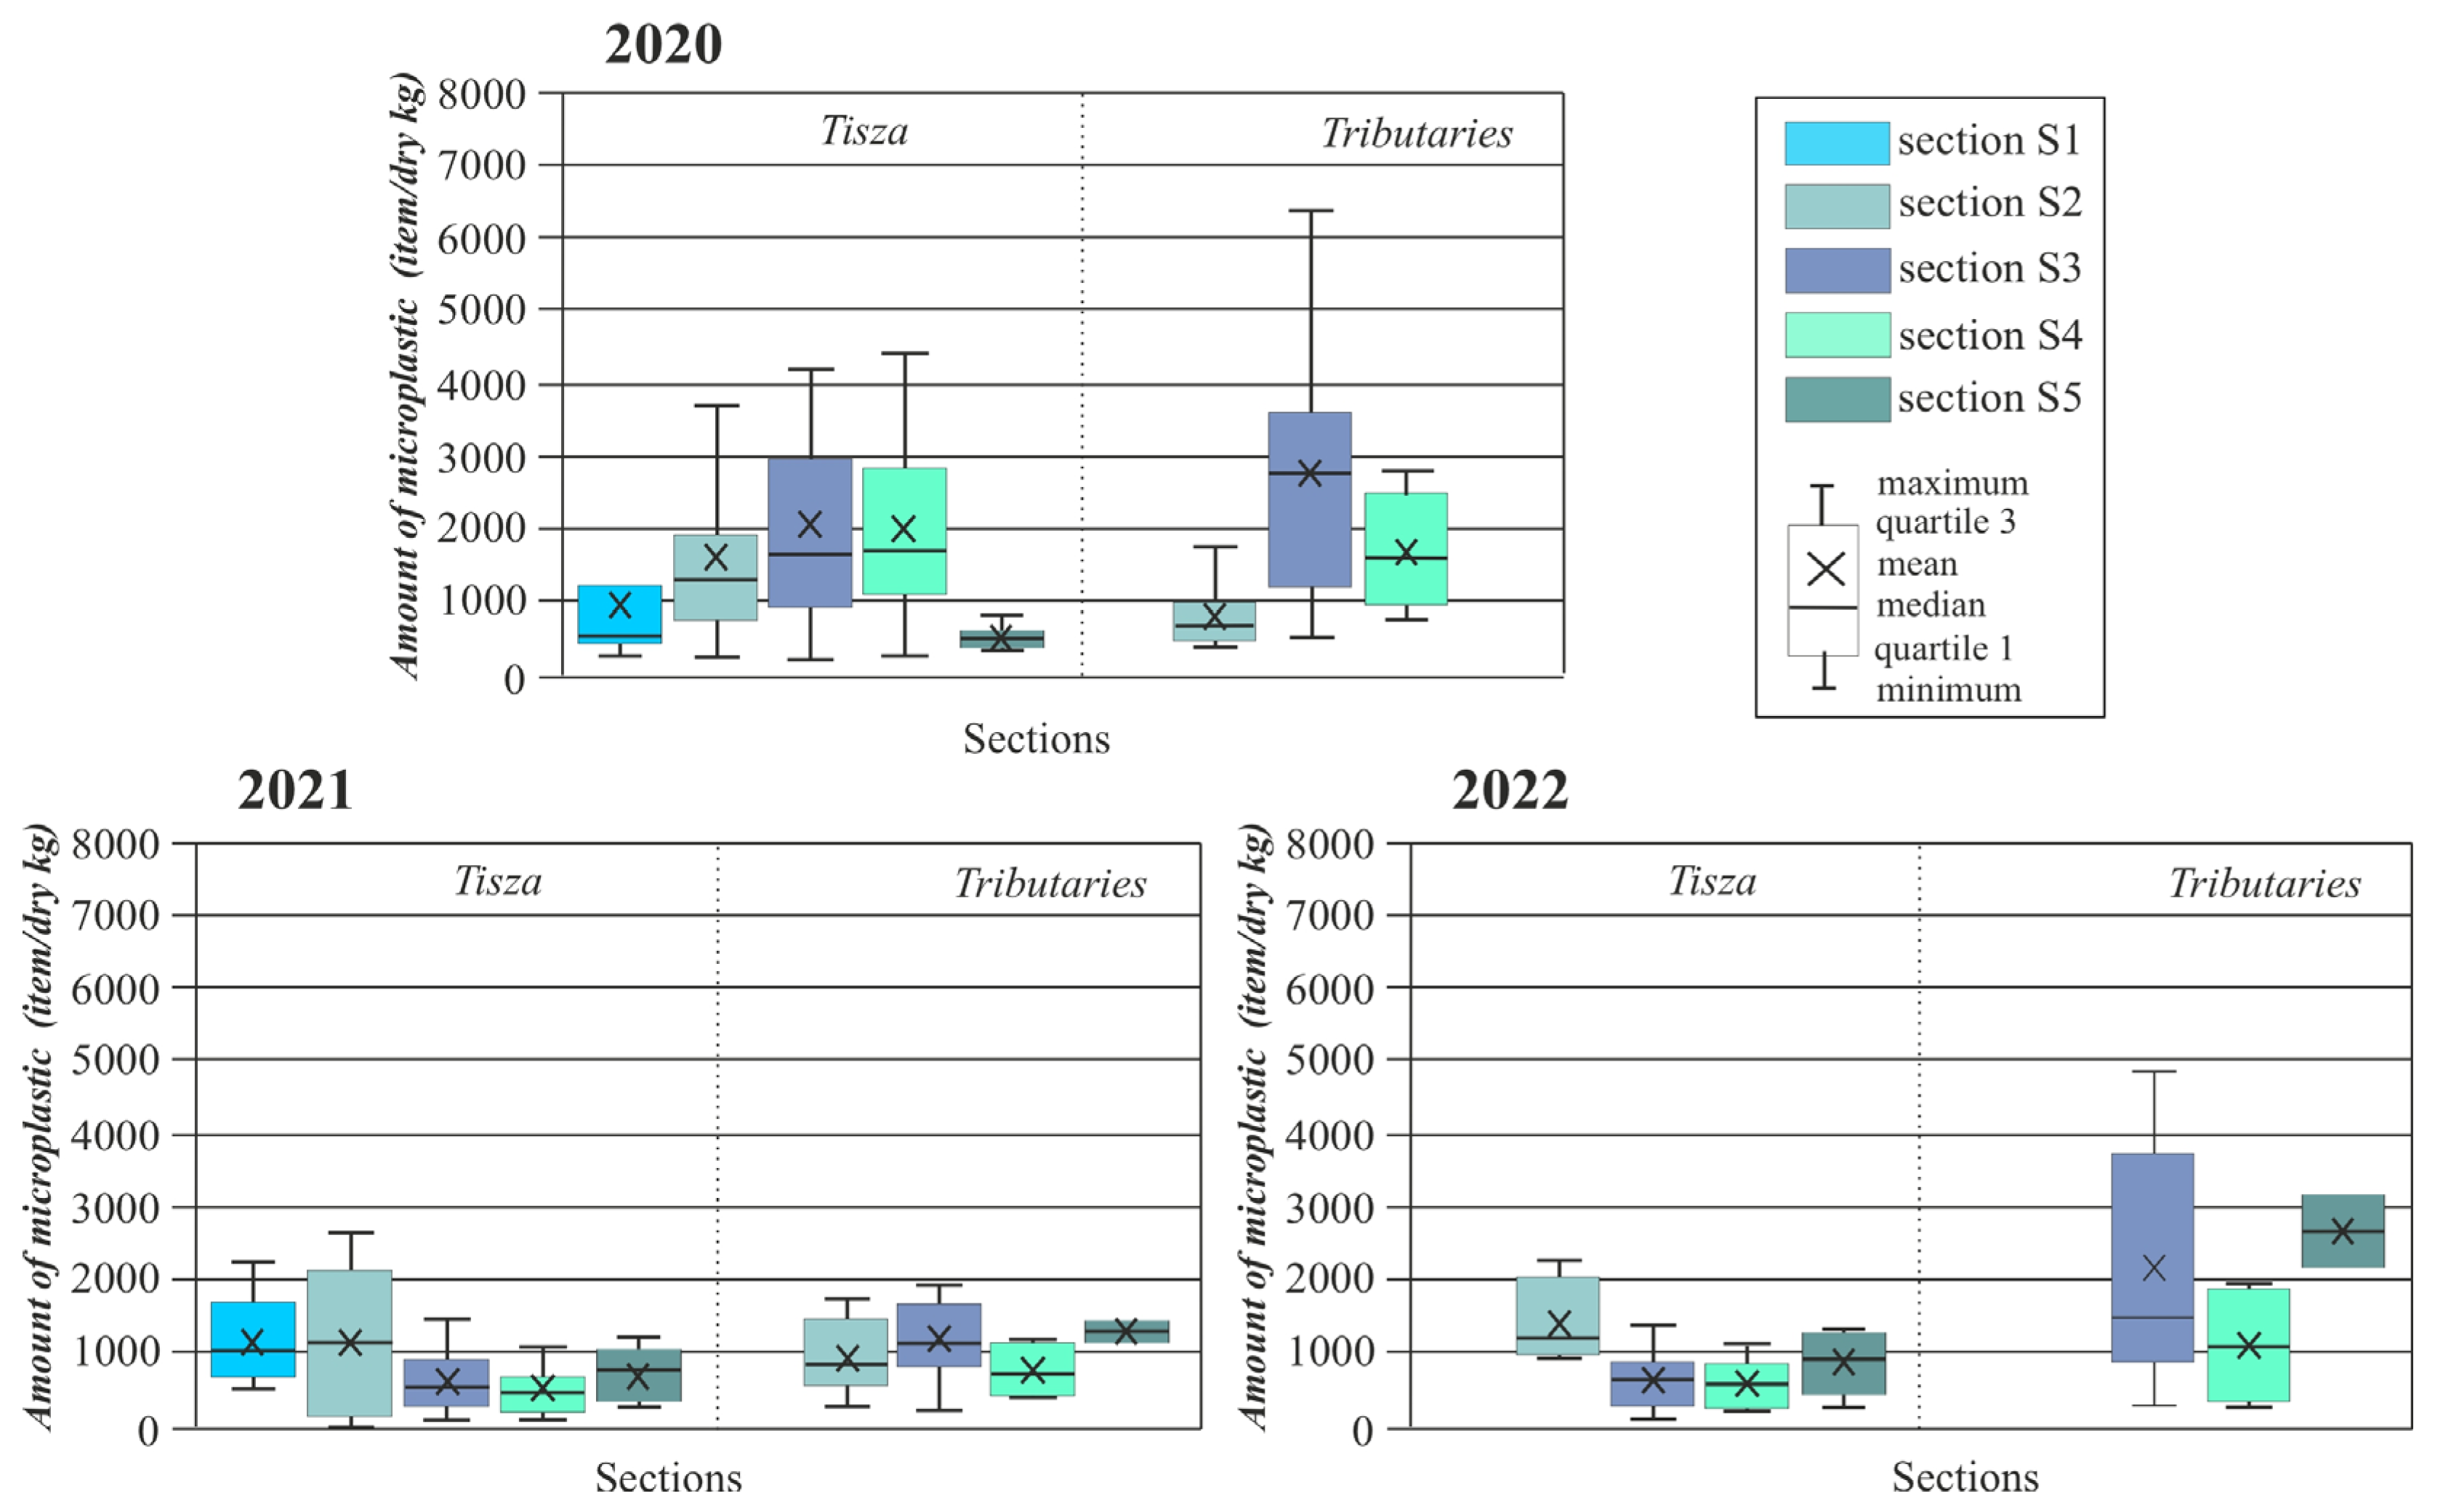
14] could be considered the baseline; thus, these results are briefly introduced for a better understanding of the processes. The average contamination of the clayey sediments of the Tisza River in 2020 was 1291 ± 618 items/kg (range: 360–2880 items/kg;
Table 1). The MP concentrations increased downstream, reaching a peak in the S4 section (
Figure 3). Then, this downstream trend was broken in Lower Tisza, as the S5 section was the least polluted. The sediments of the tributaries contained 50% more MP particles, averaging 1945 ± 1532 items/kg, and the most polluted tributary sediments (range: 440–6383 items/kg) contained more than twice as much MP as the Tisza River. The most contaminated tributaries were the Kraszna River (F2: 4220 items/kg), Hernád River (H1: 3440 items/kg) and Sajó River (I1: 3600 items/kg, I2: 6383 items/kg), which are all connected to the S3 section.
In the following survey (2021), the average MP content of clayey sediments (730 ± 568 items/kg) decreased by 44% (
Table 1). The previous downstream trend changed (
Figure 3) as the contamination declined downstream, so the least contaminated section became the S4 section. However, the MP pollution in the previously least polluted section (S5) increased by 33%. The pollution of the tributaries (1113 ± 465 items/kg) also decreased by 43%, but they still transported more MPs than the Tisza River. The tributaries also showed a different spatial pattern, similar to the Tisza River. The Sajó River remained highly polluted (1940 items/kg), but the Tarac River (1740 items/kg), the Szamos River (1660 items/kg) and the Bodrog River (1760 items/kg) became more polluted than in the previous year.
In 2022, the average MP concentration of Tisza River’s sediments increased by 5% (766 ± 437 items/kg;
Table 1). Though the S1 section was not sampled due to the Ukrainian–Russian war, the downstream trend was similar to that observed in 2020 (
Figure 3). Hence, the MP pollution gradually decreased from the S2 section to the S4 section, and high values were measured again in the S5 section. The sediments of the tributaries contained 83% more MPs (2036 ± 1444 items/kg) than in 2021; thus, the ratio between the pollution of the tributaries and the Tisza River increased from 1.5 to 2.6. The most contaminated tributaries were the Sajó River (4860 items/kg), the Kraszna River (3440–3700 items/kg) and the Maros River (3160 items/kg).
3.2. Point-Scale Changes in Microplastic Content of the Clayey Sediments
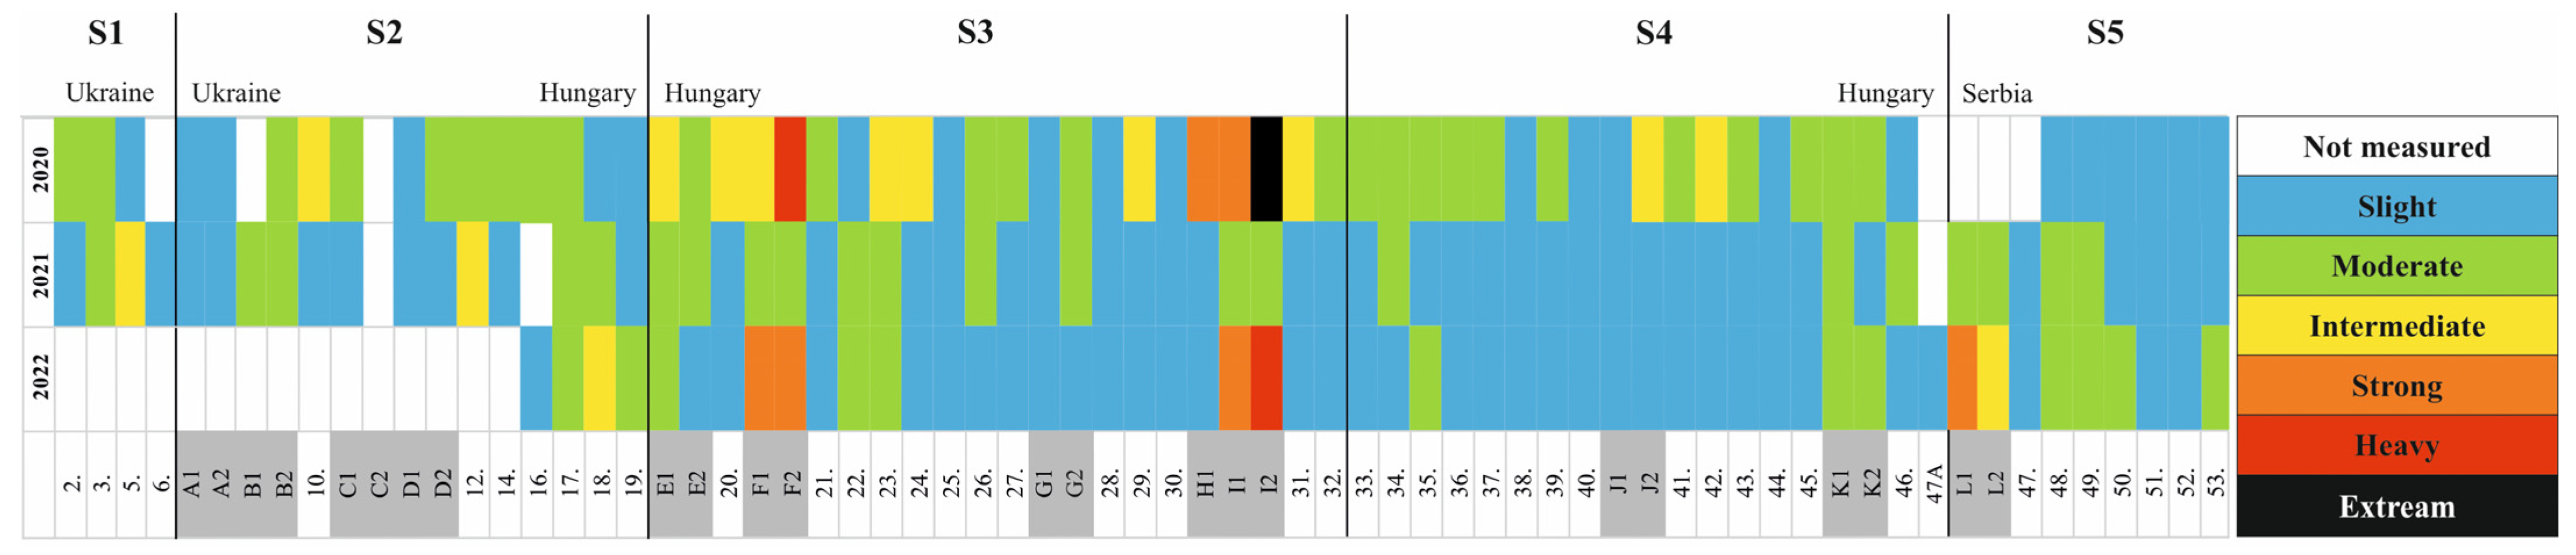
A site was defined as a hotspot if the MP content was ≥2000 items/kg. In 2020, 14 points (22% of sites) were considered hotspots (range: 2048–6383 items/kg), and half of them occurred on the tributaries (
Figure 4). At the same time, 37% of the sampling sites were slightly contaminated by MP, and the rest (41%) were moderately contaminated.
In 2021, the MPs were significantly depleted from the water system, as most points became slightly (68%) or moderately (29%) polluted. Two-thirds of the moderately contaminated sites remained in the same locations as the previous year, and only one new moderately contaminated site appeared. One new hotspot formed in the S1 section (No. 5) and another in the S2 section (No. 12), so only these two hotspots (3% of the sites) were found to be intermediately contaminated in the entire water system. They contained fewer MP particles (2260–2660 items/kg) than the hotspots in the previous year.
In the last year (2022), the number of sites with slight (65%) and moderate (22%) pollution decreased. Only two sites with moderate pollution in the previous year became less polluted, and half showed increased MP pollution. Simultaneously, seven new hotspots (13%) developed: only one on the Tisza River and six on the tributaries (F1–2: Kraszna; I1–2: Sajó; L1–2: Maros). The pollution of the remaining Tisza River hotspot has steadily increased during the three years (No. 18. site in 2020: 800 items/kg; 2021: 1600 items/kg; and 2022: 2280 items/kg). The same hotspots in the Kraszna and Sajó rivers exited in 2020, although they were emptied in 2021, but in 2022, they were reformed again.
Most sites showed dynamic MP pollution patterns; few had similar MP contamination throughout the three years. For example, two sites always represented moderate MP pollution (No. 17: 1140–1640 items/kg; and K1: 980–1960 items/kg), and another ten sites had slight MP pollution in all three years. These points with similar contamination were mainly found in sections S3–S5, while the more diverse ones occurred in Upper Tisza (S1 and S2).
3.3. Annual Microplastic Dynamism in the Confluence Areas
The impact of 12 major tributaries on the MP pollution of the Tisza River was studied in detail. Here, only the most characteristic ones are presented, which show specific spatiotemporal patterns.
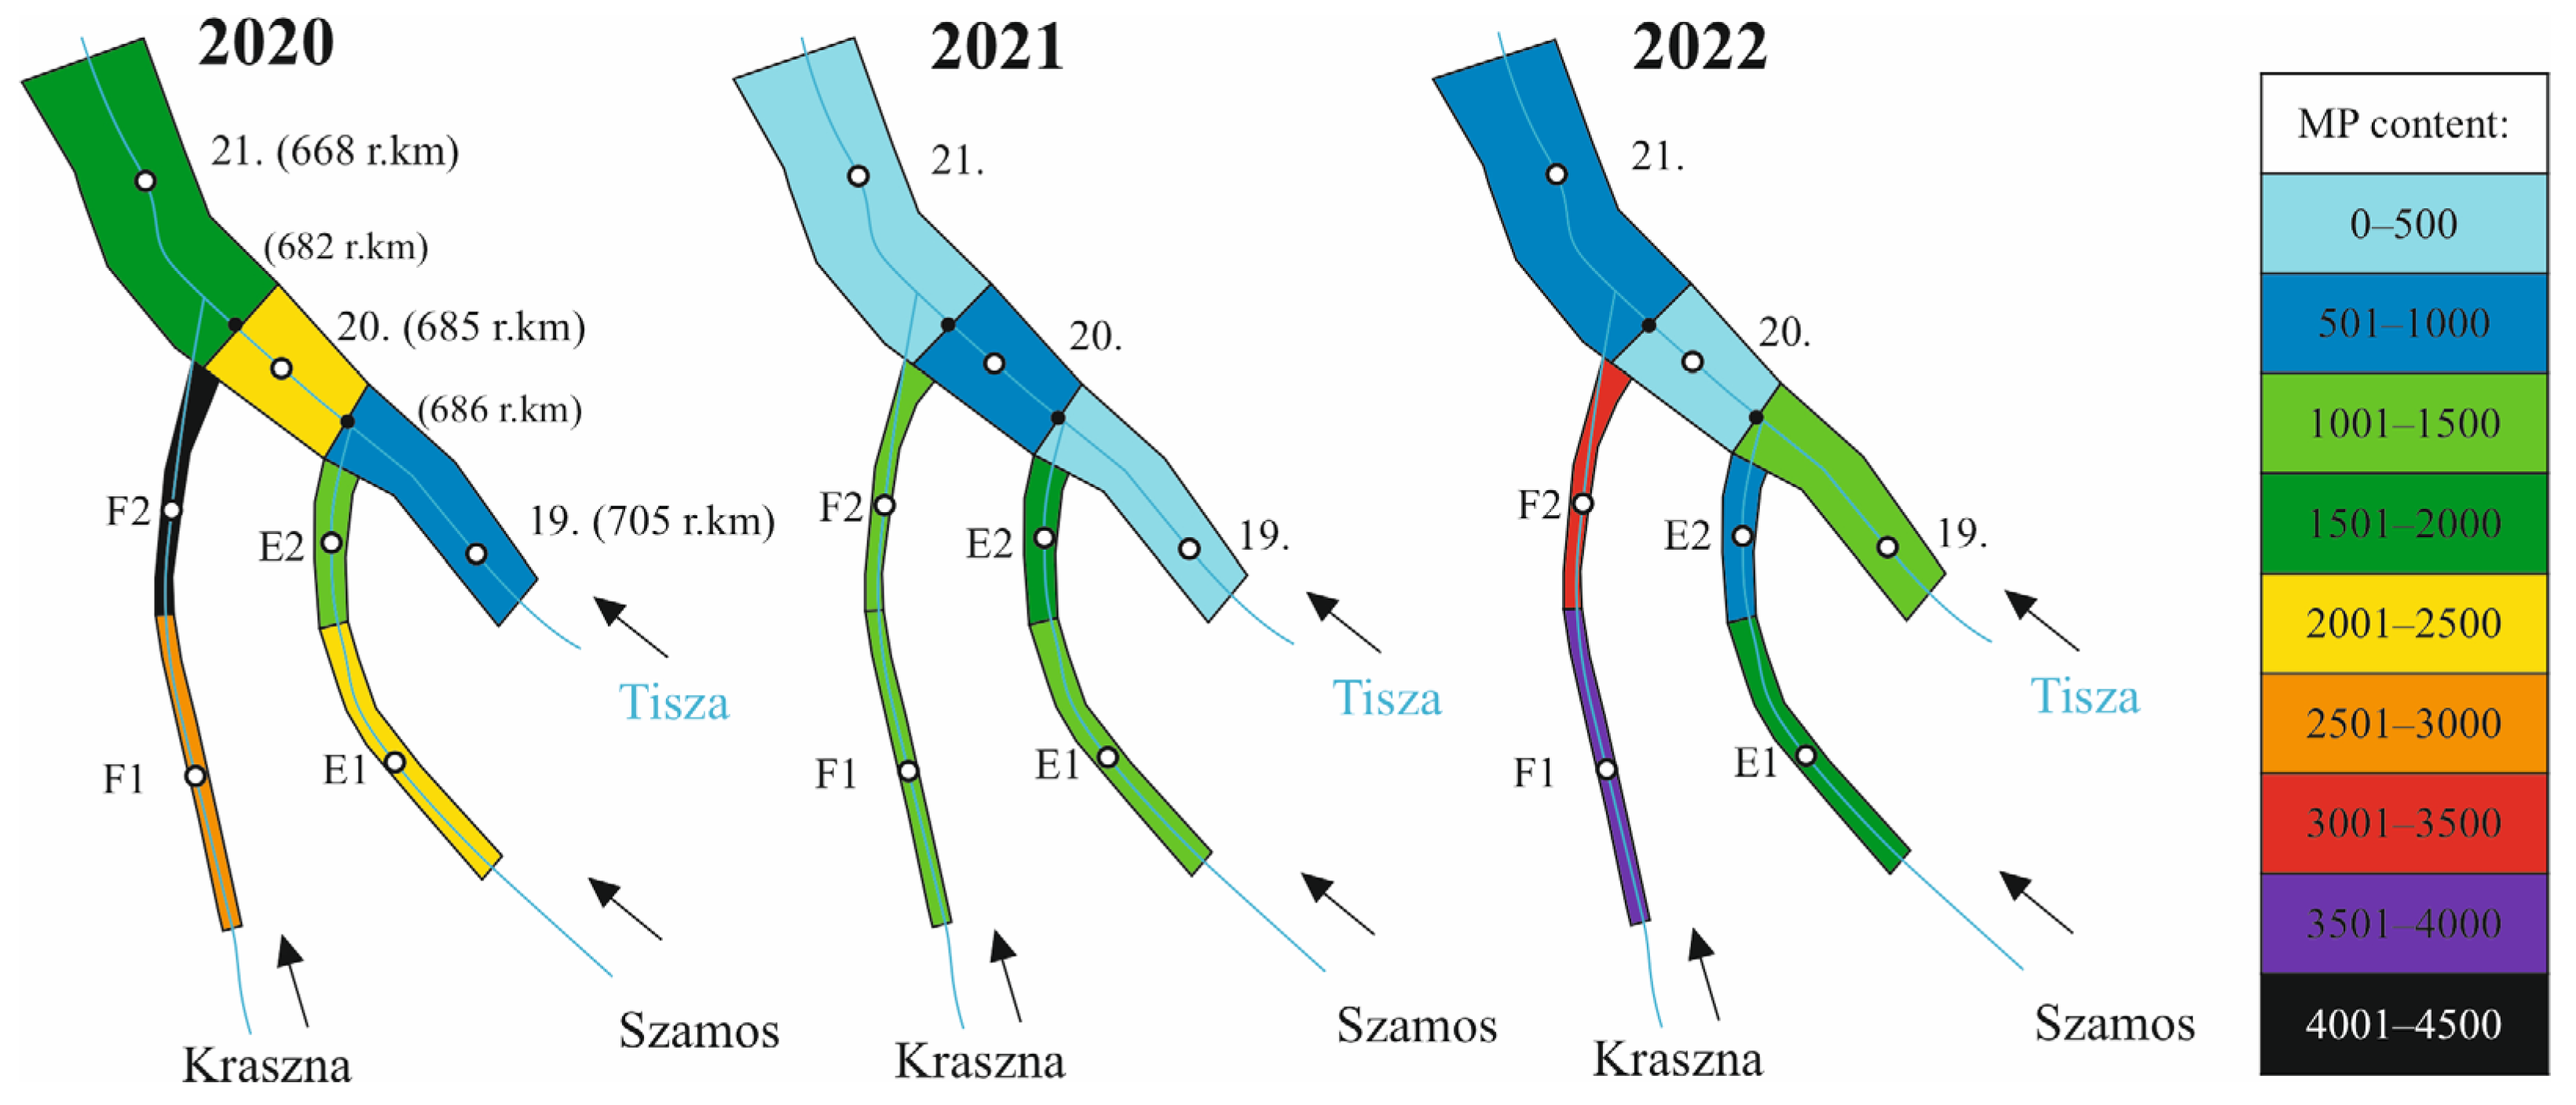
The Szamos and Kraszna Rivers have the most complex confluence (
Figure 5). The larger Szamos River (Q
mean: 120 m
3/s) joins the Tisza River just 4 km upstream of the confluence of the Kraszna River (Q
mean: 5 m
3/s). The sampling site on the Tisza River above the confluence (No. 19) was slightly or moderately contaminated (360–1300 items/kg) in all three years. On the contrary, the sampling points (E1–2) of the Szamos River were slightly-to-intermediately contaminated (E1: 1120–2282 items/kg; E2: 980–1660 items/kg), and usually, the higher values were measured just upstream of the confluence. The Szamos River effectively influenced the pollution of the Tisza River, as downstream of their confluence (No. 20), the MP concentration of the Tisza River doubled in 2020, then it increased by 1.2 times in 2021, but decreased by 69% in 2022. The sediments of the Kraszna River were intermediately-to-heavily contaminated (1140–4220 items/kg). Despite this high MP input, the sediments of the next sampling point on the Tisza River (No. 21) were moderately or slightly contaminated. Thus, the MP contamination between the two subsequent Tisza points decreased in 2020 (−26%) and 2021 (−69%), but an increase (+25%) was observed in 2022.
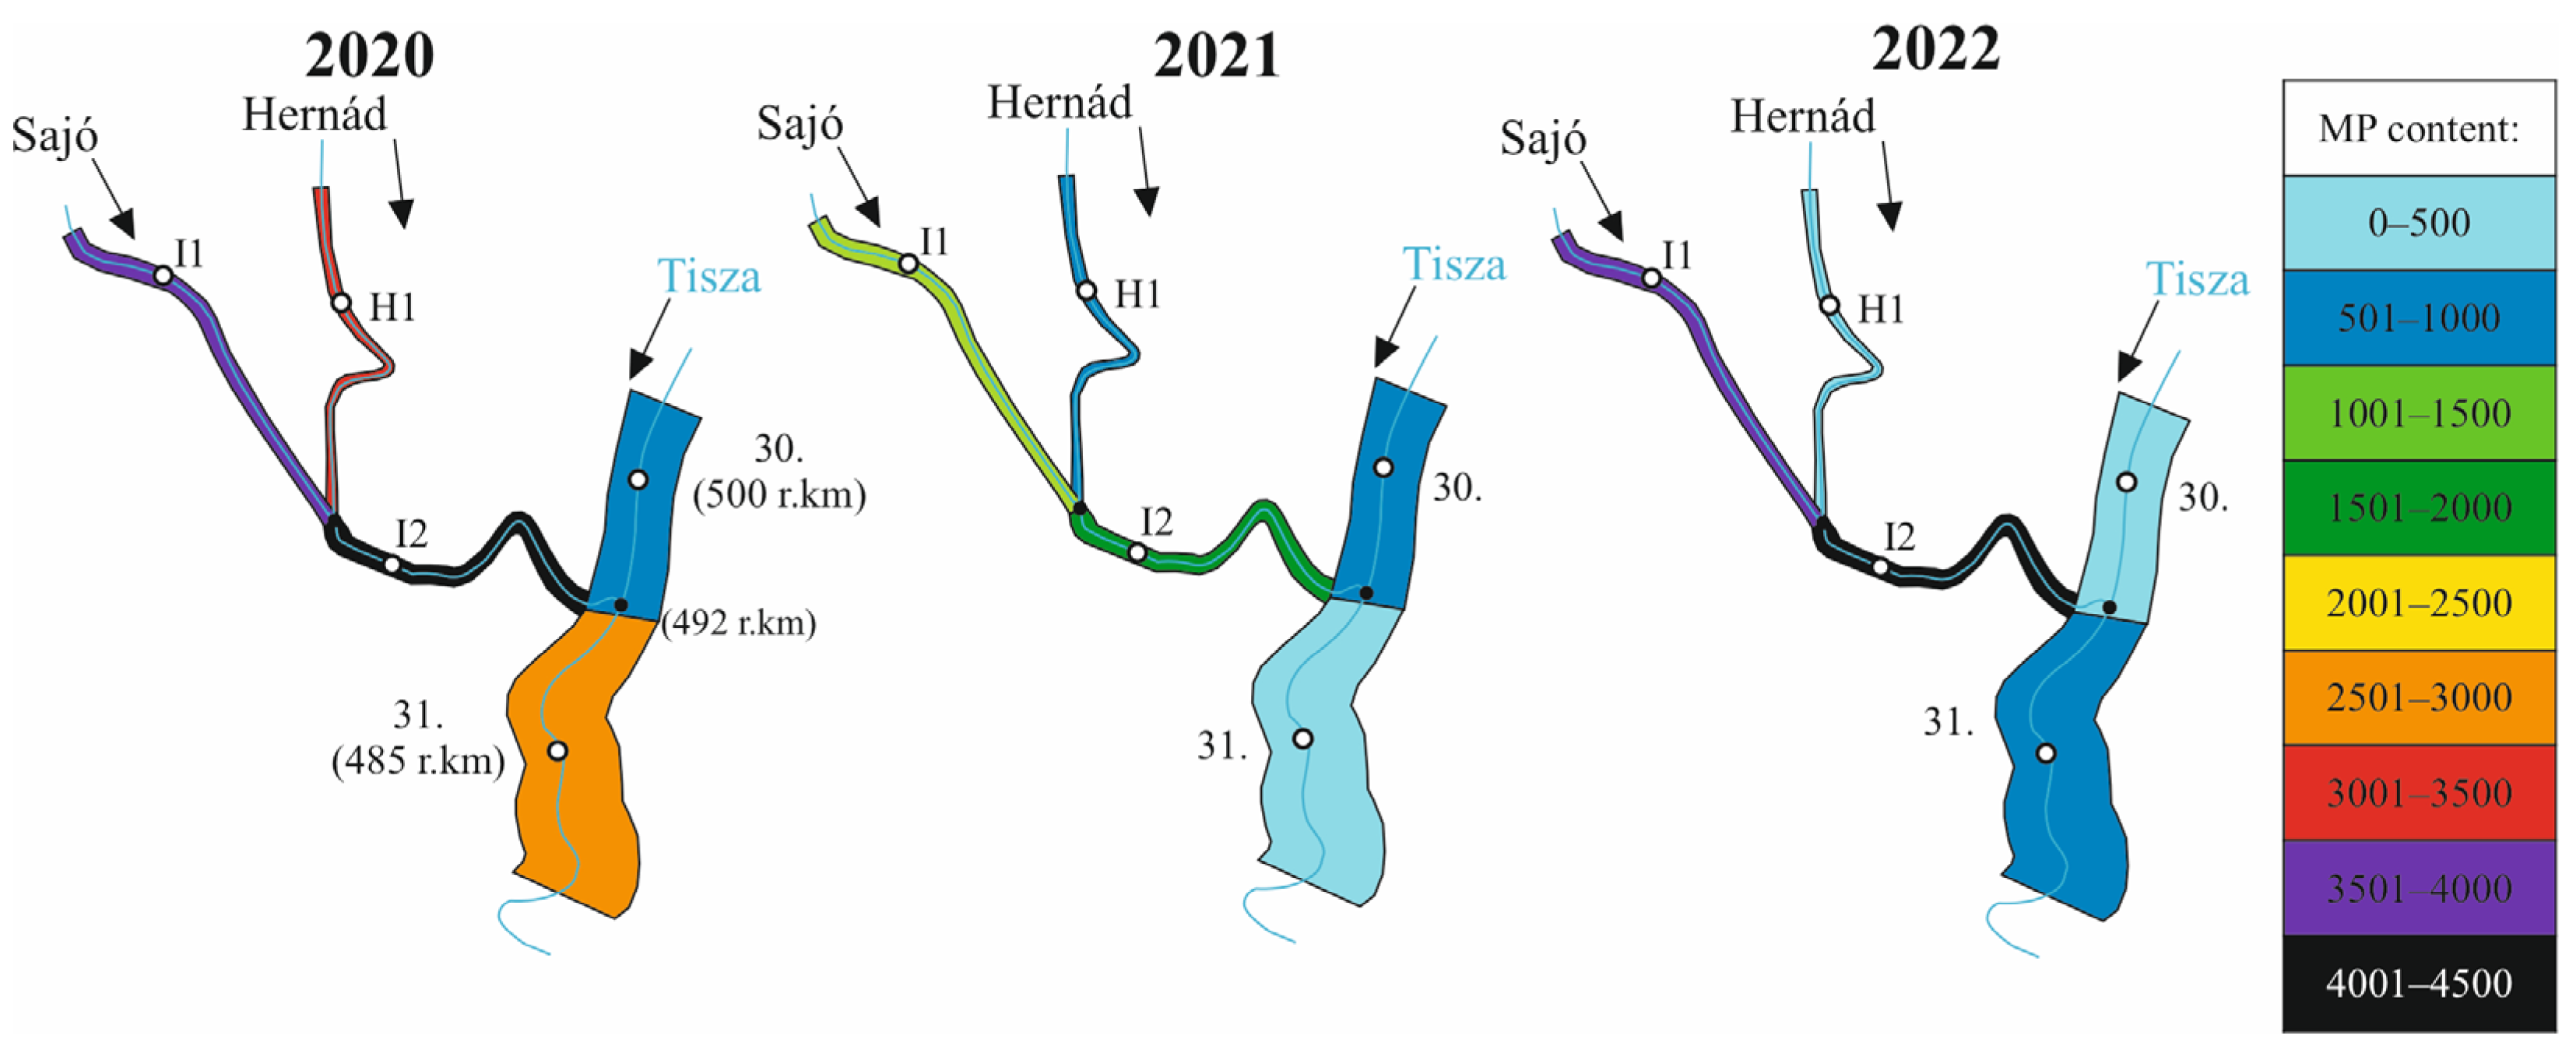
The Hernád (H1) and the Sajó (I1–I2) rivers represent another complex conjunction, as the Hernád River (Q
mean: 27 m
3/s) joins the Sajó River (Q
mean: 65 m
3/s), and then together, they discharge into the Tisza River (
Figure 6). In 2020, the Sajó–Hernád river fluvial systems significantly increased the pollution of the Tisza River. The sediment of the Hernád River (H1: 3440 items/kg) and the upstream sediments of the Sajó River (I1: 3600 items/kg) were strongly polluted, thus; in their common section, the Sajó River became extremely contaminated (I2: 6383 items/kg), and they had a measurable impact on the Tisza River, as the MP content almost tripled (No. 30: 740 items/kg; No. 31: 2880 items/kg). The MP contamination decreased at all sampling points in the following survey year (2021). The sediment of the Hernád River became slightly contaminated (H1: 860 items/kg), and the Sajó River became moderately contaminated (I1: 1400 items/kg; I2: 1940 items/kg). Thus, the contamination of the Tisza River decreased by 44% between the upstream and downstream sites (No. 30: 540 items/kg; No. 31: 300 items/kg). In 2022, a similar spatial trend was observed to that in 2020. The MP pollution of the Sajó River increased 1.5–1.7 times (I1: 3800 items/kg; I2: 4860 items/kg), though the MP content of the Hernád River further decreased by 63% (H1: 320 items/kg). However, the Sajó River could effectively influence the MP pollution of the Tisza River, as the upstream site was slightly polluted (No. 31: 180 items/kg). The MP pollution below the confluence increased nearly four times (No. 31: 860 items/kg).
The other confluences have simpler configurations (
Figure 7). Among them, the Bodrog transports a larger amount of water (Q
mean: 124 m
3/s) than the Körös (Q
mean: 105 m
3/s), and the Zagyva River has the lowest annual discharge (Q
mean: 10 m
3/s). Here, the spatiotemporal changes in the Bodrog confluence area are presented in detail along with the main characteristics of the other confluences.
In the first year, the Bodrog was slightly contaminated (G1: 998 items/kg; G2: 1000 items/kg), and upstream of the confluence, the Tisza River had moderate MP pollution (No. 27: 1045 items/kg). Thus, the tributary slightly diluted the contamination (
Figure 7A), as downstream of the confluence, the MP content of the Tisza River sediment decreased by 20% (No. 28: 832 items/kg). In 2021, the contamination of the upstream sediments of the Bodrog decreased (G1: 840 items/kg), but close to the confluence, it increased (G2: 1760 items/kg). However, this MP mobilization did not affect the contamination of the Tisza River sediments, as their MP content decreased by 18% and 49%, compared to 2021. In 2022, the MP contamination decreased by 30–80% at all points of the Bodrog (G1: 800 items/kg, G2: 960 items/kg) and the Tisza River (No. 27: 120 items/kg; No. 28: 280 items/kg). In such a slightly contaminated environment, the tributary could have increased the MP pollution of the Tisza downstream of the confluence.
The Zagyva River’s low water discharge could effectively influence the Tisza River’s MP pollution only in 2020 (
Figure 7B). This year, the Zagyva River had intermediately polluted sediments (J2: 2780 items/kg) close to the confluence. Thus, they could increase the pollution of the Tisza downstream of the confluence. In the following years, the MP content decreased at all points, and the Zagyva River had no notable effect on the Tisza River. The Körös River (
Figure 7C) had a complementary sediment pattern to the Zagyva River. In the first year, the moderately polluted tributary did not increase the pollution of the Tisza River despite the greater discharge of the Körös River. In the last two years, the independence of the two rivers remained, as the MP pollution of the Körös River had no notable effect on the contamination of the Tisza River.
3.4. Artificially Impounded Water Bodies: Microplastic Sedimentation in Reservoirs
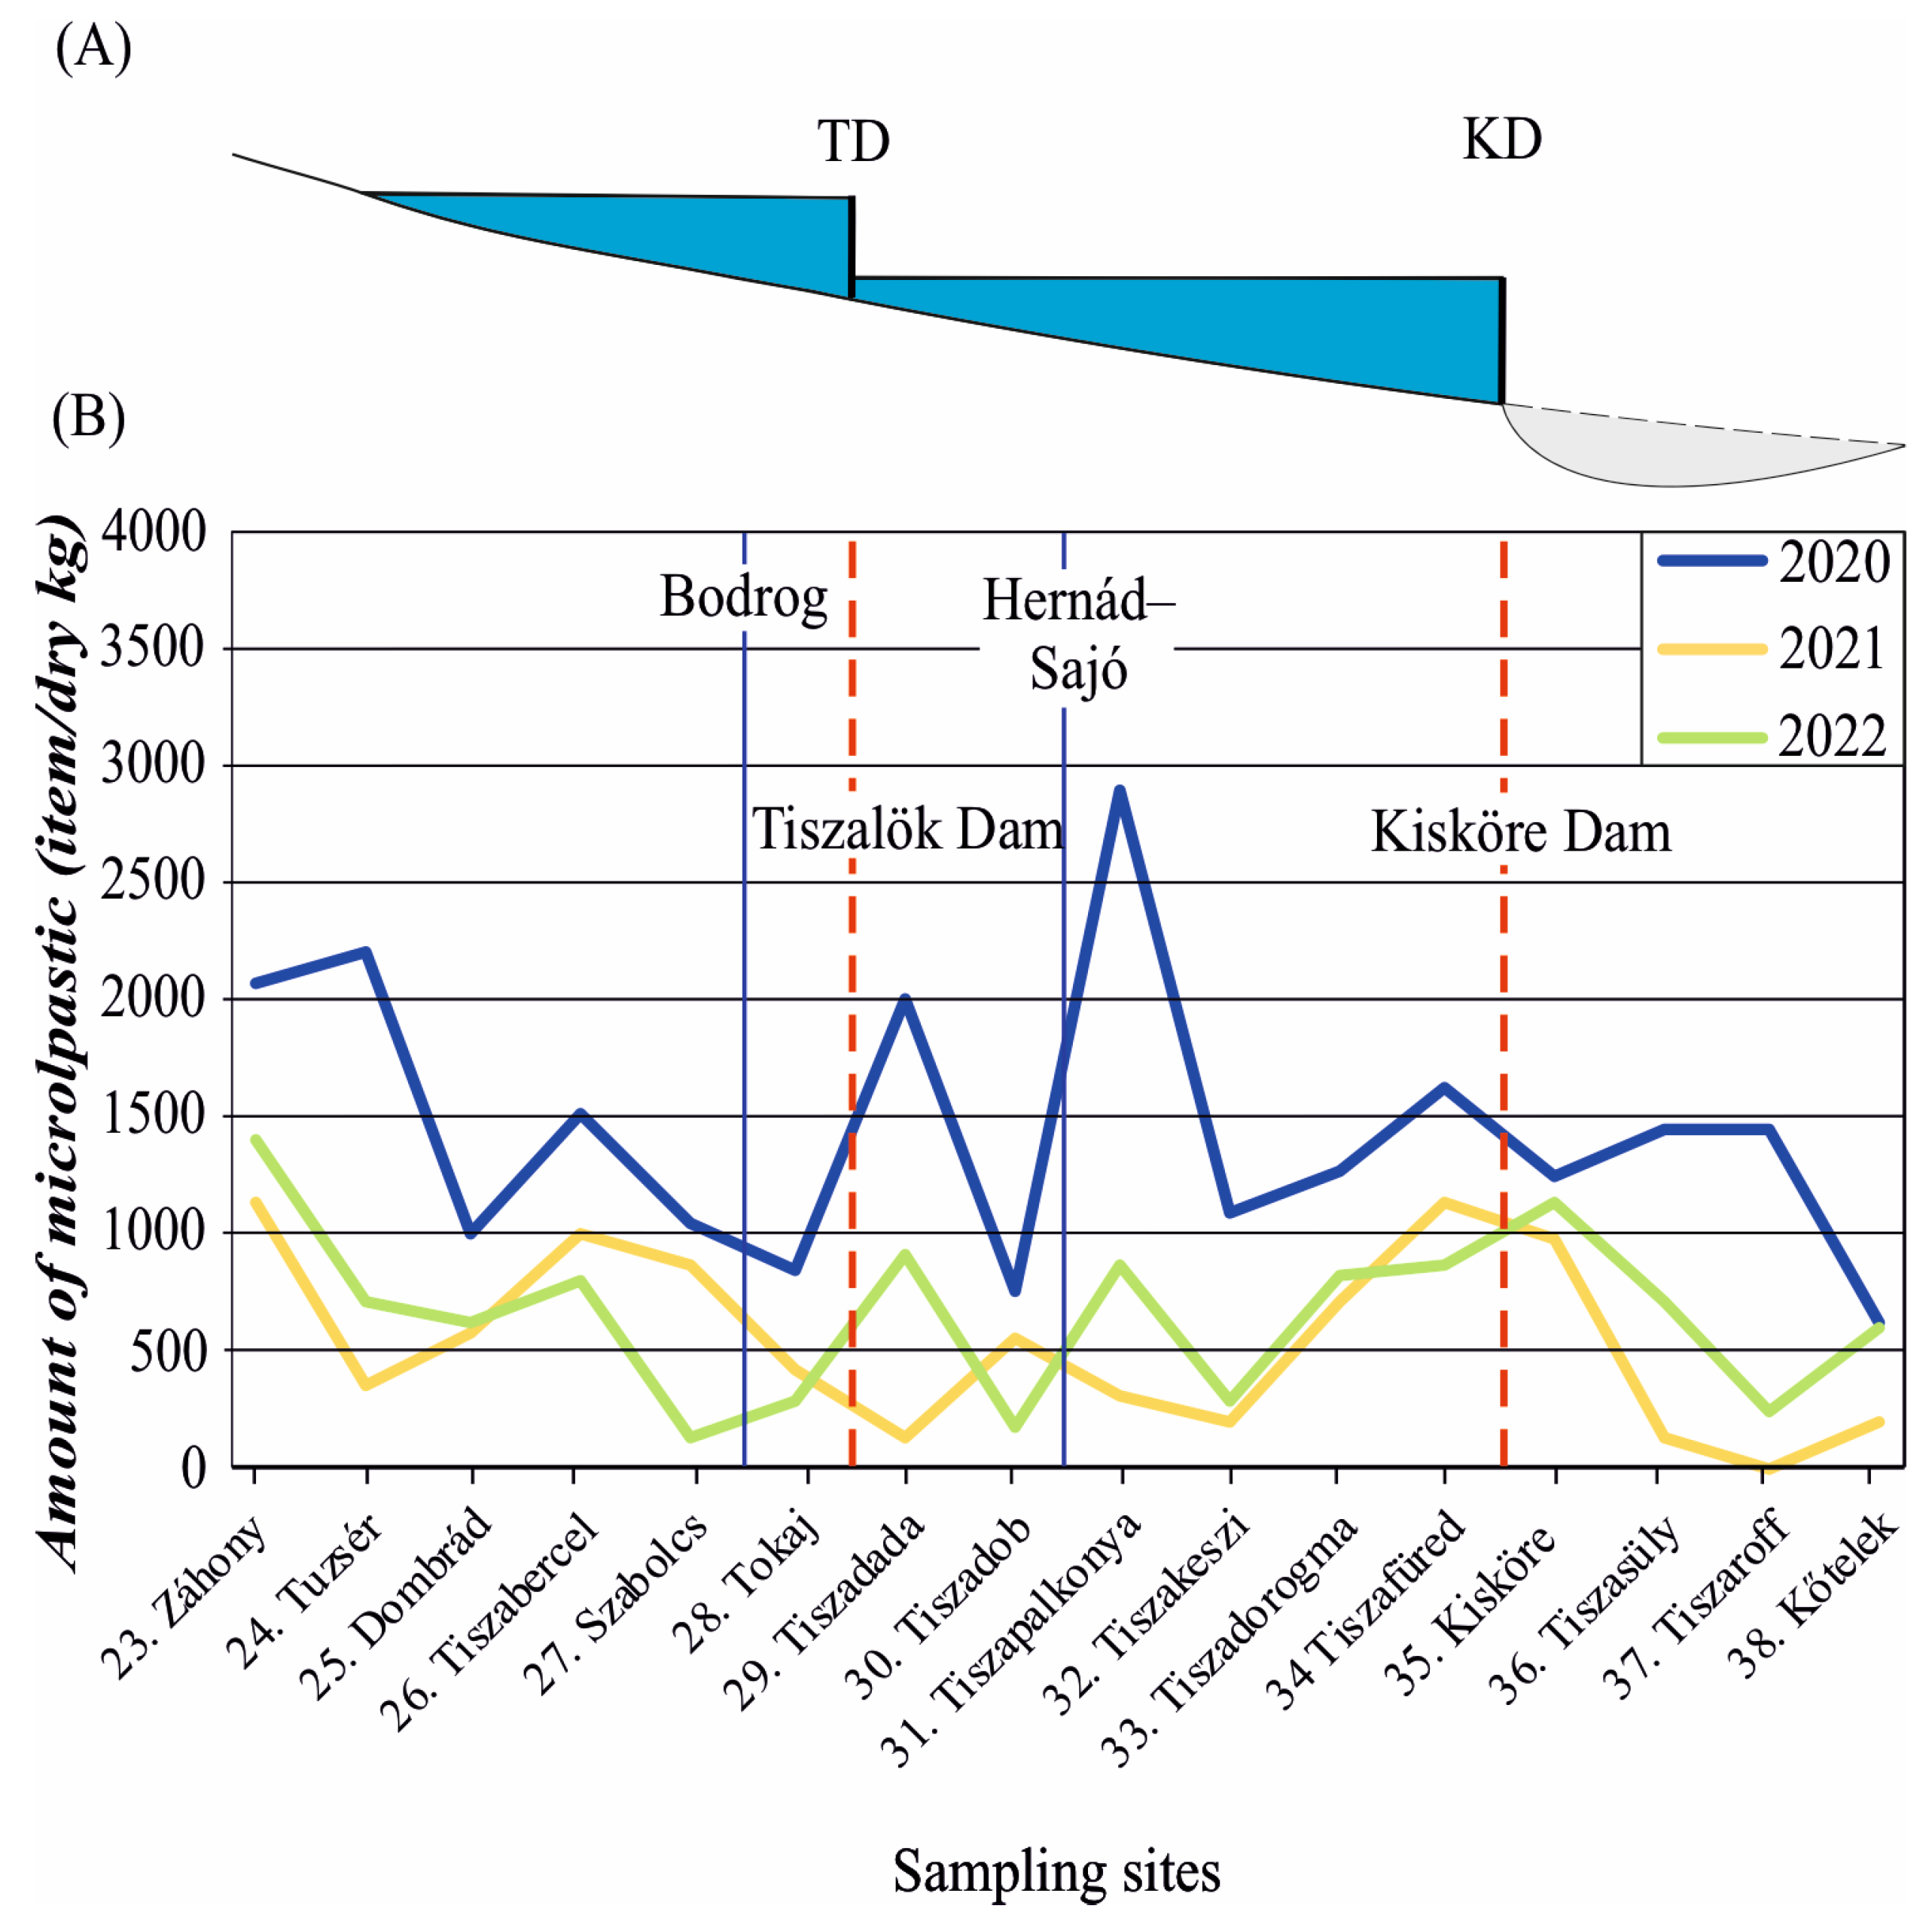
There are three reservoirs and dams on the Tisza River. The Kisköre Dam is located between the other two reservoirs in the Middle Tisza. It impounds the Tisza River until the uppermost dam at Tiszalök, along a ca. 114 km-long river section. In the upstream half of the reservoir, water is stored only in the channel, while in the downstream half of the reservoir, an artificial lake was created, which occupies a six-kilometer-wide floodplain section. The MP pollution pattern also reflects these differences (
Figure 8), as in the reservoir’s upper half, the MP amount strongly fluctuated each year (No. 29–31: 120–2880 items/kg).
The MP pollution of this section is highly influenced by the Sajó–Hernád river system, which usually transports contaminated sediments. The settlements along this Tisza River section have very limited wastewater treatment, as only 0–60% of the households are connected to the wastewater network (KSH, 2016). On the contrary, in the impounded lake, the MP content increased downstream each year along a 60 km long section. Thus, the MP content of the sediments increased by 50% in 2020 (No. 32–34), by 460% in 2021, and by 200% in 2022. Along the lake, there are no tributaries, and most of the households (≥80%) are connected to the wastewater network (KSH, 2016).
The Tiszalök and Novi Becej Dams have a common feature: they impound water only in the channel, and there is no water retention on the floodplain. The impoundment of the Tiszalök Dam affects a 110 km long section (sites No. 24–28) (
Figure 8). In the downstream half of the impounded section (at sites No. 26–28), the high MP pollution levels gradually decreased downstream each year by 55% in 2020, 58% in 2021 and 65% in 2022. Thus, in the downstream ca. along a 50 km-long section, a reverse downstream MP pollution pattern was observed behind the Kisköre Dam.
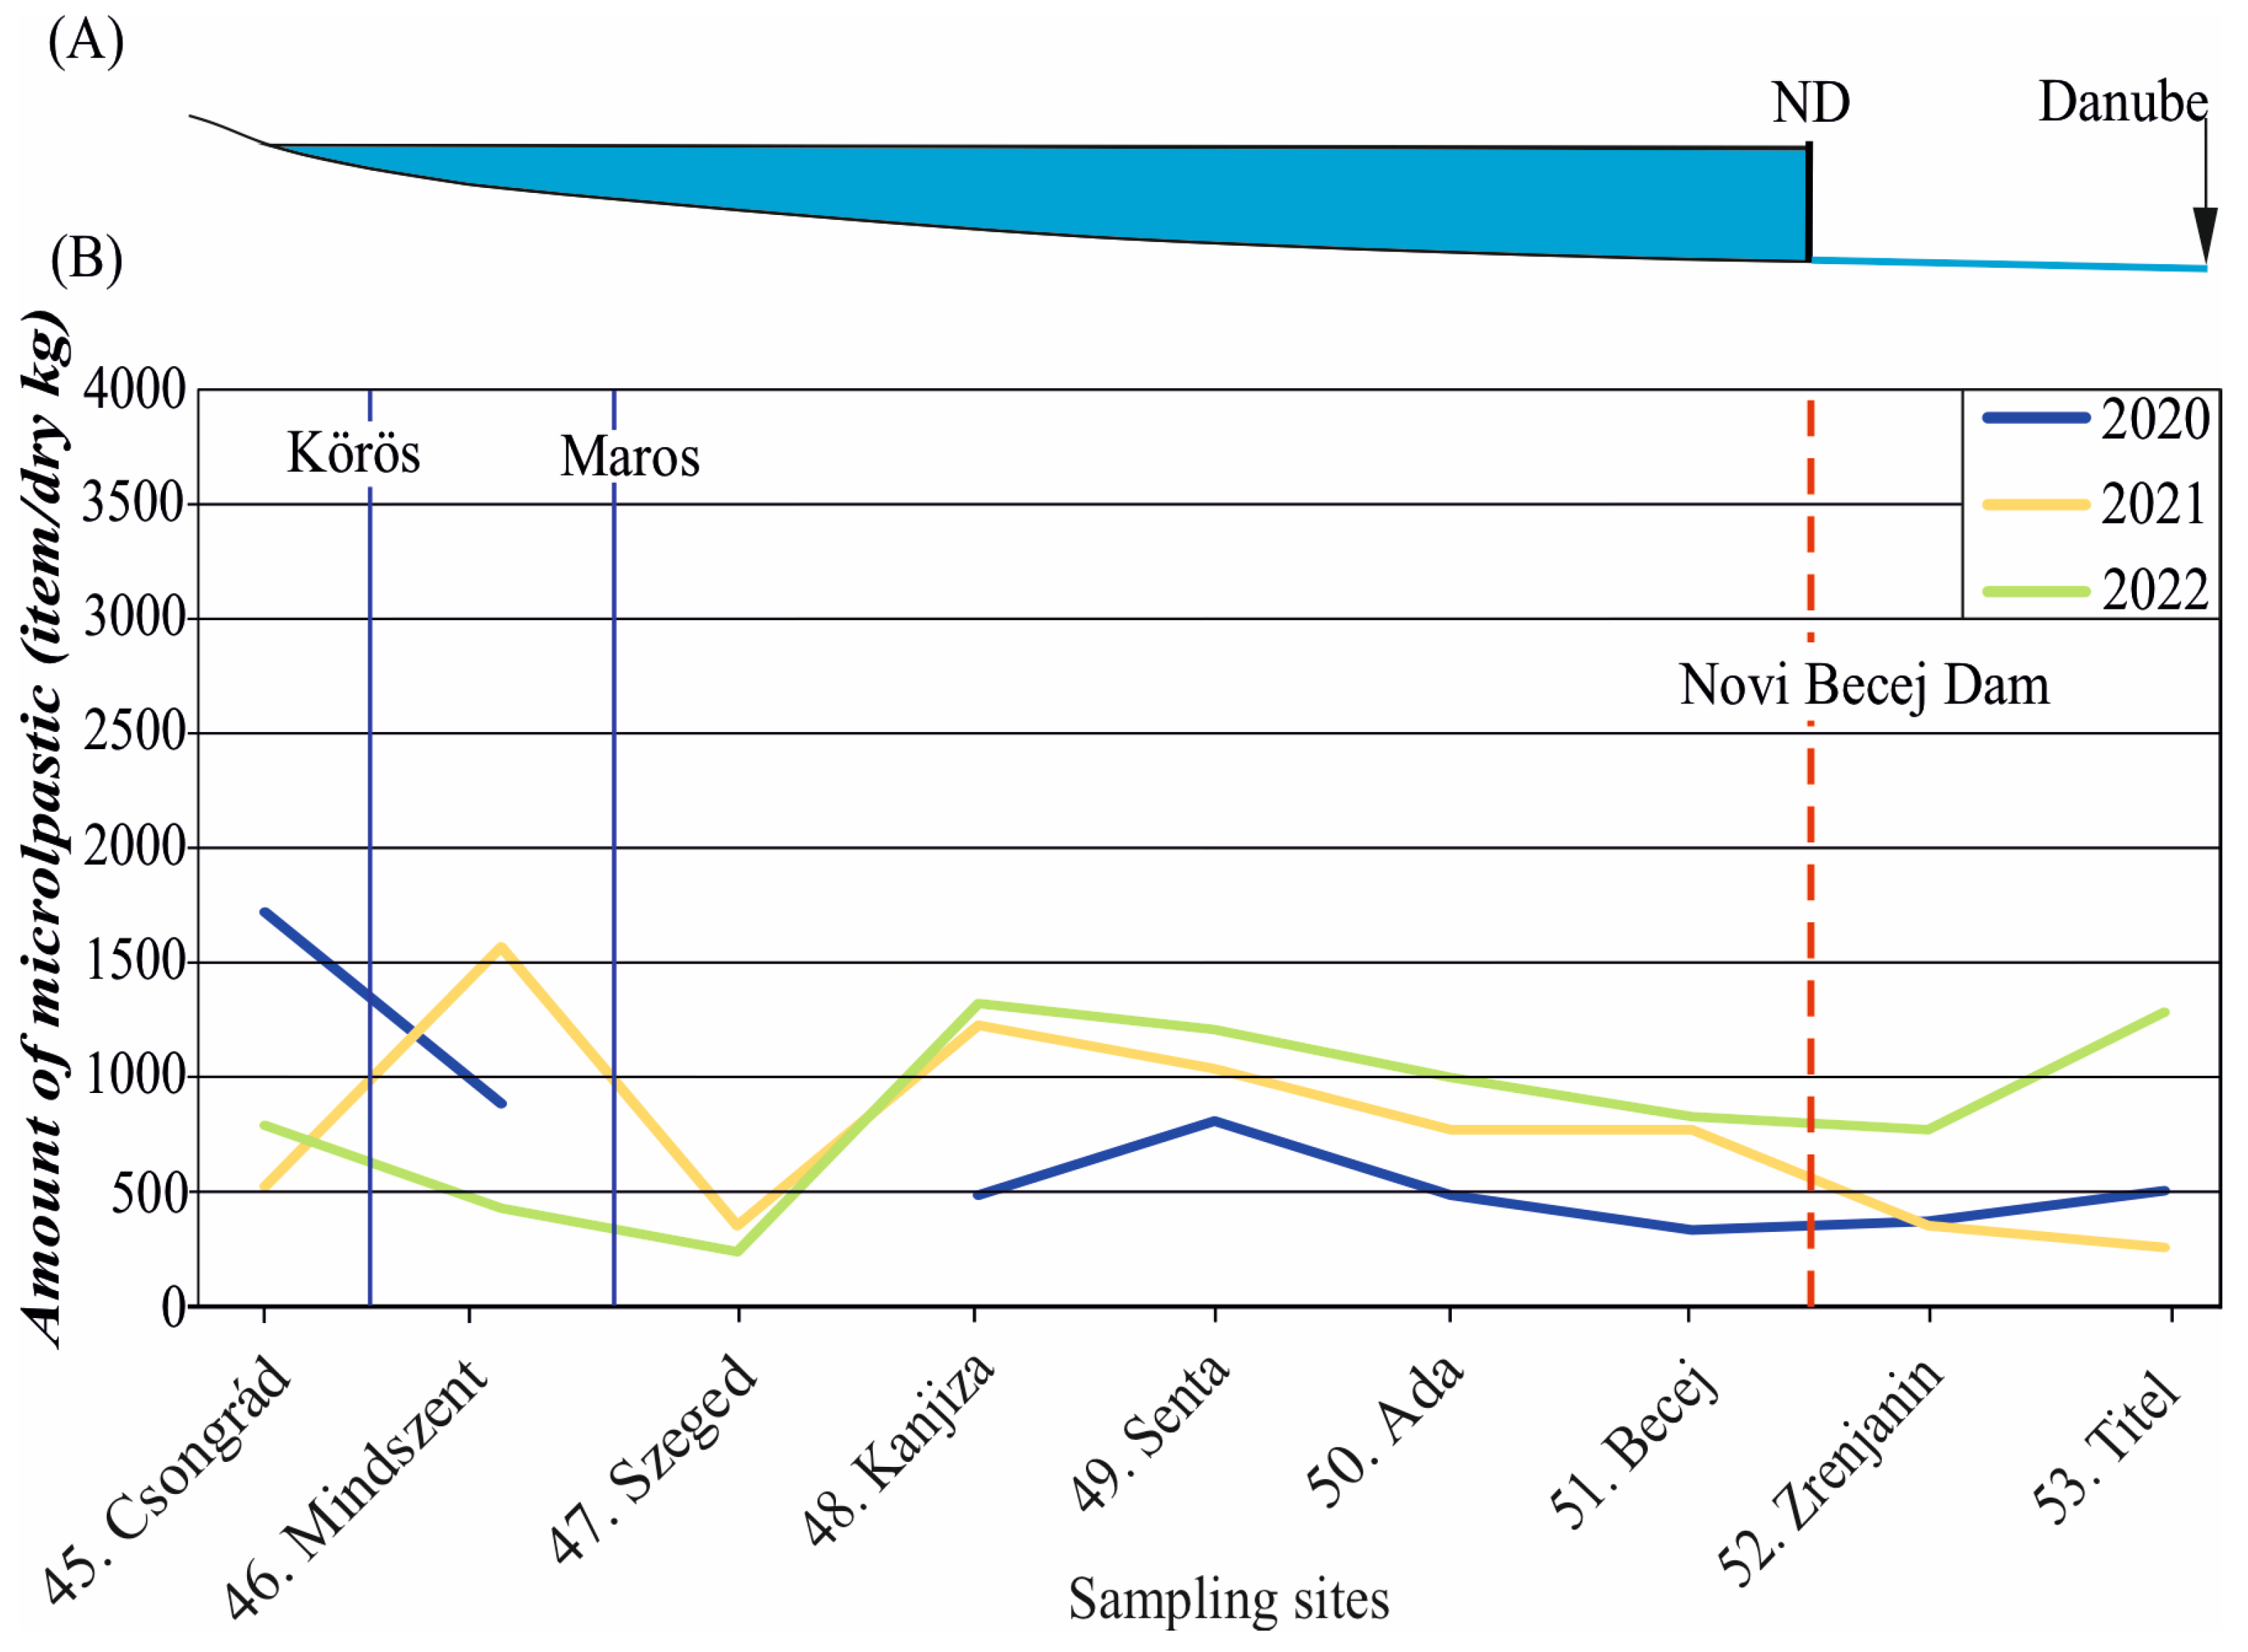
The Novi Becej Dam has the longest in-channel impoundment along a ca. 200 km-long section (No. 44–51). A similar spatial trend was observed at the Tiszalök Dam. In the upper part of the impounded section, the inflowing Körös and Maros Rivers significantly influenced the Tisza River’s MP pollution (
Figure 9), as they were moderately-to-strongly polluted. However, in the downstream half of the impoundment (along ca. 100 km), the MP content of clayey samples gradually decreased (No. 48–51) in all three years (2020: −33%; 2021: −70%; 2022: −40%).
3.5. Effects of Clear-Water Erosion below Dams on the Microplastic Content of Sediments
The effect of clear-water erosion on the MP content of the sediments can only be studied downstream of the Kisköre Dam, where the lack of impoundment creates favorable conditions for in-channel erosion. The MP content of the clayey sediments downstream of the Kisköre Dam decreases gradually, as between sites No. 36 and 38, the MP pollution decreased by 50% in 2020, 80% in 2021 and 47% in 2022.
3.6. Microplastic Pollution of Different In-Channel Forms
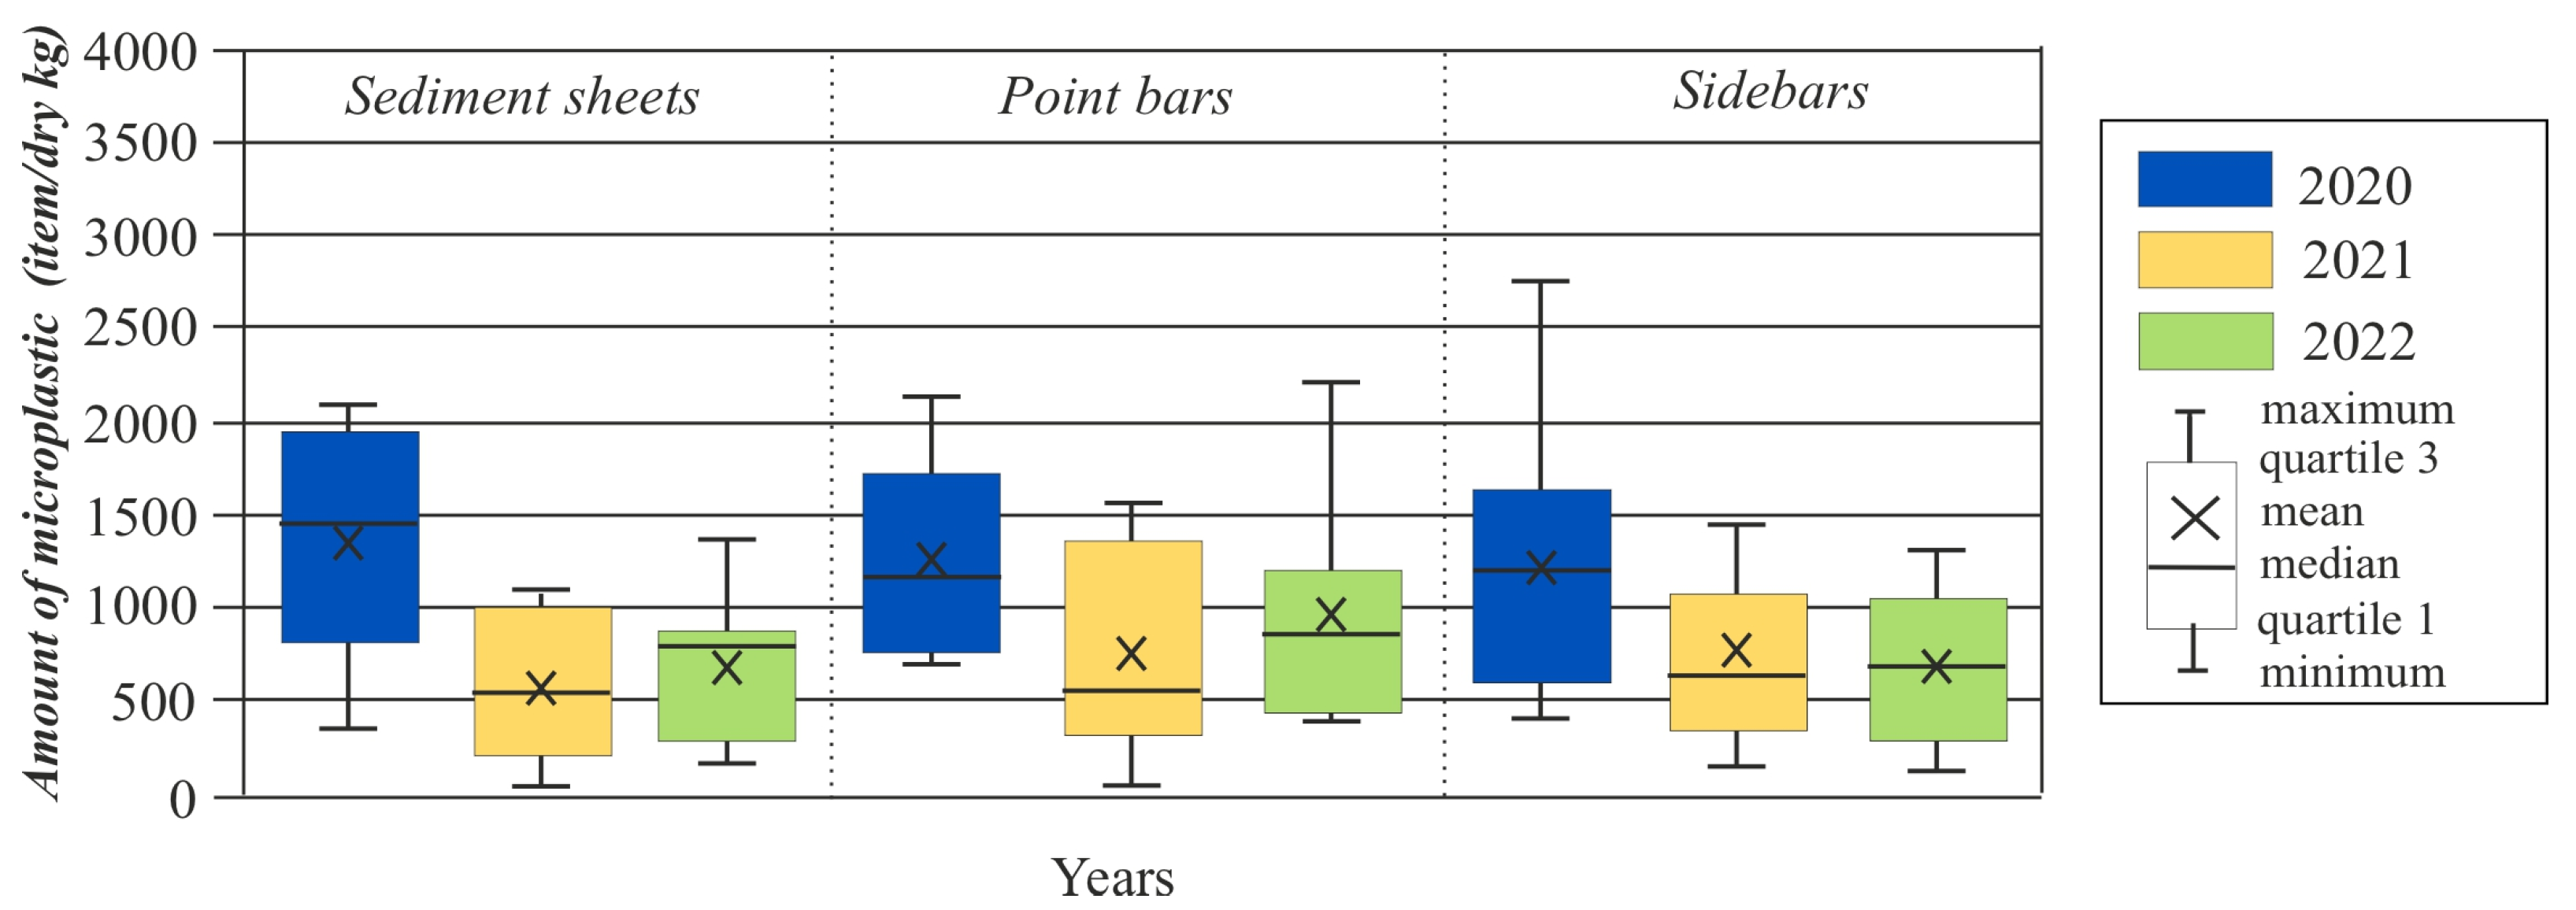
The geomorphological background of a sampling site could fundamentally influence the MP pollution of the deposited sediments, as the flow conditions have a major influence on the deposition. Side bars were found along the entire Tisza River (S1–S5), sediment sheets appeared in the S2–S5 sections and point bars were only in sections S2–S4.
In each year, side bars were the most contaminated forms (
Figure 10,
Table 2). Compared to the side bars, the sediment sheets accumulated 5–21% fewer MPs, while the point bars had 20–24% less pollution. However, the temporal changes in the MP pollution of the forms showed similar patterns since they were the least contaminated in 2021.
MP pollution hotspots (≥2000 items/kg) have developed in all forms (
Table 2). The most frequent hotspots were on side bars each year. On the contrary, sediment sheets became hotspots less frequently, and point bars became hotspots just occasionally. On the other hand, the proportion of sites with slight contamination (≤999 items/kg) was similar for each form in each year.
The dynamism of MP trapping and then depletion in each form is well illustrated by MP data from successive years, as the MP content changed by −50% to +200%. The most variable were the sediment sheets, as six of them had significant changes in MP content (42% of the forms), while this occurred in three sites (7% of the forms) for side bars and in two sites (15% of the forms) for point bars. Between the surveys, the same in-channel forms may have been trapped or emptied similarly, but a completely different pattern may have occurred in the following year. For example, on one of the point bars (No. 18), in 2020, the contamination was 800 items/kg; later, it doubled and increased by 43% by the third year. On the other hand, another point bar (No. 20) had the highest pollution in the first year (2216 items/kg), then it decreased by 65% in 2021, and a further 27% decrease was measured in 2022. The rate of emptying also varied significantly, as there were hotspots which almost totally emptied (e.g., H1 in 2020: 3440 items/kg; in 2021: 320 items/kg), while others changed to a lesser degree.
4. Discussion
4.1. Comparison of Microplastic Pollution in the Tisza River to Other Rivers
Clayey sediment samples were collected along the 744 km-long reach of the Tisza River on three sampling campaigns between 2020 and 2022 (
Table 1). The mean MP concentration decreased by 39% over the three years, though a slight increase (+5%) was observed in 2022. Comparing these results with similar measurements [
8,
25,
32,
33], it could be concluded that the Tisza River and its tributaries are among the most polluted rivers, despite the significant decrease in mean pollution in 2021. In comparison, the sediments of the Thames (UK) contained considerably lower amounts of MPs, as it had 660 items/kg [
32] and 165 items/kg [
33], while the sediments of the St. Lawrence River (Canada) contained 832 ± 150 MP items/kg [
8]. The contamination of Tisza River’s sediments is similar to the MP contamination of Asian rivers. For example, the MP pollution of the Chinese Xiangjiang River varied between 270 and 866 items/kg [
34], and the Wei River contained 360–1320 items/kg [
15]. The MP contamination of the Brahmaputra River (531–3485 items/kg) and Indus River (525–1752 items/kg) [
25] was very similar to that of the Tisza River. Unfortunately, most of these studies did not provide hydrological data of the analyzed rivers, so a hydrology-based comparison could not be performed.
It is important to note that the sediments of the tributaries had a higher MP content (by 1.5–2.6 times) than the Tisza River each year. Thus, tributaries are important conveyors of MP pollution. Similar results were obtained by Wang et al. [
17] and Horton et al. [
32]. In the fluvial system of the Tisza River, the Ukrainian Shopurka (A) was the least polluted river. In contrast, the Szamos–Kraszna Rivers (E–F), the Sajó River (I) and Maros River (L) were almost continuously highly polluted. As the dominance of fibers (≥92%) can be attributed to their wastewater origin [
17], the high MP pollution of some tributaries suggests that some sub-catchments have better wastewater management or a smaller population. However, the MP pollution in tributaries varied significantly in space and time, suggesting that they contribute to MP pollution of the main river in pulses, i.e., they collect large amounts of MPs from the sub-catchments, and then they effectively transport the MPs, and the MPs are occasionally discharged into the main river. This is supported by the significantly variable pollution in a tributary.
4.2. Longitudinal Changes in the Microplastic Content and Its Hydrological Background
Compared to previous studies, a much longer section (744 km) was studied with a high sampling density (every 30 km on average) within this study, so the longitudinal changes in MP pollution could be analyzed in detail. The comparison of the results of the three years reflects that MP pollution levels and the spatial trend of their changes were different in each year. In 2020, the MP pollution peaked in the S3 section, and the downstream section was the least polluted (S5). In contrast, in 2021, the MP gradually declined from the most polluted S1 section, reaching the least polluted S4 section, before increasing again in the S5 section. In the third year, the S2 section became the most polluted, and the least polluted was again the S4 section. These continuously changing spatial MP pollution patterns reflect that the MP pollution is continuously re-mobilized; thus, some sections were emptied and acted as sources, while others had intensive aggradation and acted as sinks. This spatiotemporal redistribution could explain the contradictory results on longitudinal MP variations [
21,
35,
36,
37] and highlight the importance of repeated measurements.
There is significant spatiotemporal variation in MP pollution between the sections and the sampling sites. Thus, the number of locations of pollution hotspots varied year after year, as some were emptied, while others became more polluted. Although there has been a general clearing of the whole water system over the studied years, the number of hotspots did not reflect this process, as in 2020 they appeared at 14 sites and in 2021 only at two sites, but in the last year, their number (seven) increased again. The temporally stable hotspots suggest that the source of MP pollution (e.g., sewage outlet, contaminated tributary) is close; thus, it could maintain a high MP pollution level. In addition, points where the MP pollution was slight throughout the three years suggest that there was no permanent pollutant source near the point, and the flow conditions did not support MP deposition.
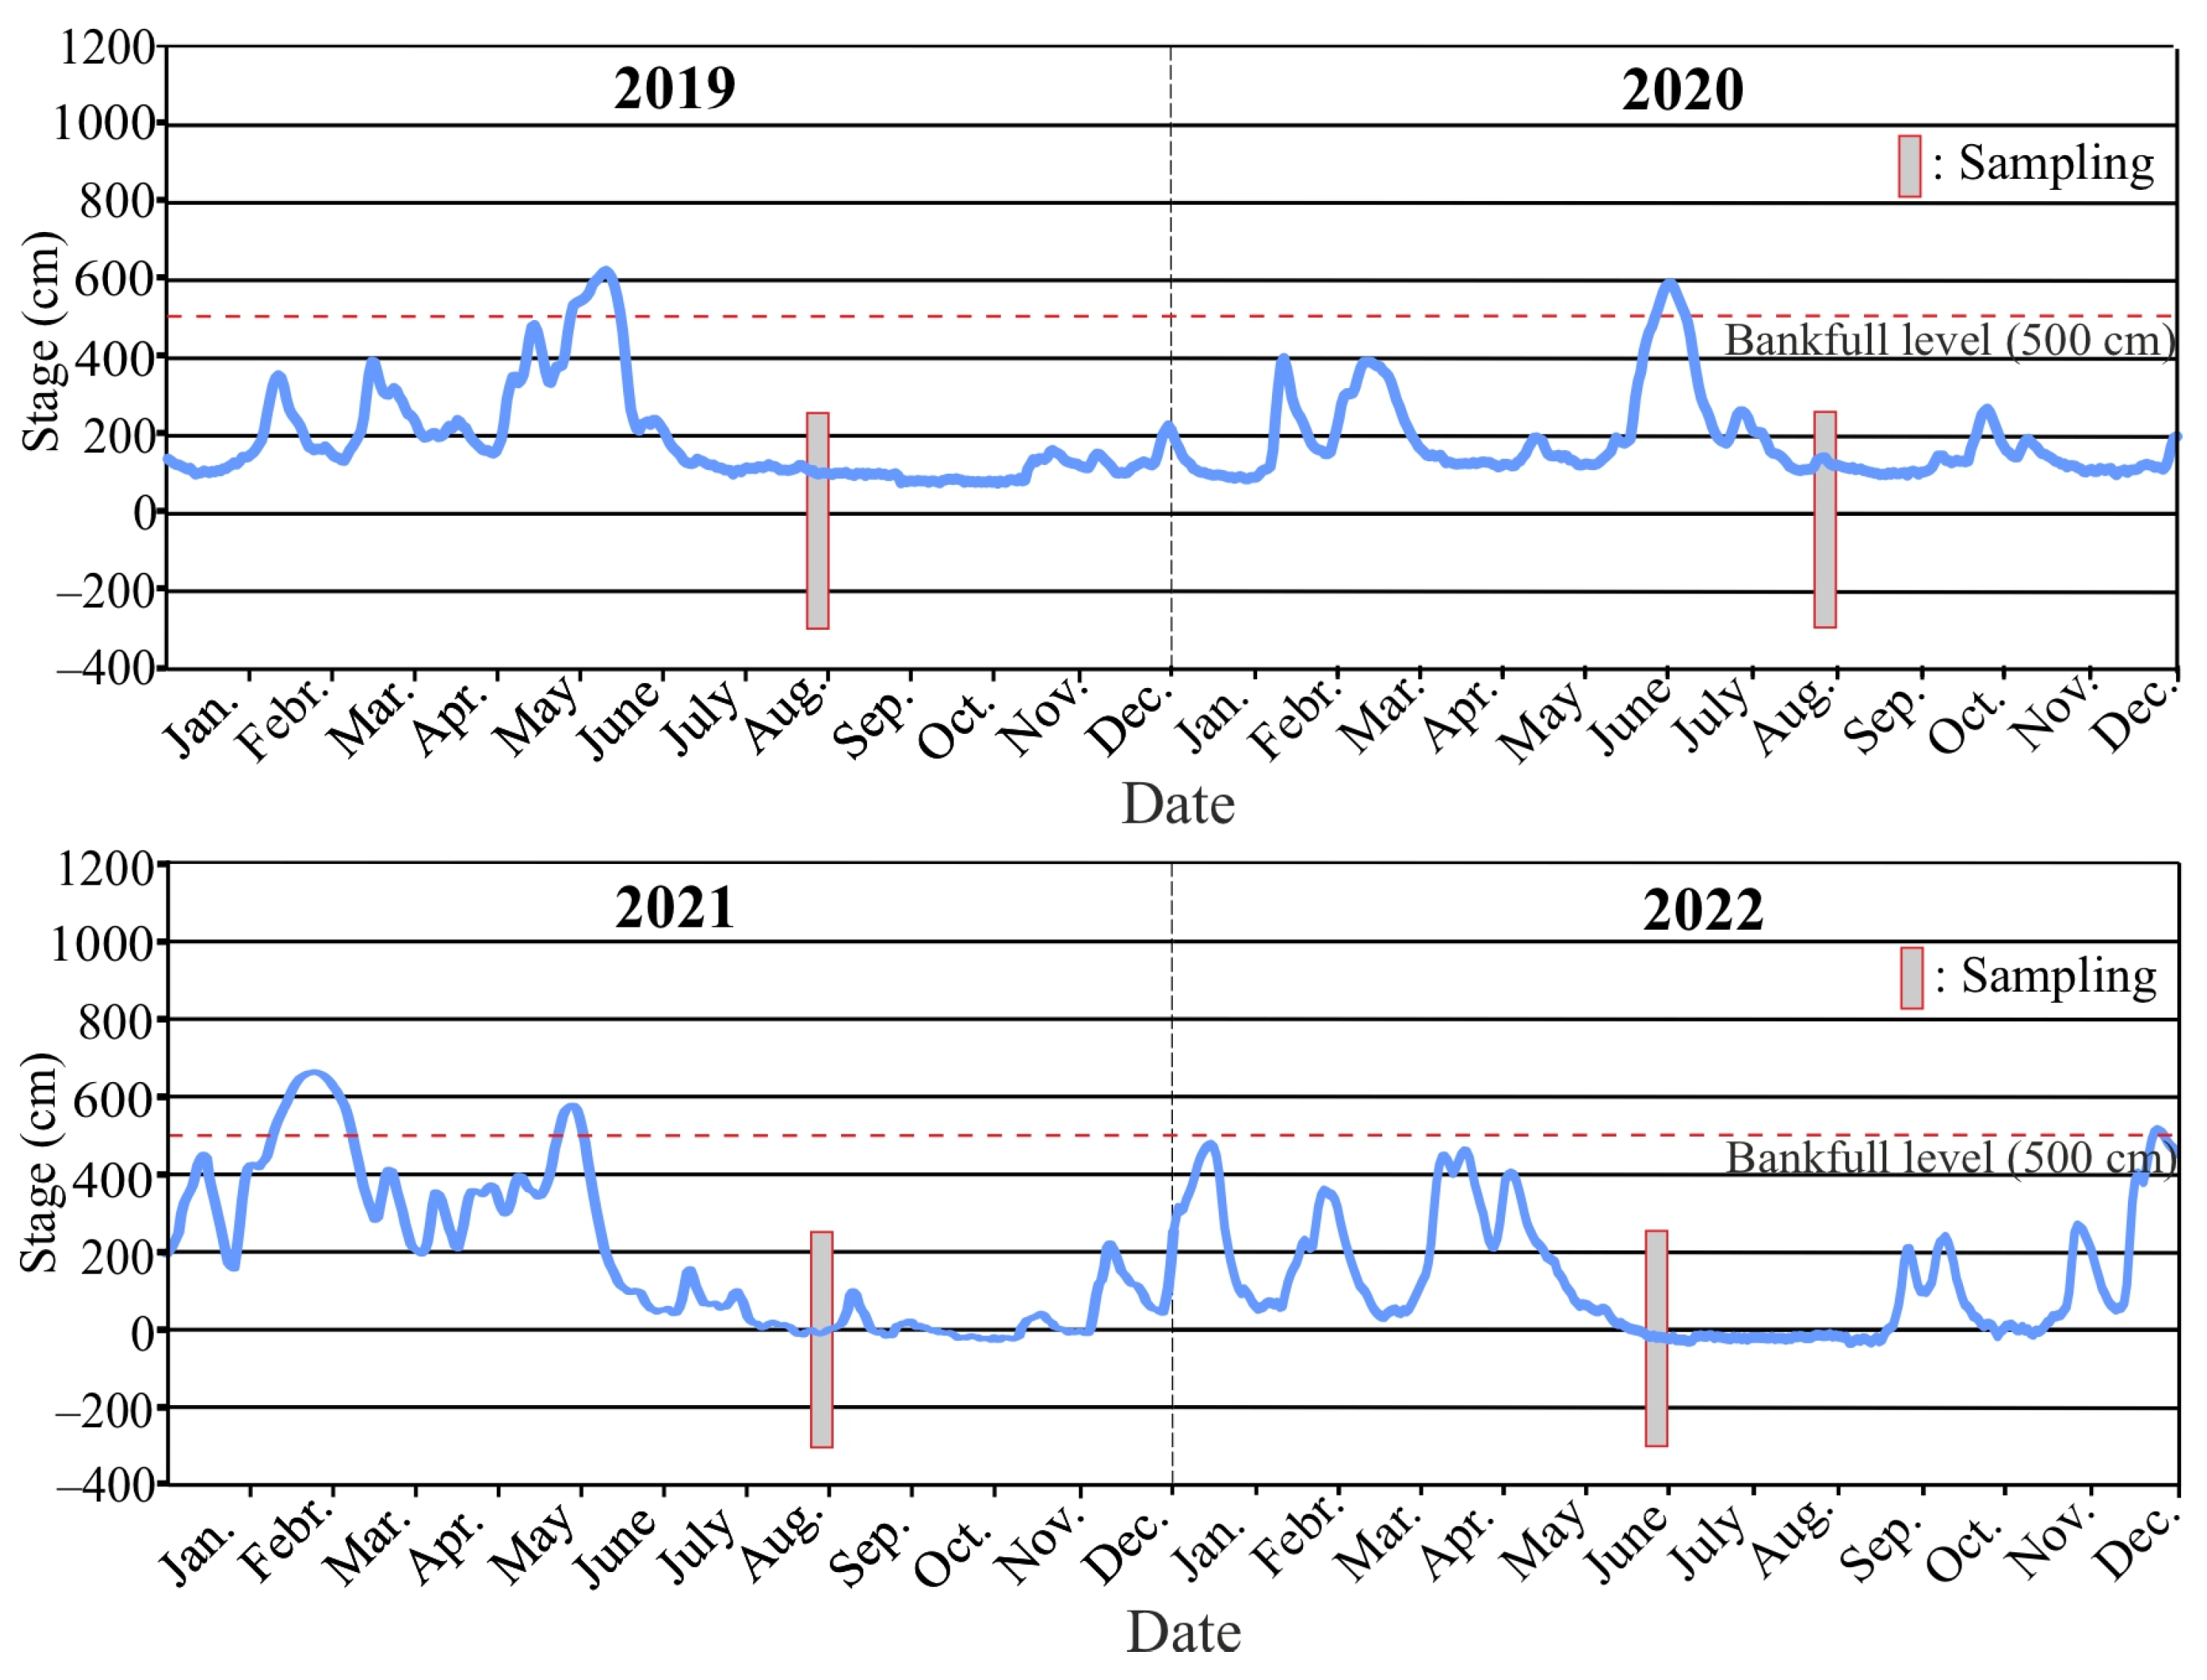
The gradual redistribution of MPs is driven by flood waves, which can effectively mobilize MP sinks. The largest mobilization and emptying were detected between 2020 and 2021 when higher stages and higher and longer flood waves could successfully mobilize and transport the already deposited sediments and their MP content away from the fluvial system of the Tisza River. In the last year, smaller floods appeared, so they could only redistribute the MPs in the fluvial system: the MPs entered the tributaries but have not yet reached the main river. The deposition and remobilization of MP particles are highly influenced by flow velocity [
5,
13], and the role of bankfull flood waves is very important [
7], as they are the most efficient mobilizers of the previously deposited sediments and MPs due to high specific stream power.
4.3. Microplastic Dynamics in Confluence Areas
Tributaries are important conveyors of MPs; thus, our results support the ideas of Ding et al. [
15] and Wen et al. [
34]. A tributary can affect the MP pollution of the main river in two ways: (1) if the sediment of a tributary is MP-free, the tributary can have a cleaning effect on the main river through its excess discharge, or (2) if the tributary is polluted, it can further pollute the main river [
14,
17].
Most of the tributaries of the Tisza River carry a significant number of MPs. However, the degree of their influence on the main river is not straightforward. There is no significant relationship between the mean water discharge ratio of the main river and the tributary and the influence of the tributary on the MP pollution of the downstream sampling point. For example, the slightly to intermediately contaminated Szamos River contributes to 36% of the discharge of the Tisza River. Nevertheless, it was able to triple or double the MP content of the Tisza River in just the first two years, and it had no effect in the last year. At the same time, the intermediately to heavily contaminated Kraszna River discharges only 1.5% of the Tisza River ‘s discharge; thus, despite its high pollution, it increased the Tisza River’s MP content (by 125%) in 2022, while in the other two years, it had no measurable effect on the Tisza River.
These contradictory results highlight the need for the further investigation of confluence areas. More detailed sampling is probably needed (1) to reveal the transport characteristics of the MPs originating from tributaries, (2) to understand the movement of the sediment pulses which contain MPs and (3) analyze the mixing of waters with a different MP content downstream of the confluences.
At the same time, the main river could impound the tributary [
34] depending on the slope conditions, which could highly influence the deposition–mobilization processes of MPs. Therefore, very often, the sediments of a tributary close to a confluence had higher MP levels.
4.4. Microplastic Dynamism Upstream and Downstream of Dams
In reservoirs, the flow velocity significantly decreases, promoting sediment deposition, whereas downstream of dams, “clean-water erosion” (vertical or horizontal erosion) of the channel is typical [
38,
39]. Within the presented study, we aimed to analyze the effect of these processes on the MP content of sediments.
The three dams on the Tisza River resulted in different reservoir types. The uppermost and the lowest dams (at Tiszalök and Novi Becej) impound the Tisza River to the bankfull level (in-channel reservoir). However, the reservoir behind the Kisköre Dam is different, as in its upstream half, the impounded water reaches the bankfull level, but in its downstream part, the impounded water inundates the floodplain, creating a shallow and wide lake. Therefore, the sediment dynamics of the reservoirs are different, especially because during flood waves, the floodgates are open so that the sediment can be mobilized from the in-channel reservoirs [
40,
41], but the deposited sediments in the floodplain lake cannot be redistributed. This hydrological difference explains the pollution patterns in the downstream part of the impounded water bodies. The MP contamination gradually decreases toward the dam in the reservoirs of the Tiszalök and Novi Becej dams, whereas the MP pollution increases in the lake of the Kisköre Dam. Thus, during flood waves, the MPs and natural sediments could be effectively mobilized from the channel at ca. 50–100 km upstream of the dams and flushed away when the floodgates are opened. The closer a point is to a dam, the more intensive the sediment and MP mobilization.
In contrast, the sediments cannot be mobilized in the lake behind the Kisköre Dam. Because the lake has limited flow velocity, more sediment is deposited in the lake’s upper part, and the sedimentation rate decreases downstream [
38]. Therefore, in the lake, higher MP content was measured in the area of intensive aggradation and a gradual decrease in MP pollution was detected along the lake. This was also supported by measurements of MP concentrations in the reservoirs’ water [
22,
42].
Downstream of the Kisköre Dam, the impact of clear-water erosion on the MP content of sediments could be studied. As the transported sediments are deposited in the reservoir, it causes a sediment deficit below the dam, which, combined with the increased stream power of the river, leads to sediment production via vertical or horizontal erosion of the channel [
38,
41]. The effect of in-channel erosion is well reflected by the gradual decrease in MP content (−50 to −75%) along a ca. 35 km-long section downstream of the dam. It could be explained by the appearance of MP pristine material eroding from the riverbed due to the clear-water erosion. As this material is thousands of years old, the pristine clayey material is mixed into the MP-polluted sediment. Thus, a decreasing spatial pattern in MP pollution evolves.
4.5. Different Microplastic Trapping Efficiency of Various In-Channel Forms
In the riverine environment, various accumulation forms develop influenced by flow and sediment transport conditions. In addition, not all in-channel forms occur along the entire river due to spatial variations in influencing factors [
39]. Thus, during MP sampling, the sampled form type should be considered, as the forms might affect the number of deposited MPs.
Side bars were the most contaminated of the forms in the three years, and pollution hotspots occurred most frequently on them. However, the MP pollution of sediment sheets showed the greatest variability. The different MP sink–source dynamism of the forms could be explained by the hydro-morphological conditions of their formation. The sediment sheets are usually deposited on the channel slope of straight sections; thus, the sediment is deposited during the falling limb of flood waves when the flow velocity drops. However, during the falling stages, the MP contamination reduces [
7]; thus, they contain fewer MPs. Their significant MP sink–source dynamics could be explained by the mobilization of their material during a flood wave due to the proximity of the thalweg.
In contrast, side bars and point bars are permanent forms, and these forms receive sediment and MPs during flood waves and low or medium stages when the MP transport is moderate [
7]. Side bars develop along sections with lower sinuosity; thus, the thalweg is closer to them than for point bars. This explains the higher MP content of the side bars. The observed MP dynamics on the forms are also supported by the research of Li et al. [
4], who investigated MP pollution under different hydrological conditions and found that the amount of MP pollution depends on the flow conditions, water level and discharge, as MP particles could travel great distances with increasing water velocity.
4.6. Methodological Considerations and Suggestions to Enhance Monitoring Strategies
The presented monitoring study was carried out over three successive years. It demonstrated that the MP content of the clayey sediment samples can vary significantly in subsequent years at section and site scale, reflecting continuous spatial and temporal rearrangement of MPs. Therefore, a single, snapshot-like study could not give a precise picture of the MP contamination of a river. Thus, it is recommended to study MP dynamism over longer periods under various hydrological conditions to identify continuous or temporal MP sources and sinks.
Tributaries, reservoirs, clear-water erosion downstream of dams and the sampling point’s morphology strongly influence the number of MPs in sediments and their dynamics. Thus, if a study aims to investigate longitudinal changes in MP over a long river section, it is recommended to collect samples from the same geomorphological form, which appears all along the river. In addition, the influence of tributaries and reservoirs on the spatial distribution of MPs should be investigated using dense spatial and temporal measurements since the MPs are probably mobilized and transported in pulses. In addition, due to the different hydrological conditions (e.g., slope, flow rate) of the two joining rivers, the mixing of their waters and the impoundment should also be considered.
Based on our present and previous results [
14,
21,
22], during monitoring, it is highly advised to (1) collect clayey samples rather than coarser-grained ones, as in this way, the MP dependency on grain size could be eliminated; (2) repeat the measurements in space and time to identify continuous hotspots and evaluate remobilization; (3) reveal the sources of the pollution, (4) collect samples from the main tributaries to understand their MP conveyor function; (5) select sites with similar in-channel morphology; and (6) carefully analyze the MP deposition of areas where the slope of the river changes (e.g., mountains vs. lowlands, reservoirs, downstream of dams).
5. Conclusions
The number of MP studies on the riverine environment is increasing, but most provide just a snapshot of MP pollution. However, continuous monitoring would be essential, as MP pollution varies temporally and spatially. Thus, well-planned monitoring could reveal the dynamics of MP transport, deposition, mobilization and the development of MP sources and sinks. Therefore, it is advised to reveal the hydro-morphological background of MP pollution, as it fundamentally affects the MP spatial and temporal dynamics.
The performed research in the Tisza River’s water system (Central Europe) is a good example of long-term (three-year) monitoring along a ca. 750 km-long reach. The study proved the high spatial and temporal variations of MP pollution and analyzed its various influencing factors. Flood waves can effectively rearrange the MP pollution along a river and could support the emptying of former pollution hotspots and the development of new ones. Floods with high specific stream power (e.g., bankfull floods) play a very important role in this rearrangement [
32], but the event sequence is probably important too, as in case of several, subsequent flood waves the first one is the most effective [
7,
31]. Therefore, during the planning of the sampling, it is advised to carefully study the hydrological characteristics of a river. Our sampling was performed on three different accumulation channel forms. It proved that these forms trap MPs with different efficiency, and collecting sediments from different forms could even influence the downstream trends in MP pollution. Thus, it is suggested to select a form which is common all along the river and perform the sampling of its freshly deposited, fine-grained sediments. Along the river, any natural (e.g., tributaries, rapids and pools) or artificial structure (e.g., reservoirs, dams and grading structures) which influences the water and sediment discharge conditions of the main river must be considered during the sampling, as it could fundamentally influence the MP pollution of a site. It also must be emphasized that a fluvial system should be considered a whole unit because the spatiality of the elements (e.g., MP sources, tributaries, reservoirs, hotspots) influences the cause–effect relationships and reveals the processes at individual sites.


