1. Introduction
The socio-economic development of coastal areas depends strongly on the availability of water resources, especially groundwater [
1]. Indeed, Mediterranean coastal aquifers constitute important reservoirs widely used for domestic, agricultural, industrial, and tourist purposes [
2]. However, degradation of water quality, climate variability, and population growth are limiting the availability of water in these regions [
3,
4,
5,
6,
7]. This leads to an increase in the exploitation of groundwater resources. The increasing demand for groundwater in arid and semi-arid areas will put pressure on already deficient aquifers. Thus, marine intrusion will likely become more problematic due to the extensive coastline where the majority of the population resides [
8,
9,
10]. Additionally, climate change scenarios for the Mediterranean region suggest an intensification of these issues in coastal systems due to decreasing freshwater recharge, sea level rise, and increasing water demand for irrigation [
11]. Identifying the processes that influence the fluctuations in groundwater levels and the freshwater/saltwater interface constitutes an ongoing issue in coastal aquifer research. These processes depend on aquifer stratigraphy and other hydrodynamic factors [
12].
Proper management of groundwater resources represents a critical challenge and a key component of sustainability and future society, especially in arid and semi-arid climates. The management of this resource requires a thorough understanding of the groundwater system along its natural hydrogeological boundaries [
13]. An essential step in achieving a coherent and realistic picture of aquifer system behavior is the development of a hydrogeological conceptual model, which serves as the primary foundation for any numerical modeling study [
14,
15,
16] and as a guide for prospective assessments of groundwater contamination [
17].
This paper contributes to the establishment of a better insight into the hydrogeology of the Grombalia basin with the development of a conceptual hydrogeological model for its aquifer system. The Grombalia aquifer system occupies a crucial position as the primary aquifer in the Cap Bon region. It functions as a pivotal water reservoir catering to numerous indispensable sectors. It stands as a vital lifeline for several towns and areas, such as Grombalia, Soliman, Bou Argoub, Beni Khaled, and Menzel Bou Zelfa. The water sourced from this aquifer system serves a dual purpose: it not only meets the demand for potable water but also bolsters the industrial and agricultural sectors that are the foundational pillars of the local economy. The Grombalia aquifer has been the subject of a range of studies in recent years [
18,
19,
20,
21,
22,
23,
24,
25,
26,
27,
28]. Nevertheless, the majority of these investigations have predominantly focused on a restricted area of the aquifer system, with a specific emphasis on assessing groundwater quality. As a consequence, this narrower scope has led to a somewhat constrained understanding of the complex dynamics that define the behavior of the aquifer system. The development of aquifer conceptualizations has received scant attention in the existing literature, and guidance in this regard is likewise scarce. Notably, the most recent effort to extend and compartmentalize the aquifer levels of the Grombalia basin was conducted by Ennabli in 1980 [
29]. The complex interplay among hydrogeological features and the issue of saline groundwater confronting the Grombalia aquifer emphasize the need for a deeper understanding of this groundwater system. The urgent challenges posed by the overexploitation of groundwater resources and the puzzling dynamics governing its hydrodynamics further amplify the intricate complexity inherent in this aquifer system. Given this context, this study sets out to investigate the hydrogeological characteristics and dynamic behavior of the Grombalia aquifer system. To achieve this objective, a comprehensive and integrated methodological approach is used. This approach encompasses various geological, hydrogeological, hydrodynamic, and hydrochemical investigations and an in-depth assessment of the groundwater flow system. With the meticulous amalgamation of these investigations, a holistic 3D hydrogeological conceptual model is developed within its complete natural extent, effectively capturing the complex interactions inherent in the aquifer system. In order to attain a comprehensive grasp of the intricacies inherent to the groundwater system and to successfully construct the hydrogeological conceptual model, it is necessary to delineate the domain, determine the hydrogeological boundaries and initial conditions, and identify the potential for any hydraulic connection with deposited aquifers on either side of the aquifer system [
30].
Moreover, considering the lens of sustainability, an extended observation period is essential to accurately assess changes. Hence, this paper offers a detailed exposition of the hydrogeological peculiarities of the Grombalia basin. This comprehensive study introduces fresh insights into hydrostratigraphy, hydrodynamics, groundwater reserves, renewability, and the spatial–temporal variations in groundwater levels.
2. Study Area
The Grombalia basin (GB) is located in the northeast of Tunisia within the Nabeul governorate, which corresponds geographically to the Cap Bon peninsula (
Figure 1). The basin ranges from latitude 40G 53′00″ to 40G 80′00″ and from longitude 9G 00′00″ to 9G 30′00″, with an area of approximately 585 km
2. It is bordered by the Haloufa and Darbouka mountains to the west and the Gulf of Tunis to the north. The eastern limit coincides with the plain of Takelsa and Abderrahmane Mt in the northeast and the plain of the eastern coast in the southeast. In the south, it is bordered by the Hammamet plain.
The GB is characterized by a monotonous and slightly hilly topography (
Figure 1). The basin has an altitude that ranges from 0 to 368 m a.s.l., with an average of 76 m a.s.l.; the average slope is about 1.57%. It presents a gutter shape with very low curvature, straightened toward the mountainous piedmonts, i.e., Abderrahmane Mt, Reba El Ain Mt, Darbouka Mt, Haloufa Mt, and Korbous Mt.
The climate in the Grombalia basin is semi-arid, typically Mediterranean, with irregular rainfall events. Based on climatic data collected from the Tunisian National Meteorological Institute (INM) for the Nabeul meteorological station, the study region experienced an average annual precipitation of approximately 415 mm/year and an average annual temperature of around 20.3 °C during the period of 2005–2019. October is the month with the highest amount of rainfall, reaching 72.5 mm, whereas July is the driest month, receiving only 3.1 mm of rainfall. The rainy season extends from September to April. The real evapotranspiration estimated using the water balance method [
31] is around 366.43 mm/year, mobilizing 88.26% of precipitation, resulting in a significant water deficit in the region.
The GB has a well-developed hydrographic network composed of three watersheds. The Wadi El Bey and Wadi Bezikh watersheds have a complex network of tributaries, while the Wadi Said watershed is unique as it is an endorheic basin. This means that this watershed is entirely infiltrated during its trajectory.
A significant portion of the study area, approximately 77.5%, is used for agricultural activities (
Figure 2). The GB is known for its dynamic agricultural sector, mainly focused on citrus fruits, vineyards, cereal crops, and vegetables. Urban areas encompass about 13.7% of the basin’s surface, with approximately 45 km
2 concentrated along the coastal region. In terms of industry, there is notable growth in the industrial sector within the communes of Soliman and Grombalia, particularly in the agri-food sector and medium-sized enterprises (SMEs), which are actively operating and contributing to the local economy.
These diverse activities heavily rely on abundant water resources. The aquifer system of Grombalia has consistently served as a vital water source for the region, playing a crucial role in meeting the water demands for agricultural, urban, and industrial activities. Since the 1950s, overexploitation of the aquifer has caused a decline in groundwater levels and degradation of water quality. Artificial recharge techniques from dam reservoirs, well injection, and infiltration basin sites, i.e., El Amrine, El Gobba 1, El Gobba 2, Sidi Alaya, Bou Afif, and Bou Argoub (
Figure 1), have been practiced in areas, showing a lowering in groundwater levels in order to restore the quality and quantity of groundwater and to prevent the advancement of the salt front [
32]. Nevertheless, the artificial recharge operation using the infiltration basins has been interrupted since 2011 due to the succession of drought years and damage to these basins. The main issue that hampers the efficiency of these artificial recharge basins is the occurrence of soil clogging during the infiltration process [
33]. This is particularly problematic when the infiltrating water carries a significant amount of suspended matter. Furthermore, to relieve the pressure on the resources of the Grombalia aquifer and meet the agricultural demand in the region, since 1984, the Ministry of Agriculture has transferred water from the northwestern part of Tunisia, i.e., Medjerda basin and Ichkeul basin, to the northeastern part of the country. The transferred water often exhibits a lower quality, with total dissolved solids (TDS) levels typically less than 1.5 g/L [
34].
3. Materials and Methods
To gain deeper insight into the aquifer system in the study area and to form the basis for the construction of the hydrogeological conceptual model, the following methodology was used (
Figure 3). The first phase consisted of synthesizing numerous previous studies and cartographic documents that cover the GB and its surroundings. In order to define the configuration and extension in depth of the aquifer formations as well as their geometry, detailed cartography of the stratigraphic series was utilized. This entailed the assembly of geological maps, including the 1:50,000 scale maps of Grombalia, Nabeul, Menzel Bouzelfa, La Goulette, Bouficha, and Hammamet, provided by the National Office of Mines (ONM). Prior to discussing the functioning of different components in the system, their dynamics, and the relationships between them, as well as the aquifer system boundaries, it was crucial to carry out hydrogeological cross-sections. Relevant technical data were sourced from two principal institutions: the Regional Commissariat for Agricultural Development (CRDA) of Nabeul and the General Department of Water Resources (DGRE) of Tunis. This involved compiling approximately 100 lithological sequences extracted from strategically positioned hydraulic and petroleum drillings spanning the study area. These sequences encompassed detailed lithological descriptions alongside essential hydrogeological parameters. Indeed, a detailed geological reconstruction was essential for shaping both the cross-sections and the hydrogeological conceptual model. This necessitated an exhaustive examination of all available lithological sequences within the Grombalia basin, combined with incorporating outcomes from geophysical investigations to identify tectonic faults precisely [
35,
36]. Concurrently, a total of 30 available pumping tests were analyzed using OUAIP (Outil d’Aide à l’Interprétation des Pompages d’essais) software to evaluate the hydrodynamic characteristics of the Grombalia aquifer system. Indeed, these pumping tests with constant flow and long duration are used to determine the transmissivities (T) and the storage coefficient (S) using the semi-logarithmic method of Theis [
37].
The general behavior of the aquifer system and its quantitative status were described by analyzing piezometric records, exploitation histories, piezometric mapping, and estimations of aquifer system reserves. The estimation of effective infiltration was performed using two different methods: the water balance method of Thornthwaite and Mather [
31] and the water table fluctuation (WTF) method. The water balance concept is to assess direct recharge, which is the rainfall that escapes the soil moisture deficit and the effect of evapotranspiration and reaches the groundwater reservoir by direct vertical percolation through the unsaturated zone. To implement the water balance method, the first step involves calculating the potential evapotranspiration (
ETP, mm). This calculation requires several input parameters: the latitude of the study area (LAT) in decimal degrees and the mean monthly temperature (
Tm) in degrees Celsius. The potential evapotranspiration (
ETP) was determined using Equations (1)–(3) as follows:
where
k is the latitude-dependent correction factor;
I is the annual heat index; and a is a coefficient strictly proportional to
I. The water balance method further includes the parameter of actual evapotranspiration (
ETR), which represents the amount of water evaporated from the soil and transpired by plants under specific soil moisture conditions. This method utilizes the concept of readily usable water reserve (
RFU), which corresponds to the threshold level of soil moisture below which plants begin to wilt. The determination of
RFU was based on Equation (4) [
38]:
where
RU is the utile soil reserve, corresponding to the soil’s retention capacity, i.e., the volume of water the soil can absorb (mm/month), which depends on the texture of the soil. The concept of water balance involves assessing water availability and use based on the interaction between precipitation, evapotranspiration,
RFU, and surplus/deficit conditions. When the monthly precipitation (
P) is equal to or greater than the potential evapotranspiration (
ETP), the actual evapotranspiration (
ETR) is equal to
ETP. The remaining water quantity (
P-
ETR) will replenish the readily usable water reserve (
RFU) up to its maximum capacity. If the remaining water exceeds this capacity, it will result in excess (
WS), which can either infiltrate effectively toward the water table or contribute to runoff. When the monthly precipitation (
P) is less than the potential evapotranspiration (
ETP), the value of
ETR is equal to
P plus the current
RFU. This continues until the
ETR value matches the
ETP value. In cases where the
RFU is zero, there will be an agricultural deficit (
DA), calculated as the difference between
ETP and
ETR.
Runoff (
R) was calculated using the Tixéront–Berkaloff formula, an empirical equation (Equation (5)) that incorporates the rainfall and the potential evapotranspiration estimated using the Thornthwaite method [
39].
where
R is the runoff in mm;
P is the average annual precipitation in mm; and
ETP is the average annual potential evapotranspiration calculated using the Thornthwaite method in mm.
Finally, the effective infiltration (
Ieff) was determined using Equation (6).
where
R is the runoff in mm and
WS is the water surplus in mm. The inflow of this infiltration corresponds to the average annual recharge and is equivalent to renewable resources under natural conditions.
The WTF method operates under the assumption that rising groundwater levels in unconfined aquifers are a result of recharge water reaching the water table. The calculation for effective infiltration at each time step was conducted using the following formula [
40] in Equation (7):
where
Sy is the specific yield or drainable porosity of the unconfined aquifer,
h is the water table height, and
t denotes time.
The reserves of different aquifer levels were calculated using the method that estimates the volume of gravitational or releasable water stored in an aquifer horizon [
41]. The calculation requires knowledge of the hydrogeological structures and determination of the porosity or storage coefficient [
41]. These reserves consist of releasable reserves stored in the aquifer’s saturated zone and the average annual recharge under natural conditions. The releasable reserve
R stored in saturated zone, which is expressed in units of volume, was determined using the following formula:
where
me is the average effective porosity of the aquifer;
A is the surface area of the aquifer; and
e is the average thickness of the saturated zone.
Furthermore, monitoring chemical tracers in this system provides a necessary and complementary method to determine its overall functionality. It is especially important to test the relevance of natural tracers in such a complex aquifer system where interconnections between levels can result in difficult-to-decipher mixtures. Therefore, a total of 45 groundwater samples were collected from boreholes and wells in September 2021. For this investigation, sampling sites were selected based on their geographic distribution to ensure comprehensive coverage of the entire study area. The selection process was refined to include diverse lithological formations, which allowed for the representation of a range of hydrochemical types and distinct hydrogeological settings present in the Grombalia aquifer system. All samples were taken directly from their natural state and were untreated. Measurements and samples were collected at operational facility outlets whenever possible, ensuring borehole water column renewal. Water points were pumped to ensure renewal prior to each sampling, with two to three times the borehole water volume pumped. Non-conserved physico-chemical parameters (temperature, electrical conductivity, and pH) were in situ measured using a WTW 340 i/SET conductivity/pH meter. Samples were transported in a cooler with adequate cooling from the field to the lab, where refrigeration curtailed chemical evolution. Cation (Na
+, K
+, Ca
2+, and Mg
2+) analyses were carried out using atomic absorption spectrometry (AAS). The quantification of chlorides and alkalinity was conducted with titration using Mohr’s method. The sulfates were analyzed using the gravimeter method. This dosage primarily relies on the precipitation of sulfate ions as barium sulfate using barium chloride, along with concentrated hydrochloric acid. The ionic balance for major samples was found to be within ±5%, and an acceptable tolerance of up to 10% is allowed [
42].
The conceptual model in this study is intrinsically three-dimensional, requiring precise delineation of aquifer boundaries on all sides. It is visualized using maps and cross-sections, illustrating complex spatial dynamics. The results of previous investigations are brought together in thematic maps covering key factors such as geology, land use, piezometry, transmissivity, permeability, and water quality, enabling a more holistic understanding of hydrogeological interactions. The top layer of the 3D model uses a digital elevation model (DEM) derived from Shuttle Radar Topography Mission (SRTM) data with a resolution of 30 × 30 m. All steps are meticulously executed using specialized tools provided by Global Mapper and Corel software. By taking advantage of the capabilities of these software platforms, we are able to simulate and visualize how the various components of the aquifer system interact with each other in space.
4. Results and Discussion
4.1. Aquifer Geometry and Boundaries Identified Using Geological and Hydraulic Data Interpretation
The GB assumes a remarkable geological prominence. Its strategic position at a significant junction unveils a captivating intersection where the north–south axis seamlessly converges with the Zaghouan Major Fault, extending its influence into the vast expanse of the eastern platform. This unique geological configuration imparts the GB with exceptional geological character, making it a focal point for geological research and exploration. The different stratigraphic units of the GB and its surroundings show a succession of geological series from the Triassic to the Quaternary with the absence of Jurassic features (
Figure 4).
The primary deposits consist of Quaternary layers that exhibit a considerable variation in depth, ranging from 10 to 430 m, with an average thickness of approximately 220 m. These layers include extensive terraces of lagoon–marine, marine, and continental origins [
43,
44]. Among them, the continental Quaternary is the most recent, followed by marine and lagoon–marine Quaternary layers [
43]. In the western part of the basin, these deposits are juxtaposed with Cretaceous, Eocene, Oligocene, and Miocene anticlines, while in the oriental part, they are juxtaposed with the exposed Miocene series. In the center of the plain, the Quaternary deposits cover the Mio–Pliocene deposits. The boundary between these deposits is defined by the Borj Cedria and Hammamet normal faults. The Quaternary of marine origin is essentially constituted by poorly consolidated conglomerates with dark gray sands. These sediments bear the imprint of past marine environments, reflecting the influence of ancient coastal processes and depositional mechanisms in this particular region. The continental Quaternary manifests as a complex assemblage of clayey sands and sandy clays. Within this continental Quaternary stratum, variations in sediment composition and texture occur, resulting in a heterogeneous sequence of deposits. The interplay among depositional factors such as fluvial activity, aeolian processes, and weathering influences contribute to the diverse nature of these continental sediments.
The other half of the Grombalia basin is occupied by the outcropping Miocene–Pliocene series. This series is comprised of lagoon–continental sediments, including the Oum Douil Group from the Middle to Upper Miocene–Pliocene age [
45,
46]. The formations of Mahmoud, Beglia, and Saouaf are an integral part of the Oum Douil group (
Figure 5). The Pliocene forms the uppermost layer, while the Mahmoud formation clays lie at the bottom of the Oum Douil group. The Oum Douil group exhibits significant heterogeneity both vertically and laterally within the GB. Its thickness ranges significantly across the region, with an average of approximately 1000 m. In the northern area, exemplified by the petroleum drilling “SOL–1”, the thickness is comparatively smaller, measuring around 227 m. However, in the graben portion, the thickness increases substantially, ranging from 600 m to a maximum of 3500 m at the center of the graben. Indeed, the collapse of the limestone bar of the Ain Grab formation, which underlies the Oum Douil group, extends to a depth of 4000 m in the center of the graben [
35]. This indicates the extent of subsidence at this level.
In the northern region, the Oum Douil group is primarily composed of sandy deposits with claystone. Notably, the sediments contain an abundance of shell and fossil fragments, while occasional gypsum stringers can also be observed. Additionally, pyrite is commonly associated with carbonaceous matter in this part of the group. In the southeastern part of the GB, specifically in the petroleum drilling “BEL–4”, located in the Nabeul hills, the Oum Douil group displays a thickness, reaching up to 946 m. This portion is characterized by predominantly sandy sediments, including sandstone, along with interbedded claystone and siltstone. Minor occurrences of limestone or dolomite, as well as sporadic coal deposits, are also observed. Pyrite is found in association with rare lignite occurrences within this region.
Structurally, the GB appears as an NW–SE graben with maximal subsidence up to 4000 m [
35]. This graben is bounded by two sub-vertical kilometric normal faults [
47,
48], to the east by the Hammamet fault of N160 direction [
48,
49] on which the Korbous monocline and the Abderrahmane anticline of the NE–SW direction collide. The western boundary of the graben is defined by an NW–SE fault running from Borj Cedria to the Gulf of Hammamet. This fault has been activated since the Cretaceous [
50,
51]. The opening of Grombalia graben occurred during the Oligocene [
48]. This opening continued during the Miocene and Plio–Quaternary, allowing the accumulation of a thick Mio–Plio–Quaternary sedimentary series [
35,
49].
The surrounding structures of the Grombalia graben are characterized by numerous permeable outcrops from the Cretaceous, Eocene, Oligocene, and Miocene periods. These outcrops are observed on both sides of the Borj Cedria and Hammamet faults. The presence and connectivity of these hydro-structures within the Grombalia graben hydro-system have remained a subject of mystery until the present day. Several other tectonic accidents have affected the GB, which may constitute the seat of various communications between the different aquifer levels or may function as a barrier preventing any hydrogeological continuity.
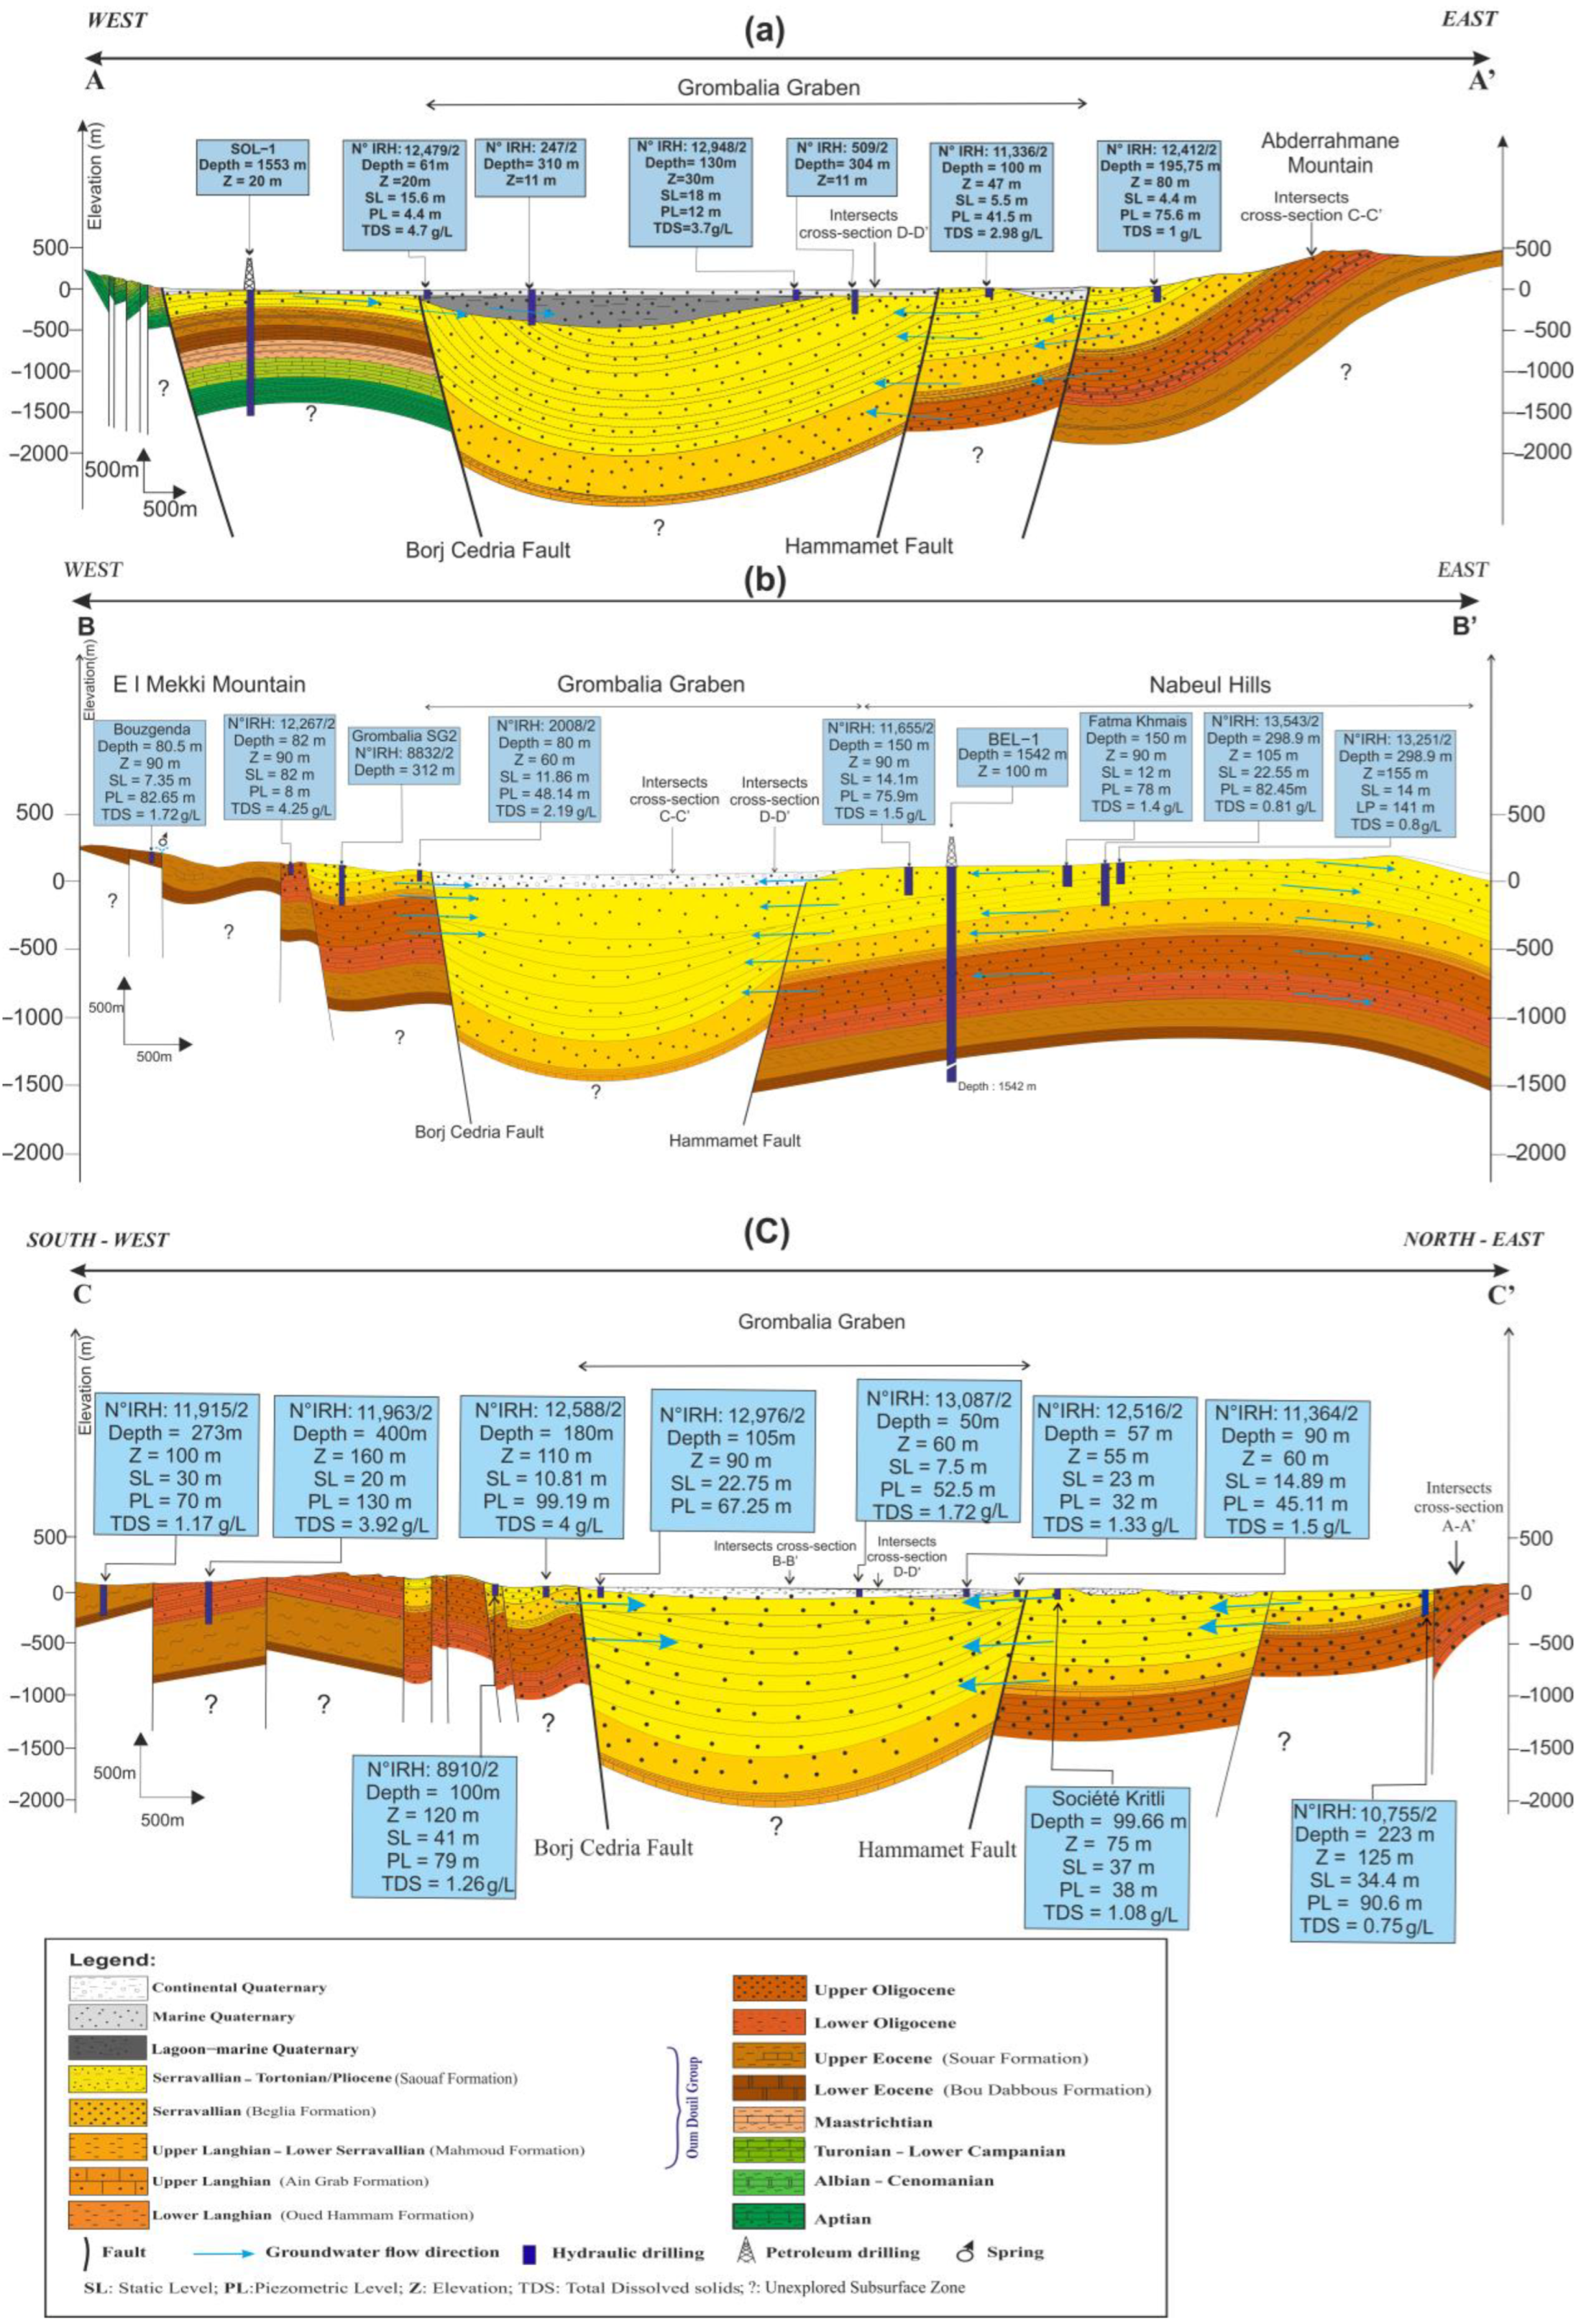
To provide an adequate response to these uncertainties, we resort to carrying out hydrogeological cross-sections (
Figure 6). Its analysis shows the role of these two faults of collapse in the arrangement of the aquifer formations. In fact, the Hammamet fault and Borj Cedria fault enabled three compartments to be individualized:
- –
The identification of a system of uplifted blocks to the northwest of the Borj Cedria fault formed by aquifer levels lodged in the Cretaceous limestone formations (
Figure 6a). The juxtaposition of permeable Miocene–Pliocene and Quaternary formations deposited in the Grombalia basin with the permeable Cretaceous formations indicates the importance of these formations in recharging the Grombalia aquifer system through rainwater infiltration in Cretaceous and lateral flow toward the Grombalia basin. Toward the southwestern flank, a complex structure appears, formed by a succession of horsts and grabens parallel to the Borj Cedria fault (
Figure 6b,c). This distinctive structure causes a discontinuity in the aquifer formations to the west of the Grombalia basin. Indeed, the limestones of the lower Eocene captured by the “Bouzgenda” borehole (
Figure 6b) are juxtaposed to the east by a normal fault to the marl deposits (Souar formation) of the Upper Eocene. The blockage of water flow in the Lower Eocene limestones is manifested by the emergence of a group of springs along the line of this fault (
Figure 6b). Thus, toward the southwestern side of the basin, these thick marls of the Souar formation play the role of an impermeable screen blocking any communication between the Cretaceous and Eocene aquifer levels deposited at the southwestern edges of the basin, with the aquifer system in the Grombalia basin.
- –
In the middle of the basin, a collapsed compartment is bounded by the previously mentioned faults. This graben is covered with an alternation of sand, sandstone, clay, conglomerates, and rivers alluvium of the Quaternary. Toward the northern part of the graben, this sequence exhibits increased thickness, with the potential to reach up to 430m (
Figure 6a). These Quaternary deposits overlie the Oum Douil group, which is mainly composed of Pliocene-age sandstone and sand, the alternations of sandstone and clay of Serravallian–Tortonian (Saouaf Formation), and the coarse sandstones of Serravallian (Beglia Formation). The lack of a real impermeable layer separating these different permeable levels creates a mixed and heterogeneous Mio–Plio–Quaternary aquifer (
Figure 6a–c). Throughout the basin, this aquifer system is perched on the clays of the Mahmoud Formation, which forms the base of the Oum Douil group [
45]. This formation acts as the fundamental bedrock of this aquifer system. This has been confirmed with the petroleum drillings, revealing a clay layer thickness exceeding 30 m in the “BEL–2” well in the southeast(
Figure 6b) and reaching 27 m in the “SOL–1” well located in the north (
Figure 6a).
- –
In the east of the Hammamet fault, a compartment is uplifted, where the Saouaf sandstones outcrop. The coarse sandstones of Beglia, the limestones of the upper Langhian (Ain Grab Formation), the glauconitic clays of the lower Langhian (Oued Hammam Formation), the upper Langhian–lower Serravallian (Mahmoud Formation), and the Oligocene sandstones (Fortuna Formation) are either outcropping or are surmounted by the Saouaf Formation, forming the anticlinal structure of Abderrahmane Mt to the north (
Figure 6a) and the Nabeul hills to the south (
Figure 6b). This eastern compartment highlights the contribution of the Miocene sandstone outcropping in the Abderrahmane anticline and Nabeul hills to the alimentation of the Mio–Plio–Quaternary aquifer located in the collapsed compartment, following their juxtaposition by the Hammamet fault. As well, the sandstone deposits of the Oligocene show a hydraulic continuity with the Miocene deposits. The layers exhibit an inclination ranging between 15 and 20° toward the southeast, causing all groundwater flows to converge toward the water table of the eastern coast (
Figure 6b). Additionally, adjacent to the basin on the northeastern side, the marl levels of the upper Eocene are juxtaposed with the various permeable levels of the Oligocene–Miocene (
Figure 6a). This hydrogeological configuration delineates the hydrogeological basin boundary of the eastern part.
Furthermore, the hydrogeological cross-section D–D′ (
Figure 7) provided a synthetic view of the geometry and arrangement of the different levels in the Grombalia aquifer in the collapsed compartment. According to this section, the Quaternary deposits exhibit a reduced thickness of about fifty meters, consisting of intercalations of sandy layers and clay, with a local presence of travertine and tuff on the top towards the south. Below the Quaternary, permeable Mio–Pliocene formations are found. This level consists of sandy and clay layers with a predominance of sandstone. To the south, the topography and the inclination of the layers lead to a hydrogeological flow direction toward the Hammamet plain hydrogeological basin. This hydrogeological arrangement defines the southern boundary of the Grombalia hydrogeological basin.
In the Hammamet plain to the south, the Quaternary and Mio–Pliocene deposits are separated by a clay layer of approximately 20 m, where the flowing artesian condition was observed, as shown in borehole 10,703/2. However, in the Grombalia graben, there is no real clayey barrier separating the quaternary deposits from the Mio–Pliocene deposits. Consequently, these aquifer levels are vertically interconnected, functioning as a unified multi-layered Mio–Plio–Quaternary aquifer throughout the graben area. This interconnection leads to a more unified behavior in the piezometric levels, suggesting that water flows freely between these aquifer levels. Consequently, the piezometric levels indicate the presence of only one main piezometric level across the basin. This means that groundwater levels in different parts of the basin are relatively similar, and changes in water levels are more or less synchronized.
4.2. Hydrodynamic Parameters
The values of the storage coefficient (S) according to the pumping test results indicate a very wide range from 3.1 × 10
−4 to 1 × 10
−1. This large variety reflects the reality that the Mio–Plio–Quaternary aquifer system is composed of several levels with varying levels of permeability and porosity. The storage coefficient values calculated in the Grombalia basin, considering the unconfined conditions, correspond closely to the effective porosity of the aquifer. Likewise, the transmissivity (T) values of the Mio–Plio–Quaternary aquifer deduced from the pumping test analysis vary over a wide range from 2.89 × 10
−6 to 1.5 × 10
−1 m
2/s. It is noteworthy that these estimates represent local transmissivity values around the wells, which are likely influenced by local conditions. These values provide partial representations of the total transmissivity of the aquifer. This is due to incomplete recovery of the entire aquifer by the majority of wells. N. Gaaloul et al. (2013) [
22] reported transmissivity values in the range of 9.4 × 10
−5–1.13 × 10
−1 m
2/s, which closely matches our results. Similar to transmissivity, the permeability (K) values are also heterogeneous, ranging from 1 × 10
−7 to 7.5 × 10
−3 m/s. These permeability values are relatively low. They are explained either by a thickness reduction in the permeable levels or by spatial heterogeneity and the lithological nature of the reservoir. The GB aquifer system is composed of sandy–sandstone levels intermixed with clayey levels, giving it a limited permeability.
There are no references in the literature that discuss spatial variability in the transmissivity and permeability in the GB. The present results (
Figure 8a) indicate clearly distinguishable local areas of highest transmissivities. The particular locations with high transmissivity are the center of the plain around the Bou Argoub region, the Menzel Bou Zelfa–Beni Khaled region, and the eastern part, and the locations with low transmissivity are near the urban area of Grombalia, the southern and western border, and the coastal fringe.
Geographically, the spatial evolution of permeability (
Figure 8b) tends to show practically the same areas of the highest values already mentioned in the transmissivity map (
Figure 8a). The estimated spatial distribution of transmissivity and permeability reflects the factors that influence its values. For example, the influence of lithology is present in the high estimates of T and K that coincide with the Miocene sandstone formations in the Nabeul hills, as well as the Quaternary sands covering the middle area of the basin. These geological formations, characterized by their porous nature, contribute to the enhanced hydraulic properties of the aquifer system in these regions. However, a correlation between hydrodynamic parameters and slope exists. This relationship originates not from direct T and K dependence on slope, but rather, it results from the erosion of consolidated rocks in the uplifted blocks, leaving more permeable unconsolidated deposits at the basin’s center through fluvial environments. Additionally, the maps showing the spatial distribution of transmissivity and permeability basically suggest that the lowest values are found along the zones that more or less correspond to the main traffic routes and along the most urbanized areas.
Both maps revealed the spatial evolution of hydrodynamic parameters T and K in the basin and offered new information regarding the location of suitable areas for future drilling, particularly in the Bou Argoub region, Menzel Bou Zelfa–Beni Khaled region, and the Nabeul hills.
4.3. Groundwater Level Conditions and Evolution
Groundwater flow paths in the GB recharge and discharge zones can be deduced from the potentiometric surface of the aquifer. The spatial–temporal behavior of the piezometry of the Mio–Plio–Quaternary aquifer system is determined based on several piezometers reporting the maximum possible data.
The highest piezometric heads were measured in the east and southwest of the basin. The lowest piezometric heads were observed in the center and north of the basin. The levels range from 175 m in the Nabeul hills to as low as 5 m, and potentially even 0 m, along the coastal fringe (
Figure 9a). The convergence of the equipotential lines from the edges of the basin suggests that the aquifer is fed by seepage of meteoric waters through the permeable formations at the bottom of the mountains bordering the basin.
Indeed, two distinct regions have been identified as important recharge zones for the aquifer. The first region is located in the eastern part of the plain and corresponds to the foothills of Abdurrahman Mountain and the Nabeul hills. The second recharge region is situated in the southwestern part of the study area. It receives significant runoff from prominent wadis, including Wadi Tahouna, Wadi El Masri, and Wadi Bou Argoub, which ultimately converge into Wadi El Bey. All the flows are diverted to the Gulf of Tunis and Sebkhat El Maleh, which constitute the main outflows. Along the Hammamet fault, which separates the Miocene uplands to the east from the Mio–Plio–Quaternary formations at the Graben, the equipotential lines are parallel to the axis of the Hammamet fault and present a continuous pattern. This indicates the potential lateral leakage and hydraulic connection between the two compartments across the Hammamet fault, as highlighted by the hydrogeological cross-sections (
Figure 6).
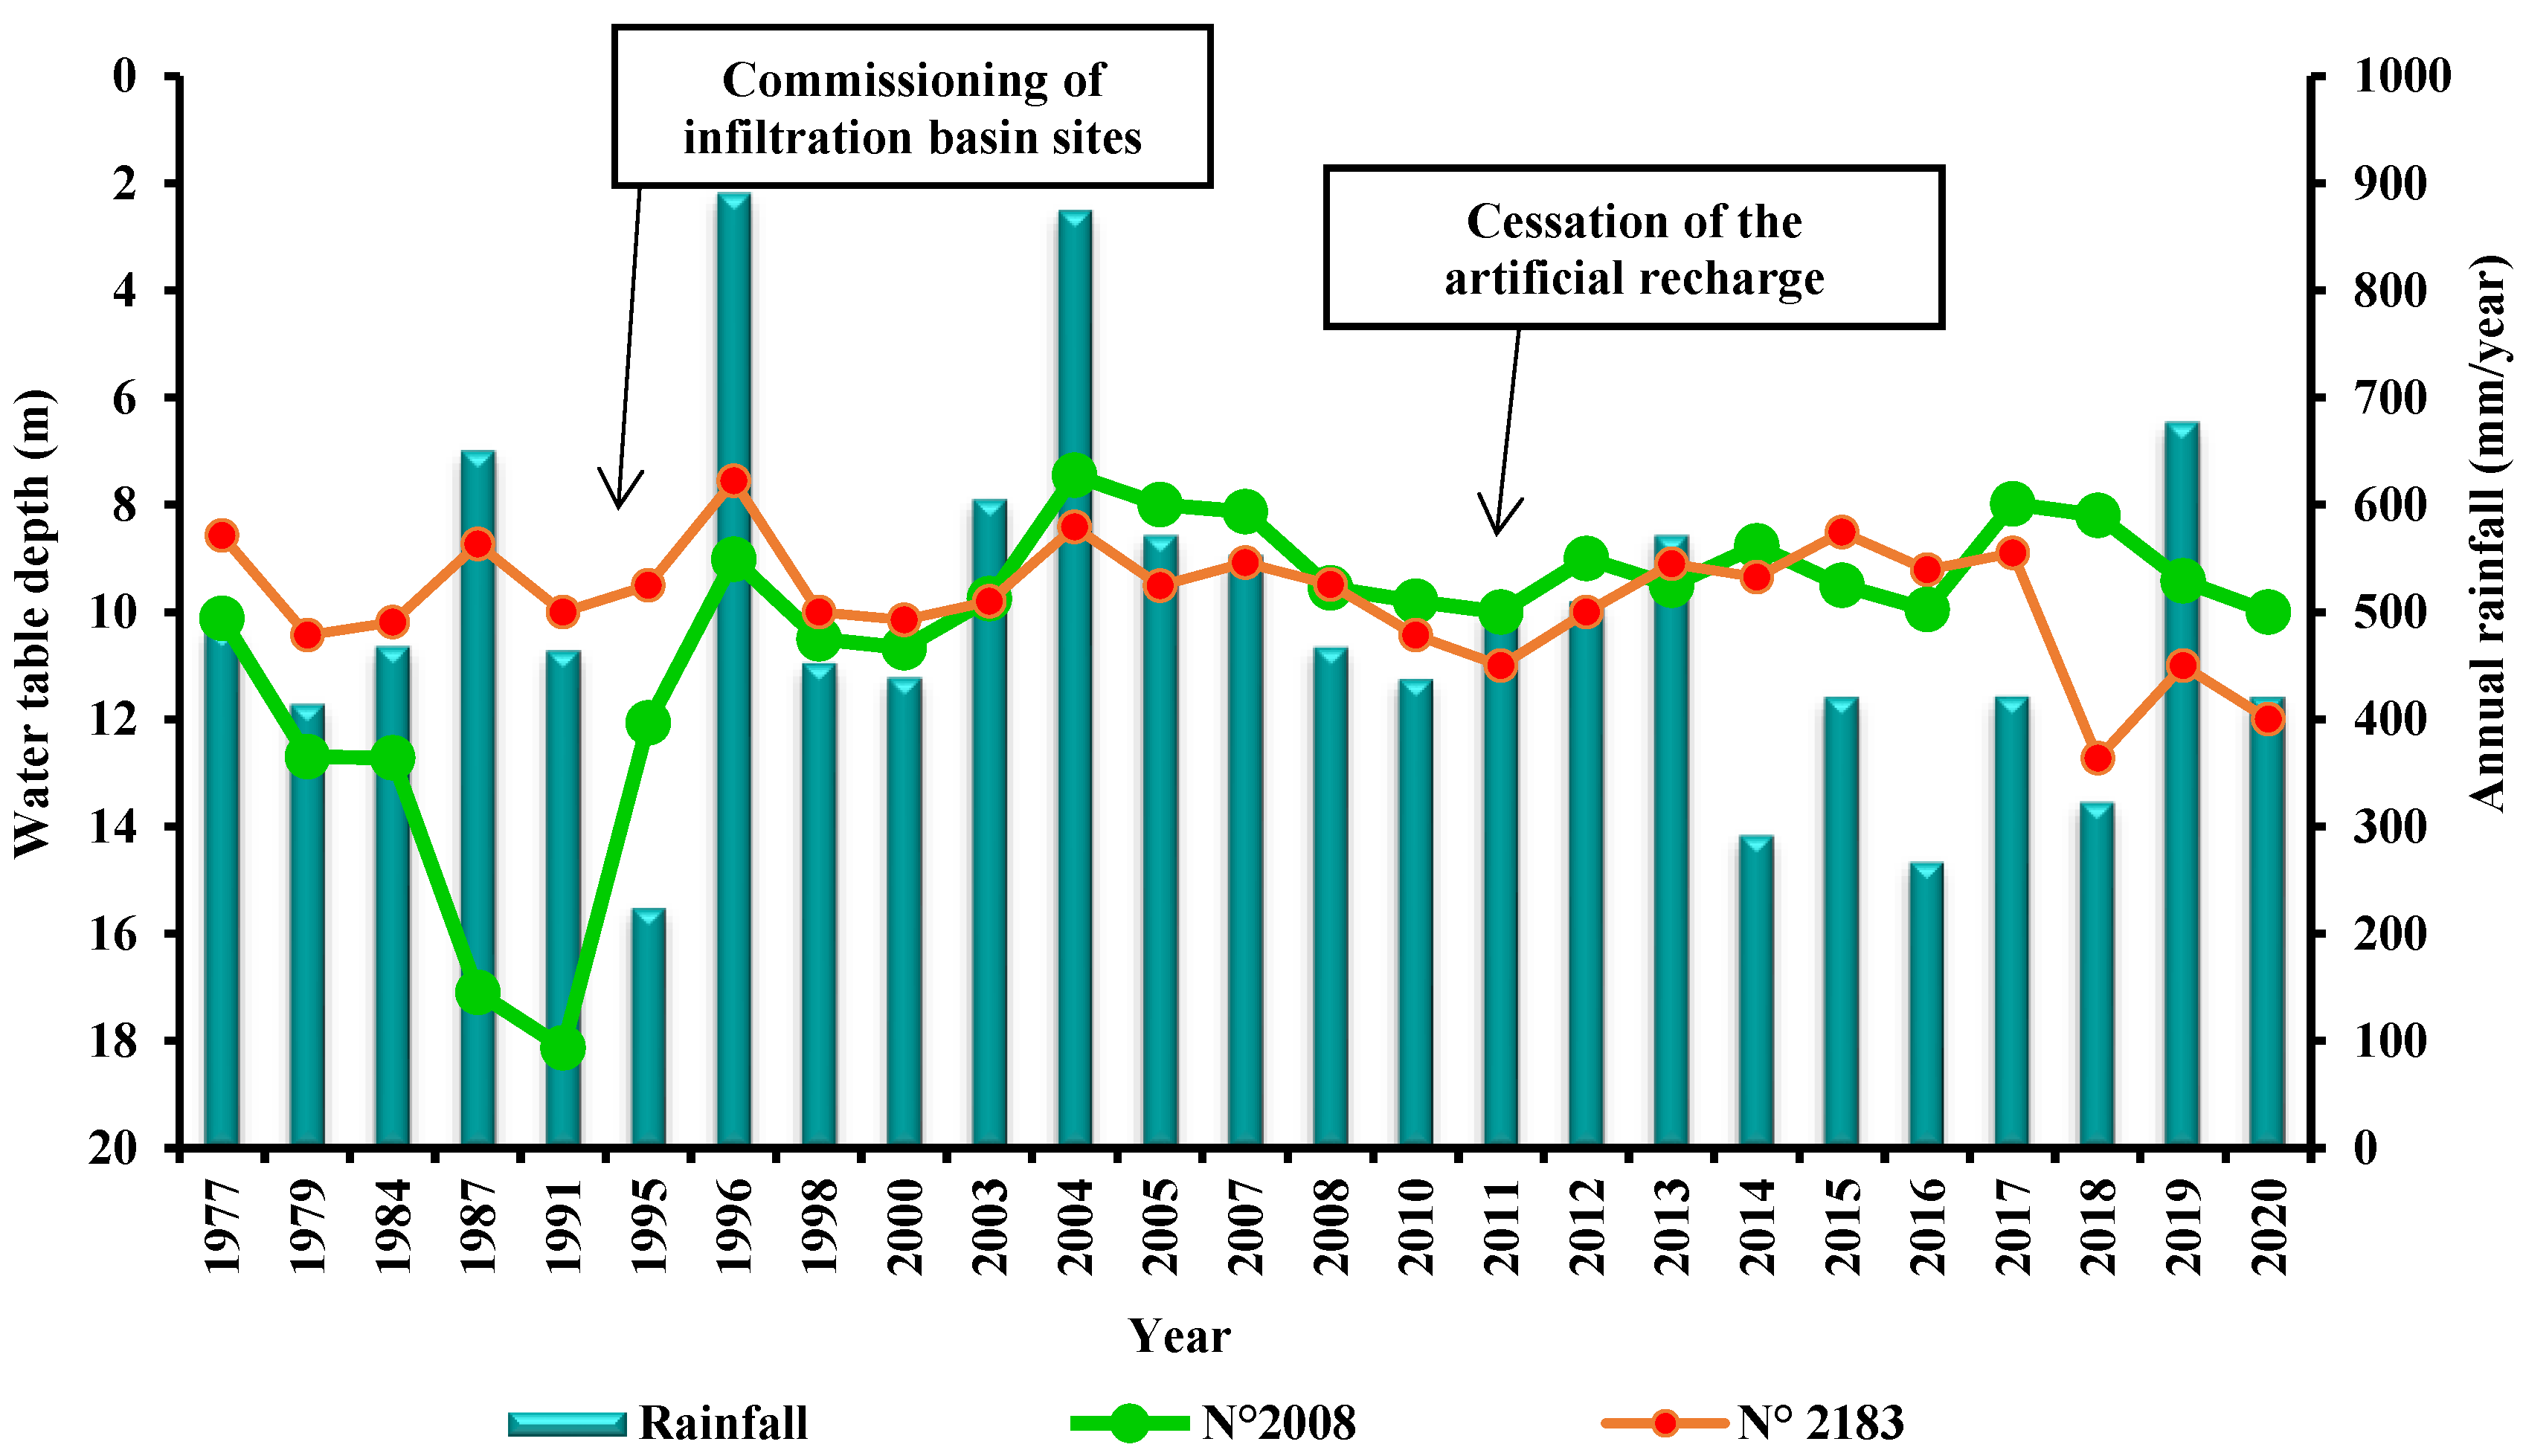
A comparison between groundwater levels in 2004 and 2020 during the low-water period reveals a significant decline in the piezometric surface (
Figure 9b). Indeed, the water table decreased by over 5 m, especially in the region of Grombalia and Soliman. This piezometric drop is manifested by the migration of equipotential curves toward the southern part of the basin. In fact, in this particular area of the basin, an analysis of piezometers 2008/2 and 2183/2 (
Figure 9b) during the 1977–2020 period reveals noticeable fluctuations in piezometric levels, which are generally associated with rainfall patterns (
Figure 10). The water table’s response to rainfall is delayed but relatively significant. The implementation of artificial recharge operations using infiltration basins since 1993 has played a notable role in improving groundwater aquifer recharge, leading to higher piezometric readings. However, this upward trend was interrupted in 2008 due to consecutive drought years, increased water abstraction, and the cessation of the artificial recharge in 2011 as a result of the porosity loss issue associated with suspended solids. On the other hand, while moving toward the eastern part of the basin, the water table shows a considerable ascent (
Figure 9b), thus highlighting the importance of the artificial recharge contribution from the dams.
4.4. Aquifer System Reserves
Groundwater reserve estimation is essential for sustainable groundwater resource management as it provides a basis for planning, allocation, and protection against overexploitation. In this study, the estimation of reserves is essentially based on natural hydrological conditions. The aquifer reserves are composed of two essential elements: first, the releasable reserves stored in the saturated zone of the aquifer. This volume depends on the geometry of the aquifer and its properties, notably, its porosity [
40]. The second element is renewable resources, which refer to the average annual recharge by precipitation.
In the context of the Grombalia aquifer system, precise data on the effective infiltration of precipitation are lacking. In this study, an estimate of effective infiltration was obtained by applying the water balance method of Thornthwaite and Mather [
31] and the WTF method [
40]. The water balance calculation and corresponding results are presented in the following table (
Table 1). The predominant soil texture in the study area is sandy, characterized by its excellent filtration and drainage capabilities, and it extends across a significant portion of the Grombalia plain [
52]. Considering the sandy soil texture, the utile reserve (
RU) for a root depth of 1 m is estimated to be approximately 30 mm/month [
53]. Therefore, the usable water reserve (
RFU) is determined to be 20 mm/month. The runoff is estimated at 25.59 mm, representing 6.2% of the rainfall. The water balance diagram (
Figure 11) shows that evapotranspiration peaks during summer (June, July, and August), resulting in an agricultural water deficit and the need for irrigation. From December to March, there is a replenishment of water stock, which is divided between groundwater recharge and surface runoff when the recharge exceeds the
RFU of 20 mm.
Table 2 summarizes the hydrogeological balance in the Grombalia aquifer system. The hydrogeological characteristics of the Grombalia basin indicate that the saturated zone of the Quaternary level has an average thickness of 187.5 m, spanning an area of 363 Km
2. In contrast, the saturated zone of the Mio–Pliocene level is thicker, measuring 550 m when it outcrops over an area of 172 km
2 and reaching 1000 m when it lies beneath the Quaternary level.
The mean effective porosity was assigned according to Castany (1982) [
54]. In our study, where the aquifer system is unconfined, the storage coefficient was assumed to be equivalent to the effective porosity. The Quaternary level exhibits a higher mean effective porosity of 7% compared to the Mio–Pliocene level with 3.1% porosity. In terms of water flux, the effective infiltration after accounting for runoff and surplus is calculated to be 22.98 mm/year, which represents 5.54% of the rainfall. Considering the respective areas, the total flux for the Quaternary unit is estimated at 8.34 million cubic meters (MCM), while for the Mio–Pliocene unit, it is 3.95 MCM. Additionally, the application of the WTF method yielded effective infiltration values of 24.5 mm for the Quaternary in 2020 and 21.7 mm for the Mio–Pliocene in 2018. The total flux was estimated at 8.89 MCM for the Quaternary and 3.73 MCM for the outcropping Mio–Pliocene. It is worth noting that the flow and recharge of the Mio–Pliocene level, which lies beneath the Quaternary, occurs via indirect lateral and vertical recharge in the subsurface. This means that the movement of water between these two aquifer levels is not direct, but rather occurs over a longer timescale and is less immediate than recharge by precipitation. The quantification of these flows is difficult to estimate and could be better assessed using numerical modeling.
The effective infiltration results obtained using both the Thornthwaite and Mather water balance method and the WTF method exhibit remarkable consistency, despite the substantial difference in time periods: 14 years for the water balance and 1year for the WTF method.
The renewable resources in the Quaternary level were estimated at 8.34 MCM, with a renewal rate of 0.17% using the water balance method and 0.19% using the WTF method. The exploitation of the Quaternary level is 106 MCM, which means that a volume of 97.1 MCM is overexploited from the deeper level, i.e., the Mio–Pliocene unit. The Mio–Pliocene level yielded renewable resources of 3.95 MCM with a renewal rate of 0.03%, according to both methods. The exploitation is about 23.8 MCM; hence, a volume of 20 MCM was overexploited from the non-renewable resources. The findings clearly demonstrate extensive overexploitation of groundwater resources. With the current rate of water extraction, the durability of exploitation is estimated to be approximately 45 years for the Quaternary level, posing significant challenges to the long-term sustainability of the aquifer system.
4.5. Hydrogeochemical Conditions
The groundwater geochemistry of the GB contributes supplementary insights into the development of the conceptual model of the aquifer system. These additional chemical data will guide further verification and allow for model testing. Typically, major ion studies are used to define the hydrochemical facies of waters, but their spatial variability can also provide an overview of the heterogeneity in aquifers and the interconnection between different aquifer units [
55].
Table 3 presents a summary of the representative chemical properties of groundwater, including electrical conductivity (EC), total dissolved solids (TDS), and water type. It is important to note that the detailed analysis of chemical equilibrium will be addressed in a separate paper. The electrical conductivity (EC) of the Grombalia aquifer system is typically high and shows a wide variation. The waters in the Quaternary level are characterized by a conductivity ranging between 301 and 7300 µS·cm
−1. For the Mio–Pliocene level, it varies from 285 to 4150 µS·cm
−1. Despite being an unconfined aquifer from the Mio–Pliocene to Quaternary, the lateral flow does not display significant vertical mixing.
Total dissolved solids (TDS) content shows appreciable variability in the GB. The TDS of groundwater has a range of values from 1453 to 5814 mg/L for the Quaternary level (
Figure 12a) and from 737 to 2934 mg/L for the Mio–Pliocene level (
Figure 12b). About 87% of the samples contained a TDS concentration above 1000 mg/L, which is the recommended upper limit for drinking water and is defined as freshwater [
56]. The TDS distribution maps (
Figure 12) show that low TDS values were recorded at the edges of the basin, more precisely, at the piedmont of Abderrahmane Mountain and the Nabeul hills, while high TDS values characterize the middle and coastal parts of the basin. This indicates that mineralization increases roughly following the groundwater flow path. The low values suggest a high contribution of recently infiltrated precipitation to the recharge of the aquifer system. In fact, in the eastern portion of the study area, the Quaternary and Mio–Pliocene levels exhibit the lowest salinity values. These values, below 2000 mg/L, indicate that groundwater is diluted by recharge originating from permeable formations exposed between Abderrahmane Mountain and the Nabeul hills. Indeed, the observed lower salinity values upstream are expected as compared to downstream areas.
The elevated mineralization levels observed in the central and northern parts of the Grombalia basin could be attributed to the extended residence time of groundwater, which promotes the substantial dissolution of evaporate minerals inside the aquifer matrix and subsequently increases the saline content of the groundwater. Moreover, the substantial aquifer exploitation and the return of irrigation flow, combined with the semi-arid conditions prevalent in the study area, contribute significantly to the overall salinity escalation. Additionally, the rising salinity toward the coastal fringe, with TDS exceeding 3000 mg/L, appears to be influenced by the high saline waters originating from Sebkhat el Maleh, alongside the potential impact of piezometric decline as indicated by the similarity observed between the piezometry and TDS maps. This factor raises concerns regarding the potential intrusion of seawater into the aquifer. The subpar quality of the Mio–Pliocene level in the central zone of the basin, characterized by the absence of a clay layer separating it from the Quaternary level (
Figure 12b), provides additional evidence of their hydrogeological communication, as suggested by the hydrogeological section D–D′ (
Figure 7).
The major cations and anions in each water sample were plotted in the Piper diagram [
57] shown in
Figure 13a. Five water types were identified: Na-Cl, SO
4-Cl-Na, SO
4-Cl-Ca-Mg, Cl-SO
4-Ca-Mg, and Na-HCO
3-Cl, and their spatial distribution is shown in
Figure 13b. The SO
4-Cl-Na, SO
4-Cl-Ca-Mg, and Cl-SO
4-Ca-Mg types are found in the Miocene uplands of the Nabeul hills, which represent the recharge areas. Most of the study area is dominated by the Na-Cl type. This is particularly evident in the collapsed middle section of the basin, especially along the coastal fringe. In general, the Na-Cl type is found in areas where the TDS is greater than 1500 mg/L and is normally located in the discharge area, except for a few points around the eastern edge. The Quaternary and Mio–Pliocene groundwaters in the GB have practically the same water type, which highlights an argument in favor of the presence of a hydraulic connection between the Quaternary and Mio–Pliocene levels. The Piper diagram reveals a lack of similarity among the cation compositions. There is an evident enrichment in Na
+ compared to Ca
2+ and Mg
2+ content. Furthermore, there is an enrichment of Cl
− relative to SO
42− in most of the samples, except for certain groundwater samples from the Miocene formations, which show depletion in chloride and a higher proportion of sulfate ions. Consequently, the Piper diagram demonstrates a gradual shift in water facies inside the Grombalia aquifer system. The groundwater evolution occurs gradually, progressing from water types characterized by a combination of sulfate, chloride, calcium, and magnesium ions (SO
4-Cl-Ca-Mg, SO
4-Cl-Na, and Na-HCO
3-Cl) toward water types dominated by chloride and sulfate ions (Cl-SO4-Ca-Mg and Na-Cl) along the flow lines. This transition occurs from the eastern region toward the central part of the study area. Indeed, this gradual change suggests variations in hydrochemical processes and water–rock interactions as groundwater flows through the aquifer system. Additionally, local anthropogenic factors like return flow irrigation and marine intrusion might also contribute to these variations.
4.6. The 3D Hydrogeological Conceptual Model and Its Implications for Groundwater Resource Management
A comprehensive 3D conceptual model of the GB was developed following its natural boundaries from the geological, hydrogeological, hydrodynamic, and hydrochemical insights presented in the previous sections. The boundaries of the conceptual model of the Grombalia aquifer system follow its natural hydrogeological extent. The hydrogeological basin is surrounded by mountain ridges and hills to the west, east, and south. Its northern boundary is the Mediterranean Sea. Two hydrogeological units (HU) were identified:
- –
The Quaternary Unit (QU): occupies the graben of Grombalia, reaching an average depth of about 220 m. This unit is represented as the superficial aquifer of the Grombalia aquifer system, formed by an alternating of sands, sandstones, clays, conglomerates, and wadis alluvium. It has relatively good permeability, with a K value ranging from 2.8 × 10⁻⁶ to 7.5 × 10⁻³ m/s.
- –
The Mio–Pliocene Unit (MPU): is situated below the Quaternary Unit in the graben portion and extends across the Miocene upland areas in the western and eastern part of the study area. This unit is represented by the Oum Douil group, dominated by sandy sandstones with argillite intercalations, encompassing the Beglia, Saouaf, and Mahmoud formations. The sedimentation within this unit displays a transition from fluvial to a relatively marine depositional environment, with an average thickness of 1000 m. The marine character becomes apparent with the presence of a bioclastic limestone bar from the Ain Grab formation, which underlies the Oum Douil group. This marine character is pursued by the glauconia-rich clays of the Mahmoud formation [
45,
46], which serve as the base of the Oum Douil group.
The absence of a real clay barrier between the QU and the MPU in the graben section enables a vertical hydraulic connection between these two units. Furthermore, the Hammamet fault, which has affected the terrain in the study area, allows a lateral hydraulic connection in an east–west direction between the MPU in the eastern basin and the Quaternary unit in the graben. Significantly, the QU and MPU units together constitute a single, multi-layered Mio–Plio–Quaternary aquifer system. In fact, the QU and MPU are in hydrogeological continuity, forming the Mio–Plio–Quaternary aquifer system in Grombalia. This Mio–Plio–Quaternary aquifer system extends from the east and west Miocene uplifted compartments to encompass the entire graben portion in the middle. Along the western boundary, impermeable formations create a non-flow boundary condition that prevents water flow from the adjacent western aquifer to the Grombalia aquifer system (
Figure 6). The substratum of this aquifer system consists of clays belonging to the Mahmoud formation, which is of upper Langhian–lower Serravallian age. Notably, our research findings challenge the previously proposed idea that the Quaternary unit overlays a 15-meter clay substratum, as suggested by Ben Moussa et al. (2010) [
20]. Moreover, our findings contradict earlier studies that reported the absence of lateral connections. Based on a single cross-section analysis, Ben Moussa et al. (2009) concluded that a hydraulic discontinuity existed between the Quaternary and the adjacent Miocene aquifer of the eastern uplifted compartment [
19]. However, these discrepancies might stem from the constrained data and analysis present in previous studies, leading to an incomplete understanding of the aquifer system.
The 3D hydrogeological conceptual model is provided in
Figure 14. The model is divided into layers, with each layer representing a different hydrogeological unit. The properties of each unit, such as lithology, transmissivity, permeability, piezometry, and water types are used to determine how water will flow through the subsurface. The model also takes into account the presence of any interconnection between the hydrogeological units, which is an important factor to consider in this coastal region where the water table fluctuates. This model allows corroboration of the hydrodynamics of the aquifer system of the GB that drive the intercommunication between the QU and the MPU. It is worth noting that the reliability of the lithological sequence reconstruction becomes evident at the local scale, providing a solid basis for the conceptual hydrogeological model’s validity. This accuracy is a sufficient guarantee for representing the aquifer’s subsurface properties. However, when extending these reconstructions spatially, uncertainties may arise due to interpolation challenges. Nevertheless, these uncertainties are effectively limited given the well-structured nature of the aquifer system deposits and the overall understanding of tectonic faults and related logs. Similarly, the alignment between hydrogeological and hydrochemical findings, despite these inherent uncertainties, strengthens the validity of the model by providing a comprehensive overview of aquifer behavior.
The groundwater flow within the study area originates from high-altitude mountains, such as Abderrahmane Mt, Nabeul hills, and Darbouka Mt. The flow direction of groundwater is primarily governed by the topography, leading toward the discharge areas, namely, the Gulf of Tunis and the Sebkhat el Melah. By analyzing the potentiometric maps (
Figure 9), the aquifer system can be divided into three natural subsystems, each characterized by a unique groundwater flow direction. The first zone corresponds to the eastern part of the study area, where groundwater flows from the Abderrahmane Mt and the Nabeul hills in the east toward the western portion of the graben. The second zone encompasses the southwestern part of the study area, where groundwater flows from Darbouka Mt toward the graben. The third zone pertains to the graben itself, where groundwater meets and flows toward the Mediterranean Sea and the Sebkhat el Melah. The hydrochemical analyses indicate different types of groundwater, dominated by the Na-Cl type. Based on the general flow paths, the assumed evolution of water types in the Grombalia aquifer system is essentially from (SO
4-Cl-Ca-Mg), (SO
4-Cl-Na), and (Na-HCO
3-Cl), then to (Cl-SO
4-Ca-Mg) and (Na-Cl). This inferred evolution aligns with the conceptual model and is further supported by the hydrochemical data. Furthermore, the spatial variation observed in the total dissolved solids (TDS) values and water types suggests a potential interconnection between the groundwater in the QU and the MPU. These variations provide additional evidence supporting the conceptual model and imply the exchange and intermingling of groundwater between the two hydrogeological units.
The hydraulic interconnection, both vertically and laterally, between the QU and the MPU can significantly impact the groundwater resources of the GB. One notable impact is the redistribution of water resources. Excessive water extraction from the Quaternary unit can result in declining water levels, simultaneously leading to a decrease in water levels in the Mio–Pliocene unit, and vice versa. The hydrogeological continuity of the QU and the MPU can also affect the piezometric head, which is the pressure that the water in the aquifer system is under. Changes in the piezometric head can result in changes in the location of the fresh water–seawater interface, which can cause saltwater intrusion. Another impact is the transfer of contaminants between units. Contaminants that are present in one unit can be transported to the other unit through intercommunication, affecting the water quality in both units. Similarly, the presence of minerals in the groundwater may be the result of the hydrogeological continuity in the QU and the MPU, with minerals leached from one unit and transported to another. Previous studies have attempted to investigate sources of water mineralization in the GB by focusing solely on one hydrogeological unit, namely, the shallow Quaternary unit [
18,
20,
21,
23,
27]. However, these approaches could oversimplify the complex hydrodynamic behavior of the aquifer system of the GB, leading to an incomplete understanding of the water mineralization processes. Additionally, the oversimplification of the system could have led to a failure to consider important factors, such as the hydrogeological continuity of QU and MPU.
In the face of escalating global water concerns, the urgency to safeguard aquifers becomes more pressing [
58]. The depletion of these vital resources carries substantial risks for ecosystems and the agriculture and industrial sectors, accentuating the imperative for the use of sustainable water management practices [
58,
59]. The findings of this 3D hydrogeological conceptual model act as a foundational resource for guiding the sustainable management of groundwater resources within the Grombalia aquifer system. Prior to developing sustainable groundwater resource management strategies, a comprehensive understanding of groundwater dynamics is essential. This includes identifying the intricate hydraulic interconnections between aquifer system units, manifesting both vertically and laterally. These interconnections stand as pivotal factors in the overarching pursuit of broader aquifer sustainability objectives. The profound influence of this intricate dynamic resonates in the movement, availability, and quality of groundwater, thereby significantly influencing the formulation and implementation of strategies that govern the management of water resources. Attaining a deep understanding of how water navigates through these systems vertically and horizontally empowers stakeholders to adopt comprehensive strategies. These strategies, in turn, ensure impartial water access, mitigate adverse environmental impacts, and secure the perpetual availability of reliable freshwater resources. Such measures stand to benefit not only the current population but also generations to come, as we navigate the path toward water security and preservation.
5. Conclusions
The first 3D hydrogeological conceptual model of the GB was built by integrating geological, hydrogeological, hydrodynamic, and hydrochemical characteristics. This model provides a comprehensive representation of the hydrogeological system, including the hydrogeological units, groundwater flow paths, and hydrogeochemical conditions. The construction of the model of the GB was a major milestone in the study of this complex aquifer system.
The hydrogeological and hydrochemical properties of the Grombalia basin reveal a cohesive and extensive Mio–Plio–Quaternary aquifer system. This interconnected system spans across the uplifted compartment of the basin and extends throughout the entire graben portion. The vertical and lateral hydrogeological continuity between the Quaternary deposits and the underlying Mio–Pliocene deposits establishes a unified and integrated aquifer system, allowing for the flow and exchange of groundwater between these layers. Particular locations with high permeability and transmissivity are the central plain and the eastern side, which may be appropriate for future drilling.
Piezometric surveys point to a continuous decline, notably in the regions of Grombalia and Soliman where the isopiezes reveal drops of up to −5 m following the overexploitation of the Grombalia aquifer. Furthermore, it was found that the Quaternary and Mio–Pliocene levels represent volumes of 97 MCM and 20 MCM, respectively, exploited from non-renewable reserves. This situation is likely not only to lead to the degradation of water quality but also to the depletion of Grombalia groundwater resources and the onset of an intrusion of seawater.
The interconnection between hydrogeological units can greatly impact the sustainability of the coastal aquifer system of the GB. In the case of the overexploited Mediterranean coastal aquifer system investigated in this study, the interconnection between units was found to have a significant impact on groundwater flow and piezometric drop, as well as on the quality of the groundwater. Thus, the results of this study highlight the importance of considering the interconnection among hydrogeological units when managing groundwater resources, especially in Mediterranean coastal areas where water scarcity and seawater intrusion are major issues.
In summary, the model provides considerable insights because of the presence of a complex multi-layered aquifer system and the intercommunication among hydrogeological units. This makes it difficult to understand subsurface conditions and hydrodynamic functioning without a detailed 3D hydrogeological conceptual model. The model will be used to support sustainable groundwater management in the Grombalia region. A decision-making framework will be developed to integrate the model results with other data and information to build strategies for balancing water exploitation and resource preservation. Moreover, it is envisaged that such an integrated conceptual model will serve as the basis for future development and calibration of a 3D numerical model for the aquifer system of the GB. The latter could confirm the current conceptual model and bring new knowledge about the hydrodynamic functioning of the aquifer system and the degradation of water quality. Concurrently, significant gains could be made by refining the model using an in-depth isotope study. Using water isotopes, i.e.,
18O/
2H, would augment the precision of the hydrodynamic model and provide insights into groundwater origin. This, in turn, would facilitate the validation or enhanced identification of the potential recharge zones established in this study. Additionally, the incorporation of strontium and boron isotopes could yield insights into the geochemical interactions involving salt dissolution from evaporites and marine intrusion. A detailed isotope study would also enable the dating of groundwater, estimation of groundwater flow velocities, and determination of residence times, all of which would greatly contribute to the enhancement of groundwater management strategies. Simultaneously, delving into the impacts of climate change would serve as a pivotal avenue for grasping the aquifer system’s responsiveness to evolving environmental dynamics. This would entail an investigation into the conspicuous reduction in aquifer recharge attributed to precipitation fluctuations and an examination of the potential initiation of marine intrusion. This phenomenon is anticipated to be aggravated by the projected sea level rise in the Mediterranean region, encompassing the Tunisian area, by the year 2050 with a minimum and maximum elevation with respect to different climate change scenarios between 8 and 25 cm [
60].


 ,
, 


