Article

Streamflow Reconstructions Using Tree-Ring-Based Paleo Proxies for the Sava River Basin (Slovenia)

1
Department of Civil, Construction and Environmental Engineering, University of Alabama, Tuscaloosa, AL 35487, USA
2
Department of Civil, Environmental, University of Texas—Rio Grande Valley, Edinburg, TX 78539, USA
3
Department of Geography, University of Alabama, Tuscaloosa, AL 35401, USA
4
Department of Civil, Environmental and Mechanical Engineering, University of Trento, 77-38123 Trento, Italy
5
Faculty of Civil Engineering and Geodesy, University of Ljubljana, 1000 Ljubljana, Slovenia
*
Author to whom correspondence should be addressed.
Hydrology 2023, 10(7), 138; https://doi.org/10.3390/hydrology10070138
Submission received: 19 May 2023 / Revised: 21 June 2023 / Accepted: 25 June 2023 / Published: 28 June 2023

Abstract

:
The Sava River Basin (SRB) extends across six countries (Slovenia, Croatia, Bosnia and Herzegovina, Serbia, Albania, and Montenegro) and is a major tributary of the Danube River (DR). The Sava River (SR) originates in the alpine region of Slovenia, and, in support of a Slovenian government initiative to increase clean, sustainable energy, multiple hydropower facilities have been constructed within the past ~20 years. Given the importance of this river system for varying demands, including energy production, information about past (paleo) drought and pluvial periods would provide important information to water managers and planners. Seasonal (April–May–June–July–August–September—AMJJAS) streamflow data were obtained for two SRB gauges (Jesenice and Catez) in Slovenia. The Jesenice gauge is in the extreme headwaters of the SR, upstream of any major water control structures, and is considered an unimpaired (minimal anthropogenic influence) gauge. The Catez gauge is located on the SR near the Slovenia–Croatia border, thus providing an estimate of streamflow leaving Slovenia (entering Croatia). The Old World Drought Atlas (OWDA) provides an annual June–July–August (JJA) self-calibrating Palmer Drought Severity Index (scPDSI) derived from 106 tree-ring chronologies for 5414 grid points across Europe from 0 to 2012 AD. In lieu of tree-ring chronologies, this dataset was used as a proxy to reconstruct (for ~2000 years) seasonal streamflow. Prescreening methods included the correlation and temporal stability of seasonal streamflow and scPDSI cells. The retained scPDSI cells were then used as predictors (independent variables) to reconstruct streamflow (predictive and/or dependent variables) in regression-based models. This resulted in highly skillful reconstructions of SRB seasonal streamflow from 0 to 2012 AD. The reconstructions were evaluated, and both low flow (i.e., drought) and high flow (i.e., pluvial) periods were identified for various filters (5-year to 30-year). When evaluating the most recent ~20 years (2000 to present), multiple low-flow (drought) periods were identified. For various filters (5-year to 15-year), the 2003 end-year consistently ranked as one of the lowest periods, while the 21-year period ending in 2012 was the lowest flow period in the ~2000-year reconstructed-observed-historic period of record. The ~30-year period ending in 2020 was the lowest flow period since the early 6th century. A decrease in pluvial (wet) periods was identified in the observed-historic record when compared to the paleo record, again confirming an apparent decline in streamflow. Given the increased activities (construction of water control structures) impacting the Sava River, the results provide important information to water managers and planners.

1. Introduction

Incorporating the countries of Slovenia, Croatia, Bosnia and Herzegovina, Serbia, Montenegro, and Albania—the Sava River Basin (SRB) has a drainage area of ~97,000 km2, with the Sava River (SR) originating in the mountainous alpine region of Slovenia, where two headwater streams, the Sava Bohinjka and the Sava Dolinka, join at Radovljica to form the SR [1]. The SRB average annual precipitation is ~1350 mm, with May through October being the wettest months (~100 to ~150 mm per month) and the winter (December through March) being the driest months (~65 to ~100 mm per month) and past research [2] revealed SRB precipitation is influenced by the West Mediterranean Oscillation Index (WeMOI) and the North Sea Caspian Pattern (NCP). The SR is a major tributary of the Danube River (DR), with its confluence in Belgrade (Serbia), whereas, from Belgrade, the DR continues to flow, generally easterly, before terminating into the Black Sea. Past research [3] evaluated past paleo climate records of temperature and hydroclimate variability in the region. While reconstructions of streamflow are generally limited on the European continent, recent research has resulted in streamflow reconstructions of both the DR and SR. A ~250-year DR streamflow reconstruction was developed near Tulcea (Romania), which is located near the terminus of the DR [4]. To develop this streamflow reconstruction, a new tree-ring chronology (dating from 1728 to 2020) was developed from oak trees (Quercus sp.) in the region. The highest correlation value relating DR streamflow to the newly developed tree-ring chronology was for the November (previous year) to July (current year) streamflow season [4]. As part of a fourteen catchment study in Europe, a ~500-year streamflow reconstruction of the DR near Orsova, Romania (which is located downstream from the SR-DR confluence in Belgrade) was developed [5]. In addition to precipitation, temperature, and streamflow records, [5] incorporated data from the Old Water Drought Atlas (OWDA) [6], which includes soil moisture data, specifically the self-calibrated Palmer Drought Severity Index (scPDSI) developed from summer-related tree-ring proxies dating from 0 to 2012. Perhaps the most important contribution to date in this region has been the reconstruction of SR summer streamflow in Croatia [7]. Ref. [7] stated that “to the extent of our knowledge, no such reconstructions have been conducted in Southeast Europe”, thus highlighting the novelty and importance of their research efforts. The research consisted of collecting samples, developing a new tree-ring chronology for narrow-leaved ash trees, and correlating the tree-ring chronology with both monthly and seasonal streamflow from a gauge near Jasenovac (Croatia). Significant (positive) correlations were identified between May, July, and August streamflow and the narrow-leaved ash tree-ring chronology, while the May–June–July–August (MJJA) four-month streamflow season showed similarly significant and stable correlations [7]. Of note, positive and significant correlations were observed for scPDSI and streamflow from March to October. The correlations of July scPDSI (and August scPDSI) and streamflow exceeded those observed with the correlations of the narrow-leaved ash tree-ring chronology and streamflow for the same months [7]. Thus, reconstructed scPDSI should be considered a proxy to develop SRB streamflow reconstructions.
Slovenia’s strategic goal of increasing sustainable energy has resulted in the planning and construction of multiple hydroelectric power plants on the Sava River [8,9]. Forty-one large dams are identified in Slovenia [10], and these water control structures are listed on the Slovenian National Committee on Large Dams (SLOCOLD) [11]. A further evaluation of SLOCOLD reveals eight water control structures in operation on the SR and Sava Dolinka rivers. As displayed in Figure 1, these eight structures (with date of completion in parenthesis), beginning with the most downstream structure, include: Brežice (2018), Krško (2013), Blanca (2009), Boštanj (2006), Vrhovo (1993), Medvode (1954), Mavčiče (1986), and Moste (1952). The primary function of these structures is hydropower (clean energy production), and given the increased construction activity in the past ~20 to ~30 years, recent streamflow records could be highly impaired. Therefore, an objective of the current research was to identify an SR streamflow gauge with minimal impairments due to anthropogenic activities. We identified the Jesenice streamflow gauge on the Sava Dolinka River, which is located upstream of the Moste dam (constructed in 1952) (Figure 1). The Jesenice streamflow gauge provided a continuous daily flow record from 1977 to 2013, thus capturing a period of increased (downstream) construction and operation of new SR water control structures. We believe the Jesenice streamflow gauge record should most closely reflect the natural hydroclimatic (streamflow) variability in the SRB. The Catez streamflow gauge was located near the Slovenia–Croatia border (Figure 1) and provided a daily continuous flow record from 1926 to 2020. While likely experiencing impairments since the ~1950s, the Catez gauge represents an important measurement of streamflow given its location near the Slovenia–Croatia border and, thus, provides an estimate of streamflow leaving Slovenia (entering Croatia). The Sava River Commission, given their involvement in the management (e.g., flood risk, sediment loads, etc.) of the SR, would also benefit from an increased period of record for the Catez gauge. Utilizing these streamflow records, we incorporated tree-ring-derived proxies (with periods of record much earlier than streamflow records) to reconstruct the streamflow record. Skillful streamflow reconstructions in the United States [12,13] and northern Italy [14,15] used the tree-ring-derived reconstructed scPDSI [6] as a proxy. Given the significant and positive correlation between scPDSI and SR streamflow [7], we will use the scPDSI as a reconstruction proxy to evaluate seasonal streamflow reconstruction potential in the SR. Thus, a contribution of the current research was the first-known streamflow reconstruction of SR headwaters (Slovenian gauges). The current research developed a streamflow reconstruction from streamflow data obtained from a minimally impaired gauge (Jesenice) and a streamflow reconstruction at a critical SR gauge (Catez) near the Slovenia–Croatia border. Given the increased activity in Slovenia in the construction of water control structures to increase sustainable energy output, the current research provides useful information for SR water managers and planners, including the Sava River Commission, in operating these structures as well as downstream users.

2. Materials and Methods

The process of developing streamflow reconstructions begins with the collection of SR streamflow data for the Jesenice gauge (1977 to 2013) and the Catez gauge (1926 to 2020). Streamflow data (daily discharges—m3/s) were collected from the Slovenian Environment Agency [16] and aggregated to the average monthly discharge volume in million cubic meters (MCM). The OWDA provides annual June–July–August (JJA) scPDSI for 5414 grid points across Europe from 0 to 2012 AD [6]. Similar to previous studies [14,15], this research utilizes the OWDA scPDSI as a proxy for SRB streamflow reconstructions and will include 249 scPDSI cells within a 450 km search radius.
While annual reconstructions of streamflow may provide the most useful information for water managers, researchers must balance the challenge of acceptable reconstruction skill with the period (annual or seasonal) selected for use in the streamflow reconstruction. Typically, most tree growth occurs during the summer months, and correlations between tree-ring-based proxies and streamflow from the summer months are the most significant. However, developing a streamflow reconstruction for a single summer month, while statistically strong, provides little value to water managers. Similarly, when developing an annual streamflow reconstruction, tree growth is limited during the winter season, and, thus, streamflow during the winter season is difficult to capture in the streamflow reconstruction. This may result in reduced skill in annual streamflow reconstructions. Prior work in the area [7] noted March to October positive SR streamflow correlations with scPDSI. For the two periods of record (1977 to 2013 and 1926 to 2020), the monthly (January to December) streamflow (MCM) for this period was calculated. We evaluated various seasons based on the percentage of annual flow and the need to include summer months as they are associated with tree-ring growth. The April–May–June–July–August–September (AMJJAS) six-month season was selected given it accounts for (approximately) half of the total annual flow [17] and that this six-month season overlaps with the tree-ring-derived scPDSI. The AMJJAS streamflow for each gauge will serve as the dependent variable for reconstruction in the forward-backward stepwise linear regression (SLR) model, while the scPDSI will serve as the independent variable.
Prior to input into the SLR model, prescreening (correlation and stability) was performed. Two prescreening methods were selected. Initially, we inspected the correlation between AMJJAS streamflow and scPDSI cells to identify significant (p ≤ 0.01 or 99% significance) scPDSI cells. Next, we investigated temporal stability analysis by performing an 11-year (Jesenice gauge) and 30-year (Catez gauge) moving correlation window (note, the periods (11-year and 30-year) selected were ~33% of the entire period of record (36 years and 87 years, respectively)) between AMJJAS streamflow and scPDSI cells, and scPDSI cells containing negative correlation values were considered unstable and not considered in the SLR model. By evaluating stability, the likelihood of reliable and practical streamflow reconstructions was improved [18]. Given that scPDSI data ends in 2012, the periods of record used to develop the SLR models were 1977 to 2012 (Jesenice gauge) and 1926 to 2012 (Catez gauge).
SLR models for AMJJAS streamflow were generated for each gauge and evaluated for model skill, multi-collinearity, and over-fitting. A forward and backward (standard) SLR model was developed. The model adds and removes predictors until all variables not in the model have p-values that are greater than the specified alpha-to-enter value (0.05) and when all variables in the model have p-values that are less than or equal to the specified alpha-to-remove value (0.10) [19,20,21]. To evaluate skill, traditional statistical measures were used, including R2 (the amount of variance in each model) and R2-predicted (using leave-one-out-cross-validation, also referred to as drop-one-cross-validation). The drop-one-cross-validation method is recognized as a more rigorous evaluation when compared to the split sample approach. The variation inflation factor (VIF) indicates the extent to which multicollinearity is present, and a VIF value close to 1.0 (maximum of 10) is preferred [22]. The Durbin–Watson (DW) statistic was used to determine if autocorrelation was present [23] and the sign test counts the number of agreements and disagreements between the instrumental and reconstructed flow.

3. Results

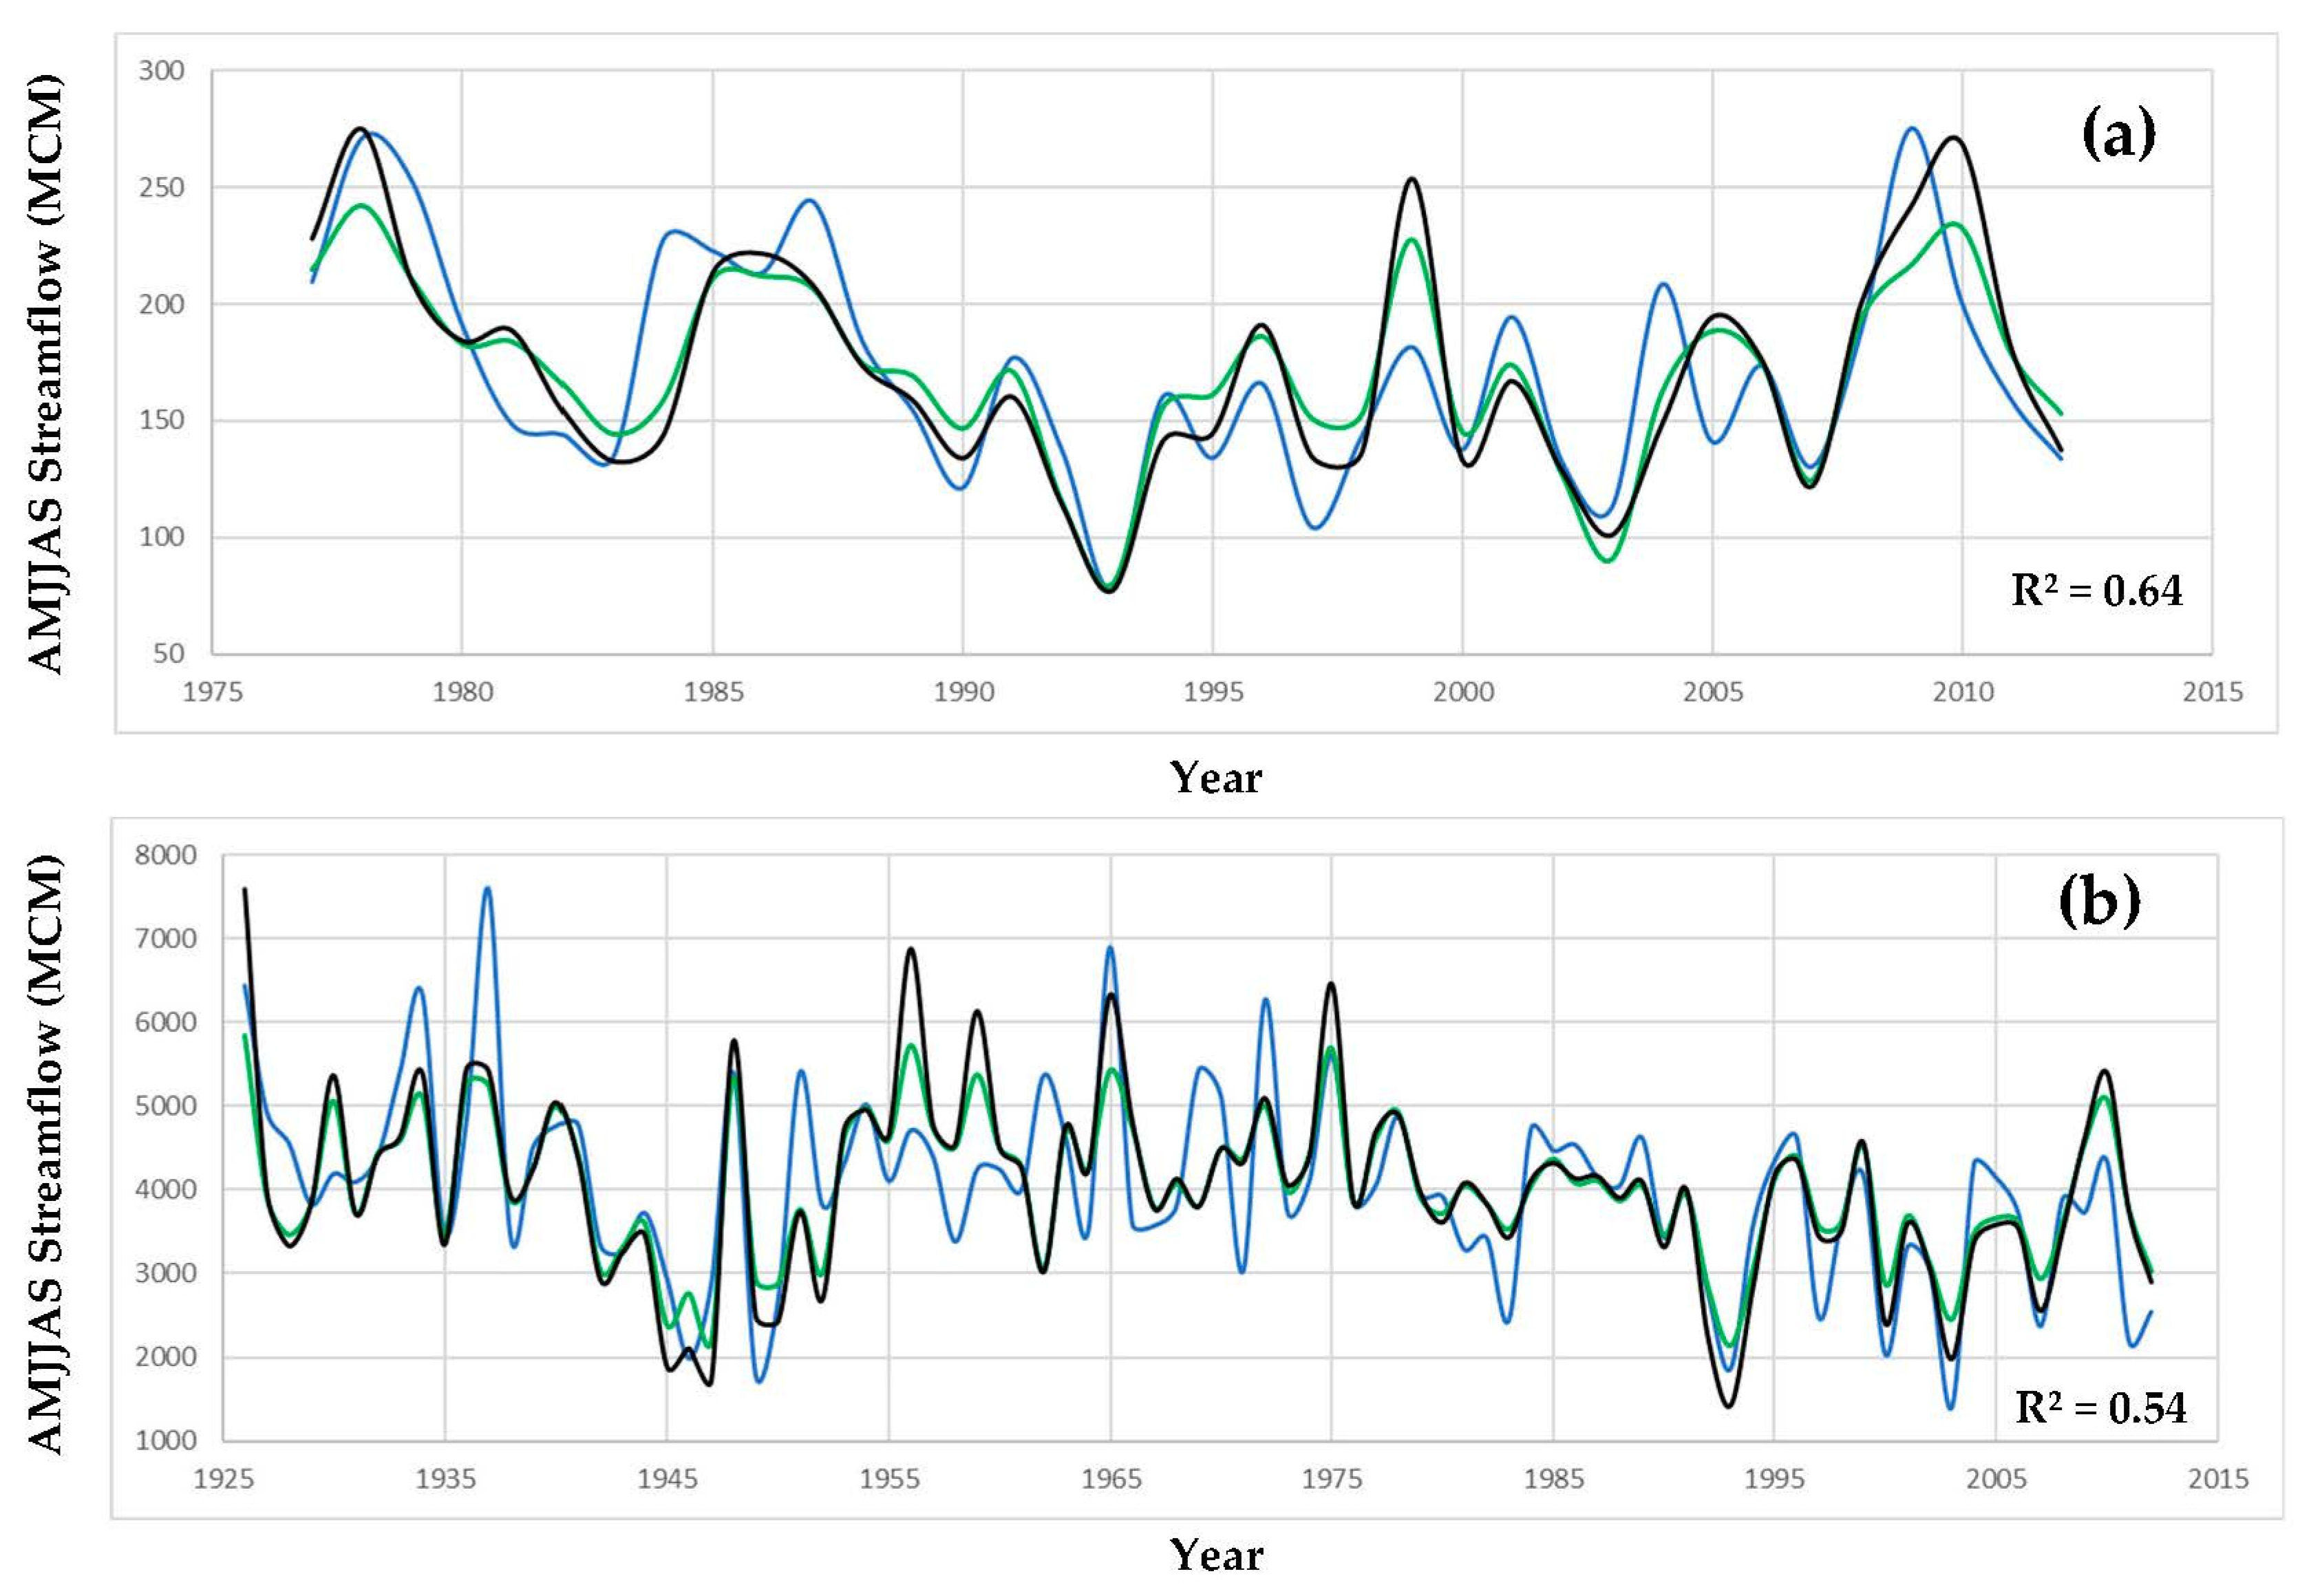
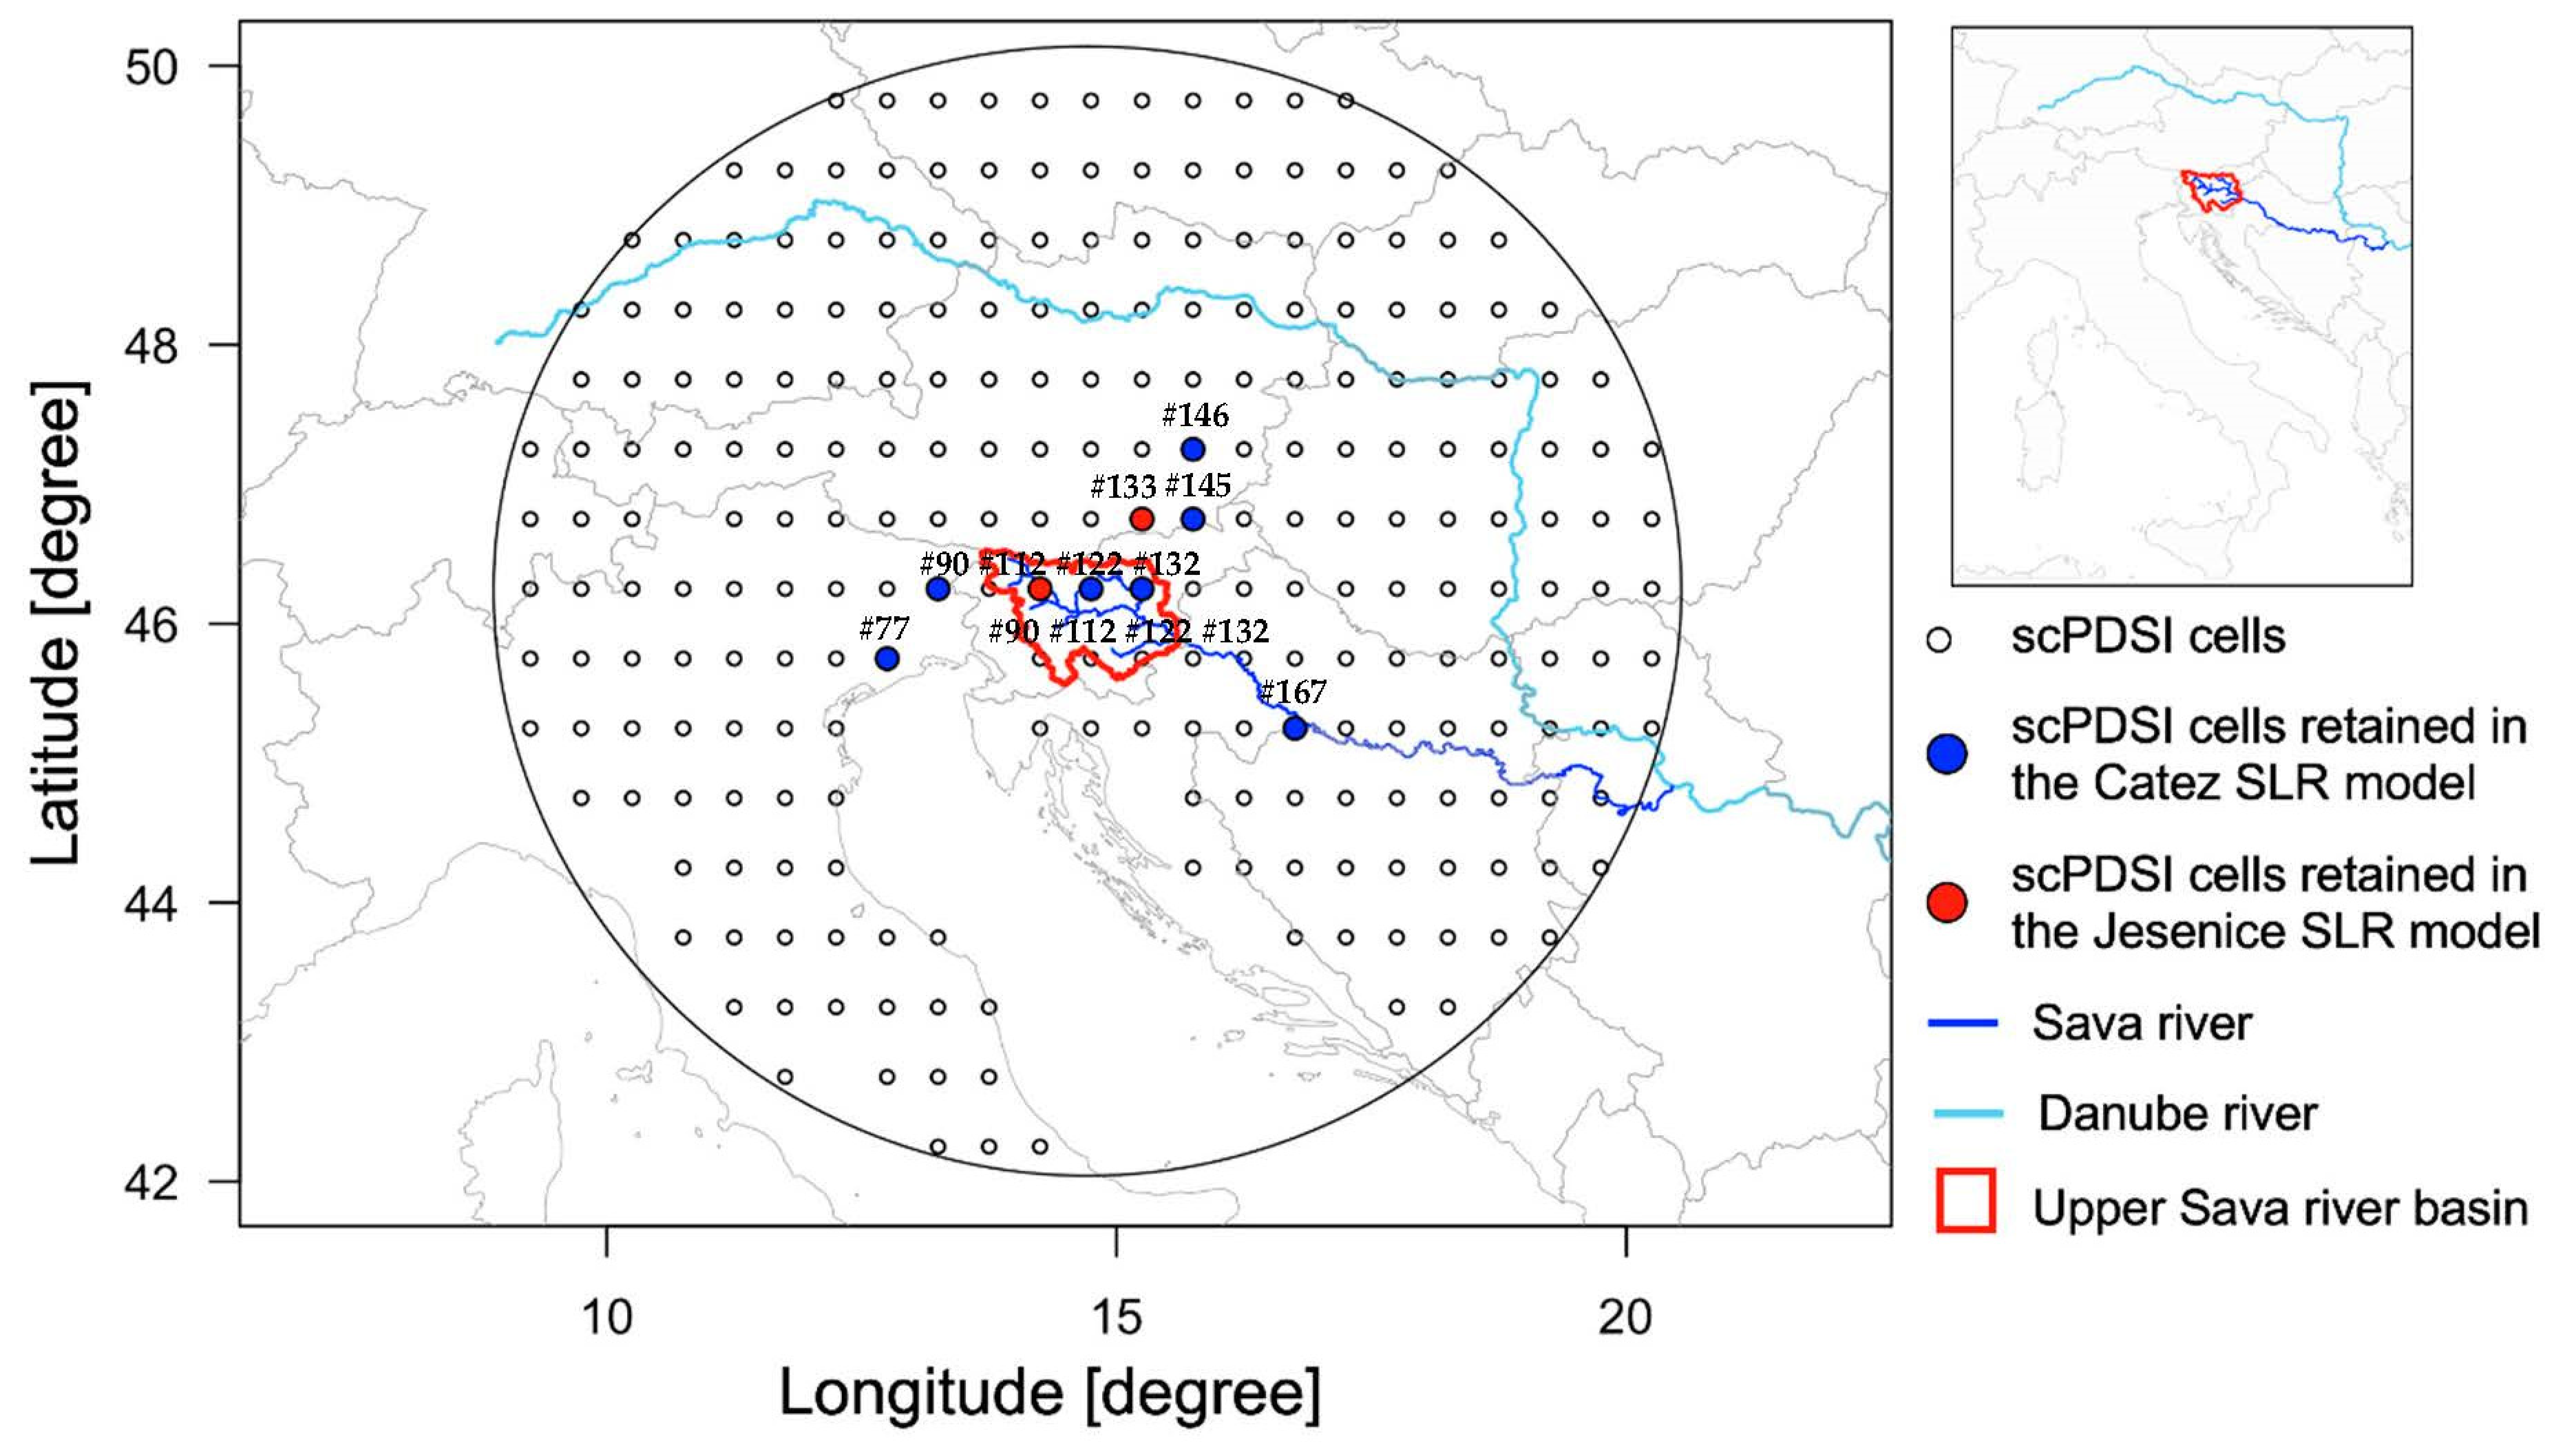
The SLR models produced excellent skills for each of the reconstructions. Each of the statistics used to evaluate model skill, multi-collinearity, and over-fitting exceeded established thresholds (e.g., R2 > ~0.40; R2-predicted > ~0.30; VIF < 10, prefer = ~1.0; Durbin–Watson > ~1.5 and < ~2.5; sign test; Table 1). The reconstructed annual AMJJAS streamflow (period of 0 to 2012) for each of the two (Jesenice and Catez) models was extracted, and quantile mapping bias correction was performed via the “RQUANT” method in the qmap package in R [24,25,26] (Figure 2), and the scPDSI cells retained in each model are provided (Figure 3). The bias-corrected reconstructed annual AMJJAS streamflow (0 to 2012) for each gauge was standardized (mean of zero and standard deviation of one). Given the magnitude of the difference in streamflow between the Jesenice gauge and the Catez gauge, this will allow for an easier comparison. A 10-year end-year filter was applied to the standardized bias-corrected reconstructed annual AMJJAS streamflow for the Jesenice and Catez gauges (Figure 4). The correlation of the 10-year end-year filtered streamflow between the Jesenice and Catez gauges was exceptional (r > 0.9, >99.9% significance, p < 0.001). Thus, the temporal variability of the Jesenice and Catez reconstructions was statistically similar. This was noteworthy given (a) the Jesenice gauge was deemed unimpaired and the Catez gauge has multiple upstream water control structures (although the impact of these structures on the water balance at the monthly time step should not be significant); (b) the observed-historic streamflow periods of record used to generate the reconstructions varied; (c) only one common scPDSI proxy was retained in each SLR reconstruction model. These results provide greater confidence in utilizing the Catez reconstruction in evaluating drought and pluvial periods.

4. Discussion and Conclusions

We established the Jesenice streamflow gauge was unimpaired (with minimal anthropogenic influences) due to its location in the upper headwaters of the SRB, upstream of multiple water control structures. The Catez streamflow gauge, given its location near the Slovenia–Croatia border, provides important information regarding streamflow for downstream SR water managers and planners. While the Catez streamflow gauge likely experienced impairments beginning in the ~1950s, and increasing in the past ~20 years due to the construction of multiple water control structures, the temporal behavior of the reconstruction was statistically similar to the Jesenice streamflow gauge. Additionally, both reconstructions displayed exceptional skill when evaluated with multiple statistical tests. While we believe the Catez 1926 to 2012 streamflow reconstruction can be utilized to quantify observed-historic streamflow in comparison to paleo droughts and pluvial periods, to further validate the use of the Catez streamflow reconstruction, we repeated the reconstruction methods for two separate periods within the record. The first period (1926 to 1951) was selected based on the lack of impairments on the SR. As noted, the oldest water control structure located on the SR, Moste Dam, was constructed in 1952. Thus, the second period selected was 1952 to 2012 which aligned with a period of construction of multiple water control structures on the SR. Per Table 2, reconstruction skill exceeded established thresholds for each reconstruction. When compared to the reconstruction using the entire streamflow record (1926 to 2012), each of the three SLR models retained varying scPDSI proxies. However, while the reconstruction skill was “strong” for each split sample SLR model, the reconstruction skill observed “pre-impairments” (1926 to 1951) was superior to the reconstruction skill observed “post-impairments” (1952 to 2012). Perhaps this drop in reconstruction skill can be explained by the regulation of SR streamflow beginning in the early 1950s. The SLR reconstruction model based on the 1926 to 1951 period of record was tested using scPDSI proxies from the 1952 to 2012 period of record, resulting in an R2 of 0.72. This process (calibration of the SLR model for one period and testing of the SLR model for another period) was repeated using the SLR reconstruction model based on the 1952 to 2012 period of record and was tested using scPDSI proxies from the 1926 to 1951 period of record, resulting in an R2 of 0.48. Thus, each model maintained strong statistical skills when moving from calibration to testing.
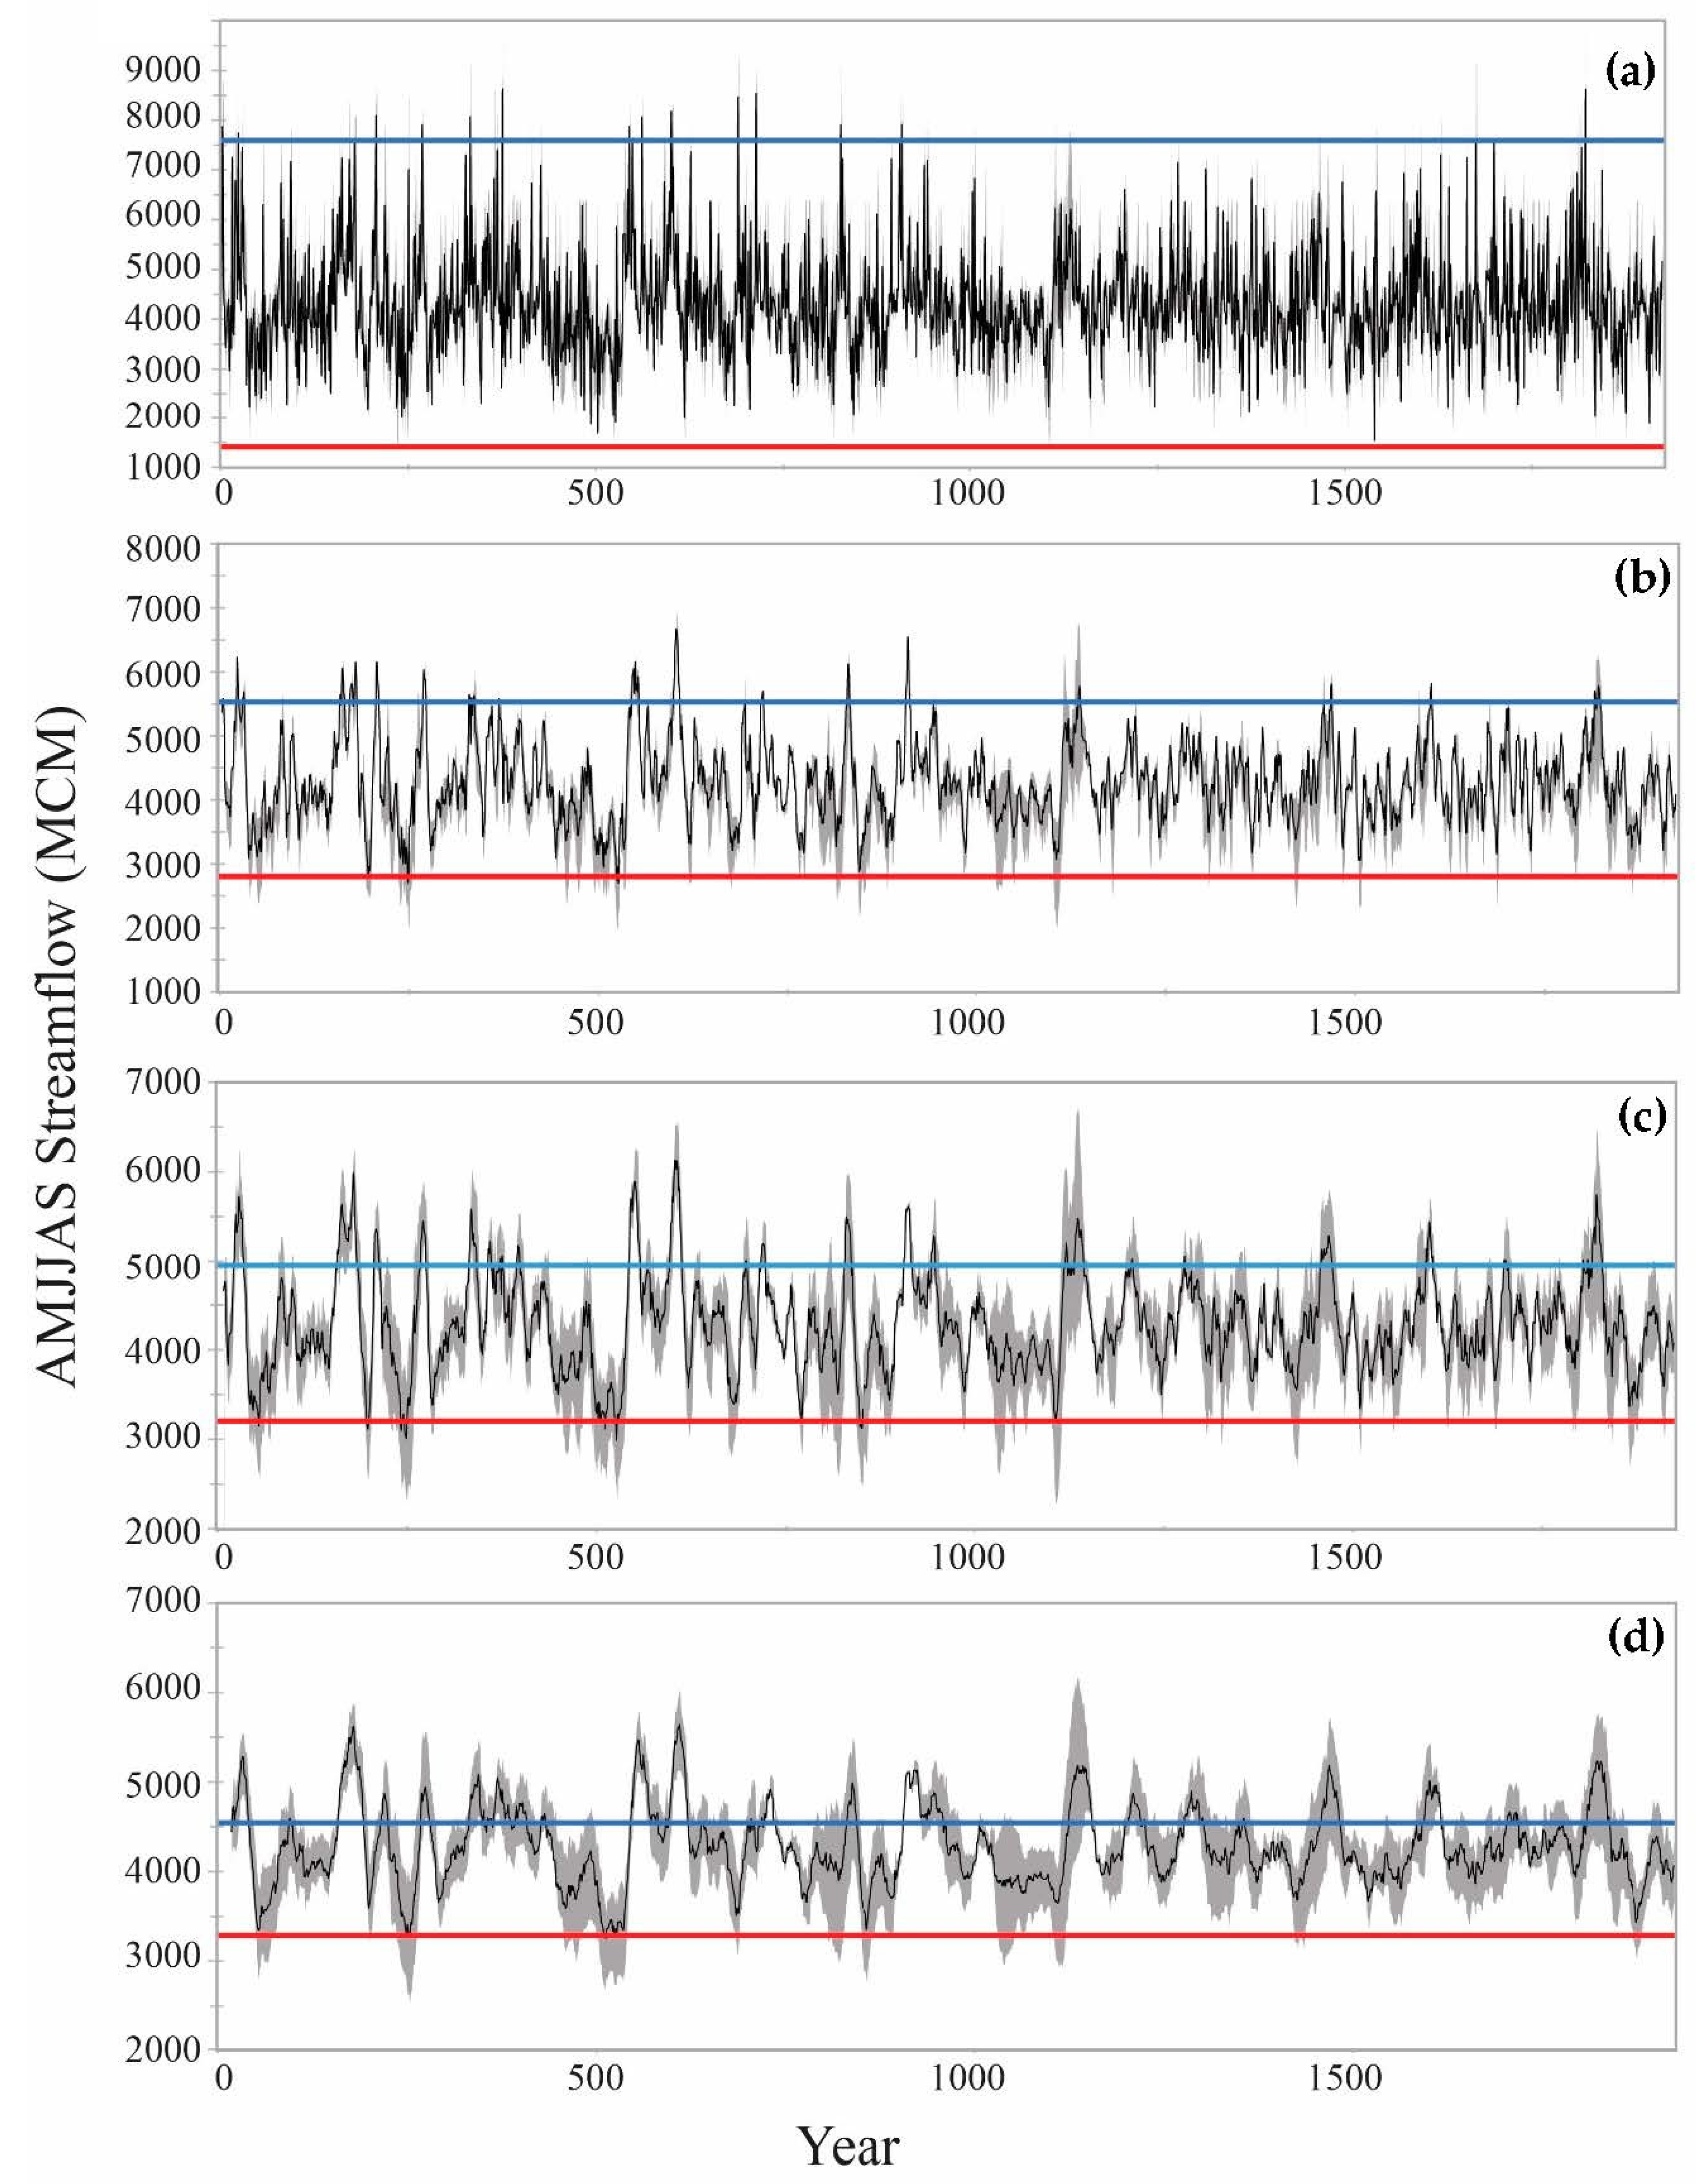
Given the statistical strength of each of the three Catez gauge SLR reconstruction models, we used all three models to capture the uncertainty associated with reconstructed streamflow. We extracted annual (0 to 1925) AMJJAS reconstructed streamflow for each of the three SLR models and, again, performed bias correction. We ended reconstructed data in 1925 to avoid overlapping with observed-historic data (1926 to 2020). Using the bias-corrected reconstructed streamflow from the three models, for each year (annual 0 to 1925), we calculated annual extremes (1st and 99th percentiles). The reconstructed (0 to 1925) AMJJAS annual extremes (1% and 99%—gray shading with average—black line) are provided with the observed-historic (1926 to 2020) AMJJAS maximum (dark blue line) and minimum (red line) for the annual (Figure 5a), 5-year end-year filter (Figure 5b), 10-year end-year filter (Figure 5c), and 20-year end-year filter (Figure 5d) AMJJAS streamflows.
A noticeable “shift downward” of the dark blue pluvial line (i.e., observed-historic AMJJAS maximum) as we increased the filter period (annual to 5-year end-year to 10-year end-year to 20-year end-year) was apparent (Figure 5). Thus, it appears paleo pluvial (wet) periods frequently exceed what was the maximum in the observed-historic record (1926 to 2020). The United States Army Corps of Engineers (USACE), in cooperation with the Engineer Research and Development Center—Coastal and Hydraulics Laboratory, developed the Bayesian estimation and fitting software, RMC-BestFit [27]. For the 5-year end-year, 10-year end-year, and 20-year end-year bias-corrected reconstructed (0 to 1925) AMJJAS streamflow (Figure 5b–d), we evaluated 13 distributions using RMC-BestFit. For each filter, the generalized extreme value (GEV) distribution was selected based on the GEV displaying the lowest root mean square error (RMSE). We next performed a Bayesian estimation utilizing the generalized extreme value (GEV) distribution. When evaluating the most extreme pluvial in the observed-historic record (1926 to 2020) while using the paleo record’s (0 to 1925) GEV distribution, the 5-year filter’s return period was ~30 years, the 10-year filter’s return period was ~10 years, and the 20-year filter’s return period was <5 years. Simply put, the most extreme 10-year pluvial event in the observed-historic record has a one-in-ten chance of occurring in any given year in the paleo record. This reveals the increased moisture in the paleo record (e.g., higher streamflow) when compared to the observed-historic record.
When evaluating the observed-historic record (1926 to 2020), a statistically significant [greater than 99% (p < 0.01)] difference in streamflow was determined when applying the non-parametric rank-sum test [28]. We divided the 95-year period of record from 1926 to 1972 (47 years) and 1973 to 2020 (48 years). For the 1926 to 1972 period of record, the average AMJJAS streamflow was 4553 MCM, while the median was 4252 MCM. For the 1973 to 2020 period of record, the average AMJJAS streamflow was 3628 MCM, while the median was 3743 MCM. The decline in SR streamflow was confirmed in several studies [29,30,31] and was associated with a changing climate (i.e., increased temperatures and declining snowpack). The 2003 drought (AMJJAS streamflow = 1411 MCM) was extraordinary, as was the 1937 pluvial (AMJJAS streamflow = 7594 MCM). Thus, we are observing extreme events (droughts and pluvials) in the observed-historic (1926 to 2020) record. We combined reconstructed (average of three reconstructions from 0 to 1925) and observed-historic (1926 to 2020) AMJJAS streamflow and applied filters (5-year end-year, 6-year-end-year, etc., to 30-year end-year) (Table 3). For each filter, the lowest 20 AMJJAS streamflow end-years, for the combined reconstructed and observed-historic record, were ranked. Table 3 provides ranked end-years since 2000 (i.e., recent drought periods). The 2003 end-year was consistently ranked from the 5-year to the 15-year filter (except the 10-year filter) (Table 3). The 2012 end-year 21-year drought was ranked the lowest in the ~2000-year period of record (Table 3). The 2020 end-year (which represents the last year in the observed-historic period of record) was one of the most severe ~28 to 30-year drought periods (Table 3). It appears that the current ~30-year (1991 to 2020) drought is the lowest since the early 6th century (~527 AD). [32] identified two significant drought periods (~15th century and late 18th/early 19th century) when evaluating paleo records across Europe. While the current research identified the early 6th century as the driest in the SRB, a plausible explanation of the different periods of drought identified between the two studies was that (a) the current research focused on a specific (small) watershed and (b) seasonal (AMJJAS) streamflow was evaluated. The current research confirmed that the Catez gauge displayed similar reconstructed temporal behavior to the Jesenice gauge (considered unimpaired), which increased our confidence in evaluating the Catez gauge despite the operation of multiple water control structures upstream of the gauge that could impact streamflow variability. Perhaps future research should consider evaluating and reconstructing precipitation to confirm the recent multi-year droughts and reduction of pluvial events in the observed-historic record. This would assist in determining if the recent, lower streamflows are associated with a changing climate, upstream impairments, or some combination of both.

Author Contributions

Conceptualization, G.T.; software, A.O.; validation, G.T.; formal analysis, G.T. and A.O.; investigation, G.T. and G.F.; resources, G.T. and N.B.; data curation, A.O., N.B. and G.F.; writing—original draft preparation, G.T.; writing—review and editing, N.B. and E.E.; visualization, E.E., A.O. and G.F.; supervision, G.T.; project administration, G.T.; funding acquisition, G.T. All authors have read and agreed to the published version of the manuscript.

Funding

G.T. is supported by the National Science Foundation (NSF), Paleo Perspectives on Climate Change (P2C2) program award 18059590; the US—Italy J. William Fulbright Scholar program; Università di Trento; and The University of Alabama, Alabama Water Institute. N.B. is supported by the Slovenian Research Agency (ARRS) through grants P2-0180, J6-4628, and N2-0313.

Data Availability Statement

The data supporting the results are available and archived at https://alabama.box.com/s/2lfvbzdn439301bof42j6vcn6r6x2cat. URL accessed on 27 June 2023.

Acknowledgments

Tootle acknowledges the kind support and use of resources of the Alabama Water Institute of The University of Alabama and wishes to thank the members of the J. William Fulbright Scholarship Board. The authors wish to thank Ray Lombardi, Department of Earth Sciences, University of Memphis, for assistance in applying RMC-BestFit.

Conflicts of Interest

The authors declare no conflict of interest. The funders had no role in the design of the study; in the collection, analyses, or interpretation of data; in the writing of the manuscript, or in the decision to publish the results.

References

  1. Leščešen, I.; Šraj, M.; Basarin, B.; Pavić, D.; Mesaroš, M.; Mudelsee, M. Regional Flood Frequency Analysis of the Sava River in South-Eastern Europe. Sustainability 2022, 14, 9282. [Google Scholar] [CrossRef]
  2. Müller-Plath, G.; Lüdecke, H.-J.; Lüning, S. Long-distance air pressure differences correlate with European rain. Sci. Rep. 2022, 12, 10191. [Google Scholar] [CrossRef] [PubMed]
  3. Kern, Z.; Németh, A.; Gulyás, M.H.; Popa, I.; Levanič, T.; Hatvani, I.G. Natural proxy records of temperature- and hydroclimate variability with annual resolution from the Northern Balkan–Carpathian region for the past millennium—Review & recalibration. Quat. Int. 2016, 415, 109–125. [Google Scholar] [CrossRef] [Green Version]
  4. Viorica, N.; Cătălin-Constantin, R.; Andrei, M.; Marian-Ionuț, Ș.; Ionel, P.; Monica, I. The first tree-ring reconstrruction of streamflow variability over the last ∼250 years in the Lower Danube. J. Hydrol. 2023, 617, 129150. [Google Scholar] [CrossRef]
  5. Nasreen, S.; Součková, M.; Godoy, M.R.V.; Singh, U.; Markonis, Y.; Kumar, R.; Rakovec, O.; Hanel, M. A 500-year annual runoff reconstruction for 14 selected European catchments. Earth Syst. Sci. Data 2022, 14, 4035–4056. [Google Scholar] [CrossRef]
  6. Cook, E.R.; Seager, R.; Kushnir, Y.; Briffa, K.R.; Büntgen, U.; Frank, D.; Krusic, P.J.; Tegel, W.; Van Der Schrier, G.; Andreu-Hayles, L.; et al. Old World megadroughts and pluvials during the Common Era. Sci. Adv. 2015, 1, e1500561. [Google Scholar] [CrossRef] [PubMed] [Green Version]
  7. Trlin, D.; Mikac, S.; Žmegač, A.; Orešković, M. Dendrohydrological Reconstructions Based on Tree-Ring Width (TRW) Chronologies of Narrow-Leaved Ash in the Sava River Basin (Croatia). Sustainability 2021, 13, 2408. [Google Scholar] [CrossRef]
  8. Trček, B.; Mesarec, B. Impact of the Hydroelectric Dam on Aquifer Recharge Processes in the Krško Field and the Vrbina Area: Evidence from Hydrogen and Oxygen Isotopes. Water 2023, 15, 412. [Google Scholar] [CrossRef]
  9. Predin, A.; Fike, M.; Pezdevšek, M.; Hren, G. Lost Energy of Water Spilled over Hydropower Dams. Sustainability 2021, 13, 9119. [Google Scholar] [CrossRef]
  10. Sodnik, J.; Kryžanowski, A.; Martinčič, M.; Mikoš, M. Torrential check dams as debris-flow sources. In Proceedings of the Landslide and Flood Hazard Assessment, Zagreb, Croatia, 6–9 March 2013. [Google Scholar]
  11. SLOCOLD (Slovenian National Committee on Large Dams). Available online: http://www.slocold.si/index.htm (accessed on 26 February 2023).
  12. Ho, M.; Lall, U.; Cook, E.R. Can a paleodrought record be used to reconstruct streamflow?: A case study for the Missouri River Basin. Water Resour. Res. 2016, 52, 5195–5212. [Google Scholar] [CrossRef] [Green Version]
  13. Ho, M.; Lall, U.; Sun, X.; Cook, E.R. Multiscale temporal variability and regional patterns in 555 years of conterminous U.S. streamflow. Water Resour. Res. 2017, 53, 3047–3066. [Google Scholar] [CrossRef]
  14. Formetta, G.; Tootle, G.; Bertoldi, G. Streamflow Reconstructions Using Tree-Ring Based Paleo Proxies for the Upper Adige River Basin (Italy). Hydrology 2022, 9, 8. [Google Scholar] [CrossRef]
  15. Formetta, G.; Tootle, G.; Therrell, M. Regional Reconstruction of Po River Basin (Italy) Streamflow. Hydrology 2022, 9, 163. [Google Scholar] [CrossRef]
  16. SEA (Slovenian Environment Agency). Available online: http://www.arso.gov.si/en/ (accessed on 26 February 2023).
  17. Hrvatin, M. Discharge Regimes in Slovenia. 1998. Available online: https://giam.zrc-sazu.si/sites/default/files/zbornik/hrvatin_38.pdf (accessed on 26 February 2023).
  18. Biondi, F.; Waikul, K. DENDROCLIM2002: A C++ program for statistical calibration of climate signals in tree-ring chronologies. Comput. Geosci. 2004, 30, 303–311. [Google Scholar] [CrossRef]
  19. Woodhouse, C.A. A 431-Yr Reconstruction of Western Colorado Snowpack from Tree Rings. J. Clim. 2003, 16, 1551–1561. [Google Scholar] [CrossRef]
  20. Vines, M.; Tootle, G.; Terry, L.; Elliott, E.; Corbin, J.; Harley, G.L.; Kam, J.; Sadeghi, S.; Therrell, M. A Paleo Perspective of Alabama and Florida (USA) Interstate Streamflow. Water 2021, 13, 657. [Google Scholar] [CrossRef]
  21. Anderson, S.; Ogle, R.; Tootle, G.; Oubeidillah, A. Tree-Ring Reconstructions of Streamflow for the Tennessee Valley. Hydrology 2019, 6, 34. [Google Scholar] [CrossRef] [Green Version]
  22. O’Brien, R.M. A Caution Regarding Rules of Thumb for Variance Inflation Factors. Qual. Quant. 2007, 41, 673–690. [Google Scholar] [CrossRef]
  23. Durbin, J.; Watson, G.S. Testing for serial correlation in least squares regression: I. Biometrika 1950, 37, 409–428. [Google Scholar]
  24. R Core Team. R: A language and environment for statistical computing. R Foundation for Statistical Computing, Vienna, Austria. 2018. Available online: http://www.R-project.org/ (accessed on 1 June 2020).
  25. Gudmundsson, L.; Bremnes, J.B.; Haugen, J.E.; Engen-Skaugen, T. Downscaling RCM precipitation to the station scale using statistical transformations—A comparison of methods. Hydrol. Earth Syst. Sci. 2012, 16, 3383–3390. [Google Scholar] [CrossRef] [Green Version]
  26. Robeson, S.M.; Maxwell, J.T.; Ficklin, D.L. Bias Correction of Paleoclimatic Reconstructions: A New Look at 1200+ Years of Upper Colorado River Flow. Geophys. Res. Lett. 2020, 47, e2019GL086689. [Google Scholar] [CrossRef]
  27. RMC-BestFit, USACE. Available online: https://www.rmc.usace.army.mil/Software/RMC-BestFit/ (accessed on 26 February 2023).
  28. Tootle, G.A.; Piechota, T.C.; Singh, A. Coupled oceanic-atmospheric variability and U.S. streamflow. Water Resour. Res. 2005, 41, W12408. [Google Scholar] [CrossRef] [Green Version]
  29. Oblak, J.; Kobold, M.; Šraj, M. The influence of climate change on discharge fluctuations in Slovenian rivers. Acta Geogr. Slov. 2021, 61-2, 155–169. [Google Scholar] [CrossRef]
  30. Bezak, N.; Brilly, M.; Šraj, M. Flood frequency analyses, statistical trends and seasonality analyses of discharge data: A case study of the Litija station on the Sava River. J. Flood Risk Manag. 2016, 9, 154–168. [Google Scholar] [CrossRef]
  31. De Luis, M.; Čufar, K.; Saz, M.A.; Longares, L.A.; Ceglar, A.; Kajfež-Bogataj, L. Trends in seasonal precipitation and temperature in Slovenia during 1951–2007. Reg. Environ. Chang. 2014, 14, 1801–1810. [Google Scholar] [CrossRef]
  32. Ionita, M.; Dima, M.; Nagavciuc, V.; Scholz, P.; Lohmann, G. Past megadroughts in central Europe were longer, more severe and less warm than modern droughts. Commun. Earth Environ. 2021, 2, 61. [Google Scholar] [CrossRef]
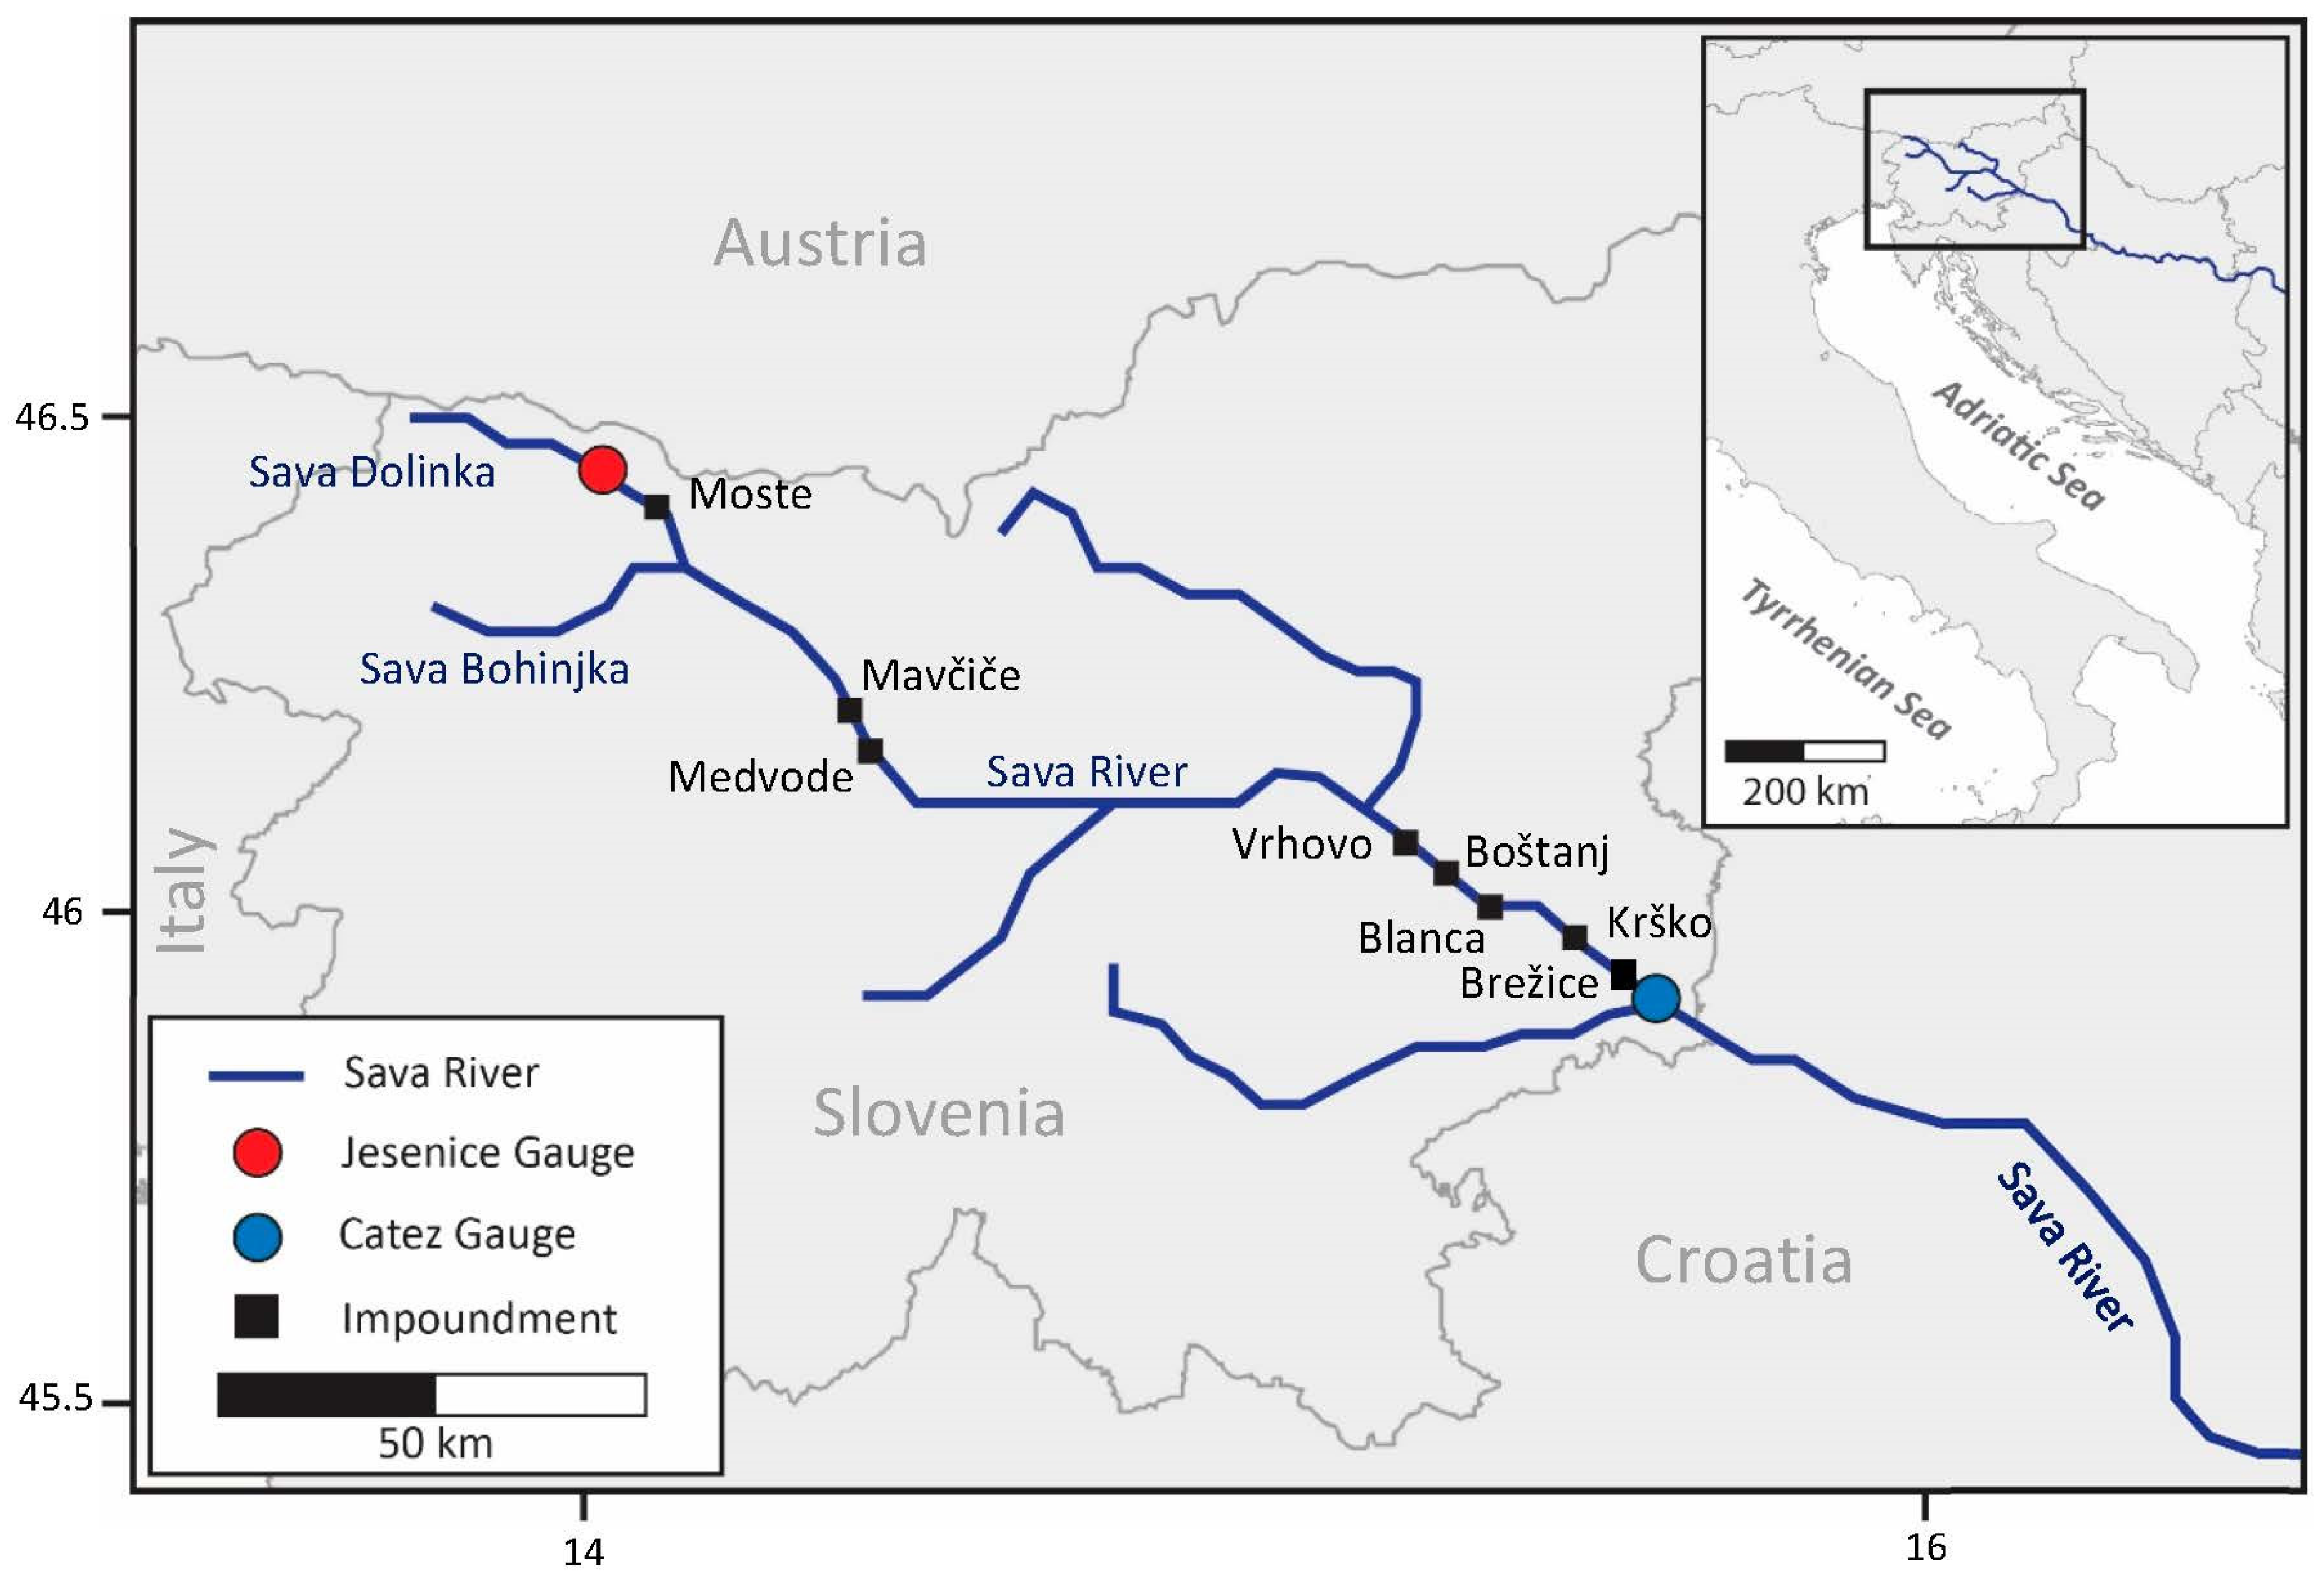
Figure 1. Location map showing the Jesenice and Cadez streamflow gauges (stations) and the eight (Brežice, Krško, Blanca, Boštanj, Vrhovo, Medvode, Mavčiče, and Moste) SR water control structures in Slovenia.
Hydrology 10 00138 g001
Figure 2. SLR model results. (a) Jesenice gauge AMJJAS streamflow observed-historic (blue line) versus reconstructed (green line) versus bias-corrected reconstructed (black) for overlapping period of record (1977 to 2012); (b) Catez gauge AMJJAS observed-historic (blue line) versus reconstructed (green line) versus bias-corrected reconstructed (black) for overlapping period of record (1926 to 2012).
Hydrology 10 00138 g002
Figure 3. Red circles represent scPDSI cells retained in the Jesenice SLR model, while blue circles represent scPDSI cells retained in the Catez SLR model. Black hollow circles represent scPDSI cells (249) evaluated for use in the reconstructions. The circular black line represents the 450 km search radius. Note, scPDSI cell #122 was retained in both the Jesenice and Catez SLR models.
Hydrology 10 00138 g003
Figure 4. Reconstructed bias-corrected annual AMJJAS streamflow (standardized) with a 10-year end-year filter for the Jesenice gauge (red line) and Catez gauge (black line).
Hydrology 10 00138 g004
Figure 5. AMJJAS streamflow extremes (1st to 99th percentile—gray shading with the black line representing the average) when combining results from three bias-corrected reconstruction models. The dark blue line represents the maximum, and the red line represents the minimum observed-historic AMJJAS streamflow for (a) annual (b) 5-year end-year filter (c) 10-year end-year filter and (d) 20-year end-year filter. Reconstructed streamflow ending in 1925 is provided in the figure.
Hydrology 10 00138 g005
Table 1. River (station), drainage Area (DA—km2), average annual flowrate (MCM), reconstruction period, R2, R2—predicted, variation inflation factor (VIF), Durbin–Watson, and regression equation for regression model (scPDSI proxy cell number in parenthesis).
River
(Station)
DA (km2)Average Annual Flowrate (MCM)Reconstruction
Period
R2 R2—PredictedVIFDurbin–WatsonSign TestRegression Equation
Sava Dolinka
(Jesenice)
2581721977–20120.640.551.2 (pass)1.76 (pass)19/17 (pass)Q = 192.05 + 11.53 * #112
+ 10.26 * #122 + 5.83 * #133
Sava
(Catez)
10,18640281926–20120.540.501.2 (pass)2.00 (pass)47/40 (pass)Q = 4132.4 + 172.3 * #77
+ 264.3 * #122 + 109.0 * #146
Table 2. River—station, reconstruction period, R2, R2—predicted, variation inflation factor (VIF), Durbin–Watson, and regression equation for regression model (scPDSI proxy cell number in parenthesis).
River
(Station)
Reconstruction
Period
R2 R2—PredictedVIFDurbin–WatsonSign TestRegression Equation
Sava
(Catez)
1926–19510.740.641.9 (pass)2.25 (pass)14/12 (pass)Q = 4553 + 270.7 * #90
+ 203.7 * #145
Sava
(Catez)
1952–20120.500.451.2 (pass)2.26 (pass)33/28 (pass)Q = 3939.9 + 288.8 * #132
+ 175.6 * #167
Table 3. AMJJAS streamflow (with end-year 2000 to 2020) which ranked in the lowest ~1% (lowest 20 streamflows) of the ~2000-year record when combining reconstructed and historic-observed AMJJAS streamflow. The end-year and ranking based on filter length (5- to 30-year) are provided.
End Year5-YearEnd Year6-YearEnd Year7-YearEnd Year8-YearEnd Year9-YearEnd Year10-Year
2003520036200322007920079200919
20046200518 200410200410
200315200315
End Year11-yearEnd Year12-yearEnd Year13-yearEnd Year14-yearEnd Year15-yearEnd Year16-year
200342003320125200352011620123
200782008920038201292012820075
20111120049201310200414200819
200414200916200412200715
201218 200518200320
End Year17-yearEnd Year18-yearEnd Year19-yearEnd Year20-yearEnd Year21-yearEnd Year22-yearEnd Year23-year
201372007920081320126201212012320123
2008820091220181420119202072013820139
20079201714201116201613201715201813201911
201214200818 201914201117201114202015
201620 200917201318202016201419
End Year24-yearEnd Year25-yearEnd Year26-yearEnd Year27-yearEnd Year28-yearEnd Year29-yearEnd Year30-year
20204201442017520187202062020620209
201352016112016122017920198201813201913
20151220131220181420161520179201914201820
201213201717201517201917201813
201618
Disclaimer/Publisher’s Note: The statements, opinions and data contained in all publications are solely those of the individual author(s) and contributor(s) and not of MDPI and/or the editor(s). MDPI and/or the editor(s) disclaim responsibility for any injury to people or property resulting from any ideas, methods, instructions or products referred to in the content.