Article

Modeling Various Drought Time Scales via a Merged Artificial Neural Network with a Firefly Algorithm

Department of Physical Geography and Ecosystem Science, Lund University, Sölvegatan 12, SE-223 62 Lund, Sweden
Hydrology 2023, 10(3), 58; https://doi.org/10.3390/hydrology10030058
Submission received: 10 January 2023 / Revised: 23 February 2023 / Accepted: 25 February 2023 / Published: 27 February 2023
(This article belongs to the Section Hydrological and Hydrodynamic Processes and Modelling)

Abstract

:
Drought monitoring and prediction have important roles in various aspects of hydrological studies. In the current research, the standardized precipitation index (SPI) was monitored and predicted in Peru between 1990 and 2015. The current study proposed a hybrid model, called ANN-FA, for SPI prediction in various time scales (SPI3, SPI6, SPI18, and SPI24). A state-of-the-art firefly algorithm (FA) has been documented as a powerful tool to support hydrological modeling issues. The ANN-FA uses an artificial neural network (ANN) which is coupled with FA for Lima SPI prediction via other stations. Through the intelligent utilization of SPI series from neighbors’ stations as model inputs, the suggested approach might be used to forecast SPI at various time scales in a meteorological station with insufficient data. To conduct this, the SPI3, SPI6, SPI18, and SPI24 were modeled in Lima meteorological station using other meteorological stations’ datasets in Peru. Various error criteria were employed to investigate the performance of the ANN-FA model. Results showed that the ANN-FA is an effective and promising approach for drought prediction and also a multi-station strategy is an effective strategy for SPI prediction in the meteorological station with a lack of data. The results of the current study showed that the ANN-FA approach can help to predict drought with the mean absolute error = 0.22, root mean square error = 0.29, the Pearson correlation coefficient = 0.94, and index of agreement = 0.97 at the testing phase of best estimation (SPI3).

1. Introduction

A drought is a climatological event that has a detrimental impact on human existence by limiting the availability of water [1]. There have been steady changes in drought indices throughout the last decades [2]. It may have disastrous effects on the economy, agriculture, water supply, ecosystems, public health, and watershed health. It has substantial effects on the amount and water quantity and quality on local and global scales, which may result in starvation, environmental, or even human catastrophe [3,4]. Using a collection of meteorological, agricultural, hydrological, or even socioeconomic data, the appropriate indices are computed to assess the severity of drought [5,6,7]. Meteorological drought indicators such as air temperature and precipitation are often used to compute a drought index. There are several drought indices, including the standardized precipitation index (SPI) [8], the drought area index (DAI) [9], the Palmer drought severity index (PDSI [10], and the most recently developed standardized precipitation evapotranspiration index (SPEI) [11]). While the DAI and SPI calculate based on time series data of precipitation, the other drought indices also can be derived from time series data of meteorological/hydrological variables. The temporal scale of an indicator is also significant when evaluating the effects of drought. For example, an SPI with a monthly scale (i.e., SPI1) indicates the monthly fluctuation of wet and dry periods relative to a region’s long-term mean precipitation. Longer time scales, such as SPI3, SPI6, and SPI12, display precipitation variations over the last 3, 6, and 9 months, which may be used as indicators of prolonged wet or dry periods. Although they indicate meteorological drought conditions, they may be used to manage agricultural drought and water resources.
Drought prediction is vital for water resource management, agriculture products, monitoring environmental changes, and the health of the ecosystem [12]. No global strategy can outperform all models in all fields of study; thus, it is required to examine each case individually, analyzing the performance of each technique or the combination of many techniques in each research field [13]. Due to the complexity and non-linearity of the drought process, simulations using non-linear time series data are necessary. Consequently, machine learning (ML) systems for drought forecasting have attracted considerable interest [14,15]. In addition, several types of research have shown that AI algorithms outperform conventional approaches [16,17,18,19], such as artificial neural network (ANN) [20], support vector machines (SVMs) [21], random forests [22], and the adaptive neuro-fuzzy inference system (ANFIS) [23], which are examples of these ML systems. In recent decades, different developed types of ML approaches have been widely used for drought modeling tasks; for example, Inoubli et al. [24] investigated the ability of the LSTM model for SPEI forecasting in East Azerbaijan province in Iran. They resulted in R2 = 0.91 and RMSE = 0.03 for SPEI-3 and SPEI-6 forecasting [24]. Xu et al. [25] coupled an autoregressive integrated moving average (ARIMA) with the LSTM model for SPEI forecasting in China. They also compared the ability of a coupled ARIMA-LSTM model with support vector machine regression (SVR), ARIMA coupled with SVR, standalone ARIMA, and standalone LSTM models. They also used 1-month and 2-month lag times for forecasting SPEI-1, SPEI-3, SPEI-6, SPEI-12, and SPEI-24, and the proposed approach (ARIMA-LSTM) reported a range of RMSE between 0.037 and 0.479 and from 1.652 to 1.896 for drought forecasting in different time scales for 1-month and 2-month lag times, respectively [25]. The LSTM model was used for SPEI1 and SPEI3 forecasting in the New South Wales region (Australia). The result proved R2 = 0.99 for the LSTM model in drought forecasting; also, the LTM model was compared with other types of machine learning-based models such as artificial neural network (ANN) and random forest (RF) approaches [26].
Given the significance of a drought’s impact on water resource management, human life, and the environment, previous studies have been conducted to improve the precision of drought simulation approaches. To this end, the performance of various ML models, including ANN (e.g., [27,28,29,30]), support vector machine (SVM; e.g., [31,32]), RF (e.g., [33]) and long short-term memory (LSTM; e.g., [34]). In the most recent research, hybrid ML models coupled with optimization algorithms have been built and applied successfully to address drought prediction issues (e.g., [35,36,37]). This combined method benefits from one or multiple optimization algorithms during the training phase; therefore, they train with a boosting optimization approach, which leads to error reduction. These coupled models also can find all possible solutions for an issue and, therefore, they can choose the solution with minimum cost function (minimum error) to have a high accuracy time series prediction.
The coupled ML techniques have been developed by merging optimization algorithms with ML models to train ML models based on an optimized strategy. Previous studies have proved that coupled ML models with meta-heuristic optimization algorithms are more capable than standalone ML models in hydrological forecasting [38,39,40]. Therefore, using an optimization algorithm to boost the ability of ML models is a beneficial approach for drought forecasting. Firefly optimization algorithm (FA) as one of the nature-inspired algorithms has been successfully contributed to drought forecasting [41], flood studies [42,43], reference evapotranspiration estimation [44,45], rainfall pattern prediction [46], and groundwater studies [47,48]. Previous research has proven the performance of coupled ML techniques for drought modeling, however, the usage of hybrid models based on ANN coupled with the firefly algorithm (ANN-FA) has not yet been explored. On the other hand, the majority of ML models have complex structure construction issues that have not been well investigated in earlier research. This paper explores the topic of drought prediction using the ANN-FA method, with an applied example via code-based demonstration in the MATLAB environment. The ANN-FA model uses the multi-station strategy of the SPI employing ten meteorological stations dispersed across Peru.

2. Materials and Methods
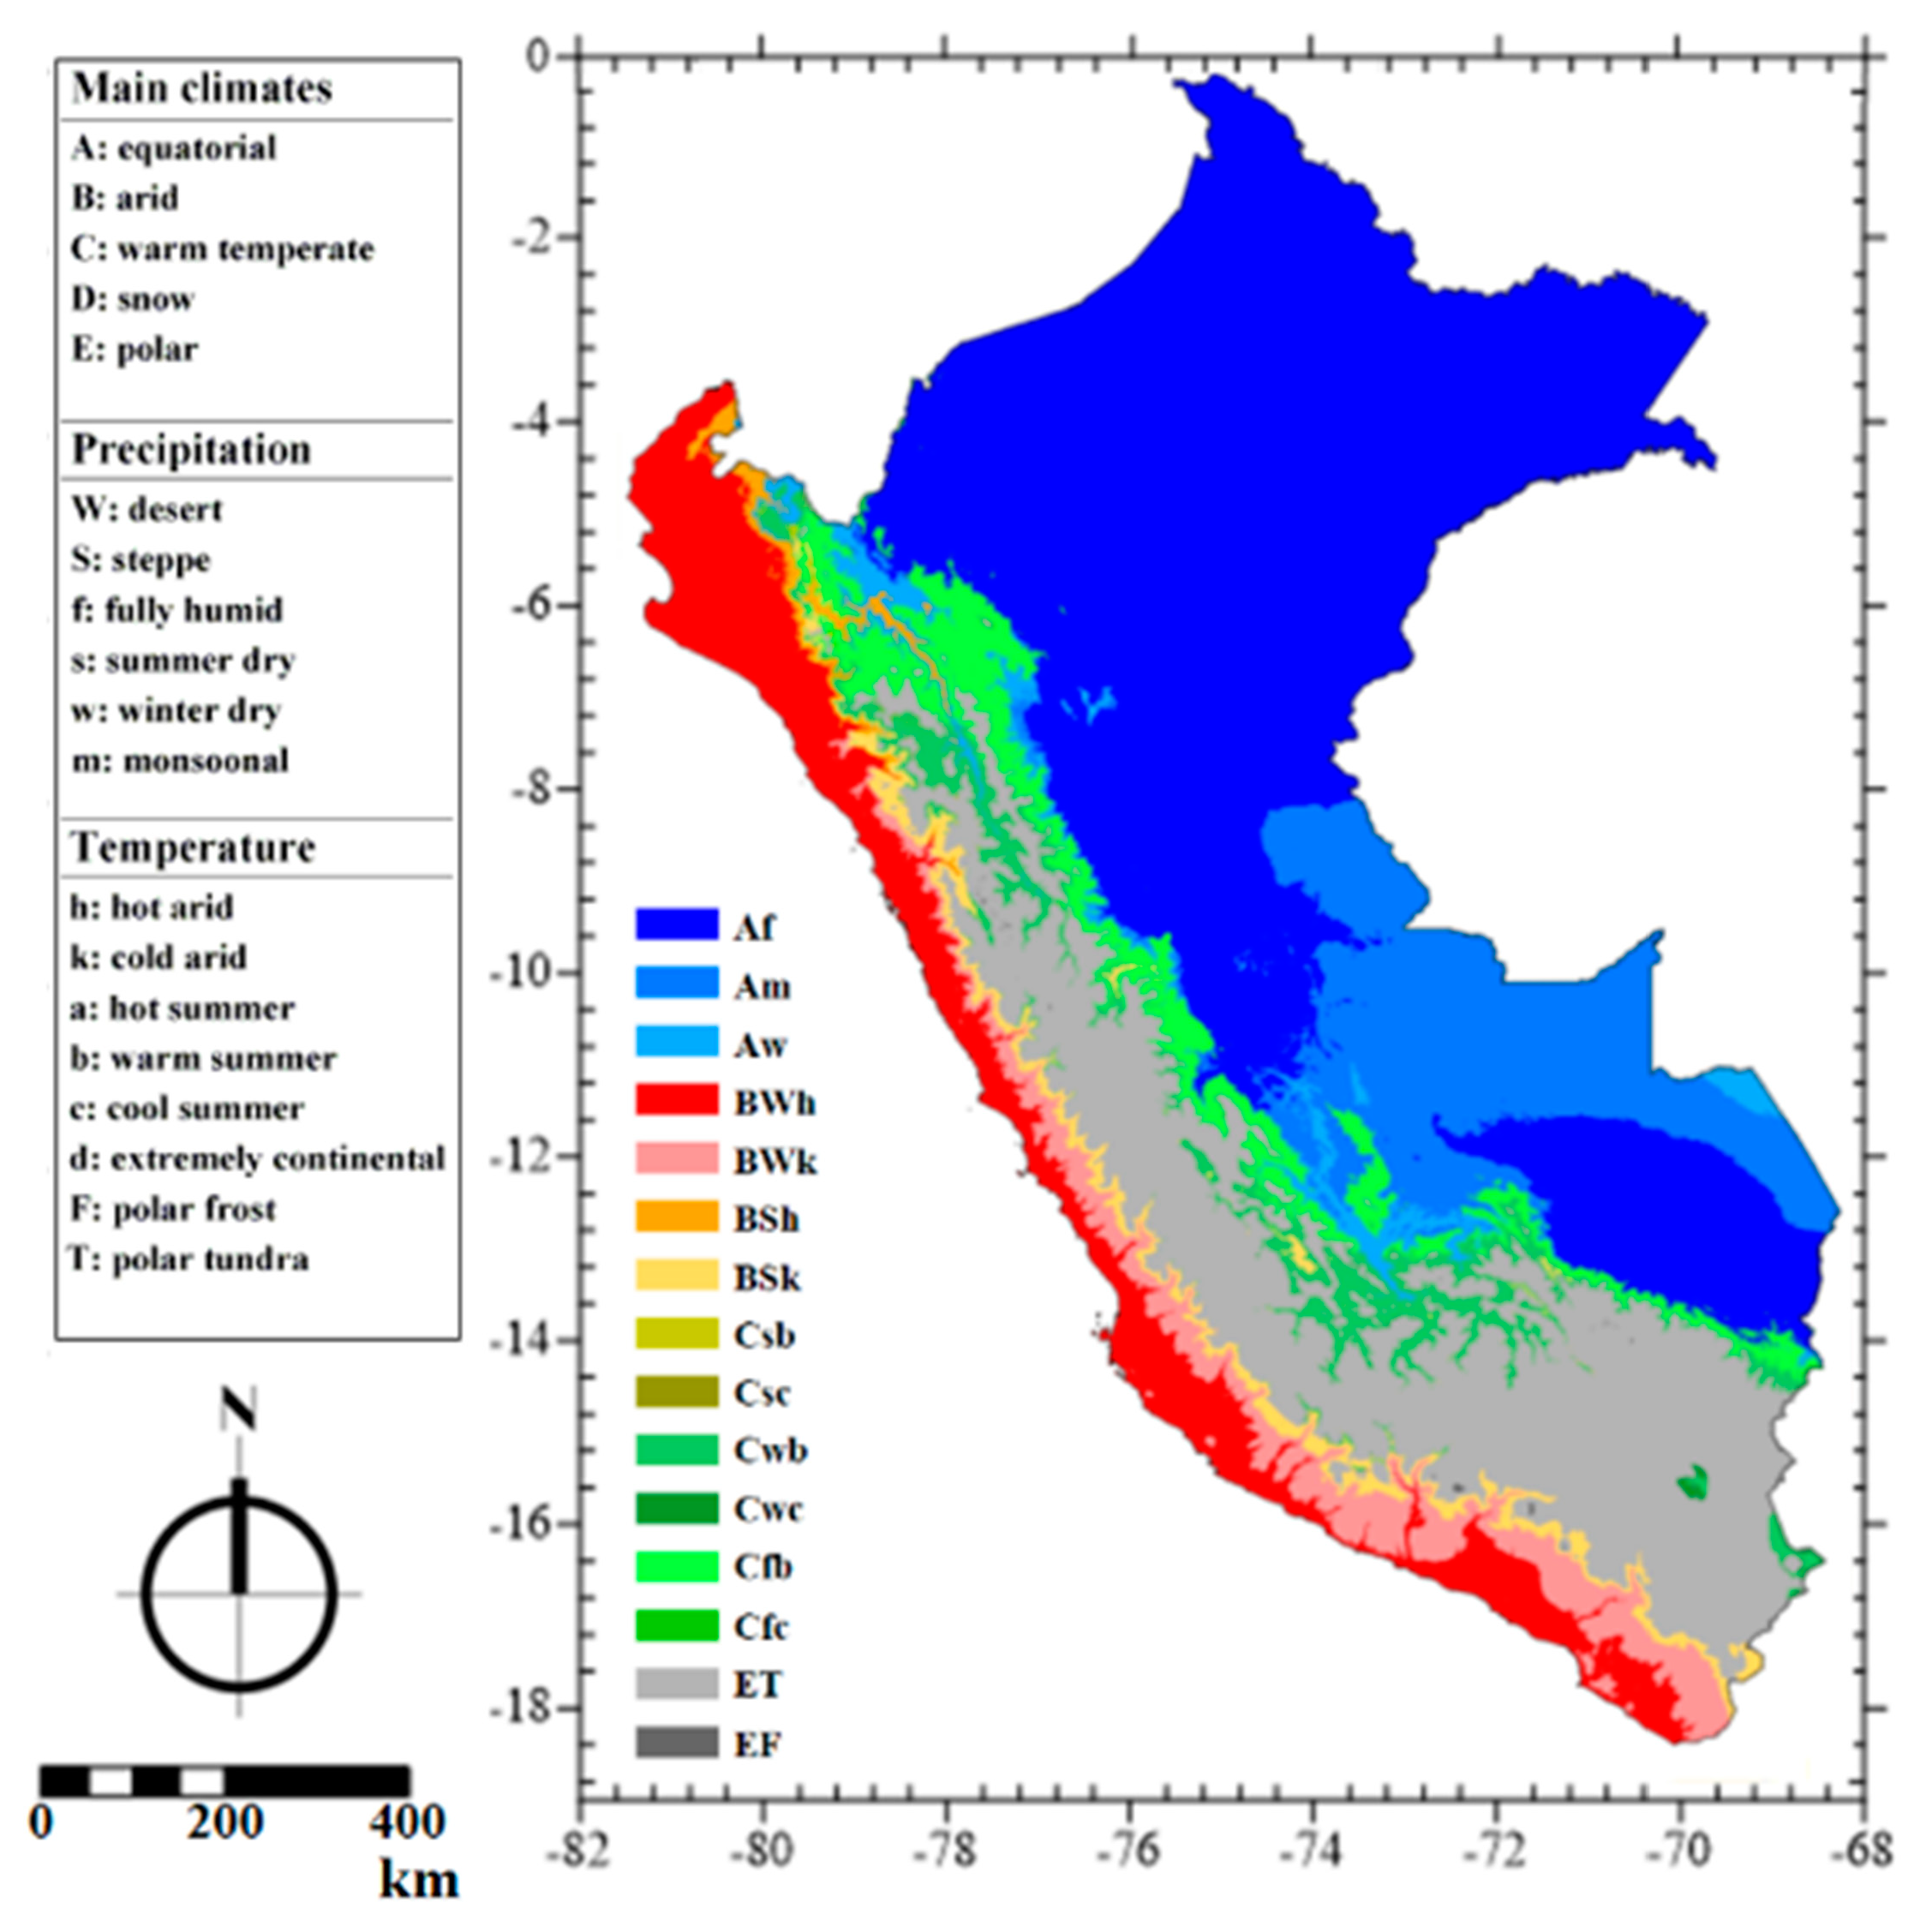
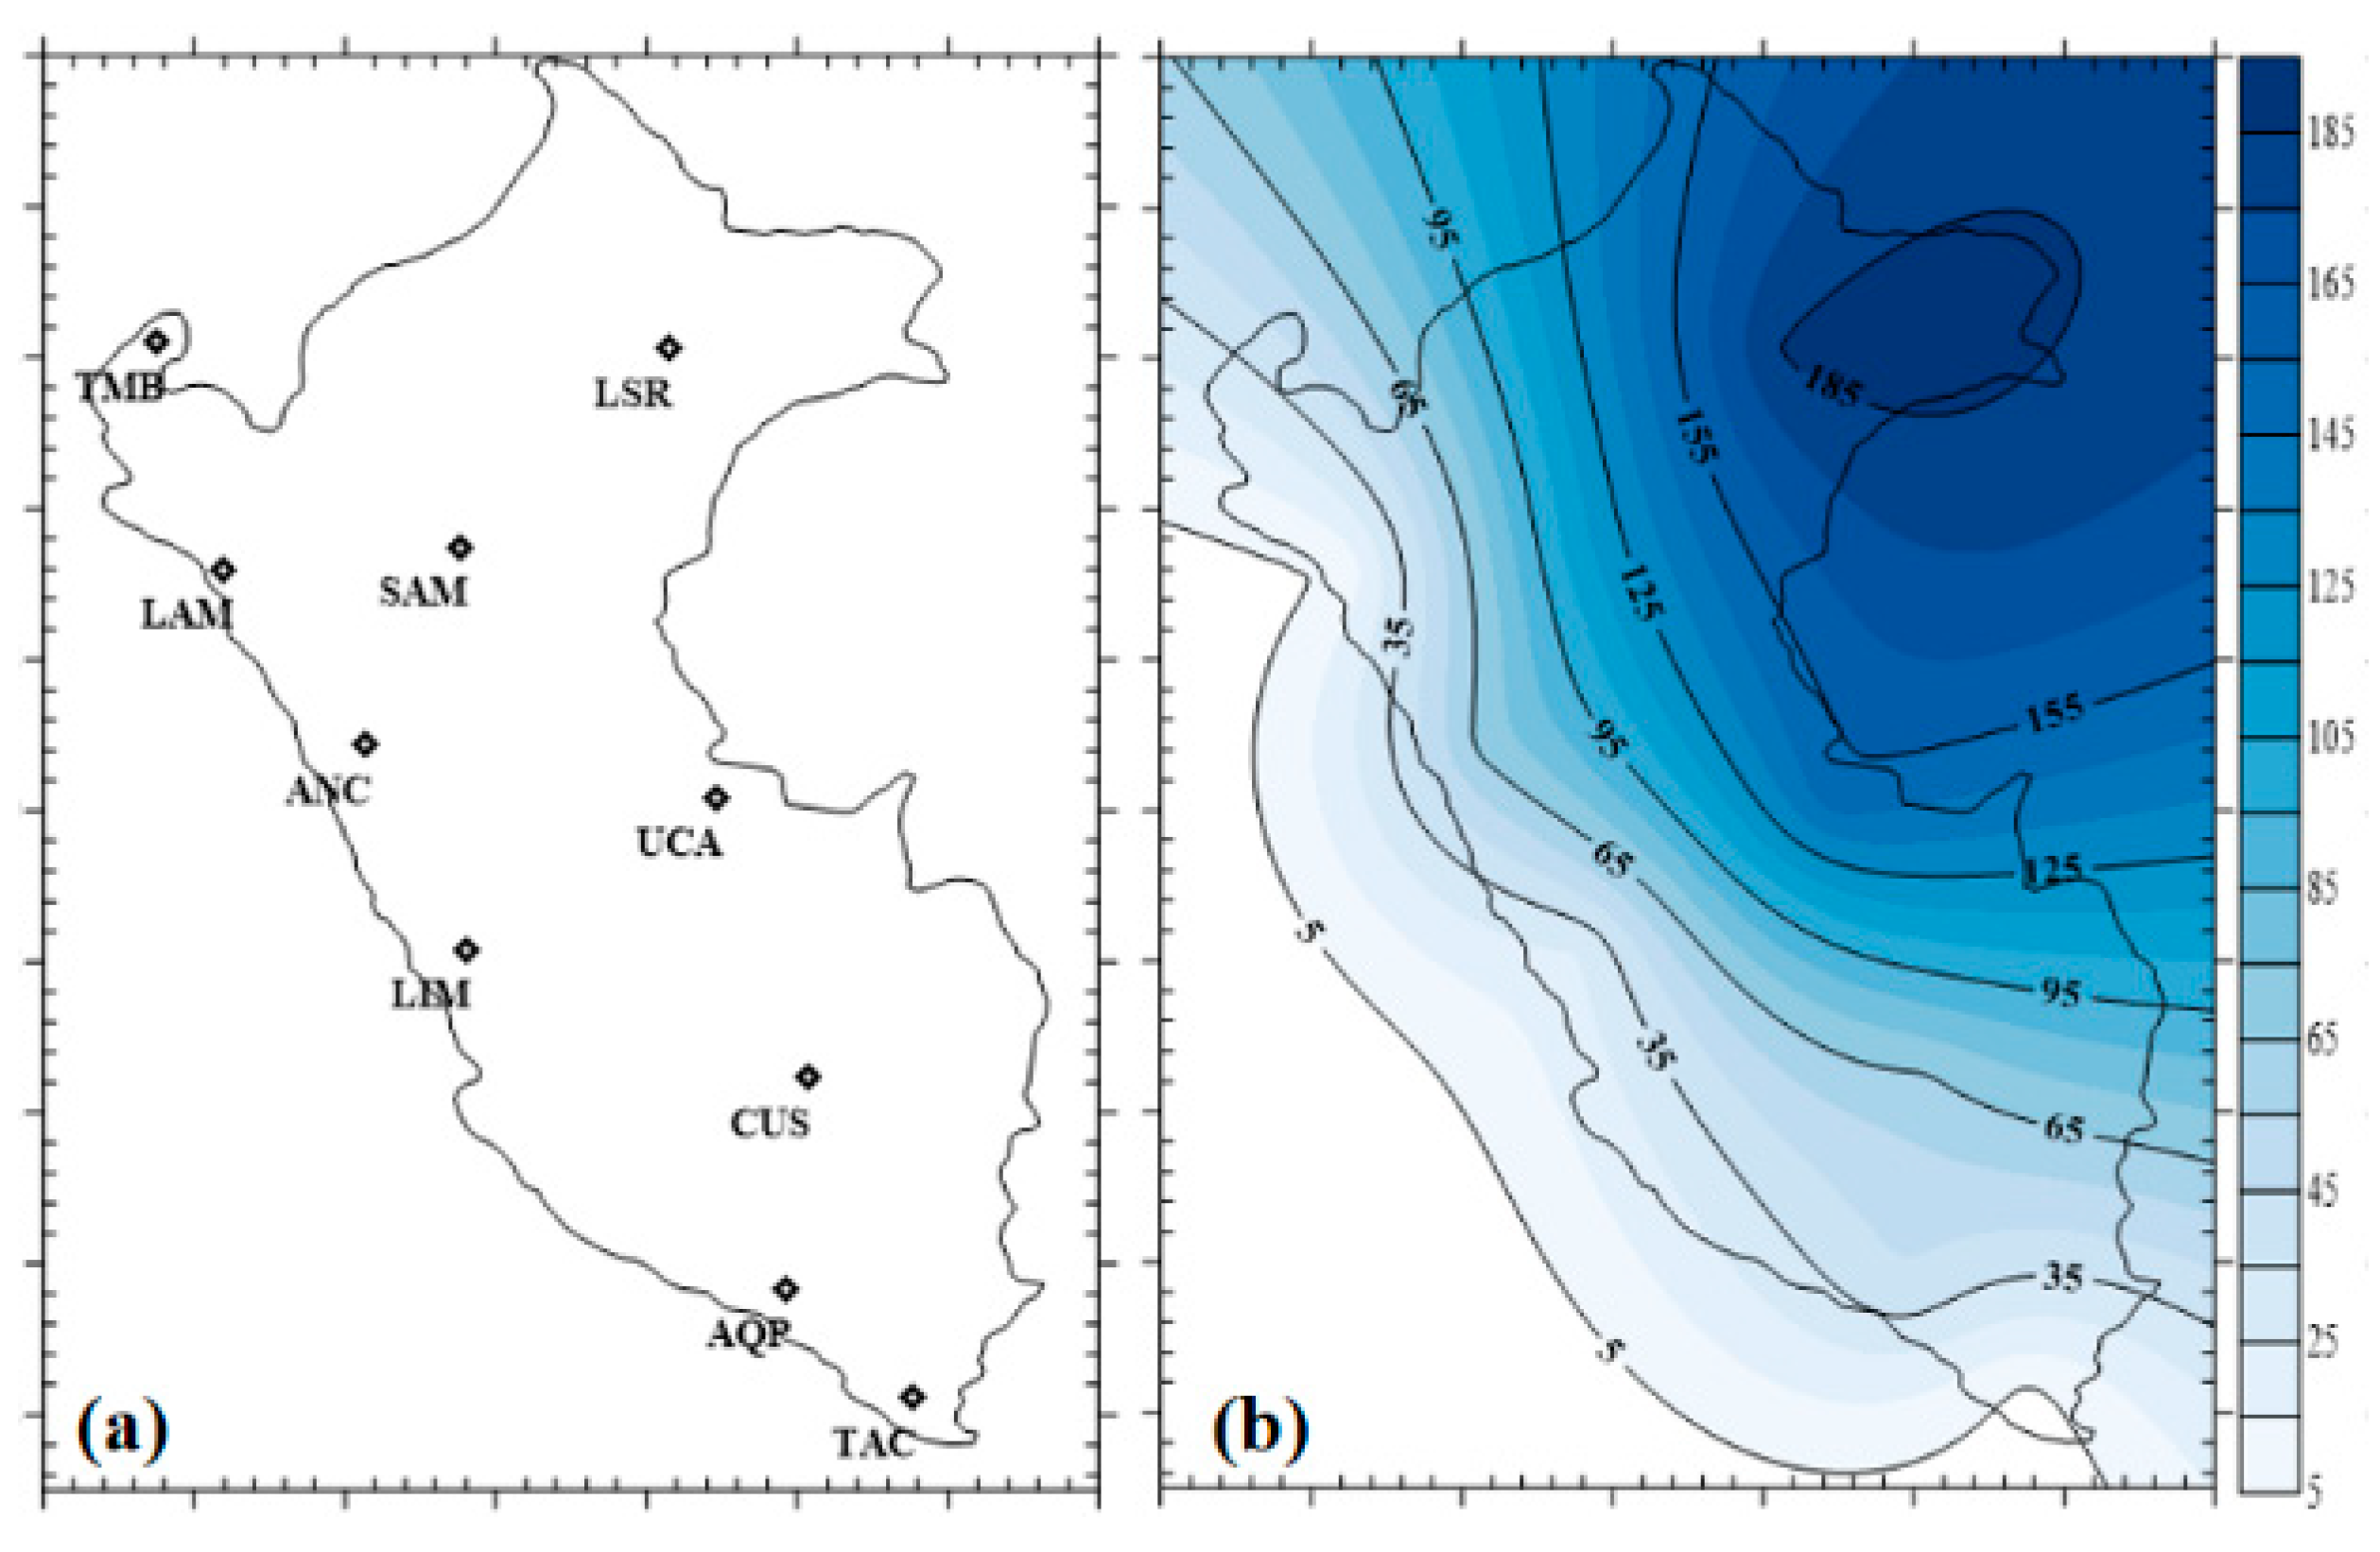
2.1. Study Area

In this study, the precipitation of ten meteorological stations in Peru at a monthly time scale is considered for drought analysis. Peru is located between 0° and 18° S latitude and 69° and 81° N longitude in the South American continent (Figure 1). There are fifty-four hydrological watersheds in Peru, fifty-two of which are open watersheds that drain to the Pacific Ocean and two that flow to the Atlantic Ocean through the Amazons. According to the Koppen–Geiger climatic classification map (Figure 1), there are four main climate classifications and fifteen minor ones in the study areas (Peru).

2.2. Data Used

This study was implemented based on meteorological datasets which were obtained from the Republic of Peru’s National Service of Meteorology and Hydrology (SENAMHI) from 10 meteorological stations from January 1990 to 2015. The observed precipitation dataset on a monthly scale was used for calculating drought in 3-month, 6-month, 18-month, and 24-month time steps. Table 1 displays the statistical features of precipitation time series data for the specified station. The locations of the stations are given in Figure 2a. In addition, Figure 2 shows the locations of the chosen stations as well as the monthly total of the precipitation. According to Figure 2b, the quantity of monthly precipitation steadily rises from southwest to northeast. Consistent with the findings of Viale and Nunez [52], it is evident that the hilly terrain of the Andes has a significant impact on precipitation.
The standardized precipitation index (SPI) was calculated for all studied regions based on precipitation data in 3-month (SPI3), 6-month (SPI6), 18-month (SPI18), and 24-month (SPI24) time windows. It was proposed by Mckee et al. [8]. The gamma probability distribution was used to calculate SPI [53] and the gamma distribution was fitted to the monthly precipitation data for this aim (for more information about SPI calculation, see [54]). Table 2 lists the SPI thresholds based on each drought phase used in the current study.

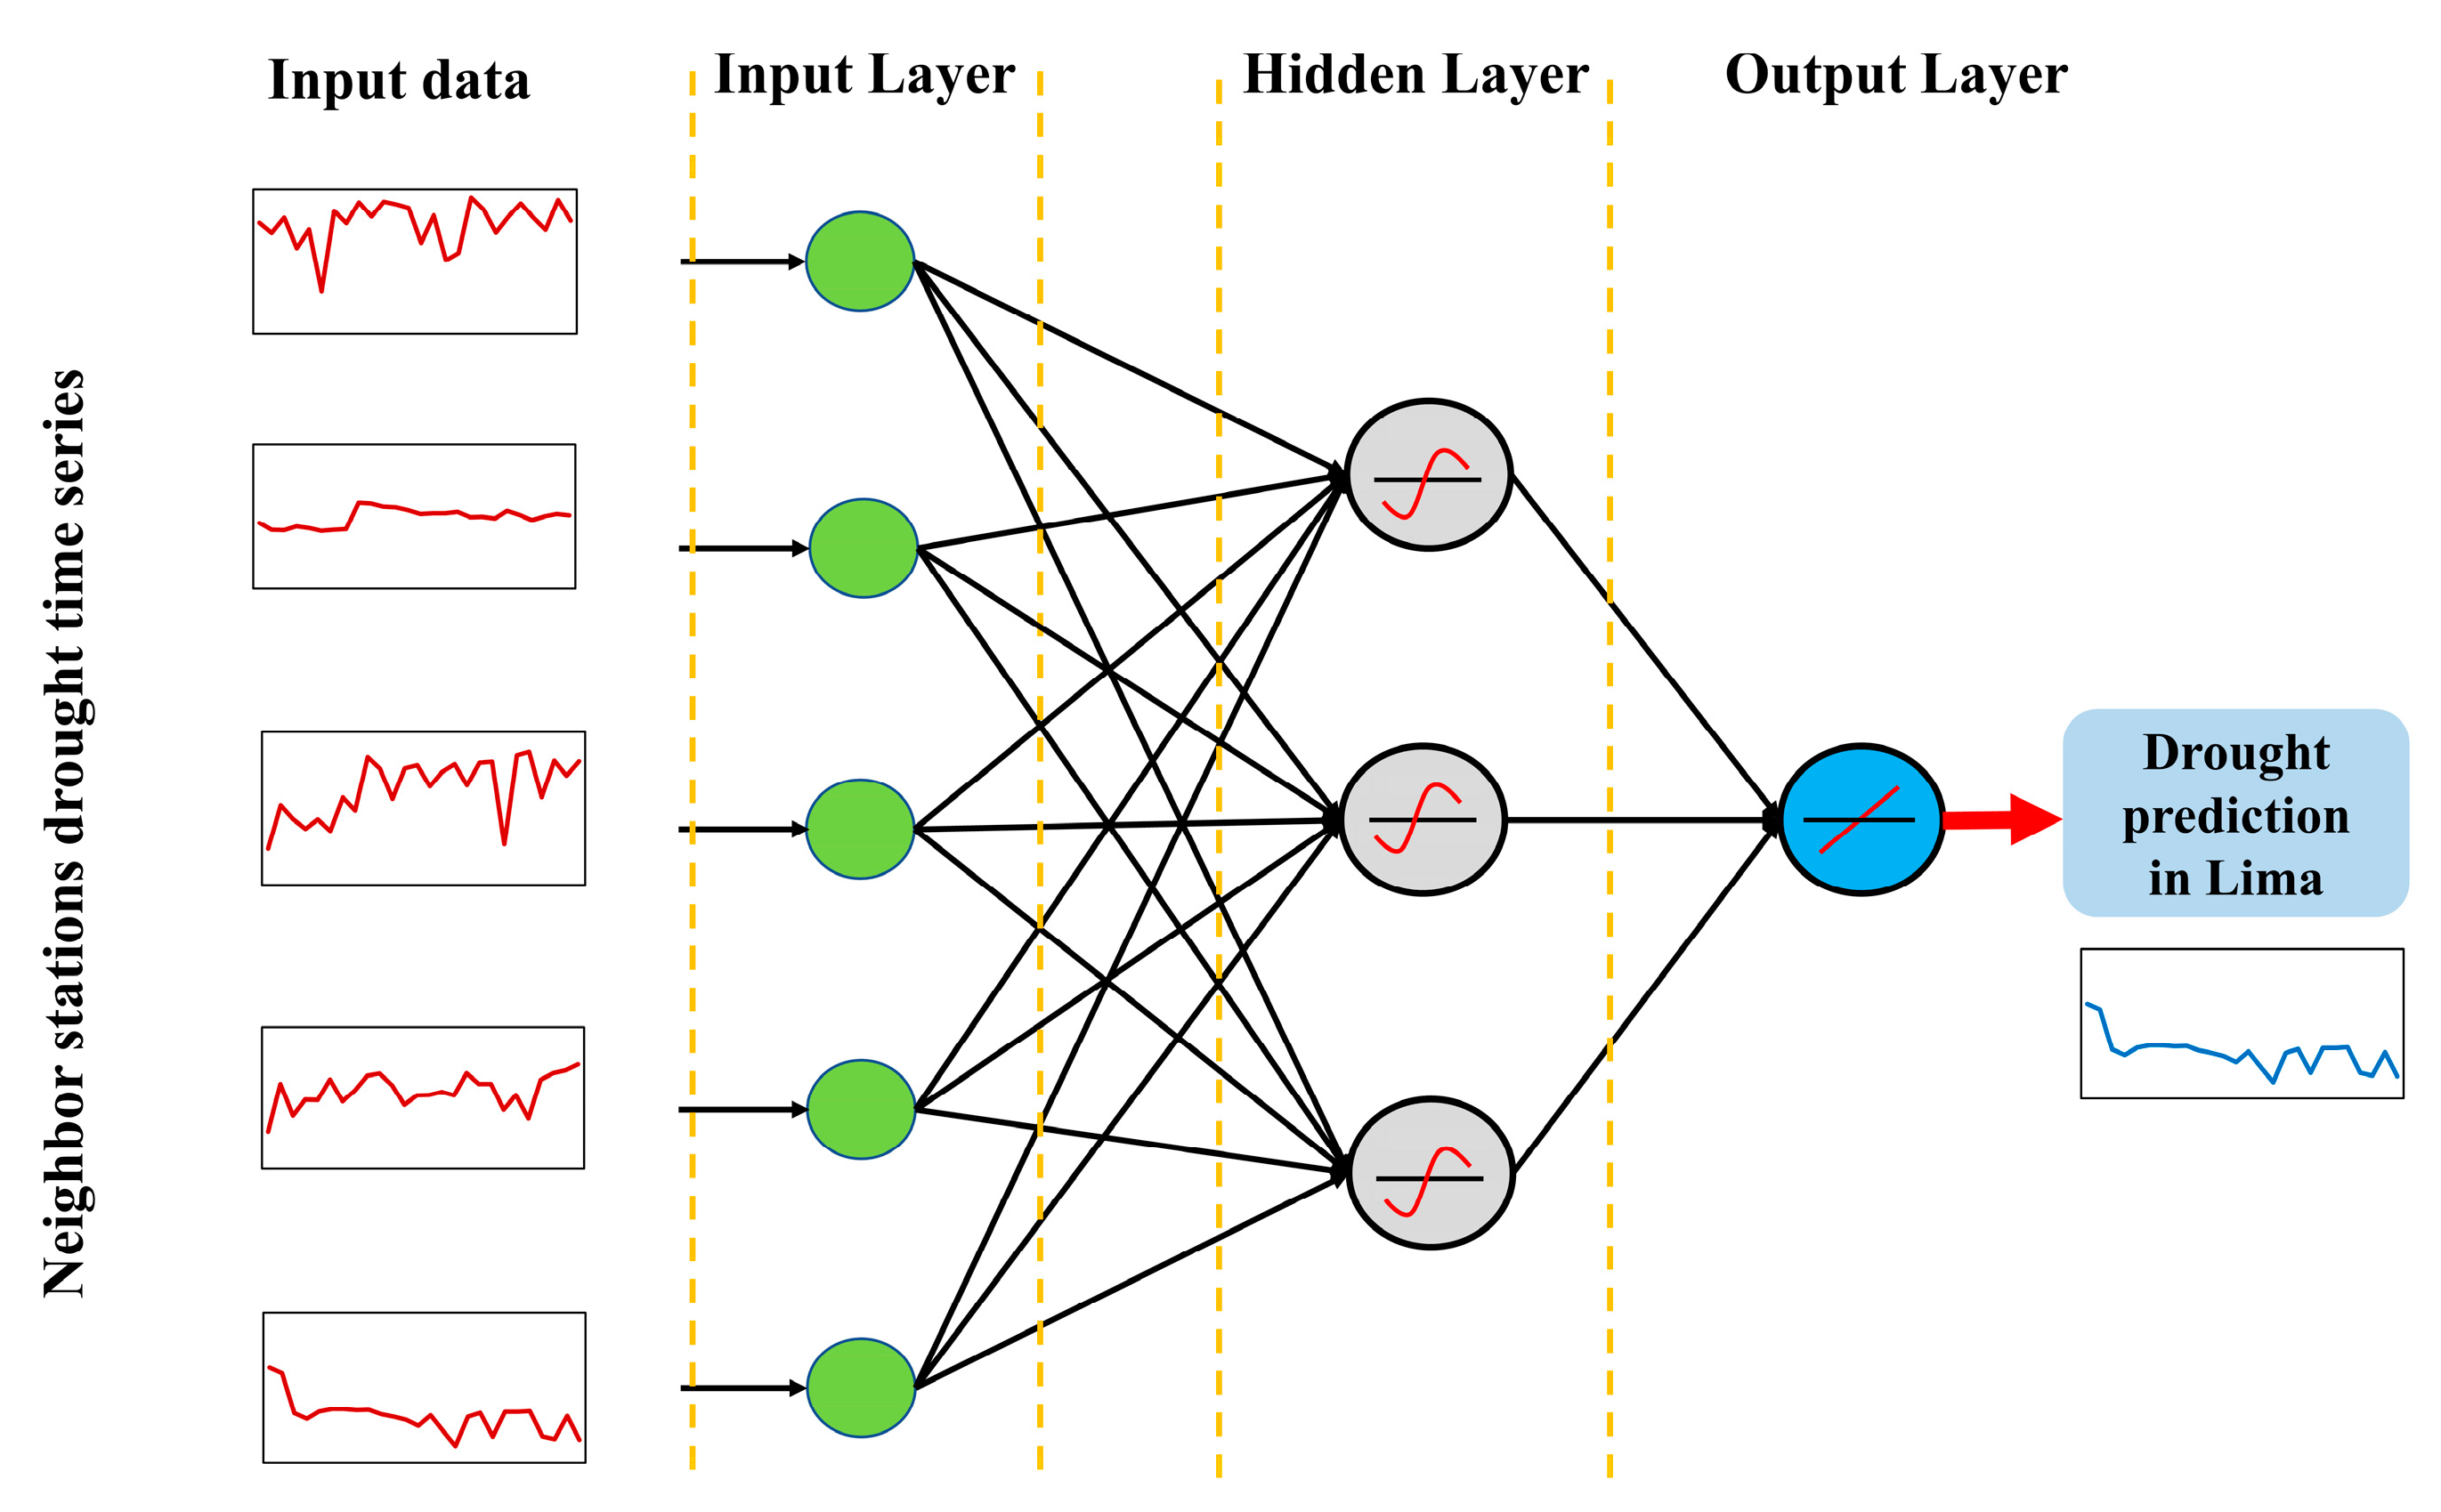
2.3. Merged Artificial Neural Network with Firefly Algorithm (ANN-FA)

The ANN idea was initially established by McCulloch and Pits in 1943 and the back-propagation technique for feed-forward ANN applications in research domains was developed in 1986 [56]. Each layer of an ANN comprises a number of neurons that may be parameterized. Neurons are weight-adjustable activation functions based on a priori and domain knowledge. ANNs consist of numerous layers; all models share fundamental layers (i.e., input layer and output layer) and additional hidden layers may be required (placed between the algorithm’s input and output) [57]. The current study used an ANN with Levenberg–Marquardt as the learning approach for developing the ANN model structure for drought prediction. Figure 3 illustrates the schematic structure of the used ANN model for multi-station drought prediction.
Yang [58] proposed FA for the first time and its central concept was inspired by the actual behavior of fireflies. The optical communication between fireflies inspires the main idea of the firefly algorithm. This algorithm can be considered as a manifestation of swarm intelligence, in which a higher level of intelligence is created from the co-operation of simple and low-intelligence members, which certainly cannot be achieved by any of the components. The FA algorithm is a meta-heuristic algorithm inspired by the behavior of artificial fireflies. This algorithm is formulated with the following hypothesis: (1) all fireflies have sexual desire, so that one firefly attracts all other fireflies. (2) Attraction is proportional to its brightness, and for both fireflies, the less bright one will be attracted; however, the brightness can increase or decrease as their distance. (3) If there is a firefly brighter than the given firefly, it will move it randomly. The FA may be seen as a novel expression of swarm intelligence, which is commonly used as a technique for enhancing hydrological modeling [59]. In addition, researchers have discovered that fireflies employ flashing lights as a defensive technique to communicate environmental warnings to other fireflies. Different components of the worm communication system comprised the rhythm or frequency of the flashing light, the pace at which the light flashes, and the length of the firefly light blinking [58]. Since the attractiveness of a firefly is proportional to the light intensity seen by nearby (neighboring) fireflies, the following equation may be used to determine the attractiveness parameter (when r = 0 the attractiveness of the brighter insect can be defined as β ° ):
β ( r ) = β ° e γ r z
Finding the optimized weight and bias in ANN model is an important task during the training phase. In the current study, FA technique which applies an optimization approach helps to overcome this difficulty to tune the ANN via an optimal way. The methodology of the current study is based on proposing an ANN-FA approach for multi-station drought prediction, which can be explained as follows (based on the provided source code in the “Supplementary Materials” section): the “ANN_FA.m” is the file that should be run for the implementation of ANN-FA; this function helps with data splitting, managing the network size, and ANN details. The “TrainUsing_FA_Fcn” function is responsible for training the neural network using the firefly algorithm. Using the firefly, the weights and biases of the neural network are adjusted. Using firefly, the best configuration for the neural network is estimated. The “Cost_ANN_FA” function has the task of first creating a neural network with the member of the firefly population, then, using the created network, the value of the function is estimated. Finally, the difference between the estimated value and the actual value is returned as an error (cost). The “ConsNet_Fcn” function creates a neural network with firefly population members. In other words, it values the weights and biases with the cream value. The “PlotResults.m” is for visualization of the results. The robustness of the firefly algorithm was evaluated based on cost changes per iteration; also, the performance of ANN-FA was analyzed based on the capability of its training and testing phase according to several statistical metrics (Table 3, Section 2.4).

2.4. Performance Criteria

The data’s time series is divided into training (75% of the whole dataset) and testing (25% of the whole dataset) sections. Five statistical metrics were used for evaluating ANN-FA model performance, including: mean absolute error (MAE [60]), root mean square error (RMSE [60]), the ratio of RMSE to the standard deviation of the observations (RSR [61]), Pearson correlation coefficient (r), and index of agreement (d [62,63,64]). The evaluation criteria are according to Equations (2) to (6).
M A E = 1 N i = 1 N | ( S P I i ( A ) S P I i ( P ) ) |
R M S E = i = 1 n ( S P I i ( A ) S P I i ( P ) ) 2 N
R S R = R M S E S T D E V A
r = i = 1 n ( S P I i ( A ) S P I ( A ) ¯ ) ( S P I i ( P ) S P I ( P ) ¯ ) i = 1 n ( S P I i ( A ) S P I ( A ) ¯ ) 2 i = 1 n ( S P I i ( P ) S P I ( P ) ¯ ) 2
d = 1 i = 1 n ( S P I i ( A ) S P I i ( P ) ) 2 i = 1 n ( | ( S P I i ( P ) S P I ( A ) ¯ ) | + | ( S P I i ( A ) S P I ( A ) ¯ ) | ) 2
where, N is the number of datasets, S P I i ( A ) and S P I i ( P ) are the actual SPI values and predicted SPI values, respectively, and S P I ( A ) ¯ and S P I ( P ) ¯ are the mean actual SPI and mean predicted SPI values, respectively; also, S T D E V A is standard deviation of actual SPI.

3. Results and Discussion

3.1. Generation of Multi-station Scenarios

Predicting drought in Lima using drought in other neighboring cities is the main aim of the current study. Therefore, the SPI values of Tumbes, Cusco, Ancash, Arequipa, Loreto, Tacna, Ucayali, San Martin, and Lambayeque were considered as input features of ANN-FA for predicting drought in Lima in short (3-month and 6-month) and long (18-month and 24-month) time steps. The suggested structures for Lima drought prediction are according to the below.
Time   scale   3 - month :   ( S P I 3 ) L I M = f   {   ( S P I 3 ) O t h e r   s t a t i o n s } Time   scale   6 - month :   ( S P I 6 ) L I M = f   {   ( S P I 6 ) O t h e r   s t a t i o n s } Time   scale   18 - month :   ( S P I 18 ) L I M = f   {   ( S P I 18 ) O t h e r   s t a t i o n s } Time   scale   24 - month :   ( S P I 24 ) L I M = f   {   ( S P I 24 ) O t h e r   s t a t i o n s }

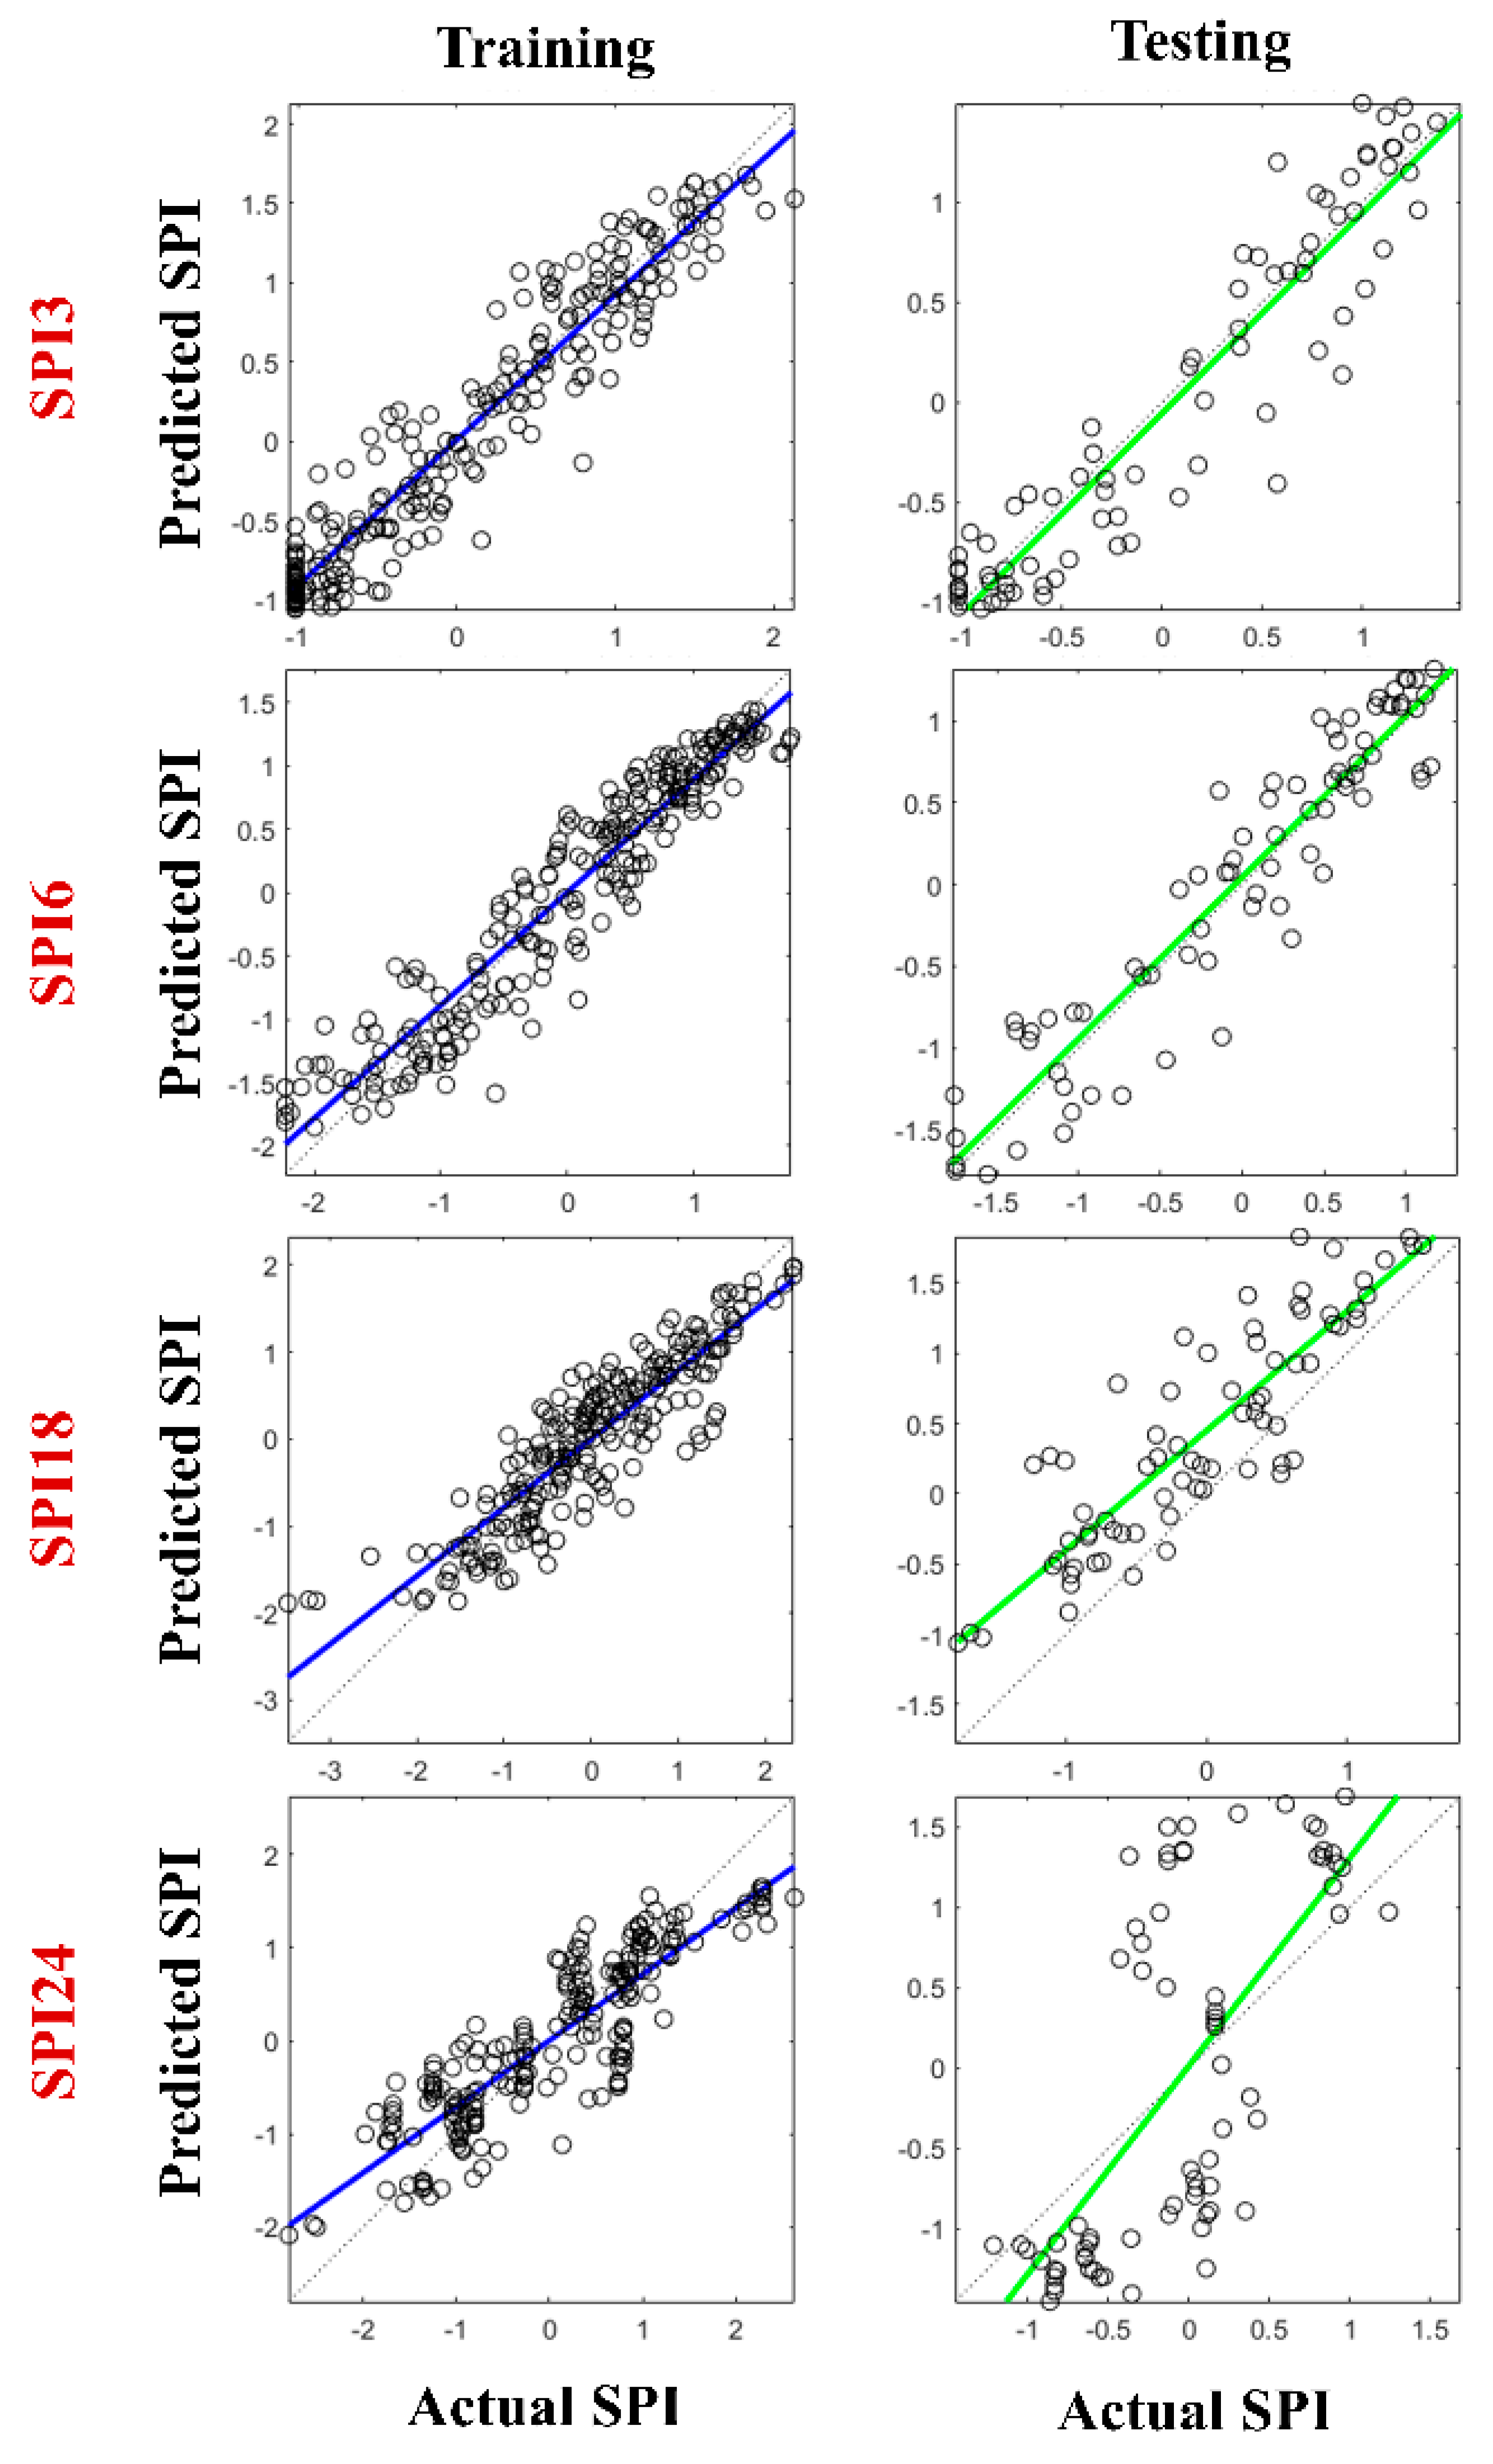
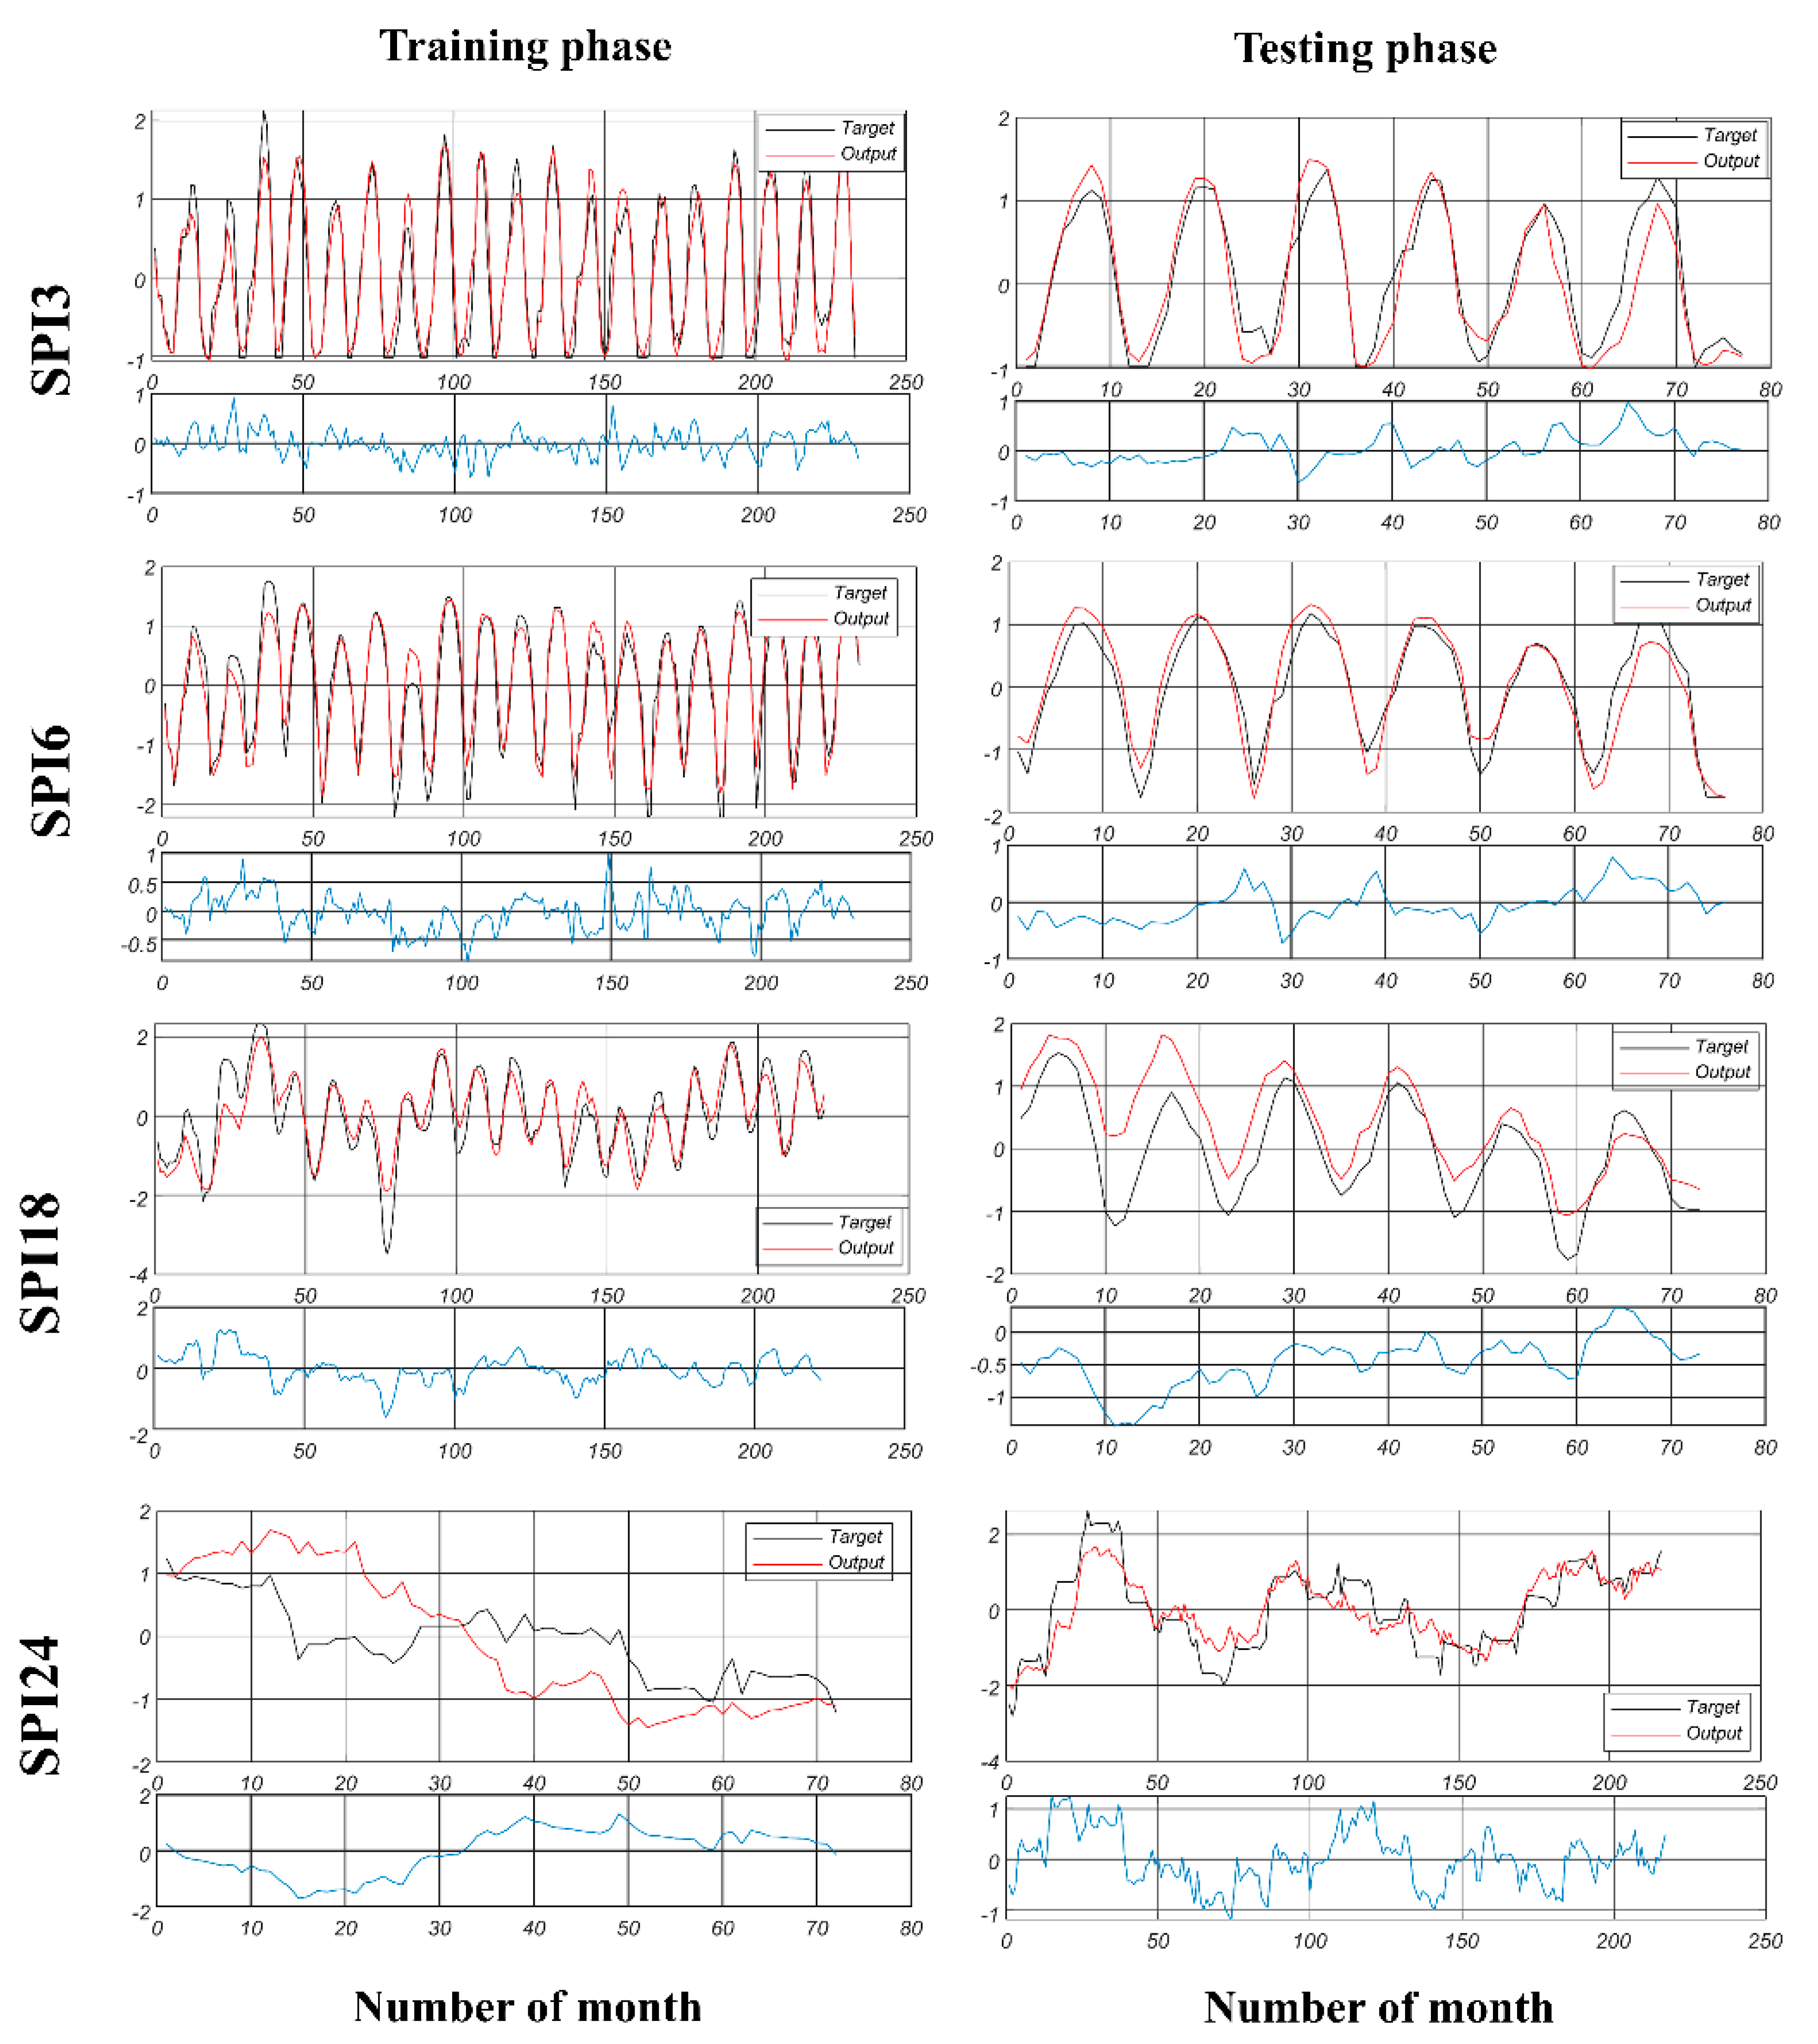
3.2. The SPI Prediction Results via Proposed ANN-FA

Based on suggested scenarios (neighbors’ stations as input of ANN-FA model), the SPI time series data in each station was split into two stages: the training stage (75% of the whole dataset) and the testing stage (25% of whole data). The hyperbolic tangent sigmoid and a linear function were applied as transfer functions for transferring information from the input layer to the hidden layer and from the hidden layer to the output layer, respectively. The performance of the ANN-FA model for drought prediction analyzed underframe of four different time steps and at the training and testing stages is listed in Table 4. The ANN-FA predicted the SPI3, SPI6, SPI18, and SPI24 with RMSE values equal to 0.29 to 0.31, 0.60, and 0.81 for the testing section, respectively. Considering the results of the ANN-FA, the SPI3 is superior to SPI6, SPI18, and SPI24 at both training and testing phases. Table 4 indicates that the ANN-FA simulated SPI24 with lower accuracy than SPEI3, SPI6, and SPI24. This may be owing to the greater time accumulation in SPI24, which can have a smoother time series; also, it can be due to lower correlation between Lima station and other neighbors’ stations in SPI24. Danandeh Mehr et al. [1] used a neighbors’ station strategy to predict SPI in Ankara (in Turkey) using a coupled model based on the Elman neural network with simulated annealing (ENN-SA). They reported RMSE for the best scenario equal to 0.39 and 0.34 for training and testing periods of SPI3, respectively, and 0.37 and 0.35 for training and testing periods of SPI6, respectively. They also used the support vector machine as a feature selection algorithm to determine the most effective neighbor stations for drought prediction, while the current study used nine stations in the whole of Peru for the prediction of drought in Lima station. Pande et al. [28] used ANN and M5P tree models for SPI3 and SPI6 prediction in Angangaon and Dahalewadi stations (in India). They reported RMSE from 0.794 to 0.828 for SPI3 prediction and from 0.715 to 0.754 for SPI6 prediction in the testing phases using an ANN model and they reported RMSE = 0.551 and 0.530 for SPI3 and SPI6 predictions in the testing phases using an M5P tree model. Yaseen et al. [65] predicted SPI in different time scales (SPI1, SPI3, SPI6, and SPI12) using an M5 tree, extreme learning machine (ELM), random forest (RF), online sequential-ELM (OSELM), and minimum probability machine regression (MPMR) in four meteorological stations in Bangladesh. They used the lag times of SPI as input for machine learning models. The results showed that the RF model has a better performance for SPI1 prediction and the ELM model showed a better performance for SPI3, SPI6, and SPI12 prediction. The best results of SPI3 and SPI6 prediction were reported with an RMSE equal to 0.203 (for SPI3) and 0.09 (for SPI6). Regarding comparing optimization algorithms’ abilities, Adnan et al. [37] coupled six optimization algorithms with a random vector functional link (RFVL) for SPI prediction in Bangladesh. They used the social spider optimization, particle swarm optimization, the salp swarm algorithm, the genetic algorithm, the hunger games search algorithm, and the grey wolf optimization as boosting tools during the training of RFVL. The results showed that optimization algorithms can improve the ability of ordinary RFVL in drought (SPI) prediction. Gorgij et al. [66] employed a long short-term memory (LSTM) model for SPI prediction in a semi-arid climate in Iran. They found the LSTM model’s performance was superior to the multivariate adaptive regression spline, compared with extra trees and vector autoregressive techniques for SPI prediction in different time steps. In this study, the FFA approach was used as an optimization technique to tune the ANN weights and biases. This type of optimization-based hybridization is a time-consuming method; this finding is in the same direction as Piri et al. [67].
The scatter plots between the actual and predicted drought for all SPI time scales by the ANN-FA model during the training and testing stages are showed in Figure 4. As it can be seen from this figure, the regression lines of predicted drought in short time step (SPI3 and SPI9) were quite near the 1:1 line which indicates the excellent performance of the proposed ANN-FA for drought prediction in short time steps (3-month and 5-month) during both training and testing phases. The result of drought prediction for long-term droughts (SPI 18 and SPI24) indicated a weaker performance compared with SPI3 and SPI6 in both training and testing stages. This issue can be due to the low effect of neighbors’ stations on SPI18 and SPI24; this means that in short-term drought predictions, neighboring stations demonstrated similar behavior, but in long-term drought predictions, the stations’ references were slightly different from each other. Overall, Figure 4 proved the ANN-FA approach as a capable model for drought prediction and that it can be used as a reliable technique, especially for short-time drought prediction. Applying decomposed signals of time series data as inputs of ANN-FA could enhance performance of drought prediction using ANN-FA model. Future potential studies might consider this issue and apply any kind of signal decomposition approach on drought time series. Because of the advantage of meta-heuristic optimization algorithms (e.g., FA), these methods have been popular to use during training of artificial neural network models. They are independent from the type of problem and they can be implemented without objective function-derived information [68] and, also, they are efficient methods in non-linear problems such as hydrological modeling. Therefore, the current study used FA to overcome the complexity of ordinary ANN and find the optimal weight and bias of ANN during the training phase.
Table 5 presents the results of the linear correlation between predicted SPI values with proposed ANN-FA and actual SPI values for training and testing sections. These values show how the model considers a relationship between actual SPI and target SPI (SPI in LIMA station). It can be seen that the ANN-FA mode provided better results in the training phase in all scales and the ANN-FA model predicted drought in the testing periods with a lower correlation than the training periods.
The time series graphs of actual drought vs predicted drought using ANN-FA are shown in Figure 5. To confirm the capability of the proposed ANN-FA model for SPI time series prediction (SPI3, SPI6, SPI18, and SPI24), the results of both training and testing phases via their error series were compared together in Figure 5. It can be noticed that the predicted time series data in most of time steps follow the natural behavior of drought and the predicted drought is the close to the actual data. However, the model had a challenge during the training phase of SPI24 and ANN-FA could not detect well natural drought behavior, which can be due to the low correlation between actual drought in neighbors’ stations with Lima station and irregular time series during the training phase for SPI24. The drought durations and peak values of drought were detected by the ANN-FA model during the training and testing phases of SPI3, SPI6, and SPI18 prediction. Furthermore, the ANN-FA had on over-estimation during the testing phase of SPI18. The error time series (blue graphs) showed that the biggest error occurred during SPI24 prediction, however, this error ranged between SPI 2 and -2 during training phases, and between SPI 1 and -1 during the testing phase. It was observed that extreme drought events and wetness periods were simulated accurately with proposed ANN-FA during the short time scale (SPI3 and SPI6); also, ANN-FA simulated SPI18 in training and testing phases more accurately than SPI24.

4. Conclusions

Short-term and long-term drought prediction is essential for water resource management, climate studies, agriculture product management, and human life. Due to the non-linear nature of hydrological variables and the intrinsic complexity of climatic condition, drought prediction has been a challenging task in hydrological studies. In the relevant literature, hybrid ML approaches with variable efficiency were proposed as a solution to these challenges. A newly coupled artificial neural network model for drought prediction in Peru was proposed and evaluated in this study. The ANN-FA was implemented for 3 months, 6 months, 18 months, and 24 months for drought prediction in Lima using other neighbors’ stations drought time series. Utilizing five performance metrics and graphical evaluations, the ANN-FA indicated an acceptable accuracy for drought prediction. Regarding the RMSE values of the test section, the proposed ANN-FA model demonstrated 0.29, 0.31, 0.60, and 0.81 for drought prediction in 3-month, 6-month, 18-month, and 24-month time scales. The r values between the actual SPI and predicted SPI reported as 0.94, 0.94, 0.88, and 0.69 for SPI3, SPI6, SPI18, and SPI24 prediction in the testing phase. The best result was related to the SPI3 prediction and the weaker performance was related to SPI24 prediction; also, in all scenarios, the training phase had a better performance compared with the testing phase. In the long-term period drought prediction (SPI24), however, the accuracy of drought predictions was shown to be weaker than other scenarios, therefore, it is recommended to use some data pre-processing approaches such as variational mode decomposition and wavelet transform to overcome this limitation. To improve the capability of the ANN approach, the coupled ANN-FA model was proposed by which the optimal weights of the ANN model were updated and selected via the firefly algorithm. Regarding the structure of ANN-based models, determining the different training algorithms or different activation functions may have an effect on the result of drought prediction. In this study, the firefly algorithm was effectively optimized in the training phase of the traditional ANN model. Current research also showed that FA may be used effectively for boosting the ability of ML approach, e.g., [59,69,70,71]. To the best of the author’s knowledge, this was the first study to use FA as a hybrid with ANN for drought prediction tasks. The current study focused on meteorological drought prediction; consequently, therefore, it is recommended that future studies consider an ANN-FA model to predict other types of drought such as agricultural and hydrological drought. Since the input dataset can play an important role in the result of the ANN-FA model, when ground data are not available, satellite data may be used as alternative sources for the input of ANN-FA. In addition, future potential studies can use the leg times of drought (e.g., t − 1, t − 2, t − 3, etc.) to predict drought in time t. The proposed ANN-FA approach might be used to develop a boosted AI-based framework for drought prediction at various climates and to evaluate the water resources systems.

Supplementary Materials

The source code of ANN-FA can be downloaded at: https://github.com/babakmohammadi/ANN-merged-with-the-firefly-algorithm (accessed on 23 February 2023).

Funding

This research received no external funding.

Data Availability Statement

Data available upon request.

Conflicts of Interest

The author declares no conflict of interest.

References

  1. Mehr, A.D.; Vaheddoost, B.; Mohammadi, B. ENN-SA: A novel neuro-annealing model for multi-station drought prediction. Comput. Geosci. 2020, 145, 104622. [Google Scholar] [CrossRef]
  2. Alawsi, M.A.; Zubaidi, S.L.; Al-Bdairi, N.S.S.; Al-Ansari, N.; Hashim, K. Drought Forecasting: A Review and Assessment of the Hybrid Techniques and Data Pre-Processing. Hydrology 2022, 9, 115. [Google Scholar] [CrossRef]
  3. Aghelpour, P.; Bahrami-Pichaghchi, H.; Kisi, O. Comparison of Three Different Bio-Inspired Algorithms to Improve Ability of Neuro Fuzzy Approach in Prediction of Agricultural Drought, Based on Three Different Indexes. Comput. Electron. Agric. 2020, 170, 105279. [Google Scholar] [CrossRef]
  4. He, M.; Gautam, M. Variability and Trends in Precipitation, Temperature and Drought Indices in the State of California. Hydrology 2016, 3, 14. [Google Scholar] [CrossRef]
  5. Hinge, G.; Piplodiya, J.; Sharma, A.; Hamouda, M.A.; Mohamed, M.M. Evaluation of Hybrid Wavelet Models for Regional Drought Forecasting. Remote. Sens. 2022, 14, 6381. [Google Scholar] [CrossRef]
  6. Mei, P.; Liu, J.; Liu, C.; Liu, J. A Deep Learning Model and Its Application to Predict the Monthly MCI Drought Index in the Yunnan Province of China. Atmosphere 2022, 13, 1951. [Google Scholar] [CrossRef]
  7. Aghelpour, P.; Mohammadi, B.; Biazar, S.M.; Kisi, O.; Sourmirinezhad, Z. A Theoretical Approach for Forecasting Different Types of Drought Simultaneously, Using Entropy Theory and Machine-Learning Methods. ISPRS Int. J. Geo-Inf. 2020, 9, 701. [Google Scholar] [CrossRef]
  8. Mckee, T.B.; Doesken, N.J.; Kleist, J. The relationship of drought frequency and duration to time scales. Eighth Conf. Appl. Climatol. 1993, 17, 17–22. [Google Scholar]
  9. Bhalme, H.N.; Mooley, D.A. Large-Scale Droughts/Floods and Monsoon Circulation. Mon. Weather Rev. 1980, 108, 1197–1211. [Google Scholar] [CrossRef]
  10. Palmer, W.C. Meteorological Drought Available online: Research Paper US Department of Commerce; Weather Bureau: Washington, DC, USA, 1965; p. 59. [Google Scholar]
  11. Vicente-Serrano, S.M.; Beguería, S.; López-Moreno, J.I. A Multiscalar Drought Index Sensitive to Global Warming: The Standardized Precipitation Evapotranspiration Index. J. Clim. 2010, 23, 1696–1718. [Google Scholar] [CrossRef]
  12. Han, J.; Singh, V.P. Forecasting of droughts and tree mortality under global warming: A review of causative mechanisms and modeling methods. J. Water Clim. Chang. 2020, 11, 600–632. [Google Scholar] [CrossRef]
  13. Nabipour, N.; Dehghani, M.; Mosavi, A.; Shamshirband, S. Short-Term Hydrological Drought Forecasting Based on Different Nature-Inspired Optimization Algorithms Hybridized With Artificial Neural Networks. IEEE Access 2020, 8, 15210–15222. [Google Scholar] [CrossRef]
  14. Elbeltagi, A.; AlThobiani, F.; Kamruzzaman, M.; Shaid, S.; Roy, D.K.; Deb, L.; Islam, M.; Kundu, P.K.; Rahman, M. Estimating the Standardized Precipitation Evapotranspiration Index Using Data-Driven Techniques: A Regional Study of Bangladesh. Water 2022, 14, 1764. [Google Scholar] [CrossRef]
  15. Mehr, A.D.; Haghighi, A.T.; Jabarnejad, M.; Safari, M.J.S.; Nourani, V. A New Evolutionary Hybrid Random Forest Model for SPEI Forecasting. Water 2022, 14, 755. [Google Scholar] [CrossRef]
  16. Ebtehaj, I.; Sammen, S.S.; Sidek, L.M.; Malik, A.; Sihag, P.; Al-Janabi, A.M.S.; Chau, K.-W.; Bonakdari, H. Prediction of daily water level using new hybridized GS-GMDH and ANFIS-FCM models. Eng. Appl. Comput. Fluid Mech. 2021, 15, 1343–1361. [Google Scholar] [CrossRef]
  17. Ebtehaj, I.; Bonakdari, H. A reliable hybrid outlier robust non-tuned rapid machine learning model for multi-step ahead flood forecasting in Quebec, Canada. J. Hydrol. 2022, 614, 128592. [Google Scholar] [CrossRef]
  18. Mohammadi, B.; Safari, M.J.S.; Vazifehkhah, S. IHACRES, GR4J and MISD-based multi conceptual-machine learning approach for rainfall-runoff modeling. Sci. Rep. 2022, 12, 12096. [Google Scholar] [CrossRef]
  19. Mehdizadeh, S.; Mohammadi, B.; Ahmadi, F. Establishing Coupled Models for Estimating Daily Dew Point Temperature Using Nature-Inspired Optimization Algorithms. Hydrology 2022, 9, 9. [Google Scholar] [CrossRef]
  20. Mulualem, G.M.; Liou, Y.-A. Application of Artificial Neural Networks in Forecasting a Standardized Precipitation Evapotranspiration Index for the Upper Blue Nile Basin. Water 2020, 12, 643. [Google Scholar] [CrossRef]
  21. Achite, M.; Jehanzaib, M.; Elshaboury, N.; Kim, T.-W. Evaluation of Machine Learning Techniques for Hydrological Drought Modeling: A Case Study of the Wadi Ouahrane Basin in Algeria. Water 2022, 14, 431. [Google Scholar] [CrossRef]
  22. Dikshit, A.; Pradhan, B.; Alamri, A.M. Short-Term Spatio-Temporal Drought Forecasting Using Random Forests Model at New South Wales, Australia. Appl. Sci. 2020, 10, 4254. [Google Scholar] [CrossRef]
  23. Başakın, E.E.; Ekmekcioğlu, Ö.; Özger, M. Drought Prediction Using Hybrid Soft-Computing Methods for Semi-Arid Region. Model Earth Syst. Environ. 2021, 7, 2363–2371. [Google Scholar] [CrossRef]
  24. Inoubli, R.; Abbes, A.B.; Farah, I.R. On Building of a Deep Learning-Based Drought Forecasting System for the Sarab Region [Iran]. Adv. Sci. Technol. Innov. 2022, 315–318. [Google Scholar] [CrossRef]
  25. Xu, D.; Zhang, Q.; Ding, Y.; Zhang, D. Application of a Hybrid ARIMA-LSTM Model Based on the SPEI for Drought Fore-casting. Environ. Sci. Pollut. Res. 2022, 29, 4128–4144. [Google Scholar] [CrossRef]
  26. Dikshit, A.; Pradhan, B.; Huete, A. An improved SPEI drought forecasting approach using the long short-term memory neural network. J. Environ. Manag. 2021, 283, 111979. [Google Scholar] [CrossRef]
  27. Doshi, S.C.; Shanmugam, M.S.; Akib, S. Assessment of Artificial Neural Network through Drought Indices. Eng 2022, 4, 3. [Google Scholar] [CrossRef]
  28. Pande, C.B.; Al-Ansari, N.; Kushwaha, N.L.; Srivastava, A.; Noor, R.; Kumar, M.; Moharir, K.N.; Elbeltagi, A. Forecasting of SPI and Meteorological Drought Based on the Artificial Neural Network and M5P Model Tree. Land 2022, 11, 2040. [Google Scholar] [CrossRef]
  29. Almikaeel, W.; Čubanová, L.; Šoltész, A. Hydrological Drought Forecasting Using Machine Learning—Gidra River Case Study. Water 2022, 14, 387. [Google Scholar] [CrossRef]
  30. Nafii, A.; Taleb, A.; El Mesbahi, M.; Ezzaouini, M.A.; El Bilali, A. Early Forecasting Hydrological and Agricultural Droughts in the Bouregreg Basin Using a Machine Learning Approach. Water 2022, 15, 122. [Google Scholar] [CrossRef]
  31. Deo, R.C.; Kisi, O.; Singh, V.P. Drought Forecasting in Eastern Australia Using Multivariate Adaptive Regression Spline, Least Square Support Vector Machine and M5Tree Model. Atmos. Res. 2017, 184, 149–175. [Google Scholar] [CrossRef]
  32. Zhao, Y.; Zhang, J.; Bai, Y.; Zhang, S.; Yang, S.; Henchiri, M.; Seka, A.M.; Nanzad, L. Drought Monitoring and Performance Evaluation Based on Machine Learning Fusion of Multi-Source Remote Sensing Drought Factors. Remote. Sens. 2022, 14, 6398. [Google Scholar] [CrossRef]
  33. Park, H.; Kim, K.; Lee, D.K. Prediction of Severe Drought Area Based on Random Forest: Using Satellite Image and Topography Data. Water 2019, 11, 705. [Google Scholar] [CrossRef]
  34. Amanambu, A.C.; Mossa, J.; Chen, Y.-H. Hydrological Drought Forecasting Using a Deep Transformer Model. Water 2022, 14, 3611. [Google Scholar] [CrossRef]
  35. Danandeh Mehr, A.; Tur, R.; Alee, M.M.; Gul, E.; Nourani, V.; Shoaei, S.; Mohammadi, B. Optimizing Extreme Learning Machine for Drought Forecasting: Water Cycle vs. Bacterial Foraging. Sustainability 2023, 15, 3923. [Google Scholar] [CrossRef]
  36. Malik, A.; Tikhamarine, Y.; Sammen, S.S.; Abba, S.I.; Shahid, S. Prediction of meteorological drought by using hybrid support vector regression optimized with HHO versus PSO algorithms. Environ. Sci. Pollut. Res. 2021, 28, 39139–39158. [Google Scholar] [CrossRef] [PubMed]
  37. Adnan, R.M.; Mostafa, R.R.; Islam, A.R.M.T.; Gorgij, A.D.; Kuriqi, A.; Kisi, O. Improving Drought Modeling Using Hybrid Random Vector Functional Link Methods. Water 2021, 13, 3379. [Google Scholar] [CrossRef]
  38. Tikhamarine, Y.; Souag-Gamane, D.; Ahmed, A.N.; Sammen, S.S.; Kisi, O.; Huang, Y.F.; El-Shafie, A. Rainfall-Runoff Modelling Using Improved Machine Learning Methods: Harris Hawks Optimizer vs. Particle Swarm Optimization. J. Hydrol. 2020, 589, 125133. [Google Scholar] [CrossRef]
  39. Tikhamarine, Y.; Souag-Gamane, D.; Ahmed, A.N.; Kisi, O.; El-Shafie, A. Improving artificial intelligence models accuracy for monthly streamflow forecasting using grey Wolf optimization (GWO) algorithm. J. Hydrol. 2019, 582, 124435. [Google Scholar] [CrossRef]
  40. Malik, A.; Tikhamarine, Y.; Souag-Gamane, D.; Kisi, O.; Pham, Q.B. Support vector regression optimized by meta-heuristic algorithms for daily streamflow prediction. Stoch. Environ. Res. Risk Assess. 2020, 34, 1755–1773. [Google Scholar] [CrossRef]
  41. Ahmadi, F.; Mehdizadeh, S.; Mohammadi, B. Development of Bio-Inspired- and Wavelet-Based Hybrid Models for Recon-naissance Drought Index Modeling. Water Resour. Manag. 2021, 35, 4127–4147. [Google Scholar] [CrossRef]
  42. Nguyen, V.-N.; Bui, D.T.; Ngo, P.-T.T.; Nguyen, Q.-P.; Nguyen, V.C.; Long, N.Q.; Revhaug, I. An Integration of Least Squares Support Vector Machines and Firefly Optimization Algorithm for Flood Susceptible Modeling Using GIS. In Advances and Applications in Geospatial Technology and Earth Resources; Tien Bui, D., Ngoc Do, A., Bui, H.B., Hoang, N.D., Eds.; GTER 2017; Springer: Cham, Switzerland, 2018; pp. 52–64. [Google Scholar] [CrossRef]
  43. Nhu, V.-H.; Thi Ngo, P.-T.; Pham, T.D.; Dou, J.; Song, X.; Hoang, N.-D.; Tran, D.A.; Cao, D.P.; Aydilek, I.B.; Amiri, M.; et al. A New Hybrid Firefly–PSO Optimized Random Subspace Tree Intelligence for Torrential Rainfall-Induced Flash Flood Susceptible Mapping. Remote. Sens. 2020, 12, 2688. [Google Scholar] [CrossRef]
  44. Wu, L.; Peng, Y.; Fan, J.; Wang, Y.; Huang, G. A novel kernel extreme learning machine model coupled with K-means clustering and firefly algorithm for estimating monthly reference evapotranspiration in parallel computation. Agric. Water Manag. 2020, 245, 106624. [Google Scholar] [CrossRef]
  45. Tao, H.; Diop, L.; Bodian, A.; Djaman, K.; Ndiaye, P.M.; Yaseen, Z.M. Reference evapotranspiration prediction using hybridized fuzzy model with firefly algorithm: Regional case study in Burkina Faso. Agric. Water Manag. 2018, 208, 140–151. [Google Scholar] [CrossRef]
  46. Yaseen, Z.M.; Ghareb, M.I.; Ebtehaj, I.; Bonakdari, H.; Siddique, R.; Heddam, S.; Yusif, A.A.; Deo, R. Rainfall Pattern Fore-casting Using Novel Hybrid Intelligent Model Based ANFIS-FFA. Water Resour. Manag. 2018, 32, 105–122. [Google Scholar] [CrossRef]
  47. Arabameri, A.; Arora, A.; Pal, S.C.; Mitra, S.; Saha, A.; Nalivan, O.A.; Panahi, S.; Moayedi, H. K-Fold and State-of-the-Art Metaheuristic Machine Learning Approaches for Groundwater Potential Modelling. Water Resour. Manag. 2021, 35, 1837–1869. [Google Scholar] [CrossRef]
  48. Pham, Q.B.; Tran, D.A.; Ha, N.T.; Islam, A.R.M.T.; Salam, R. Random forest and nature-inspired algorithms for mapping groundwater nitrate concentration in a coastal multi-layer aquifer system. J. Clean. Prod. 2022, 343, 130900. [Google Scholar] [CrossRef]
  49. Kottek, M.; Grieser, J.; Beck, C.; Rudolf, B.; Rubel, F. World Map of the Köppen-Geiger Climate Classification Updated. Meteorol. Z. 2006, 15, 259–263. [Google Scholar] [CrossRef] [PubMed]
  50. Beck, H.E.; Zimmermann, N.E.; McVicar, T.R.; Vergopolan, N.; Berg, A.; Wood, E.F. Present and future Köppen-Geiger climate classification maps at 1-km resolution. Sci. Data 2018, 5, 180214. [Google Scholar] [CrossRef]
  51. Mohammadi, B.; Vaheddoost, B.; Mehr, A.D. A spatiotemporal teleconnection study between Peruvian precipitation and oceanic oscillations. Quat. Int. 2020, 565, 1–11. [Google Scholar] [CrossRef]
  52. Viale, M.; Nuñez, M.N. Climatology of Winter Orographic Precipitation over the Subtropical Central Andes and Associated Synoptic and Regional Characteristics. J. Hydrometeorol. 2011, 12, 481–507. [Google Scholar] [CrossRef]
  53. Tigkas, D.; Vangelis, H.; Tsakiris, G. DrinC: A software for drought analysis based on drought indices. Earth Sci. Informatics 2014, 8, 697–709. [Google Scholar] [CrossRef]
  54. Karavitis, C.A.; Alexandris, S.; Tsesmelis, D.E.; Athanasopoulos, G. Application of the Standardized Precipitation Index (SPI) in Greece. Water 2011, 3, 787–805. [Google Scholar] [CrossRef]
  55. Freitas, A.A.; Drumond, A.; Carvalho, V.S.B.; Reboita, M.S.; Silva, B.C.; Uvo, C.B. Drought Assessment in São Francisco River Basin, Brazil: Characterization through SPI and Associated Anomalous Climate Patterns. Atmosphere 2021, 13, 41. [Google Scholar] [CrossRef]
  56. Palani, S.; Liong, S.-Y.; Tkalich, P. An ANN application for water quality forecasting. Mar. Pollut. Bull. 2008, 56, 1586–1597. [Google Scholar] [CrossRef] [PubMed]
  57. Jahan, K.; Pradhanang, S. Predicting Runoff Chloride Concentrations in Suburban Watersheds Using an Artificial Neural Network (ANN). Hydrology 2020, 7, 80. [Google Scholar] [CrossRef]
  58. Yang, X.S. Firefly Algorithms for Multimodal Optimization. In Stochastic Algorithms: Foundations and Applications; Watanabe, O., Zeugmann, T., Eds.; SAGA 2009. Lecture Notes in Computer Science; Springer: Berlin/Heidelberg, Germany; Volume 5792 LNCS, pp. 169–178. [CrossRef]
  59. Moazenzadeh, R.; Mohammadi, B. Assessment of bio-inspired metaheuristic optimisation algorithms for estimating soil temperature. Geoderma 2019, 353, 152–171. [Google Scholar] [CrossRef]
  60. Abdallah, M.; Mohammadi, B.; Zaroug, M.A.H.; Omer, A.; Cheraghalizadeh, M.; Eldow, M.E.; Duan, Z. Reference evapotranspiration estimation in hyper-arid regions via D-vine copula based-quantile regression and comparison with empirical approaches and machine learning models. J. Hydrol. Reg. Stud. 2022, 44, 101259. [Google Scholar] [CrossRef]
  61. Moriasi, D.N.; Arnold, J.G.; van Liew, M.W.; Bingner, R.L.; Harmel, R.D.; Veith, T.L. Model evaluation guidelines for systematic quantification of accuracy in watershed simulations. Trans. ASABE 2007, 50, 885–900. [Google Scholar] [CrossRef]
  62. Willmott, C.J. On the validation of models. Phys. Geogr. 1981, 2, 184–194. [Google Scholar] [CrossRef]
  63. Willmott, C.J. Willmott, C.J. On the Evaluation of Model Performance in Physical Geography. Spat. Stat. Model. 1984, 40, 443–460. [Google Scholar] [CrossRef]
  64. LeGates, D.R.; McCabe, G.J., Jr. Evaluating the use of “goodness-of-fit” Measures in hydrologic and hydroclimatic model validation. Water Resour. Res. 1999, 35, 233–241. [Google Scholar] [CrossRef]
  65. Yaseen, Z.M.; Ali, M.; Sharafati, A.; Al-Ansari, N.; Shahid, S. Forecasting standardized precipitation index using data intelligence models: Regional investigation of Bangladesh. Sci. Rep. 2021, 11, 1–25. [Google Scholar] [CrossRef] [PubMed]
  66. Gorgij, A.D.; Alizamir, M.; Kisi, O.; Elshafie, A. Drought modelling by standard precipitation index (SPI) in a semi-arid climate using deep learning method: Long short-term memory. Neural Comput. Appl. 2021, 34, 2425–2442. [Google Scholar] [CrossRef]
  67. Piri, J.; Abdolahipour, M.; Keshtegar, B. Advanced Machine Learning Model for Prediction of Drought Indices using Hybrid SVR-RSM. Water Resour. Manag. 2022, 37, 683–712. [Google Scholar] [CrossRef]
  68. Dehghani, M.; Trojovská, E.; Trojovský, P. A new human-based metaheuristic algorithm for solving optimization problems on the base of simulation of driving training process. Sci. Rep. 2022, 12, 1–21. [Google Scholar] [CrossRef]
  69. Yaseen, Z.M.; Ebtehaj, I.; Bonakdari, H.; Deo, R.C.; Mehr, A.D.; Mohtar, W.H.M.W.; Diop, L.; El-Shafie, A.; Singh, V.P. Novel approach for streamflow forecasting using a hybrid ANFIS-FFA model. J. Hydrol. 2017, 554, 263–276. [Google Scholar] [CrossRef]
  70. Zounemat-Kermani, M.; Mahdavi-Meymand, A. Hybrid meta-heuristics artificial intelligence models in simulating discharge passing the piano key weirs. J. Hydrol. 2018, 569, 12–21. [Google Scholar] [CrossRef]
  71. Naganna, S.R.; Deka, P.C.; Ghorbani, M.A.; Biazar, S.M.; Al-Ansari, N.; Yaseen, Z.M. Dew Point Temperature Estimation: Application of Artificial Intelligence Model Integrated with Nature-Inspired Optimization Algorithms. Water 2019, 11, 742. [Google Scholar] [CrossRef]
Figure 1. The climate types in Peru according to the Köppen–Geiger climate classification (based on Kottek et al. [49], Beck et al. [50], and Mohammadi et al. [51]).
Hydrology 10 00058 g001
Figure 2. The projection of the data in the selected stations (a,b) the monthly total of the precipitation.
Hydrology 10 00058 g002
Figure 3. Schematic structure of used ANN model in the current study.
Hydrology 10 00058 g003
Figure 4. The actual SPI at different time scales vs. the predicted SPI via ANN-FA.
Hydrology 10 00058 g004
Figure 5. Time series plots of the actual and predicted SPI by proposed ANN-FA at different time scales.
Hydrology 10 00058 g005
Table 1. Information of the meteorological stations and statistical characteristics of measured precipitation (from 1990 to October).
CodeStationDepartmentLAT (DMS)LONG (DMS)UTM-ZoneKop-GeigMean (mm)Std. Dev. (mm)
TMBEl saltoTumbes03°48′ S80°30′ W17MBsh1.48.92
CUSGranja kcayraCusco13°33′ S71°52′ W19LCwb2.114.89
ANCRecuayAncash09°08′ S77°44′ W18LCwb2.264.48
AQPImataArequipa16°20′ S72°09′ W18KBwk1.443.99
LIMMatucanaLima11°50′ S76°22′ W18LEt0.872.45
LSRSan ramonLoreto03°53′ S73°41′ W18MAf6.1713.72
TACSama grandeTacna17°47′ S70°29′ W19KBwh0.070.43
UCAEl maronalUcayali09°50′ S73°04′ W18LAm5.0213.12
SAMLamasSan martin06°30′ S76°28′ W18MAf3.678.84
LAMCayaltiLambayeque06°48′ S79°36′ W17MBwh0.211.88
Table 2. SPI classification according to the drought phase [55].
Drought PhaseSPI Range
Extremely Wet≥2.0
Very Wet1.50 to 1.99
Moderately Wet1.00 to 1.49
Near Normal−0.99 to 0.99
Moderately Dry−1.00 to −1.49
Severely Dry−1.50 to −1.99
Extremely Dry≤−2.0
Table 3. Parameter setting of firefly algorithm.
ParameterDescriptionValue
MaxItMaximum number of iterations500
nPopNumber of fireflies (swarm size)30
gammaLight absorption coefficient1
betaAttraction coefficient base value2
alphaMutation coefficient0.2
alpha_dampMutation coefficient damping ratio0.98
VarMinLower bound of variables−1
VarMaxUpper bound of variables1
deltaUniform mutation range0.05 × (VarMax − VarMin)
Table 4. Performance of proposed ANN-FA for drought modeling in 3 months, 6 months, 18 months, and 24 months (for both training and testing phases).
SPI3SPI6SPI18SPI24
MetricsTrainingTestingTrainingTestingTrainingTestingTrainingTesting
MAE0.200.220.250.250.360.490.420.70
RMSE0.260.290.320.310.480.600.540.81
RSR0.290.370.310.350.450.740.491.36
r0.960.940.950.940.890.880.870.69
d0.980.970.970.970.940.870.920.75
Table 5. Explainable equations of predicted SPIs via proposed ANN-FA vs their correlation between actual drought and predicted drought.
ScaleTrain Phase Equationr (Training)Test Phase Equationr (Testing)
SPI3LIM0.92 × Target + 0.00810.957Target − 0.0550.939
SPI6LIM0.89 × Target + 0.0030.9500.99 × Target + 0.0450.942
SPI18LIM0.79 × Target + 0.00250.8930.85 × Target + 0.450.877
SPI24LIM0.71 × Target + 0.00610.8741.3 × Target + 0.0140.694
Disclaimer/Publisher’s Note: The statements, opinions and data contained in all publications are solely those of the individual author(s) and contributor(s) and not of MDPI and/or the editor(s). MDPI and/or the editor(s) disclaim responsibility for any injury to people or property resulting from any ideas, methods, instructions or products referred to in the content.

