Abstract
Urban streams are ecosystems of great ecological and hydrological importance for human environments. However, they face pressure on biodiversity, hydromorphology, and water quality. In this study, an urban riparian system of a Mediterranean city (Thessaloniki, Greece) which interacts with several land-use classes, namely forests, pastures, cultivations, industrial-commercial infrastructure, and light and dense urban fabric, is assessed. The analyzed data were collected by implementing mainly QBR and ancillary RMP protocols on 37 plots of the Dendropotamos stream. The QBR protocol provided an assessment of total riparian vegetation cover, cover structure and quality, as well as channel alterations. The RMP protocol was used to enhance the quantitative assessment of dominant tree and shrub cover. Parts of Dendropotamos surrounded by agricultural (median QBR score: 27.5), industrial (50), and dense residential areas (27.5) suffer, in general, from low riparian vegetation cover, bad vegetation structure and quality, the continuous presence of alien/introduced species, and channel alterations. A variety of riparian habitat conditions characterize the sparse residential areas (60) where cover structure and quality of vegetation is improved. The reduction in grazing pressure has improved the riparian habitat in the greatest part of Dendropotamos that is surrounded by semi-natural pastures (65). Within forested areas (85), the stream conditions are considered quasi-natural. All previous land uses are differentiated in terms of the dominant trees found in the vegetation of Dendropotamos: Platanus orientalis in forested areas, alien Ailanthus altissima mainly in residential and industrial areas, and native shrubs, e.g., Quercus coccifera and Pyrus spinosa, in pastures. The QBR protocol could be a valuable tool in urban environment planning to help identify areas with potential for restoration, such as those with moderate residential pressure.
Keywords:
channel alteration; landscape; riparian vegetation; alien species; stream habitat; QBR; RMP; Thessaloniki 1. Introduction
The riparian ecosystems are of great importance, as they play a decisive role in the chemical cycles of carbon, nitrogen, and phosphorus [], they regulate the impetus of rivers, protect against flooding, ameliorate air temperatures, decontaminate (under conditions) the water, enrich the underground aquifers, and enhance biodiversity []. The structure of the riparian zone, the river continuity, and the hydrological regime are the main features influencing the health of riparian ecosystems. Over the last 100 years, riparian areas faced large human pressure across Europe. In recognition of this fact, the European Union imposed the Water Framework Directive (WFD) requiring from its members the monitoring of biotic and abiotic riparian features and the conservation/restoration of the riparian ecosystems.
Sprawling cities often engulf and affect encountered waterbodies, usually streams, which in turn interact with residential areas. The healthy urban streams benefit the urban life and economy in various ways, i.e., via the reduction in noise pollution, air filtration, temperature regulation, increased urban biodiversity, recreation, increased house pricing, and touristic development [,,,,,]. However, under human pressure urban stream environments are often seriously degraded because they are treated as obstacles rather than as an asset and a means to urban development. As a result, areas close to severely altered urban streams may face the risk of flooding, bad air quality, and even catastrophic landslides. Impermeable and extended arrangement works along a stream change the structure of the vegetation and disrupt the water body continuity, causing a decrease in riparian biodiversity [,,]. Moreover, the alignment and encroachment of channels for protection against flood risk seems to be the main cause of longitudinal hydromorphological changes. In contrast, bridges, ditches, and related man-made structures and reinforcements on banks and channels play a smaller role in the overall modification of rivers [].
Greece’s aquatic wealth has recently showed signs of degradation [,]. Currently, the continuous ecological degradation is the result of land-use change in favor of agriculture and expanding urban infrastructure works at the borders of cities [], lacking environmental planning [].
The increase in the human population exerts pressure on the terrestrial ecosystems, because of the growing need for raw materials, food, etc. [], and subsequent expansion of various land uses. The urban landscape could be highly complex in terms of land-use variability, which is often spatially confined. Pressure from continuous land-use changes affects the stability of ecosystems and especially the riparian ones [,,], influencing water quality, stream habitats, and biodiversity [,].
Information on the overall health of a stream is a powerful tool for environmental planning. In recent years, several protocols such as Qualitat del Bosc de Ribera (QBR), Riparian Macrophyte Protocol (RMP), Riparian Quality Index (RQI), Indice de Habitat Fluvial (IHF), Water Quality Index (WQI), rapid Physical Habitat Assessment (rPHA), River Habitat Survey (RHS), etc. [,,,], have been used to evaluate different ecological and environmental features that indicate the health status of a riparian ecosystem. The Riparian Forest Quality Index (QBR) is a tool for fast visual assessment of riparian biotic and abiotic features []. QΒR has already been used in studies concerning mainland Greece riverine systems []. The protocol was used as a supplement in research concerning small basins and urban streams [,,], fish fauna [], assessment of environmental degradation [], impact of technical works [], and more.
The city of Thessaloniki, situated in Northern Greece (Figure 1), has a population of 1.1 million inhabitants and has grown rapidly over the last decades. The Dendropotamos stream network (hereafter Dendropotamos), which is the largest stream of the city, is situated in the northwest part of Thessaloniki and comprises several streams and tributaries. It runs through a multitude of land uses, hosting several woody alien/introduced species [], and has undergone intense basin alterations.
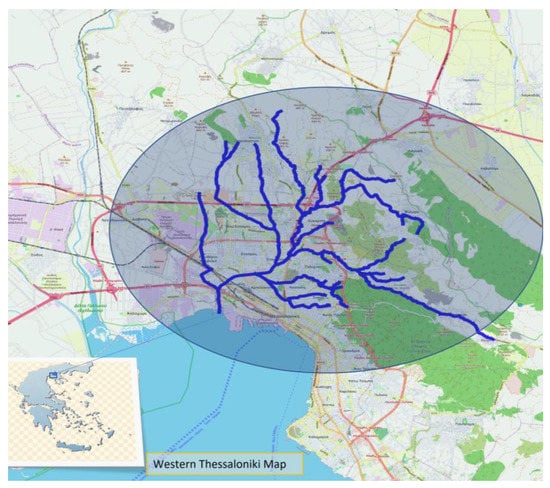
Figure 1.
Western Thessaloniki map showing the Dendropotamos stream network.
The current study focuses on the interaction of an urban environment of multiple land uses with the quality status of an ‘urbanized’ stream like Dendropotamos. The environmental and ecological status of Dendropotamos is assessed mainly by QBR and by ancillary RMP protocols. We use QBR scores and quantitative data of RMP, collected from 37 sampling plots, to evaluate differences in the environmental and ecological conditions of Dendropotamos. An effort is made to correlate these differences to the unique combination of urban land uses that have been established around Dendropotamos.
2. Materials and Methods
2.1. Study Area
Thessaloniki was founded in 315 BC as a union of 27 different settlements. Archaeological research indicates that the area was inhabited by almost 8000 BC. Its strategic position and rich natural characteristics, i.e., dense forests, rich water resources, and fertile soil, gave the city an important role in the ancient world, while during the Byzantine era it was the second largest and wealthiest city after Constantinople. The city was built in the coastal area of the Thermaicos Gulf and near the banks of local streams. The largest stream network of the city is Dendropotamos. The stream is located at the western part of the city and its watershed area covers 117.37 km2 (Figure 1). The altitude of the basin ranges between 0 and 736 m. More than 75% of the total area is hilly and semi-mountainous, with slopes up to 35%. The total length of the main channel is 25 km. Over the last decades, the low-lying part of the stream which crosses the densest urban fabric was totally covered by infrastructure works against flooding.
The area of Thessaloniki lies within the sub-Mediterranean vegetation zone (Quercetalia pubescentis) and especially in the Ostryo-carpinion subzone []. Dendropotamos runs through evergreen thickets, pine forests, and cypress groves mainly from the reforestation in the surrounding hills. A small area of oak forest exists in two separated segments. The main species found are Quercus coccifera, Q. pubescens, Paliurus spina-christi, and Pyrus spinosa. The streams are dominated by the azonic riparian vegetation with Platanus orientalis, Populus spp., and Salix spp. The ephemeral parts of the stream are covered by a mixture of the surrounding vegetation and some riparian species.
In previous centuries, large parts of the rich forests around the city were transformed into dry barren land, the vegetation in the streams disappeared to a large extent, and the surface runoff caused the soil in the surrounding hills to erode and weaken, as indicated by research in other cases [,]. The rapid growth of the population after 1900 resulted in the expansion of the city especially at its west borders, as new settlements were established in former arable fields, afforested areas, or swampy places very often without plan or care for the environment. Ever since, a multitude of human activities and different land uses such as settlements, factories, military installations, hospitals, arable fields, and pastures have gathered within a short space and scattered among and around Dendropotamos and its tributaries (Figure 2). Dendropotamos has been treated as an obstacle and often modified with works of arrangement, bridges, and sewers. As a result, the new settlements still face flood risk even though the local authorities took care of the reforestation on the surrounding hills of the basin.
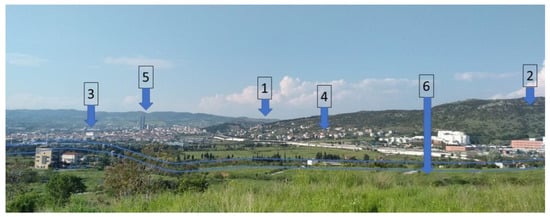
Figure 2.
Part of the Dendropotamos basin. Arrows showing the different land-use classes (see text).
2.2. Land-Use Mapping and Sampling
Although land use around each sampling plot is not a QBR requirement, we wanted to assess QBR scores in relation to different land-use categories encountered around Dendropotamos. For this purpose, the Copernicus Urban Atlas (Figure 3), which is a geospatial database that provides pan-European comparable land cover/use data for functional urban areas of 800 cities with a population of more than 50,000 inhabitants, was used.
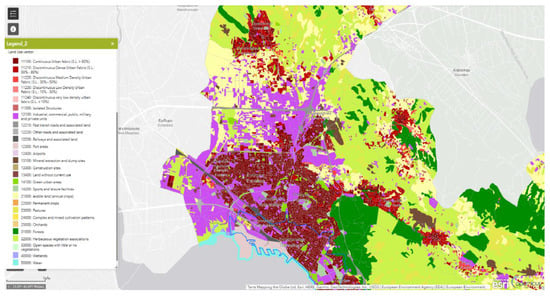
Figure 3.
Land-use regimes of Thessaloniki (via the Copernicus Urban Atlas). Original land uses were combined in six classes (see text).
The original Copernicus land-use categories were grouped into 6 classes (Figure 2) to facilitate the assessment of differences in QBR scores along Dendropotamos. These classes are as follows:
- FOR (forests);
- PAS (pastures and herbaceous vegetation associations);
- UFH (urban fabric of 50–80% and >80% coverage);
- UFL (urban fabric of <10%, 10–30%, and 30–50% coverage);
- IND (industrial, commercial, military activity, mining, and landfills);
- ARA (arable land, annual crops, orchards, and complex and mixed crops).
Maps were created by using the G.I.S. application QGIS 3 Noosa.
A random stratified sampling was performed by selecting plots representative of each land-use class. An attempt was made to cover the whole open hydrographic network of the Dendropotamos basin. The length of each recorded sampling plot was 100 m. In each plot both banks of the stream were evaluated simultaneously with QBR and RMP protocols always in an opposite direction to the water flow. A total of 37 plots were recorded at 5 different municipalities of western Thessaloniki, in altitudes between 53 and 438 m (Figure 4). In sites difficult to access the assessment was facilitated by aerial photos taken with UAV DJI Mavic Air. Aerial historical maps of the Hellenic Cadastre also helped to compare and interpret the development of the riparian vegetation of Dendropotamos.
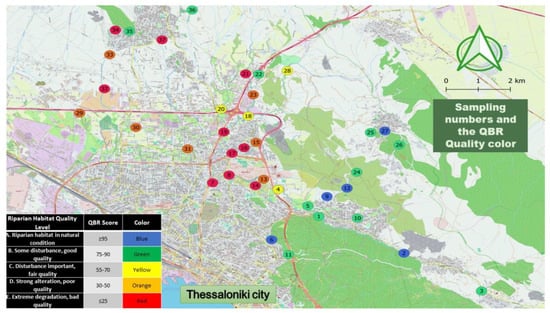
Figure 4.
Position of the 37 sampling plots. Colored legend indicates the five main levels of riparian habitat quality (QBR) status, namely natural, good, fair, poor, and bad.
2.3. The Evaluation of Riparian Forest Quality (QBR and RMP)
We used the QBR (The Qualitat del Bosc de Ribera or Riparian Forest Quality or QBR) as the main protocol to assess the ecological status of Dendropotamos riparian vegetation. Its main advantages are speed and ease of application. It is divided into 4 sections: the total riparian cover (RCS), the vegetation cover structure (CSS), the cover quality (CQS), and the channel alterations (CAS). The index has a scale of 0 to 100, and each of the 4 sections must take values between 0–25 (with a 5-point interval) even if negative values or values over 25 are calculated. The final score is determined after adding the scores of the 4 sections (legend of Figure 4 indicates specific color corresponding to different quality status). The QBR protocol considers as negative the presence of alien species (including introduced ones), as they are determined by national flora databases, in our case the flora of Greece database: an annotated checklist (http://portal.cybertaxonomy.org/flora-greece/) accessed on 6 January 2023. Supplementary to this we used the riparian macrophyte protocol (RMP) [] to enhance assessment of specific vegetation features such as cover of dominant trees and shrubs. The cover of dominant trees and shrubs was estimated in up to 5 layers: high tree > 8 m, low tree 4–8 m, high bush 2–4 m, low bush < 2 m, and other shrubs, vines, lianas, etc.
2.4. Data Analysis
Data from both protocols were analyzed via the statistical package SPSS 25.0 for Windows (SPSS, Inc, Chicago, IL, USA). Descriptive statistics, tables, boxplots, and graphics are provided.
In PAST 4.01 [] the principal component analysis (PCA) was performed on dominant woody taxa cover values as estimated in the RMP protocol. We combined data from all layers estimating cover of different dominant taxa. If a taxon was dominant in more than one layer, we added the values of the corresponding layers. The PCA was conducted on woody species that were present in more than 20% of the sampling plots (ca. 8 plots). The cover of each taxon was transformed on a semi-quantitative 0–5 scale (0 for absence and 5 for 80–100% cover). Sample plots were grouped into sets according to land-use regime.
3. Results
The overall assessment of Dendropotamos indicates highly variable quality conditions (Table 1, Figure 4). In absolute numbers, 11 sampling plots of Dendropotamos are maintained in good (B) condition, and 10 in bad (E). There are five plots where the condition is characterized as natural (A) and seven as bad (D). Finally, four plots are in fair condition (C).

Table 1.
Plot number, land-use code, altitude, QBR quality level, and total score for all 37 sampling plots.
A low riparian habitat quality score was recorded in the core of human activities and corresponding land uses. In Table 2 and Table 3 and Figure 5, information on evaluated stream quality scores in relation to land-use regime is summarized. All plots in the forested part of the stream received high-score quality (very good or natural condition, median: 85). On the contrary, only 10% (3/29) of plots within the man-made land-use classes were evaluated as natural, and 17% (5/29) as good. Almost 60% (17/29) of the sampling plots received bad or poor-quality scores. All sampling plots in cultivated areas (ARA) received bad or poor-quality scores (median: 27.5). Likewise, most sampling plots within industrial areas (70%, 5/7) or dense urban fabric (67%, 4/6) received bad or poor-quality scores. Sampling plots within the light urban fabric were highly variable, with values ranging from bad to natural conditions. Finally, sample plots within pastures received in general higher-quality scores than all the other human-induced land-use classes.

Table 2.
Stream quality conditions of 37 sampling plots in relation to different land-use regimes.

Table 3.
Number of plots on each different land-use class (N), the median (Med.), minimum (Min.), and maximum (Max.) QBR score (sc.), and Standard Deviation (Std. dev.).
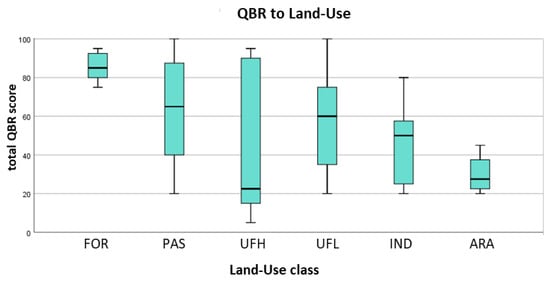
Figure 5.
Boxplots of QBR scores in relation to different land-use classes.
RCS (riparian cover score) values (Figure 6) depend on total tree and shrub cover and receive negative weights for lack of connectivity with neighboring woodlands or forests. The highest possible values (20–25) indicate high tree and shrub cover and high connectivity, while the minimum possible ones (0–5) indicate low coverage and minimum or no connectivity. CSS (cover structure score) values receive positive and high weights for the presence of helophytes and the relative structure of woody vegetation (sparse trees, thickets, or continuous tree layer) with trees prevailing. CQS (cover quality score) values are predetermined by the geomorphology of the sampling plot and receive high positive weights for the presence of native tree species in a highly continuous tree community and negative weights for the presence of alien species and signs of anthropogenic impact (buildings, garbage, etc.). CAS (channel alteration score) values depend on the type of stream channel alterations and the size of man-made structures (streets, bridges, terraces, etc.) within and around the channel. Most or all plots in classes PAS, UFH, UFL, IND, and ARA scored the lowest possible values for RCS (0–5), indicating low or no connectivity and low cover of woody vegetation. Problems of the intense presence of alien species and/or human influence mark many plots of ARA, IND, UFH, and UFL classes, while PAS sampling plots are in a moderate or good condition and FOR plots are dominated by native tree species with little or no signs of alien species or human influence. In terms of channel alterations (CAS) no part of Dendropotamos suffers from severe modifications, although all classes but UFL recorded one sampling plot with human works that alter the stream channel. All but a few sampling plots within the FOR scored the highest possible values (20–25) in all four sections: RCS, CSS, CQS, and CAS. PAS sampling plots scored moderate to highest possible values in the remaining sections: CSS, CQS and CAS.
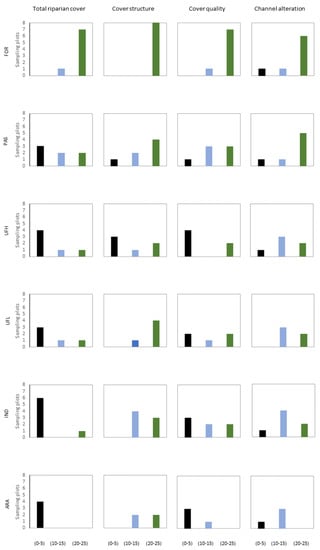
Figure 6.
Graphs of the four separated sections of QBR and their grouped scores in relation to land-use classes, e.g., in graph IND/section cover quality, three sampling plots received scores 0–5, two 10–15, and two 20–25.
The presence of alien species affects the quality of the riparian area [,,] and therefore degrades the QBR indexing. The invasion of alien species in Dendropotamos is extensive, as only nine locations did not record the presence of any alien woody species. The most common alien species is the highly invasive A. altissima followed by the established Prunus dulcis and Morus spp. In six plots, alien species dominate woody vegetation.
Nine species of Dendropotamos predominate the tree layer > 8 m. The species that most frequently dominates this layer is P. orientalis (14 plots), which is usually found in the upper part of Dendropotamos. This is followed by Populus alba, which occurs as dominant in six plots often at lower elevations. Salix alba and A. altissima had four occurrences as dominant in the tree layer > 8 m. One sampling plot had no species at this tree layer.
In the layer 4–8 m, fifteen different species of trees and shrubs were recorded as dominant, and four of them were alien. The most common is Celtis australis, followed by A. altissima and P. dulcis.
Differences in native and alien tree and shrub composition and cover among the plots of all land-use classes are summarized in the PCA diagram (Figure 7). Both components of PCA, PC1 and PC2, account for 48.53% of cover and composition variance, while PC1 accounts for 32.94% of variance. The broken stick method indicated that both principal components significantly capture parts of total variation. Along the PC1 axis, FOR sampling plots are differentiated by the presence of P. orientalis and Hedera helix and to a lesser extent Juglans regia, while A. altissima mainly and Rubus spp. mark almost all ARA and IND plots and several of the classes UFH and PAS. Plots of UFL are marked by a variable presence of all previous taxa. Along the PC2 axis, PAS, IND, ARA, and UFH differentiate from UFL, as the plots of the latter are marked by the presence of Ficus carica, C. australis, and Morus sp., while the former ones have plots with the significant presence of taxa belonging to the natural shrubby vegetation such as P. spinosa, Q. coccifera, Crataegus monogyna, Rosa sp., or the introduced P. dulcis.
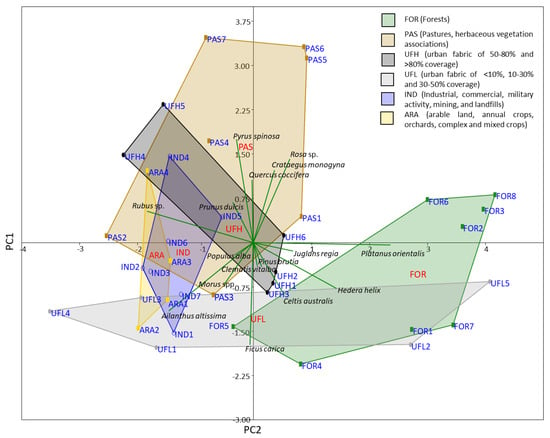
Figure 7.
PCA of the dominant tree and shrub taxa distribution along the riparian zone of Dendropotamos in relation to different land uses (RMP coverage data). Alien/introduced taxa (e.g., A. altissima, F. carica, and Morus spp.) characterize human-induced land-use classes, elements of grazed shrublands (e.g., Q. coccifera, P. spinosa, and Rosa sp.) separate the ‘pasture’ segment of Dendropotamos, while high presence of riparian taxa such as P. orientalis and H. helix characterize most of its forested part.
4. Discussion
The part of Dendropotamos that crosses forested areas (FOR) has high coverage of trees and shrubs that are directly connected to the neighboring forest, with riparian P. orientalis dominant in all plots, negligible or no alien species presence, negligible human influence, and rare channel alterations. All these features contribute to the high overall QBR score received by the sampling plots lying within forested areas. The part of Dendropotamos that runs through pastures (PAS), though bearing negligible channel alterations comparable to those of forested areas, is characterized by moderate to complete loss of connectivity to forests/woodlands and is accompanied by lower tree and shrub coverage and a moderate to high presence of alien species and/or human influence. The main woody taxa of neighboring grazed shrublands, mostly shrubs such as Q. coccifera, P. spinosa, and Rosa sp., dominate the woody vegetation of this part of Dendropotamos, while P. orientalis is also present but not dominant. Among human-induced land uses this is the one for which most sampling plots of Dendropotamos received moderate to high QBR scores. Within light but mostly dense urban fabric (UFH and UFL) all previous features deteriorate. Specifically, complete with moderate loss of connectivity, mainly the high to moderate presence of alien species and moderate to severe channel alterations are registered. The invasive alien A. altissima is found in all but two sampling plots within the urban fabric, both light and dense, corresponding to 88% of its total occurrences (9/11). However, the UFL part of Dendropotamos received versatile QBR scores because of a distinctly high cover structure and high- to moderate-quality values, while two thirds of UFH sampling plots had very low QBR scores. Finally, the parts of Dendropotamos that cross the industrial urban environment and cultivated areas are the most altered. Near or complete loss of connectivity, mainly due the o thigh to moderate presence of alien species/human influence and moderate to severe channel alterations, resulted in very low QBR scores for the majority (IND) or all sampling plots (ARA).
Some of the negative aspects concerning the riparian vegetation of Dendropotamos such as low woody coverage and related connectivity could be alleviated within certain land-use regimes. Pastures around Dendropotamos show significant signs of afforestation over the last decades (Figure 8) because of reduced grazing pressure. On the contrary, the same features are hard to alleviate within an agricultural landscape where woodland connectivity, for example, is excluded. Other studies [,,,] have reached the same conclusion that agriculture exerts the most negative impact on the quality of streams. Within the core of urban land-use classes, IND, UFH, and UFL, the QBR assessment showed that the latter has the potential of improvement, as moderate residential pressure, exerted upon riparian vegetation cover quality and channel status, can be alleviated. In forested parts the maintenance of an overall high-quality status for the riparian environment appears a rather easy task that could be achieved, e.g., through increased public awareness.
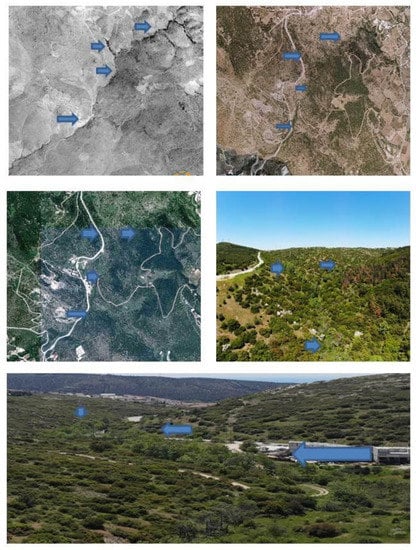
Figure 8.
Afforestation of the part of Dendropotamos crossing pastures. From top left to bottom: aerial photos of 1945–1960, 2007–2009, 2015–2016, and 2021. Blue arrows are pointing at the riparian area.
As was expected, QBR and RMP protocols easily demonstrated the degradation of the Dendropotamos riparian habitat, most of which was ‘urbanized’ over the last decades. Most stream and vegetation properties suffered modifications [], especially in areas that constitute the core of urban environments with a distinct severe human impact [].
5. Conclusions
Protocols for the assessment of riparian environments such as QBR and RMP could be useful in evaluating the status of urban riparian vegetation and stream quality. In the case of Dendropotamos, this quick assessment has highlighted the variety of conditions prevailing in the stream, a variety that is related to major urban land-use classes. Stream quality and vegetation preserve a high status within natural (forested) and to a lesser degree semi-natural (pastures) environments, in the latter due to alleviation of grazing pressure. Within the core of the urban environment, residential and industrial areas, conditions are worsened due to the deterioration of vegetation properties (total cover, structure, and quality), the presence of alien/introduced species, and stream channel alterations. The same conditions occur throughout the ‘agricultural’ part of the stream. The QBR protocol could serve as a tool in planning and restoring the urban riparian environment by pinpointing areas that have such potential, i.e., the light residential urban fabric.
Author Contributions
Conceptualization, G.T.; methodology, G.T.; software, G.T. and S.P.; validation, G.T. and S.P.; formal analysis, G.T. and S.P.; investigation, G.T. and S.P.; writing—original draft preparation, G.T.; writing—review and editing, G.T. and S.P.; visualization, G.T.; supervision, S.P.; project administration, G.T. All authors have read and agreed to the published version of the manuscript.
Funding
The research received no external funding.
Data Availability Statement
The data that support the findings of this study are available from the corresponding author upon reasonable request.
Conflicts of Interest
The authors declare no conflict of interest.
References
- Walton, C.R.; Zak, D.; Audet, J.; Petersen, R.J.; Lange, J.; Oehmke, C.; Hoffmann, C.C. Wetland buffer zones for nitrogen and phosphorus retention: Impacts of soil type, hydrology and vegetation. Sci. Total Environ. 2020, 727, 138709. [Google Scholar] [CrossRef] [PubMed]
- Lind, L.; Hasselquist, E.M.; Laudon, H. Towards ecologically functional riparian zones: A meta-analysis to develop guidelines for protecting ecosystem functions and biodiversity in agricultural landscapes. J. Environ. Manag. 2019, 249, 109391. [Google Scholar] [CrossRef] [PubMed]
- Everard, M.; Moggridge, H.L. Rediscovering the value of urban rivers. Urban Ecosyst. 2012, 15, 293–314. [Google Scholar] [CrossRef]
- Kenney, M.A.; Wilcock, P.R.; Hobbs, B.F.; Flores, N.E.; Martínez, D.C. Is Urban Stream Restoration Worth It? JAWRA J. Am. Water Resour. Assoc. 2012, 48, 603–615. [Google Scholar] [CrossRef]
- Trojanek, R. The impact of green areas on dwelling prices—The case of Poznań city. Entrep. Bus. Econ. Rev. 2016, 4, 27–35. [Google Scholar] [CrossRef]
- Trojanek, R.; Gluszak, M.; Tanas, J. The Effect of Urban Green Spaces on House Prices in Warsaw. Int. J. Strateg. Prop. Manag. 2018, 22, 358–371. [Google Scholar] [CrossRef]
- Shu, Y.; Zou, K.; Li, G.; Yan, Q.; Zhang, S.; Zhang, W.; Liang, Y.; Xu, W. Evaluation of Urban Thermal Comfort and Its Relationship with Land Use/Land Cover Change: A Case Study of Three Urban Agglomerations, China. Land 2022, 11, 2140. [Google Scholar] [CrossRef]
- Gašparović, S.; Sopina, A.; Zeneral, A. Impacts of Zagreb’s Urban Development on Dynamic Changes in Stream Landscapes from Mid-Twentieth Century. Land 2022, 11, 692. [Google Scholar] [CrossRef]
- Malmqvist, B.; Rundle, S. Threats to the running water ecosystems of the world. Environ. Conserv. 2002, 29, 134–153. [Google Scholar] [CrossRef]
- Allan, J.D. Landscapes and riverscapes: The influence of land use on stream ecosystems. Annu. Rev. Ecol. Evol. Syst. 2004, 35, 257–284. [Google Scholar] [CrossRef]
- Urban, M.C.; Skelly, D.K.; Burchsted, D.; Price, W.; Lowry, S. Stream communities across a rural–urban landscape gradient. Divers. Distrib. 2006, 12, 337–350. [Google Scholar] [CrossRef]
- Stefanidis, K.; Latsiou, A.; Kouvarda, T.; Lampou, A.; Kalaitzakis, N.; Gritzalis, K.; Dimitriou, E. Disentangling the Main Components of Hydromorphological Modifications at Reach Scale in Rivers of Greece. Hydrology 2020, 7, 22. [Google Scholar] [CrossRef]
- Chatzinikolaou, Y.; Ntemiri, K.; Zogaris, S. River riparian zone assessment using a rapid site-based index in Greece. Fresenius Environ. Bull. 2011, 20, 296–302. [Google Scholar]
- Latsiou, A.; Kouvarda, T.; Stefanidis, K.; Papaioannou, G.; Gritzalis, K.; Dimitriou, E. Pressures and status of the riparian vegetation in Greek Rivers: Overview and preliminary assessment. Hydrology 2021, 8, 55. [Google Scholar] [CrossRef]
- Matono, P. Effects of Agricultural Land Use on the Ecohydrology of Small-Medium Mediterranean River Basins: Insights from a Case Study in the South of Portugal; Batista, T., Ed.; IntechOpen: Rijeka, Croatia, 2019; pp. 29–51. ISBN 978-1-78985-704-7. [Google Scholar]
- Walsh, C.J.; Roy, A.H.; Feminella, J.W.; Cottingham, P.D.; Groffman, P.M.; Morgan, R.P., II. The Urban Stream Syndrome: Current Knowledge and the Search for a Cure. J. N. Am. Benthol. Soc. 2005, 24, 706–723. [Google Scholar] [CrossRef]
- Ojima, D.S.; Galvin, K.A.; Turner, B.L. The global impact of land-use change. Bioscience 1994, 44, 300–305. [Google Scholar] [CrossRef]
- Johnson, M.P. Environmental impacts of urban sprawl: A survey of the literature and proposed research agenda. Environ. Plan. A 2001, 33, 717–735. [Google Scholar] [CrossRef]
- DeFries, R.S.; Foley, J.A.; Asner, G.P. Land-use choices: Balancing human needs and ecosystem function. Front. Ecol. Environ. 2004, 2, 249–257. [Google Scholar] [CrossRef]
- Stefanidis, K.; Papaioannou, G.; Markogianni, V.; Dimitriou, E. Water Quality and Hydromorphological Variability in Greek Rivers: A Nationwide Assessment with Implications for Management. Water 2019, 11, 1680. [Google Scholar] [CrossRef]
- Miserendino, A.M.; Casaux, M.L.; Archangelsky, R.; di Prinzio, M.; Brand, C.Y.; Kutschker, C. Assessing land-use effects on water quality, in-stream habitat, riparian ecosystems and biodiversity in Patagonian northwest streams. Sci. Total Environ. 2011, 409, 612–624. [Google Scholar] [CrossRef] [PubMed]
- Cheng, C.; Zhang, F.; Shi, J.; Kung, H.-T. What is the relationship between land use and surface water quality? A review and prospects from remote sensing perspective. Environ. Sci. Pollut. Res. 2022, 29, 56887–56907. [Google Scholar] [CrossRef] [PubMed]
- Carvalho, L.; Cortes, R.; Bordalo, A. Evaluation of the ecological status of an impaired watershed by using a multi-index approach. Environ. Monit. Assess. 2011, 174, 493–508. [Google Scholar] [CrossRef] [PubMed]
- Valero, E.; Álvarez, X.; Picos, J. An assessment of river habitat quality as an indicator of conservation status. A case study in the northwest of Spain. Ecol. Indic. 2015, 57, 131–138. [Google Scholar] [CrossRef]
- Hooper, L.; Hubbart, J.A. A Rapid Physical Habitat Assessment of Wadeable Streams for Mixed-Land-Use Watersheds. Hydrology 2016, 3, 37. [Google Scholar] [CrossRef]
- Wiatkowski, M.; Tomczyk, P. Comparative Assessment of the Hydromorphological Status of the Rivers Odra, Bystrzyca, and Ślęza Using the RHS, LAWA, QBR, and HEM Methods above and below the Hydropower Plants. Water 2018, 10, 855. [Google Scholar] [CrossRef]
- Munné, A.; Prat, N.; Sola, C.; Bonada, N.; Rieradevall, M. A simple field method for assessing the ecological quality of riparian habitat in rivers and streams: QBR index. Aquat. Conserv. Mar. Freshw. Ecosyst. 2002, 13, 147–163. [Google Scholar] [CrossRef]
- Cheimonopoulou, M.T.; Bobori, D.C.; Theocharopoulos, I.; Lazaridou, M. Assessing ecological water quality with macroinvertebrates and fish: A case study from a small Mediterranean river. Environ. Manag. 2011, 47, 279–290. [Google Scholar] [CrossRef]
- Vlahaki, D.; Tsitsoni, T.; Kontogianni, A. Silvicultural standards for riparian vegetation management. In Proceedings of the Fifth International Conference on Environmental Management Engineering, Planning & Economics, Mykonos Island, Greece, 14–18 June 2015; ISBN 978-960-6865-87-9. [Google Scholar]
- Zaimes, G.N.; Iakovoglou, V. Assessing Riparian Areas of Greece—An Overview. Sustainability 2021, 13, 309. [Google Scholar] [CrossRef]
- Zogaris, S.; Chatzinikolaou, Y.; Dimopoulos, P. Assessing environmental degradation of montane riparian zones in Greece. J. Environ. Biol. 2009, 30, 719–726. [Google Scholar]
- Krigas, N.; Kokkini, S. A survey of the alien vascular flora of the urban and suburban area of Thessaloniki, N Greece. Willdenowia 2004, 34, 81–99. [Google Scholar] [CrossRef]
- Dafis, S. Classification of Vegetation in Greece; Aristotle University of Thessaloniki: Thessaloniki, Greece, 1973; Volume IE. (In Greek) [Google Scholar]
- Hu, S.; Fan, Y.; Zhang, T. Assessing the Effect of Land Use Change on Surface Runoff in a Rapidly Urbanized City: A Case Study of the Central Area of Beijing. Land 2020, 9, 17. [Google Scholar] [CrossRef]
- Kastridis, A.; Margiorou, S.; Sapountzis, M. Check-Dams and Silt Fences: Cost-Effective Methods to Monitor Soil Erosion under Various Disturbances in Forest Ecosystems. Land 2022, 11, 2129. [Google Scholar] [CrossRef]
- Ferreira, M.T.; Albuquerque, A.; Aguiar, F.C.; Sidorkewicz, N. Assessing reference site and ecological quality of river plant assemblages from an Iberian basin using a multivariate approach. Archiv für Hydrobiologie 2002, 155, 121–145. [Google Scholar] [CrossRef]
- Hammer, Ø.; Harper, D.A.T.; Ryan, P.D. Paleontological Statistics Software Package for education and data analysis. Palaeontol. Electron. 2001, 4, 9–18. [Google Scholar]
- Aguiar, F.C.; Ferreira, M.T.; Albuquerque, A.; Moreira, I. Alien and endemic flora on reference and non-reference sites from Mediterranean type-streams of Portugal. Aquat. Conserv. 2007, 17, 335–347. [Google Scholar] [CrossRef]
- Zenetos, A.; Pancucci-Papadopoulou, M.A.; Zogaris, S.; Papastergiadou, E.; Vardakas, L.; Aligizaki, K.; Economou, A.N. Aquatic alien species in Greece: Tracking sources, patterns and effects on the ecosystem. J. Biol. Res. 2009, 12, 135–172. [Google Scholar]
- Fausch, K.D.; García-Berthou, E. The problem of invasive species in river ecosystems. In River Conservation: Challenges and Opportunities; Sabater, S., Elosegi, S.A., Eds.; Fundación BBVA: Bilbao, Spain, 2013; pp. 193–216. [Google Scholar]
- Fierro, P.; Bertrán, C.; Tapia, J.; Hauenstein, E.; Peña-Cortés, F.; Vergara, C.; Vargas-Chacoff, L. Effects of local land-use on riparian vegetation, water quality, and the functional organization of macroinvertebrate assemblages. Sci. Total Environ. 2017, 609, 724–734. [Google Scholar] [CrossRef]
- Díaz-Pascacio, E.; Ortega-Argueta, A.; Castillo-Uzcanga, M.M.; Ramírez-Marcial, N. Influence of land use on the riparian zone condition along an urban-rural gradient on the sabinal river, Mexico. Bot. Sci. 2018, 96, 180–199. [Google Scholar] [CrossRef]
- Mostakim, L.; Guennoun, F.Z.; Benaissa, H.; Fetnassi, N.; Ghamizi, M. Effects of land use change on the riparian zones’quality along the zat river and its tributaries: High atlas of morocco. Appl. Ecol. Environ. Res. 2022, 20, 1351–1367. [Google Scholar] [CrossRef]
- Shah, S.A.; Jehanzaib, M.; Lee, J.-H.; Kim, T.-W. Exploring the Factors Affecting Streamflow Conditions in the Han River Basin from a Regional Perspective. KSCE J. Civ. Eng. 2021, 25, 4931–4941. [Google Scholar] [CrossRef]
Disclaimer/Publisher’s Note: The statements, opinions and data contained in all publications are solely those of the individual author(s) and contributor(s) and not of MDPI and/or the editor(s). MDPI and/or the editor(s) disclaim responsibility for any injury to people or property resulting from any ideas, methods, instructions or products referred to in the content. |
© 2023 by the authors. Licensee MDPI, Basel, Switzerland. This article is an open access article distributed under the terms and conditions of the Creative Commons Attribution (CC BY) license (https://creativecommons.org/licenses/by/4.0/).