Article

A Qualitative Assessment of River Plumes Coupling SWAT Model Simulations and a Beach Optical Monitoring System

by
Nada Joumar
1,*,
Soumaya Nabih
2,
Antonis Chatzipavlis
3,
Adonis Velegrakis
3,
Thomas Hasiotis
3,
Ourania Tzoraki
3,*,
Jamal Eddine Stitou El Messari
1 and
Lahcen Benaabidate
2
1
Laboratory of Applied and Marine Geosciences, Geotechnics and Geohazards (LR3G), Faculty of Sciences, Abdelmalek Essaâdi University, Tetouan 93002, Morocco
2
Laboratory of Functional Ecology and Environment Engineering, Department of Environment, Faculty of Sciences and Techniques, University of Sidi Mohamed Ben Abdellah, Fez 30000, Morocco
3
Department of Marine Sciences, School of the Environment, University of the Aegean, 81100 Mytilene, Greece
*
Authors to whom correspondence should be addressed.
Hydrology 2023, 10(2), 38; https://doi.org/10.3390/hydrology10020038
Submission received: 11 November 2022 / Revised: 15 January 2023 / Accepted: 17 January 2023 / Published: 30 January 2023

Abstract

:
The study of plumes occurring at the mouth of small rivers of temporal flow is a challenging task due to the lack of sedimentological and flow data of appropriate spatiotemporal scales. The present contribution examined the case of a typical un-gauged intermittent Mediterranean stream located in Northern Crete (Xiropotamos river). The SWAT (soil and water assessment tool) model was used to simulate and reproduce the hydrological behavior of the adjacent intermittent (Giofyros) river discharging at the same beach, the basin of which has the same geomorphological and hydrological characteristics. The output of the calibrated SWAT model was used to simulate daily flow data for the year 2014. The results were then considered together with the results of the RGB analysis of optical datasets of high spatio-temporal resolution for the same period, derived from a beach optical monitoring system (BOMS). The RGB analysis of the optical (TIMEX) imagery was shown to be a useful technique to identify and classify coastal plumes by using the spatio-temporal variability of pixel properties. The technique was also shown to be useful for the (qualitative) validation of the SWAT output and could be further improved by the collection of ‘ground truth’ data.

1. Introduction

Intermittent rivers/streams are characterized by periodical, seasonal or/and episodic/ephemeral flows, occurring during wet periods and flash flood events. Despite their ephemeral flow, these systems are of high significance for sediment mobilization and transport, accounting for more than 30% of the total length and discharges of the global river network [1] and draining over half the world’s land surface [2]. At the same time, more and more rivers around the world are becoming intermittent due to water diversion, groundwater extraction, flow regulation and land-use alteration, as well as climate change factors [3,4,5,6].
In the Mediterranean, intermittent river basins account for more than 40% of the total [7], with the intermittent rivers being very significant surface water bodies [2,8]. In recent years, negative trends in streamflow have been reported in Europe [3,4,9,10,11,12] with recent studies suggesting that zero-flow days are increasing and tend to occur earlier in the season, particularly around the Mediterranean basin [13,14]. However, despite the significant European legislation encouraging towards the identification/restoration of the quality of the European hydrological network [15,16], little emphasis has been placed on intermittent rivers, which also are associated with a dearth in adequate monitoring networks/systems able to provide information of appropriate spatio-temporal resolutions [1,17].
Intermittent rivers are characterized by long no-flow periods during the dry season, interspersed with periods of high flows and flash floods related to periods of high precipitation [2,18]. Flow intermittence can be spatio-temporally variable, depending on the meteorological conditions [19,20], geological and topographic controls [21] and human constructions such as dikes, dams and reservoirs (e.g., [22]). During high flows, buoyant river water is transported into the coastal ocean resulting in the generation of river plumes that influence coastal water bodies and involve significant volumes of sediment. Coastal water stratification in such plumes constrains sediment mixing and influences the coastal sediment transport processes [23,24], particularly in the case of reduced tidal influence and in periods of low wind stress [25,26].
Plumes comprise dynamically distinct regions spanning a large range of spatio-temporal scales [27]. The spatio-temporal variability of periodical/ephemeral coastal plumes makes them difficult to study. During the last decades, significant advances in remote sensing and satellite sensors have provided a better understanding of these processes and many studies use satellite or/and aerial images for the monitoring of the coastal processes [27,28,29,30,31,32,33,34]. However, most satellite information cannot easily resolve the evolution of the coastal plumes from small to medium streams with adequate spatio-temporal resolution [35,36,37].
In recent years, there has been an emphasis on the development/deployment of coastal optical monitoring systems, e.g., [38] for real-time monitoring of coastal processes. Time-stack (averaged) images can be obtained from the processing of videos derived from coastal video cameras. Such images (optical products) have been previously used to record coastal hydrodynamics and morphodynamics, including the spatial distribution of wave breaking [39,40], water flow velocities [41], detection of shoreline (e.g., [42]) and wave run-up [43] positions, coastal bathymetric changes [44] and topographic changes in tidal flats [45]; however, there is no known work focused on the detection and analysis of coastal river plumes. In the present study, the soil and water assessment tool (SWAT) [46,47], a widely used hydrological tool that can provide assessments of water level, flow and sediment dynamics of basins of different scales [48,49,50,51], was used to simulate the flow regime of a typical intermittent flow system on the island of Crete, in the eastern Mediterranean region. SWAT has been previously used in Mediterranean settings to simulate flows and provide assessments of water quality and sediment transport in the Mediterranean region (e.g., [10,52,53,54,55,56,57]) Simulation parameters were obtained after appropriate calibration of the SWAT model using the available meteorological and hydrological data, and validated utilizing the plumes identified in the images of a coastal optical monitoring system deployed in the study area.

2. Materials and Methods

2.1. Study Area

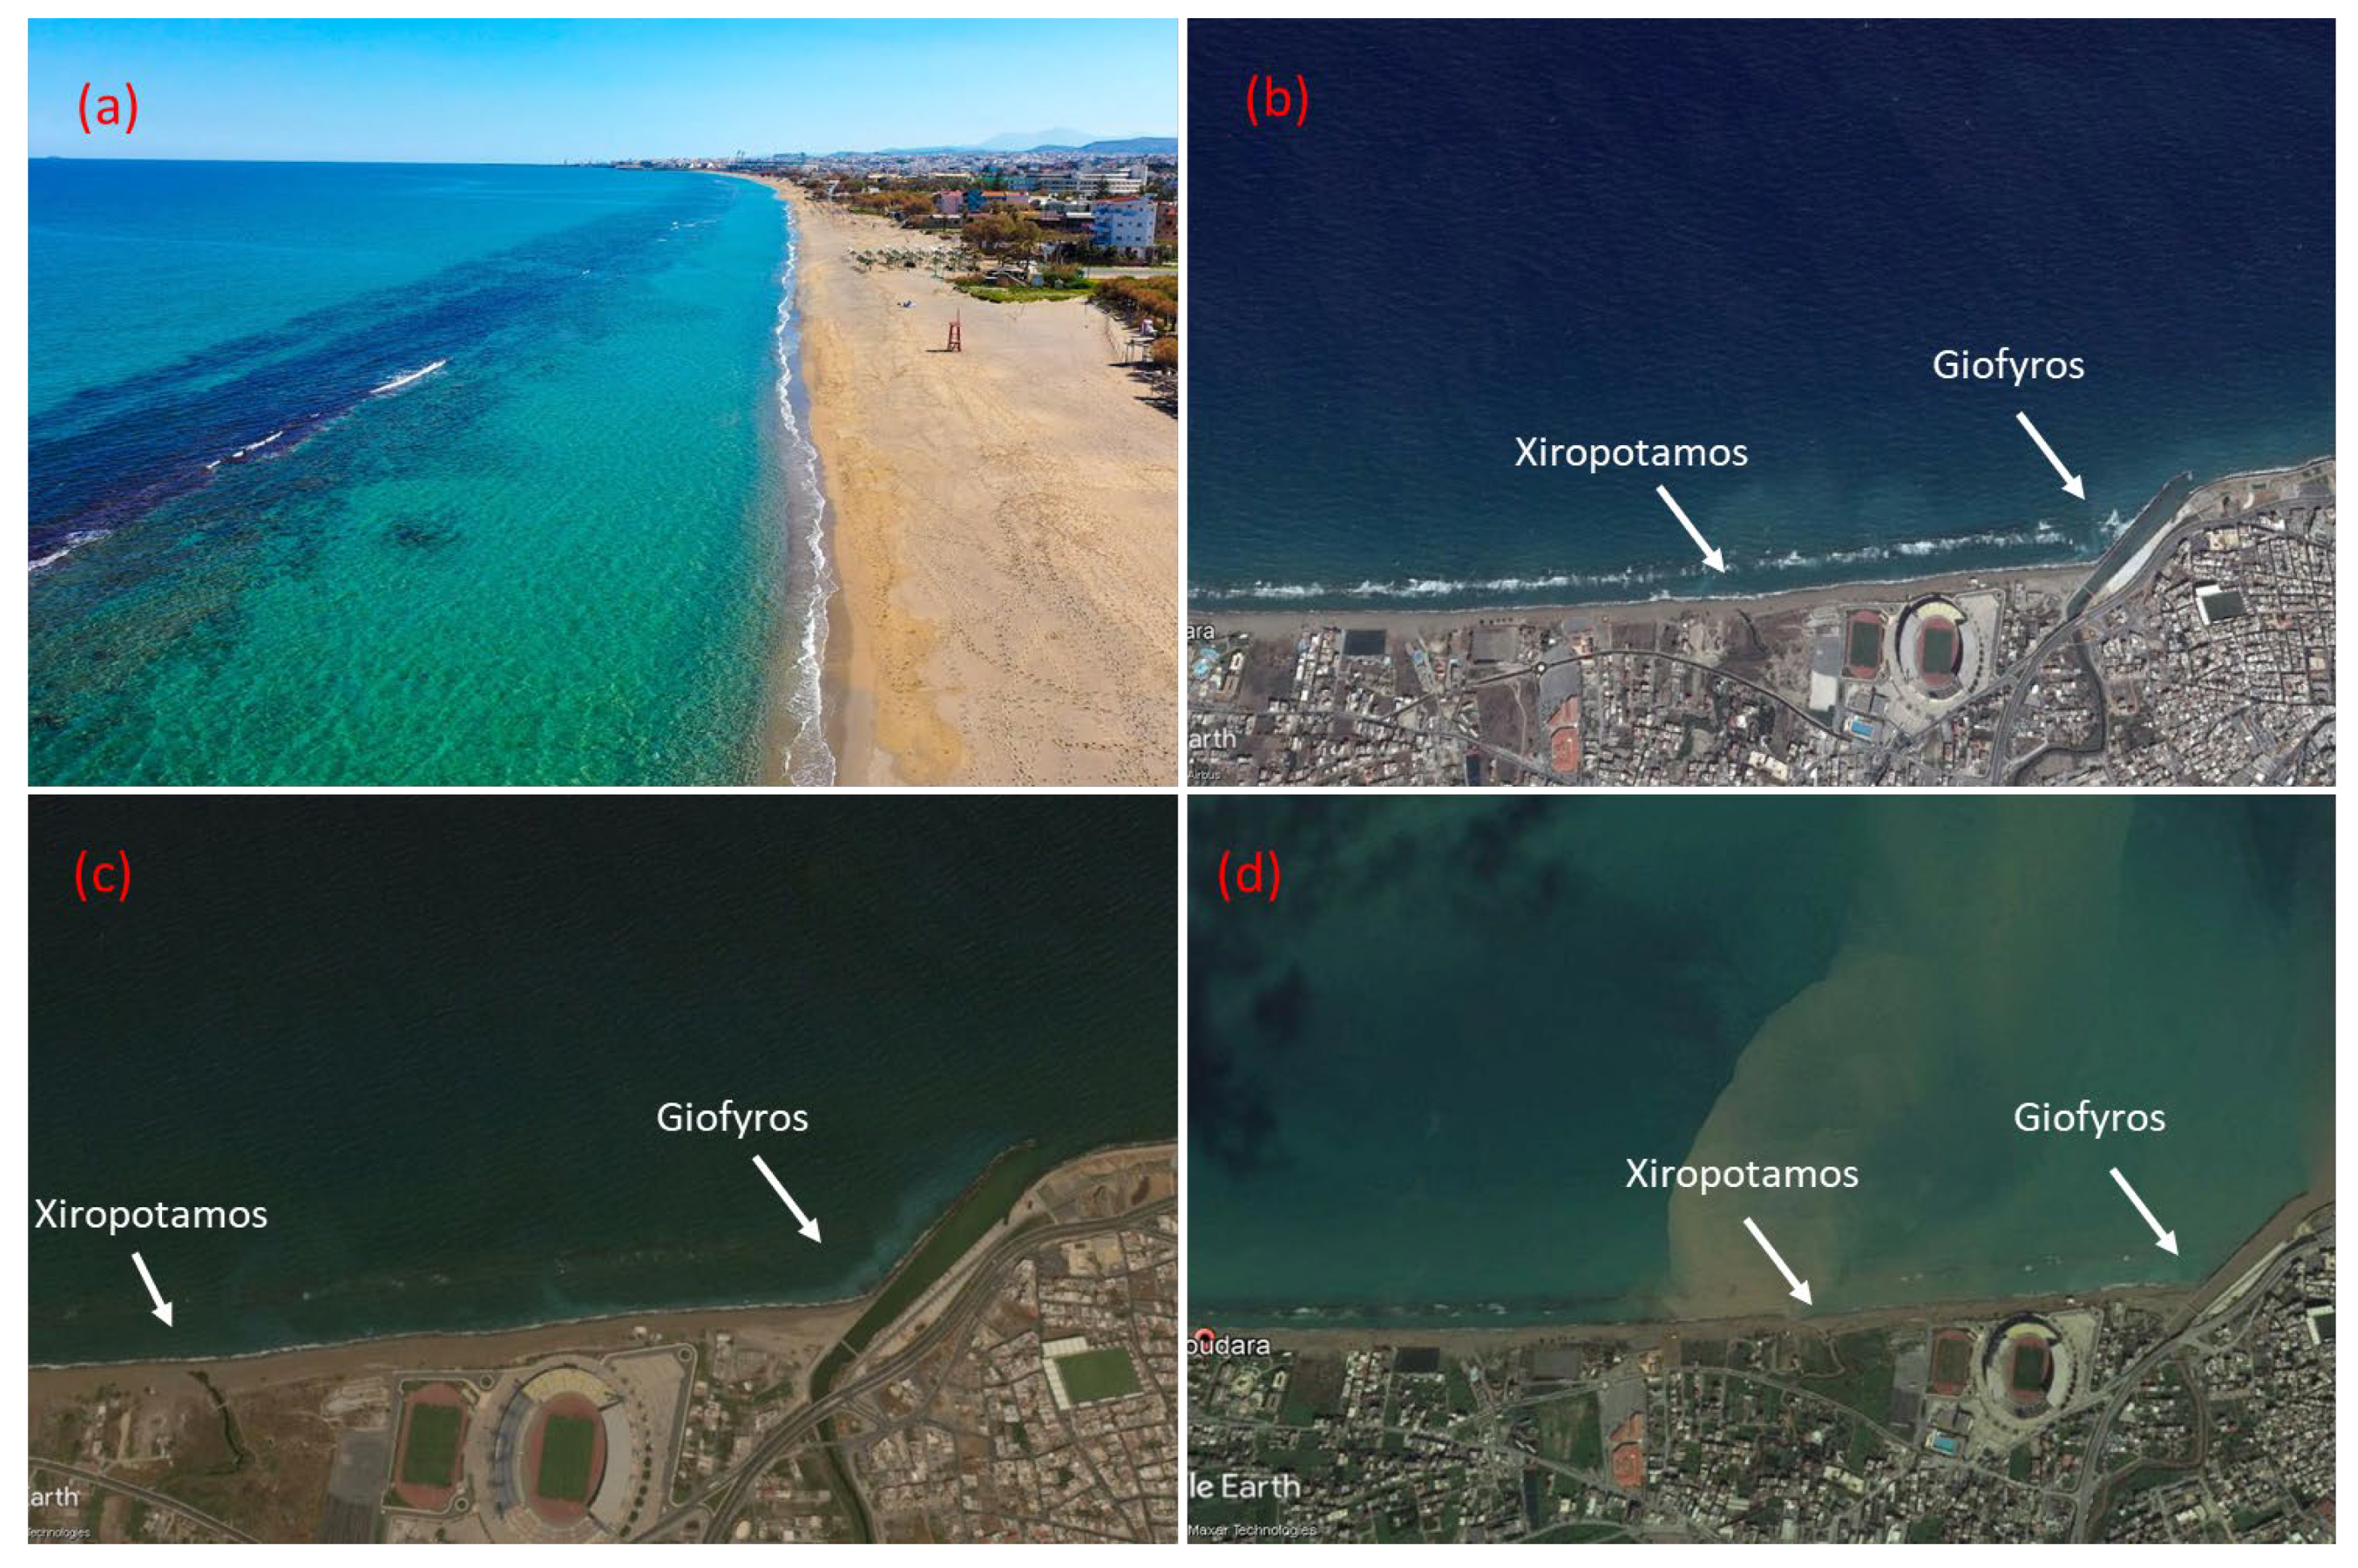
Located at the southernmost point of the Aegean sea, Crete is the largest of the Greek islands, covering an area of 8336 km2 and accounting for 6.3% of the total area of Greece [58]. The study focused on the adjacent hydrological basins of Xiropotamos and Giofyros rivers, two of the four intermittent rivers outflowing at Ammoudara beach [59],the main urban beach to the west of the island’s major city, Heraklion (Figure 1). Ammoudara beach is a 6.1 km long, urban beach that can be divided into two main sectors. At its western sector a beachrock reef, e.g., lithified beach sediments [60] is found at or close to the beach face, whereas at its eastern sector, the beachrock forms a submerged reef with a varying width and distance from the shoreline (Figure 2). Dry beach widths range between 22 and 75 m along the beach, with the inner beach associated with low sand dunes, as well as extensive human development. Beach face gradients vary, with the steeper gradients (5–8°) found in the east, where the dry beach forms on sands and gravely sands. Ammoudara beach is exposed to winds and waves from the northern sector; analysis of the available historical information has shown a significant shoreline retreat (10–60 m) and sediment loss since the 1960s, with longer retreats and higher spatio-temporal variability found at the eastern section variability [42,61].
The climate in this region is typically Mediterranean, characterized by long dry periods during summer and a few precipitation periods during winter (92 mm in January). During summer months, there is almost no stream except during some rare precipitation events, while in winter there are periods of heavy rainfall and run-off [62].
Xiropotamos hydrological basin has an area of about 48.6 km2, whereas the Giofyros River basin is approximately 4.5 times larger (186.5 km2, Figure 1). The Giofyros and Xiropotamos river outflows have been found to contain significant concentrations of both nutrients and pollutants, with runoff events having significant impacts on the quality of the coastal waters of Ammoudara beach [58]. A dyke (training coastal structure) has been constructed perpendicular to the coastline (Figure 2b,c) for the offshore dispersion of the Giofyros River discharges [63].
Giofyros river has a length of about 24.5 km, (with its tributaries 73.1 km). The mean elevation of the watershed is 360 m (maximum is 1764 m). Its watershed is mainly composed of alluvial deposits, whereas there are also a few karstic spots of insignificant aquifer discharge. The soil consists of alluvial regosols and marl and limestone leptosols. Primary land uses in the lower altitudes are olive groves and vineyards covering 34% and 24% of the basin, respectively. However, in higher altitudes (above 600 m) sparse Mediterranean scrubland (phrygana) is dominant. The lower part of the watershed, near the outlet, is highly urbanized and prone to flooding [64].
Information from three (3) meteorological stations, installed at different elevations (Phoenicia—79 m, Prof. Ilias—292 m and Ag. Varvara—620 m–Figure 1) showed an annual mean precipitation of 841 mm for the period 1956–2009, with annual minimum and maximum values of 496 mm and 1416 mm, respectively. Stream flows occur typically during the wet period (late October -early March), whereas there are mostly zero flows during the dry summer period. Giofyros riverine discharge to the Ammoudara beach has been estimated as 21.6 × 10⁶ m3/year [62,65].

2.2. Model Setup

SWAT (Soil and Water Assessment Tool) is a basin-scale, continuous time model that operates on a daily time step. It was developed by the USDA-Agricultural Research to predict the impact of watershed management on water, sediment, and agricultural chemical yields in gauged and ungauged watersheds. The model is physically based, computationally efficient, and capable of continuous simulation over long time periods [66]. Major model components include weather, hydrology, soil temperature and properties, plant growth, nutrients, pesticides, bacteria and pathogens, and land management. In SWAT, the watershed is divided into multiple sub-basins, which are further subdivided into hydrologic response units (HRUs). The simulation of the hydrological cycle by SWAT is done according to the following water-balance equation [67]:
S W t = S W 0 + j = 1 P d Q s E a W s e e p Q g
where S W t is the soil water content (mm), S W 0 is the initial water available to plants (mm), P d is the daily precipitation (mm), Q s is the surface runoff (mm), E a is the evapotranspiration (mm), W s e e p is the percolation (mm), Q g is the amount of return flow on a day (mm) and t is the time (days). Subdivision of the watershed enables the model to reflect the difference in evapotranspiration for various crops and soils. Thus, the runoff is predicted separately for each HRU and routed to obtain the total runoff for the watershed. This increases accuracy and gives a much better physical description of the watershed [67].
SWAT requires many geospatial input data since it is a physically based semi-distributed model. This dataset mainly includes an elevation map, soil database, land use/cover map and hydro-meteorological data. Daily precipitation data for the period January 1956–December 2009 were collected from four meteorological stations, Phoenicia, Prof. Ilias, Ag. Varvara and Heraklion (Figure 1). The daily temperature data were collected from two stations (Phoenicia and Heraklion), and daily flow observations were available from the Phoenicia station (Table 1).
The watershed delineation features in arc SWAT allow for the definition of the digital stream network layer based on the morphology of the basin using the DEM. The basin was divided into 25 sub-basins. Using the landuse and soil data, 198 Hydrological Response Units (HRUs) were created, and each unit is the result of the combination of a specific type of soil, land use and slope in each subbasin. This subdivision facilitates the calculation of the flow. taking into consideration the physical environment of the watershed [68]. For the calibration, the period used to run the model was from September 1977 up to August 1984 including both dry and wet years, and a three-year warmup period was included to account for hydrologic trends. A validation period of daily observations for the period September 1995 to August 1996 from the same station (Phoenicia) was used. The time steps of both calibration and validation are daily.

2.3. Calibration, Validation and Sensitivity Analysis

Among various methods to perform calibration and uncertainty analysis is the widely used Sequential Uncertainty Fitting 2 (SUFI-2) approach with the SWAT calibration uncertainty procedure (SWAT-CUP) [69,70]. SUFI-2 is a semi-automated approach, used to perform parameterization, sensitivity analysis, uncertainty analysis, calibration and validation of hydrologic parameters [71]. Sensitivity analysis in particular is necessary to understand which particular input parameter has a great impact on the model outflow [72]. In order to reduce the computing effort, the parameters chosen for the sensitivity and uncertainty analysis were chosen as the most sensitive following preliminary tests [73].
The P-factor, which is typically expressed as 95 PPU (indicating the cumulative distribution of the simulated variable at the 2.5% and 97.5% levels, e.g., 95% prediction uncertainty), is used to determine the degree of uncertainty. It represents the proportion of observed data developed by the 95 PPU band. For the simulation to be closer to accuracy, the P-factor needs to be closer to 100% and R-factor to zero [46]. Accordingly, the first run using the 11 selected parameters helped in defining the most sensitive parameters to use during the calibration by observing their P and R factors.
Most case studies implementing SWAT use both quantitative and qualitative criteria to assess the calibration results [46]. A single statistical criterion does not provide enough information to assess the goodness-of-fit of a hydrological model in all occasions, most commonly both the peak and low values. Indeed, a multitude of criteria need to be combined and compared [74,75]. Some studies [75] suggest the use of at least a goodness-of-fit and an absolute error criterion, while others [76,77] suggest that graphical techniques should be used in the evaluation of hydrologic modelling results.
The model performance was evaluated using the quantitative criteria, the Nash–Sutcliffe efficiency (NSE) [75,78], the percent of bias (PBIAS) [79] and the RSR (ratio of root mean square error to standard deviation) Indices [77] as presented in the following Equations:
N S E = 1 i = 1 n O i P i 2 i = 1 n O i O ¯ 2
P B I A S = i = 1 n O i P i 100 i = 1 n O i %
R S R = i = 1 n O i P i 2 i = 1 n O i O ¯ 2
where O i is the ‘ith’ observation for the constituent being evaluated, P i is the ‘ith’ simulated value for the constituent being evaluated, O ¯ is the mean of observed data for the constituent being evaluated, and n is the total number of observations.
Based on the existing literature review as well as knowledge of the location, 11 parameters were chosen for the model calibration presented in Table 2. Following its calibration and validation the SWAT was used to simulate flows for the period of the available optical datasets (TIMEX images, see below)) in order to check/validate the plume events. For this purpose, precipitation and temperature data for the same year derived from the Heraklion meteorological station were used as input data for the calibrated SWAT model.
The observed flow of the Phoenicia station was used for the calibration and validation process. The sensitivity analysis was conducted using SUFI-2 in SWAT-CUP, and out of the initially selected parameters, 11 parameters were identified for the calibration process (Table 3), out of which, the most sensitive parameters were found to be SOL_K, RCHRG_DP and SOL_Z, according to the p values estimated.
The semi-automated calibration focused on the soil parameters SOL_K and SOL_Z. Additionally, to approach the average annual water mass balance values for Giofyros and especially evapotranspiration, ESCO and EPCO were used to produce the maximum possible evapotranspiration. CN2 and LAT_TIME were employed to produce the peaks of the hydrograph. The LAT_TTIME parameter regulates the discharge rate of soil lateral flow and was added to produce flashy peaks. Finally, the groundwater parameters (GWQMN, RCHRG_DP and ALPHA_BF) were calibrated to estimate the baseflow.

2.4. RGB Analysis of Optical Data

Coastal river plumes transport more than one-third of the precipitation runoff as well as sediments from land to the ocean [80]. The quantity, distribution, and color of light reflected from the surfaces of the highest sediment particles in the water column greatly influence the visibility and appearance of the plume. Thus, it is possible to detect a plume event from the spectral signature of the reflected light from a water surface, with the properties of the reflecting material/surface controlling the intensity and the wavelength of the reflected light [81].
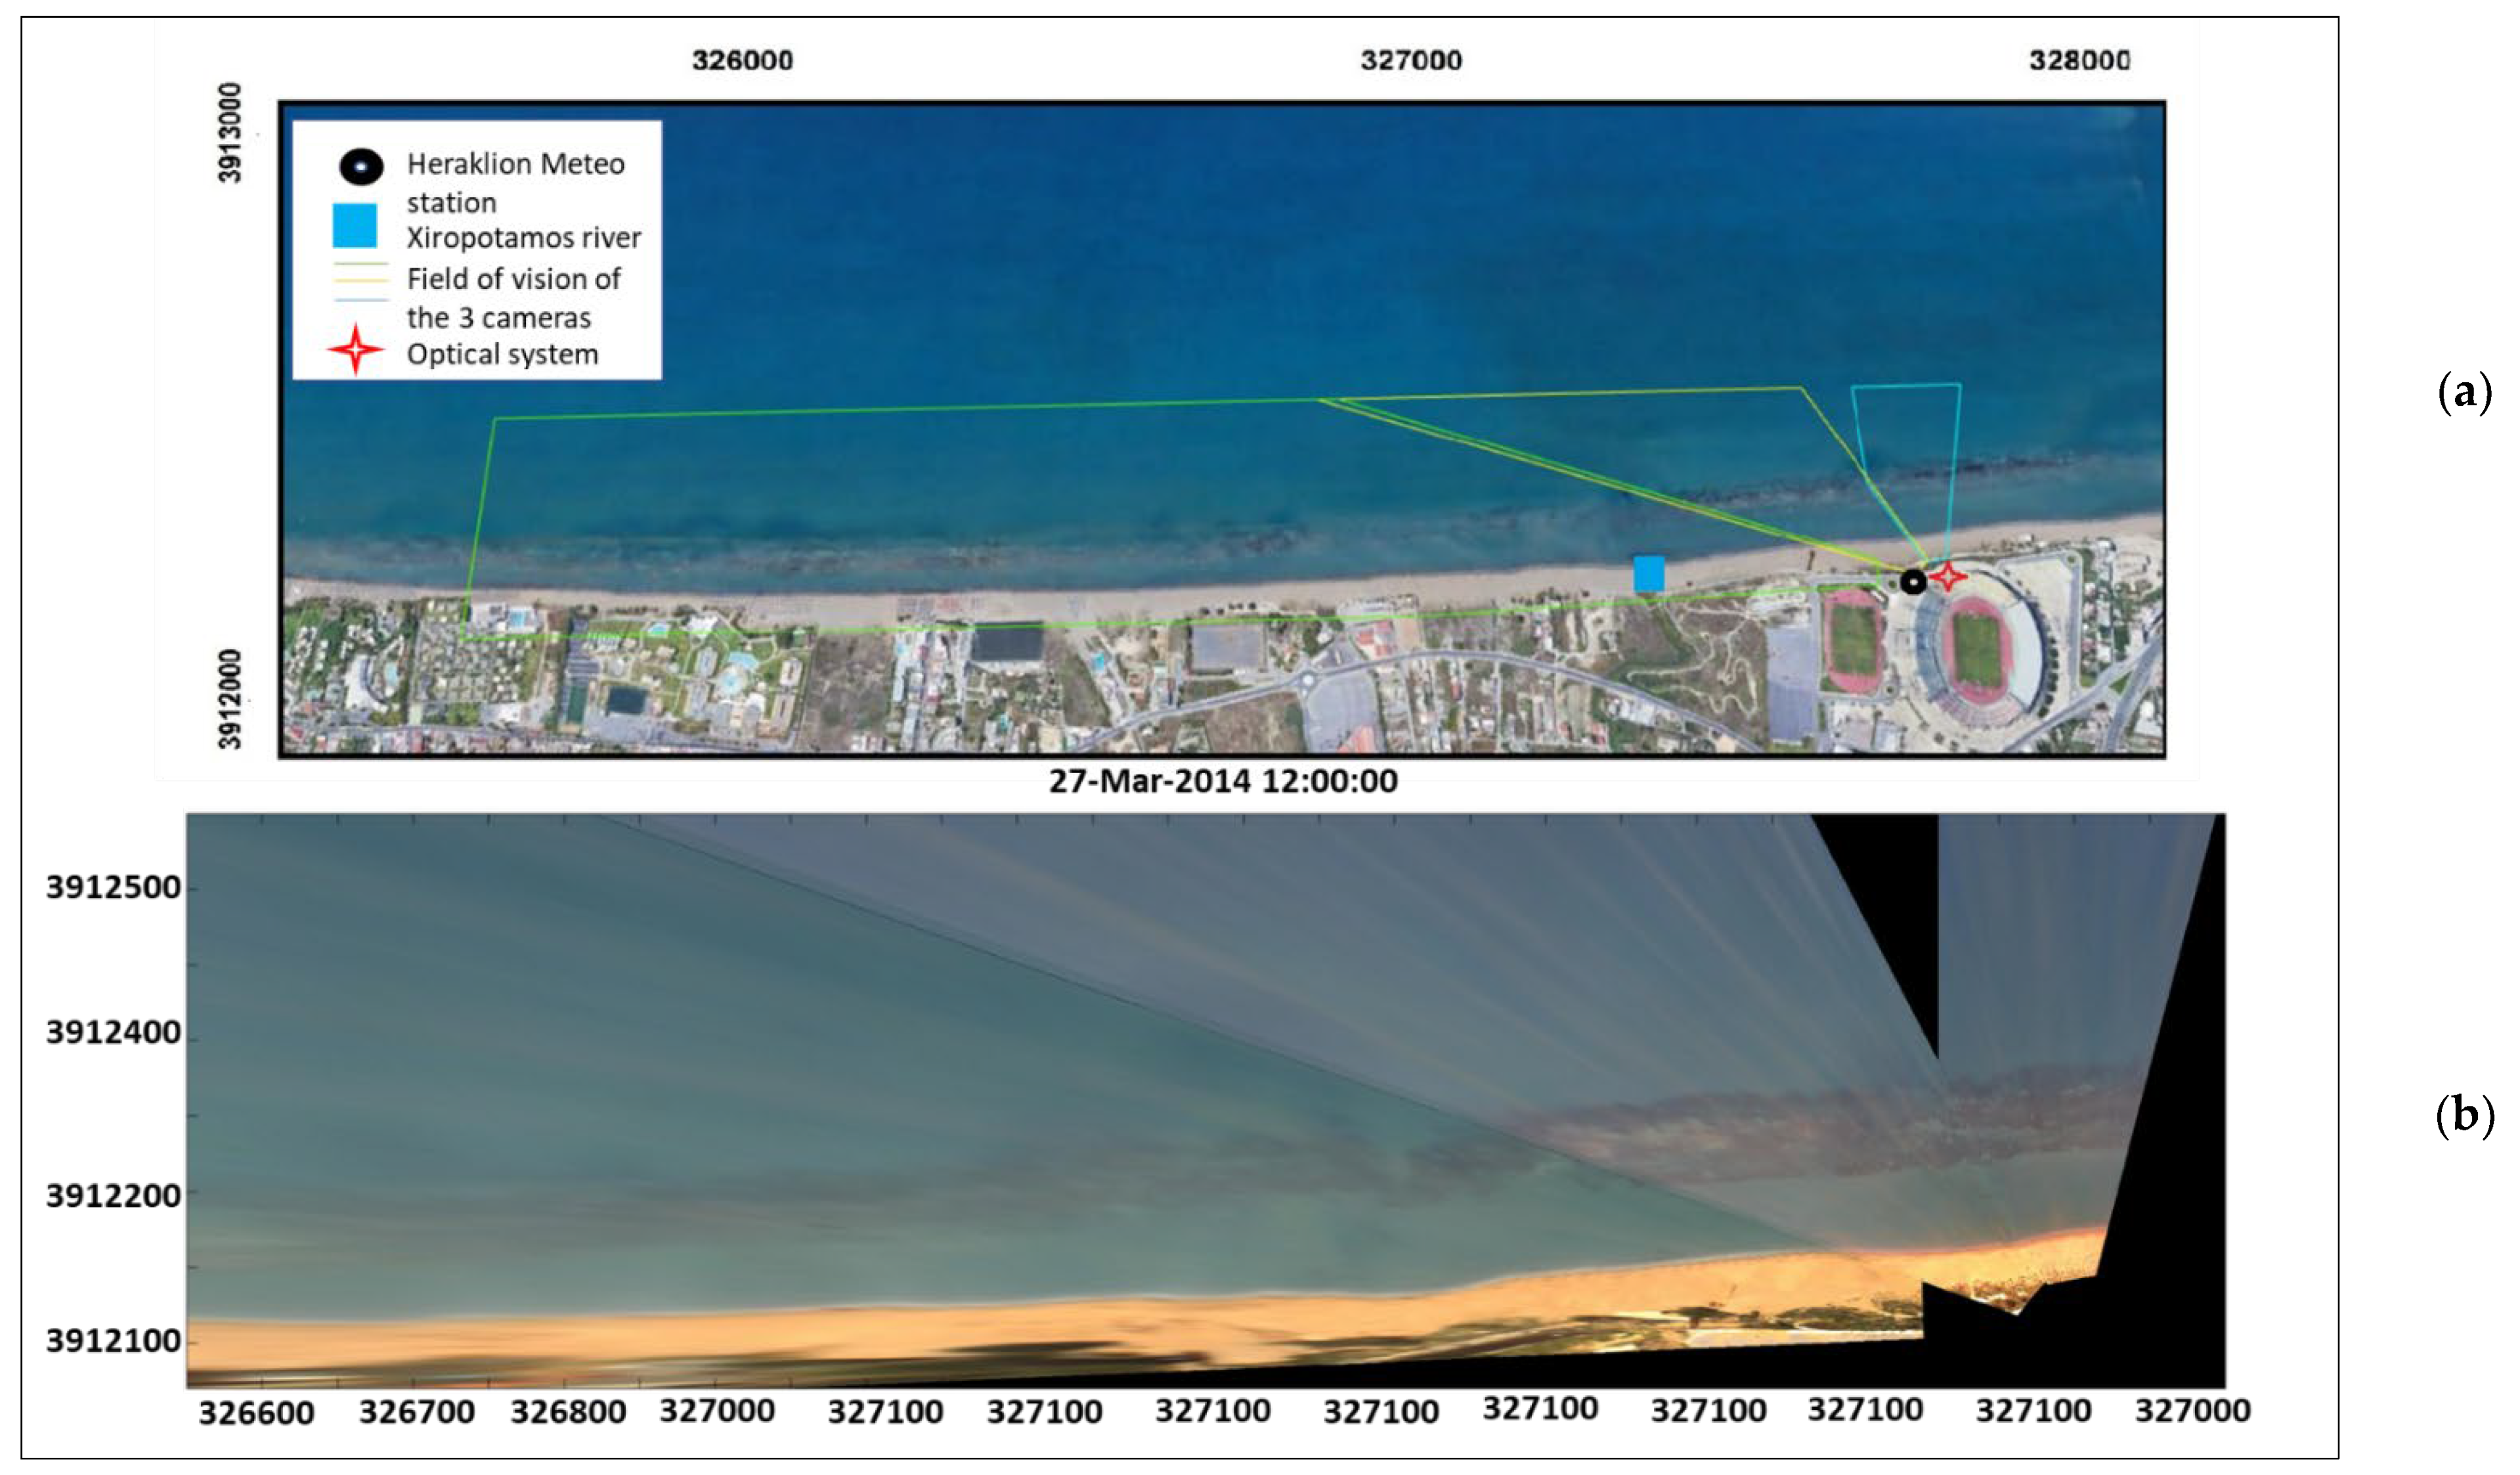
The optical products/meta-data from a beach optical monitoring system deployed at the eastern margin of Ammoudara beach [42] were used in this study for RGB analysis. The optical system was deployed on the roof of the Olympic stadium at an elevation of 26 m (Figure 3a) and is composed of 3 PointGrey FLEA-2 video cameras connected to a station pc, set to monitor a beach stretch (about 2400 m) at the eastern part of Ammoudara beach. However, as image resolution decreases with distance, images were analyzed for a beach stretch of (1400 m long) proximal to the station. Xiropotamos outlet was within the system’s field of vision, but not the Giofyros outlet; therefore, the RGB image analysis refers to the Xiropotamos river plumes. The optical system was set to operate in burst mode, retrieving 10-min 3 gp videos with a resolution of 1920 × 1080 pixels, at the beginning of each daylight hour, and a sampling rate of 5 Hz (i.e., 3000 images per hour). From these images, and following specialized image processing techniques, high-resolution time-stack imagery (TIMEX mosaics) expressing the “mean state” of the beach for these 10 min periods (Figure 3b), were generated amongst other optical coastal products (for details see [42]).
River discharge rate is a main variable affecting the size of river coastal plumes [34,82,83]. These plumes tend to be formed during times of rapid sediment outputs as rivers reach peak discharges [84,85]. In order to qualitatively validate the rainfall-runoff events with the use of the TIMEX imagery, RGB analysis was carried out. For each color channel (Red, Blue or Green) a display histogram was constructed expressing the conditions before, during and after four selected events characterized by increased precipitation levels. The events were selected on the basis of the hydrograph of Giofyros watershed in 2014, and the availability of suitable TIMEX images from the Ammoudara beach (i.e., absence of cloudiness which could affect the color distribution in the TIMEX images). It is noted that the visualized RGB histograms of the selected TIMEX images were produced for a selected area close to Xiropotamos river mouth (dimensions of 573 × 163 pixels), where high sediment discharges during plume events were found to take place.

3. Results

3.1. SWAT Simulations

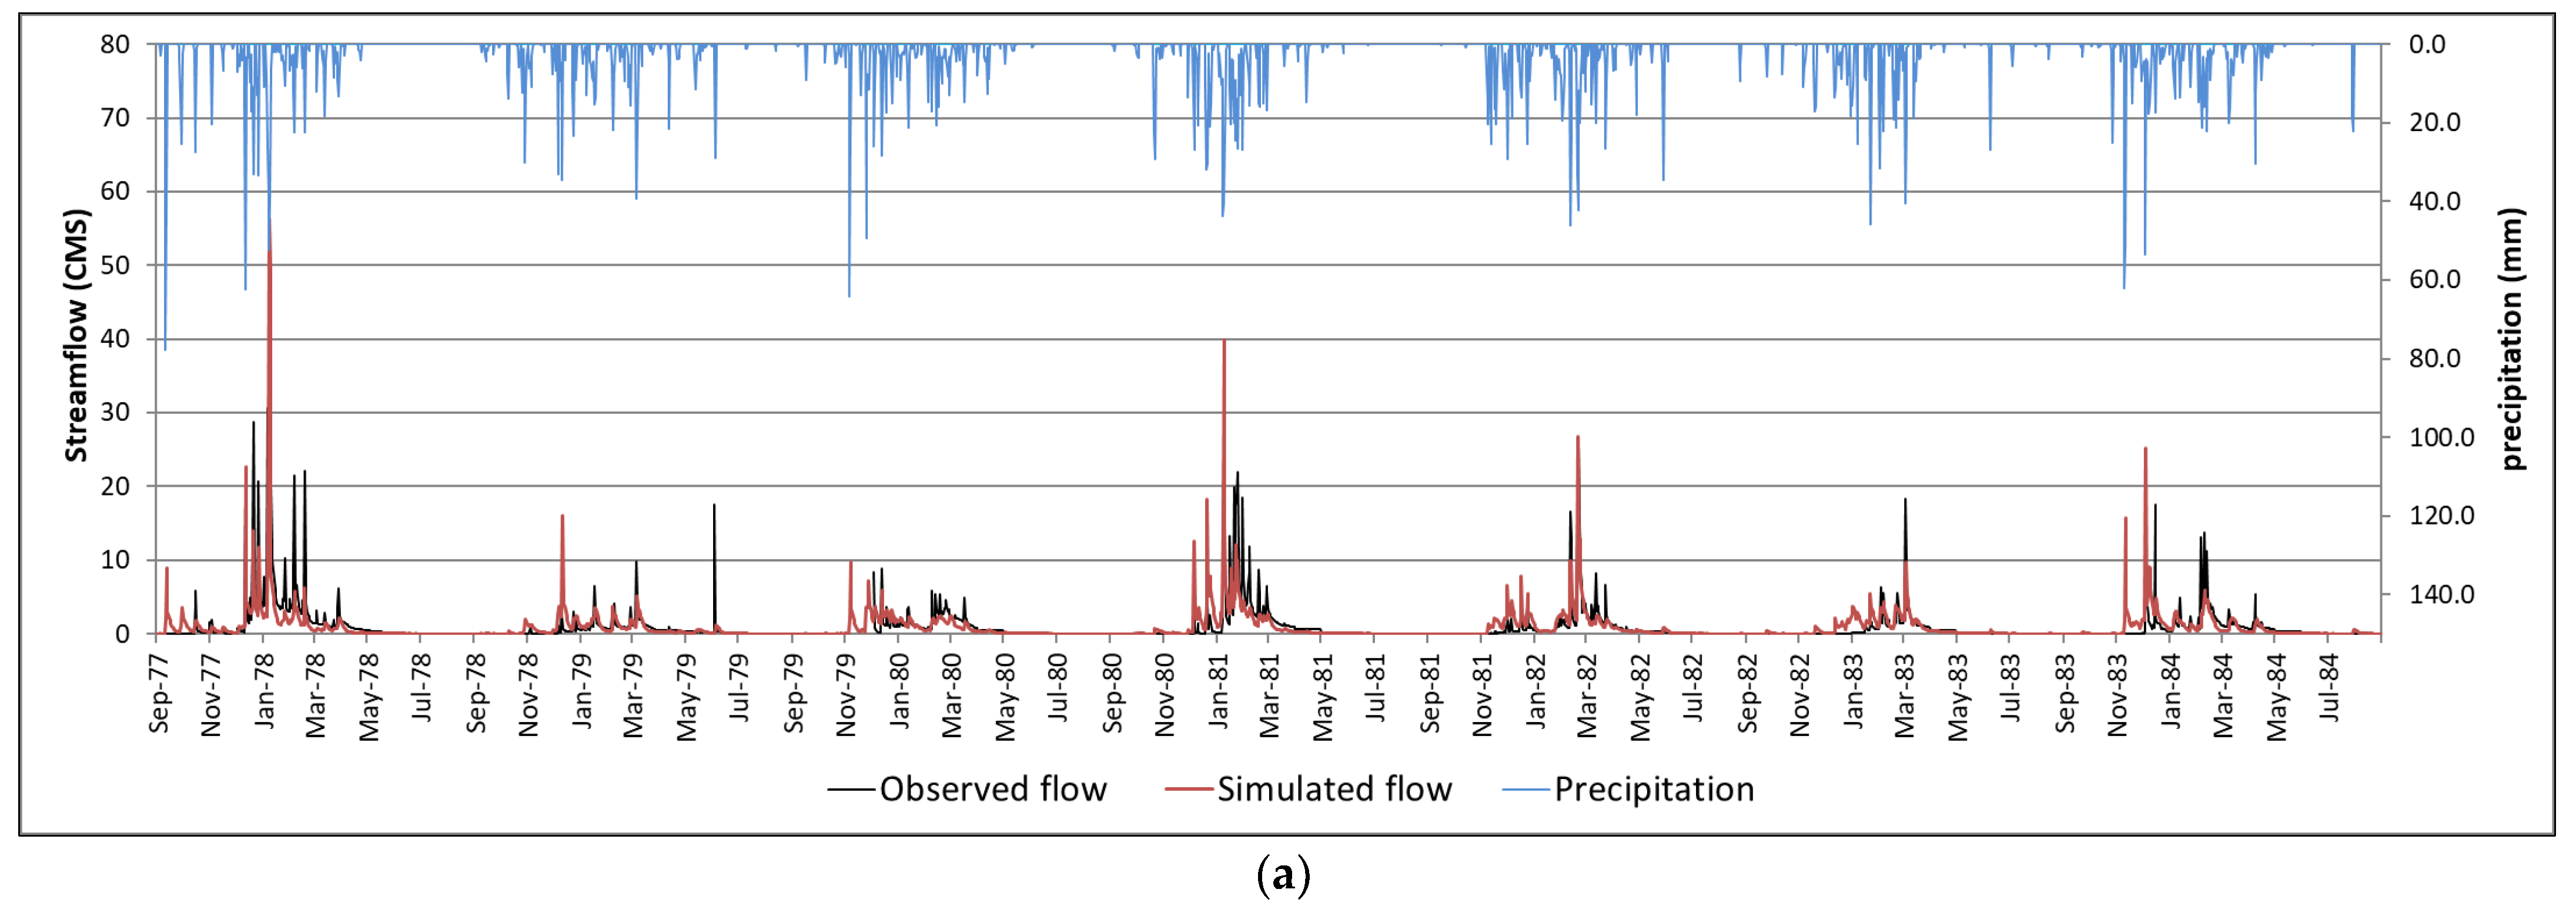
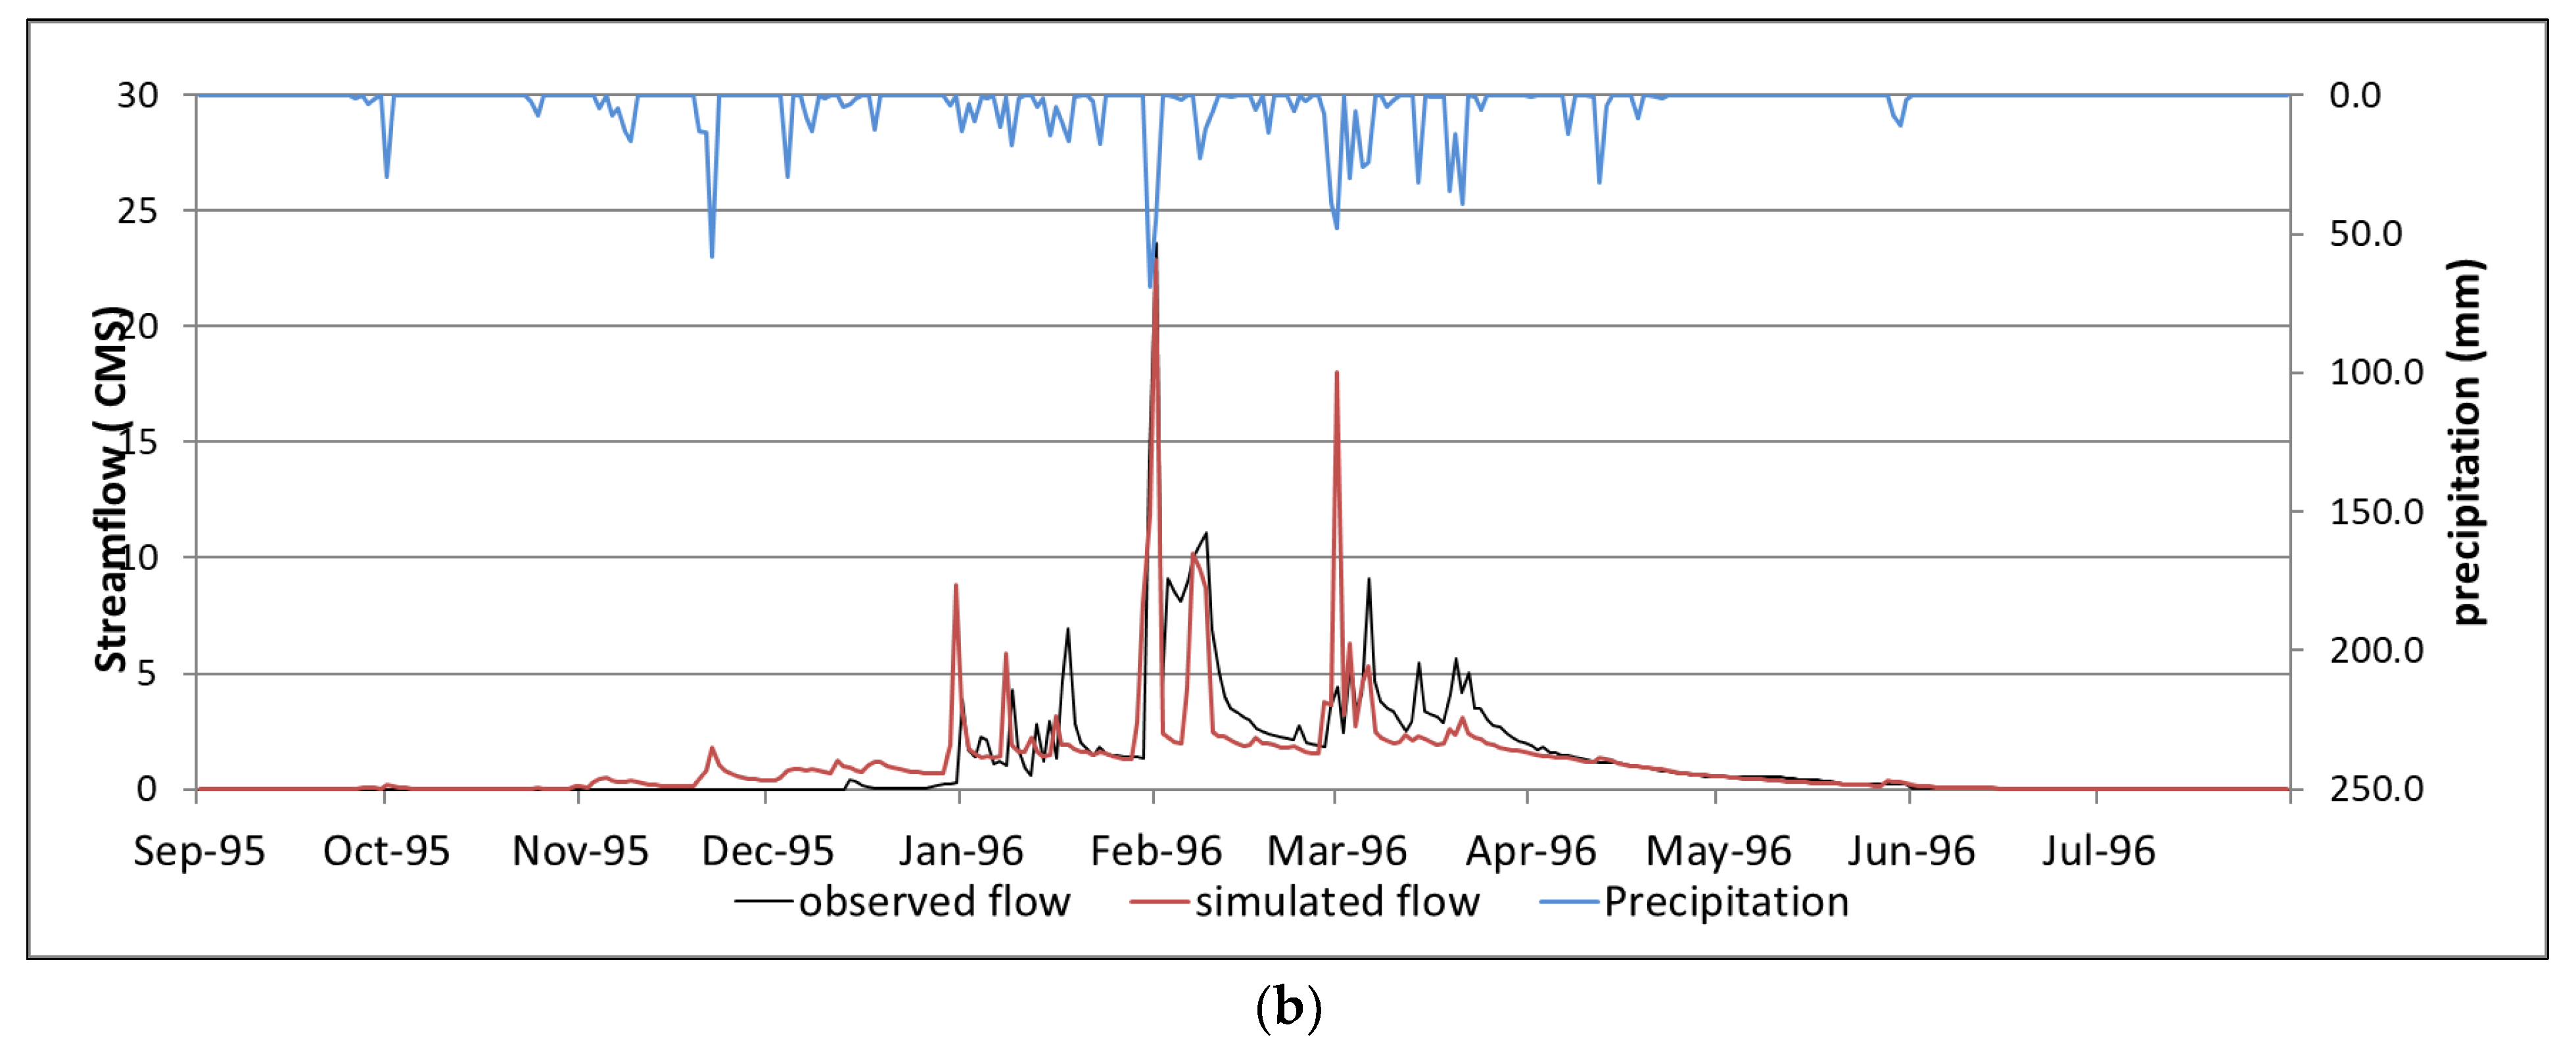
The hydrographs representing the results for the calibration and validation periods are shown in Figure 4. It is evident that the simulated flow generally follows the patterns of the observed flow for both calibration and validation periods. However, the model was not able to simulate flows during specific precipitation events, during which the recorded flow was high (e.g., in February 1978, June 1979 and May 1981—Figure 4a), this could be attributed to the steep slopes, evident in higher latitudes, which intensify the runoff. Furthermore, the Soil Conservation Service (SCS) Curve Number (CN2) method [86] includes only hydraulic parameters of the soil to estimate different stages of soil moisture, and it does not take into account the precipitation intensity [87]. The latter affects the infiltration rate, which is typically modified to resemble dry, normal, and wet conditions. During dry periods, the CN2 method allows for more water infiltration and water retention by the soil; thus, it cannot simulate adequately intense flash floods occurring in the middle of the dry period. Nevertheless, during the calibration period of 1983, the hydrograph showed acceptable and well-correlated results (Figure 4a).
When examining the projected and recorded flows during the validation period of 1995–1996, there are some noticeable peaks in the simulated flow that do not match with the recorded data (i.e., in January and March 1996—Figure 4b). The latter may be attributed to the scarcity of the meteorological stations that influences the precipitation spatial distribution over the watershed. Furthermore, the results of PBIAS statistical criterion shows a gradual flow overestimation for the validation period (1995–1996) (Table 4). In comparison, both the Nash-Sutcliffe (NSE) and RSR criteria were found to be acceptable for both calibration and validation periods (>0.5 and <0.7, respectively), which are within the range [77]. Overall, SWAT model simulation showed good performance, and was able to accurately simulate baseflow discharge, as well as projecting with acceptable accuracy most of the recorded flows.
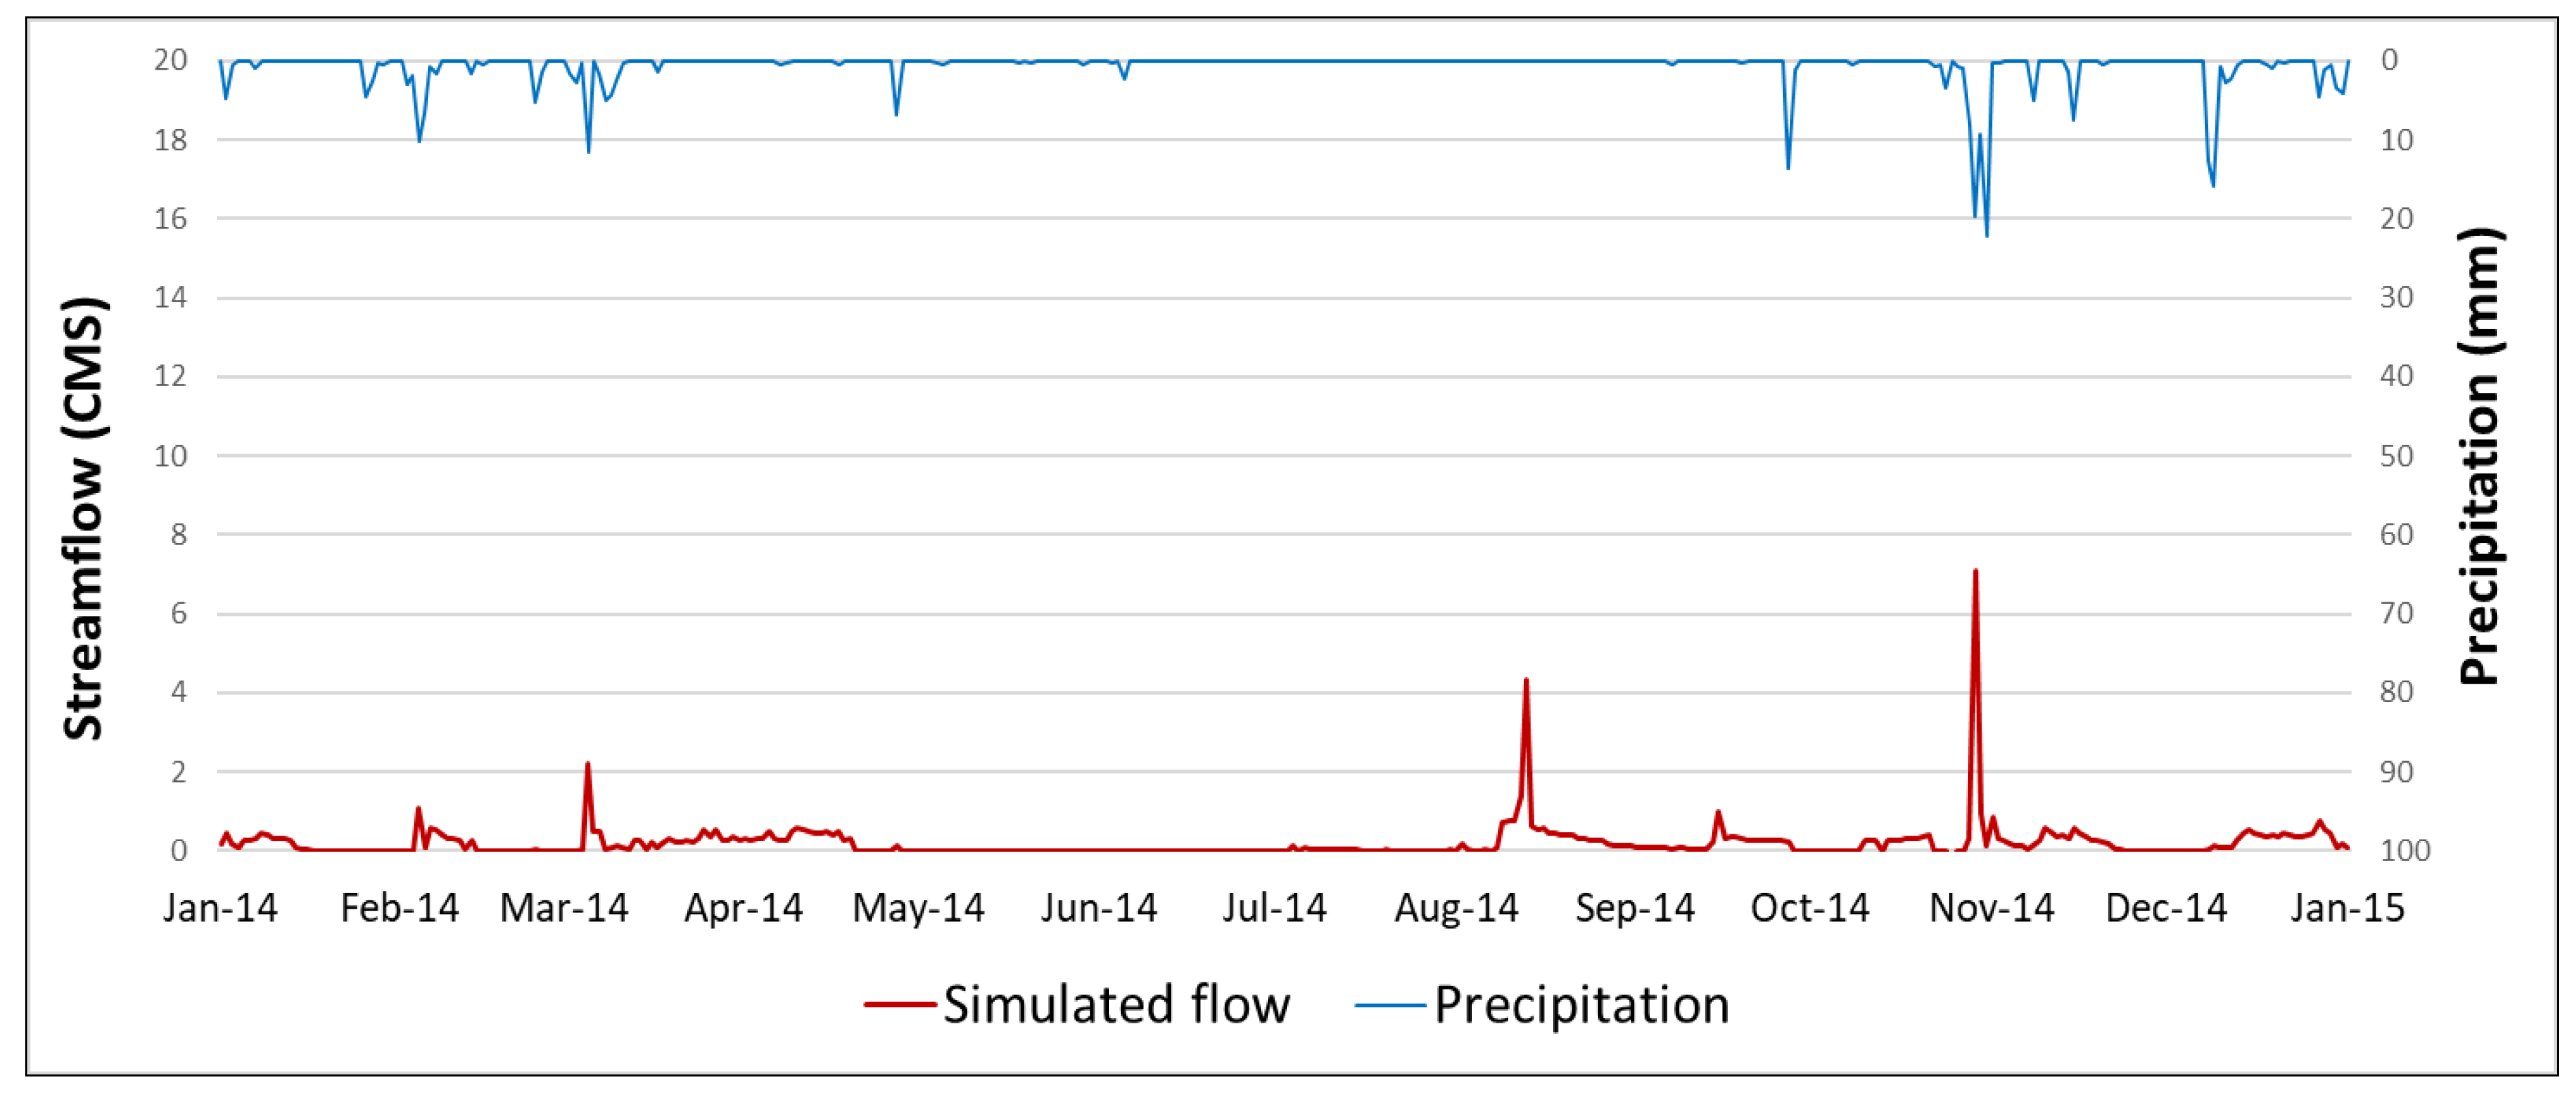
Regarding the 2014 simulation period (i.e., the period for which TIMEX images have been available), the projected flows were in accordance with the precipitation patterns (Figure 5). There are four main precipitation events (higher than 10 mm in February, March, November and December) which have been simulated by the model satisfactorily. It should be noted that a peak in the simulated flow is evident in August during which precipitation was absent. This could be explained from snow melting occurring at higher elevations of Psiloritis mountain (peaks at 2456 m), which is also supported by the relevant literature [82,86], which were not included in the setup of the model due to data scarcity. In addition, it should be noted that SWAT projected low flow values during noticeable precipitation events (during May, June and October), which can be explained by the use of one hydrological station data.

3.2. RGB Analysis of the TIMEX Imagery

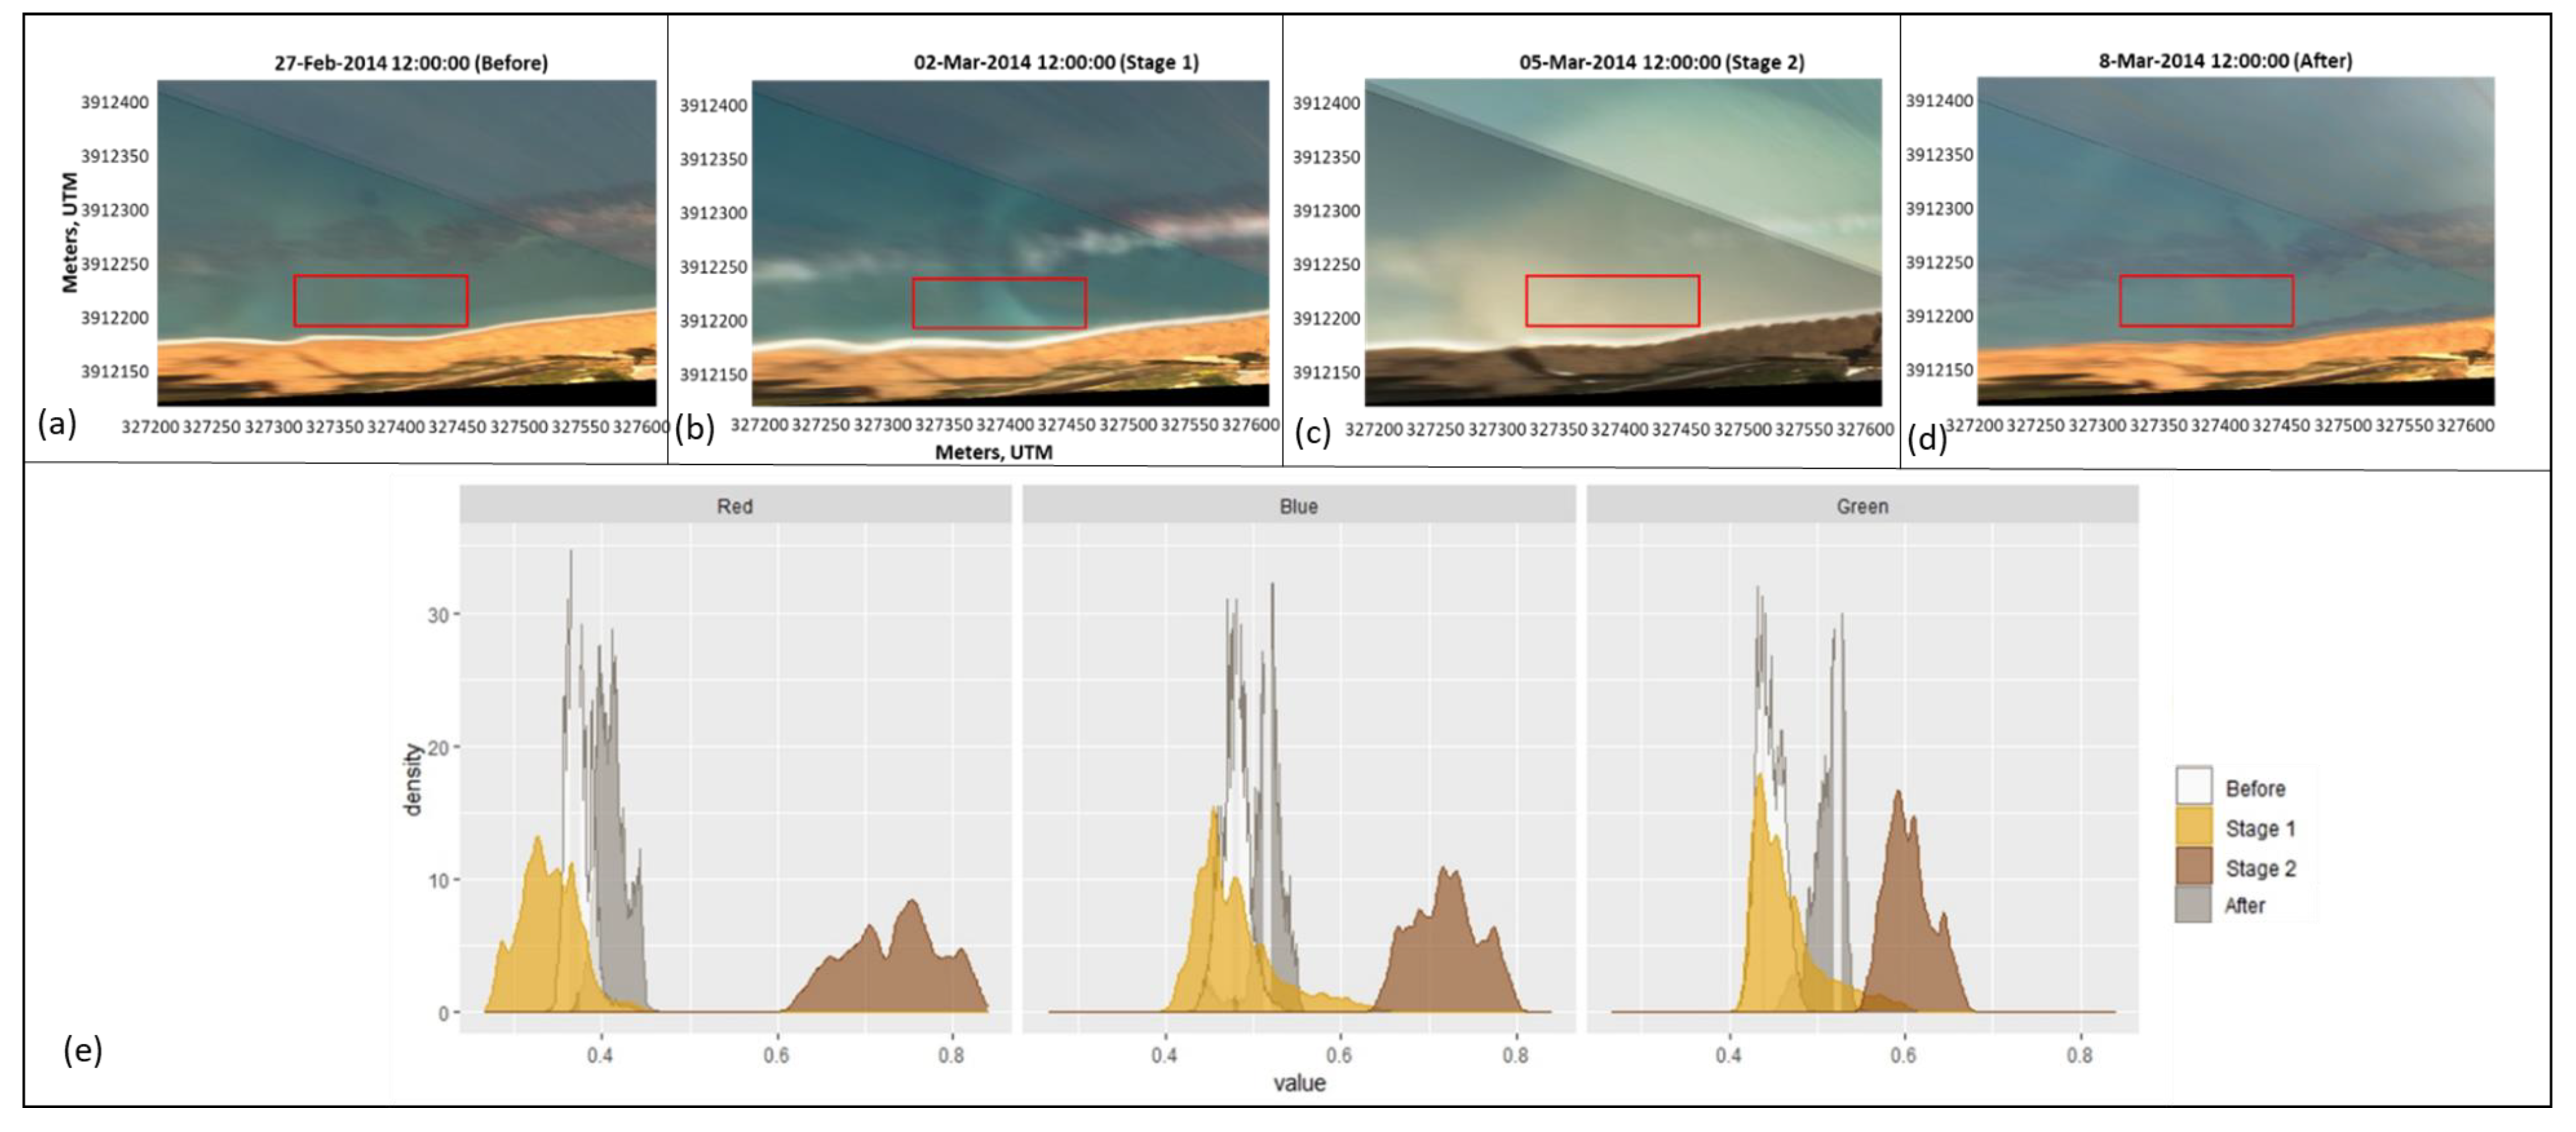
The RGB histograms during the high discharges and plume events are shown for four selected events. The first event was associated with two successive plumes occurring on 2 March 2014 and 5 March 2014). In these dates, the observed rainfall was 1.6 mm and 11.6 mm and the simulated flow velocities were 1.15 cms and 2.19 cms respectively (Figure 6). The histograms of these successive events show that the density of the pixels before and after the events is higher than the “during stage” in all RGB channels, indicating that most pixels in the rectangle display similar values with lower intensity (0.25 to 0.45 in red channel and 0.45 to 0.55 in both green and blue channels), probably due to the absence of significant amount of sediment at the nearshore. However, during the 5 March 2014 plume, pixel intensity values are higher (ranging between 0.65 and 0.8 in the red and blue channels, and 0.55 to 0.65 in the green channel), which may indicate a higher turbidity in the sediment plume, also visible in the TIMEX images (Figure 6c).
The second selected event occurred during 25 March 2014. During this day, the recorded precipitation had a value of 0.3 mm, whereas the (simulated) flow was found to be about 0.5 cms (Figure 5). Although this event was not as intense as the event in the beginning of March, a similar trend of higher densities in the “before” and “after” stages was found compared to those during the event (the “during” stage) (Figure 7). It is noted that, in this case, the histogram expressing the state before the event (the “before” stage) showed generally higher values in all three-color channels, compared to the event in early March. This might be explained by the residual sediment suspension in the coastal waters after the event. It is also noticeable, that the “during” stage shows a wider spreading in the brightness values.
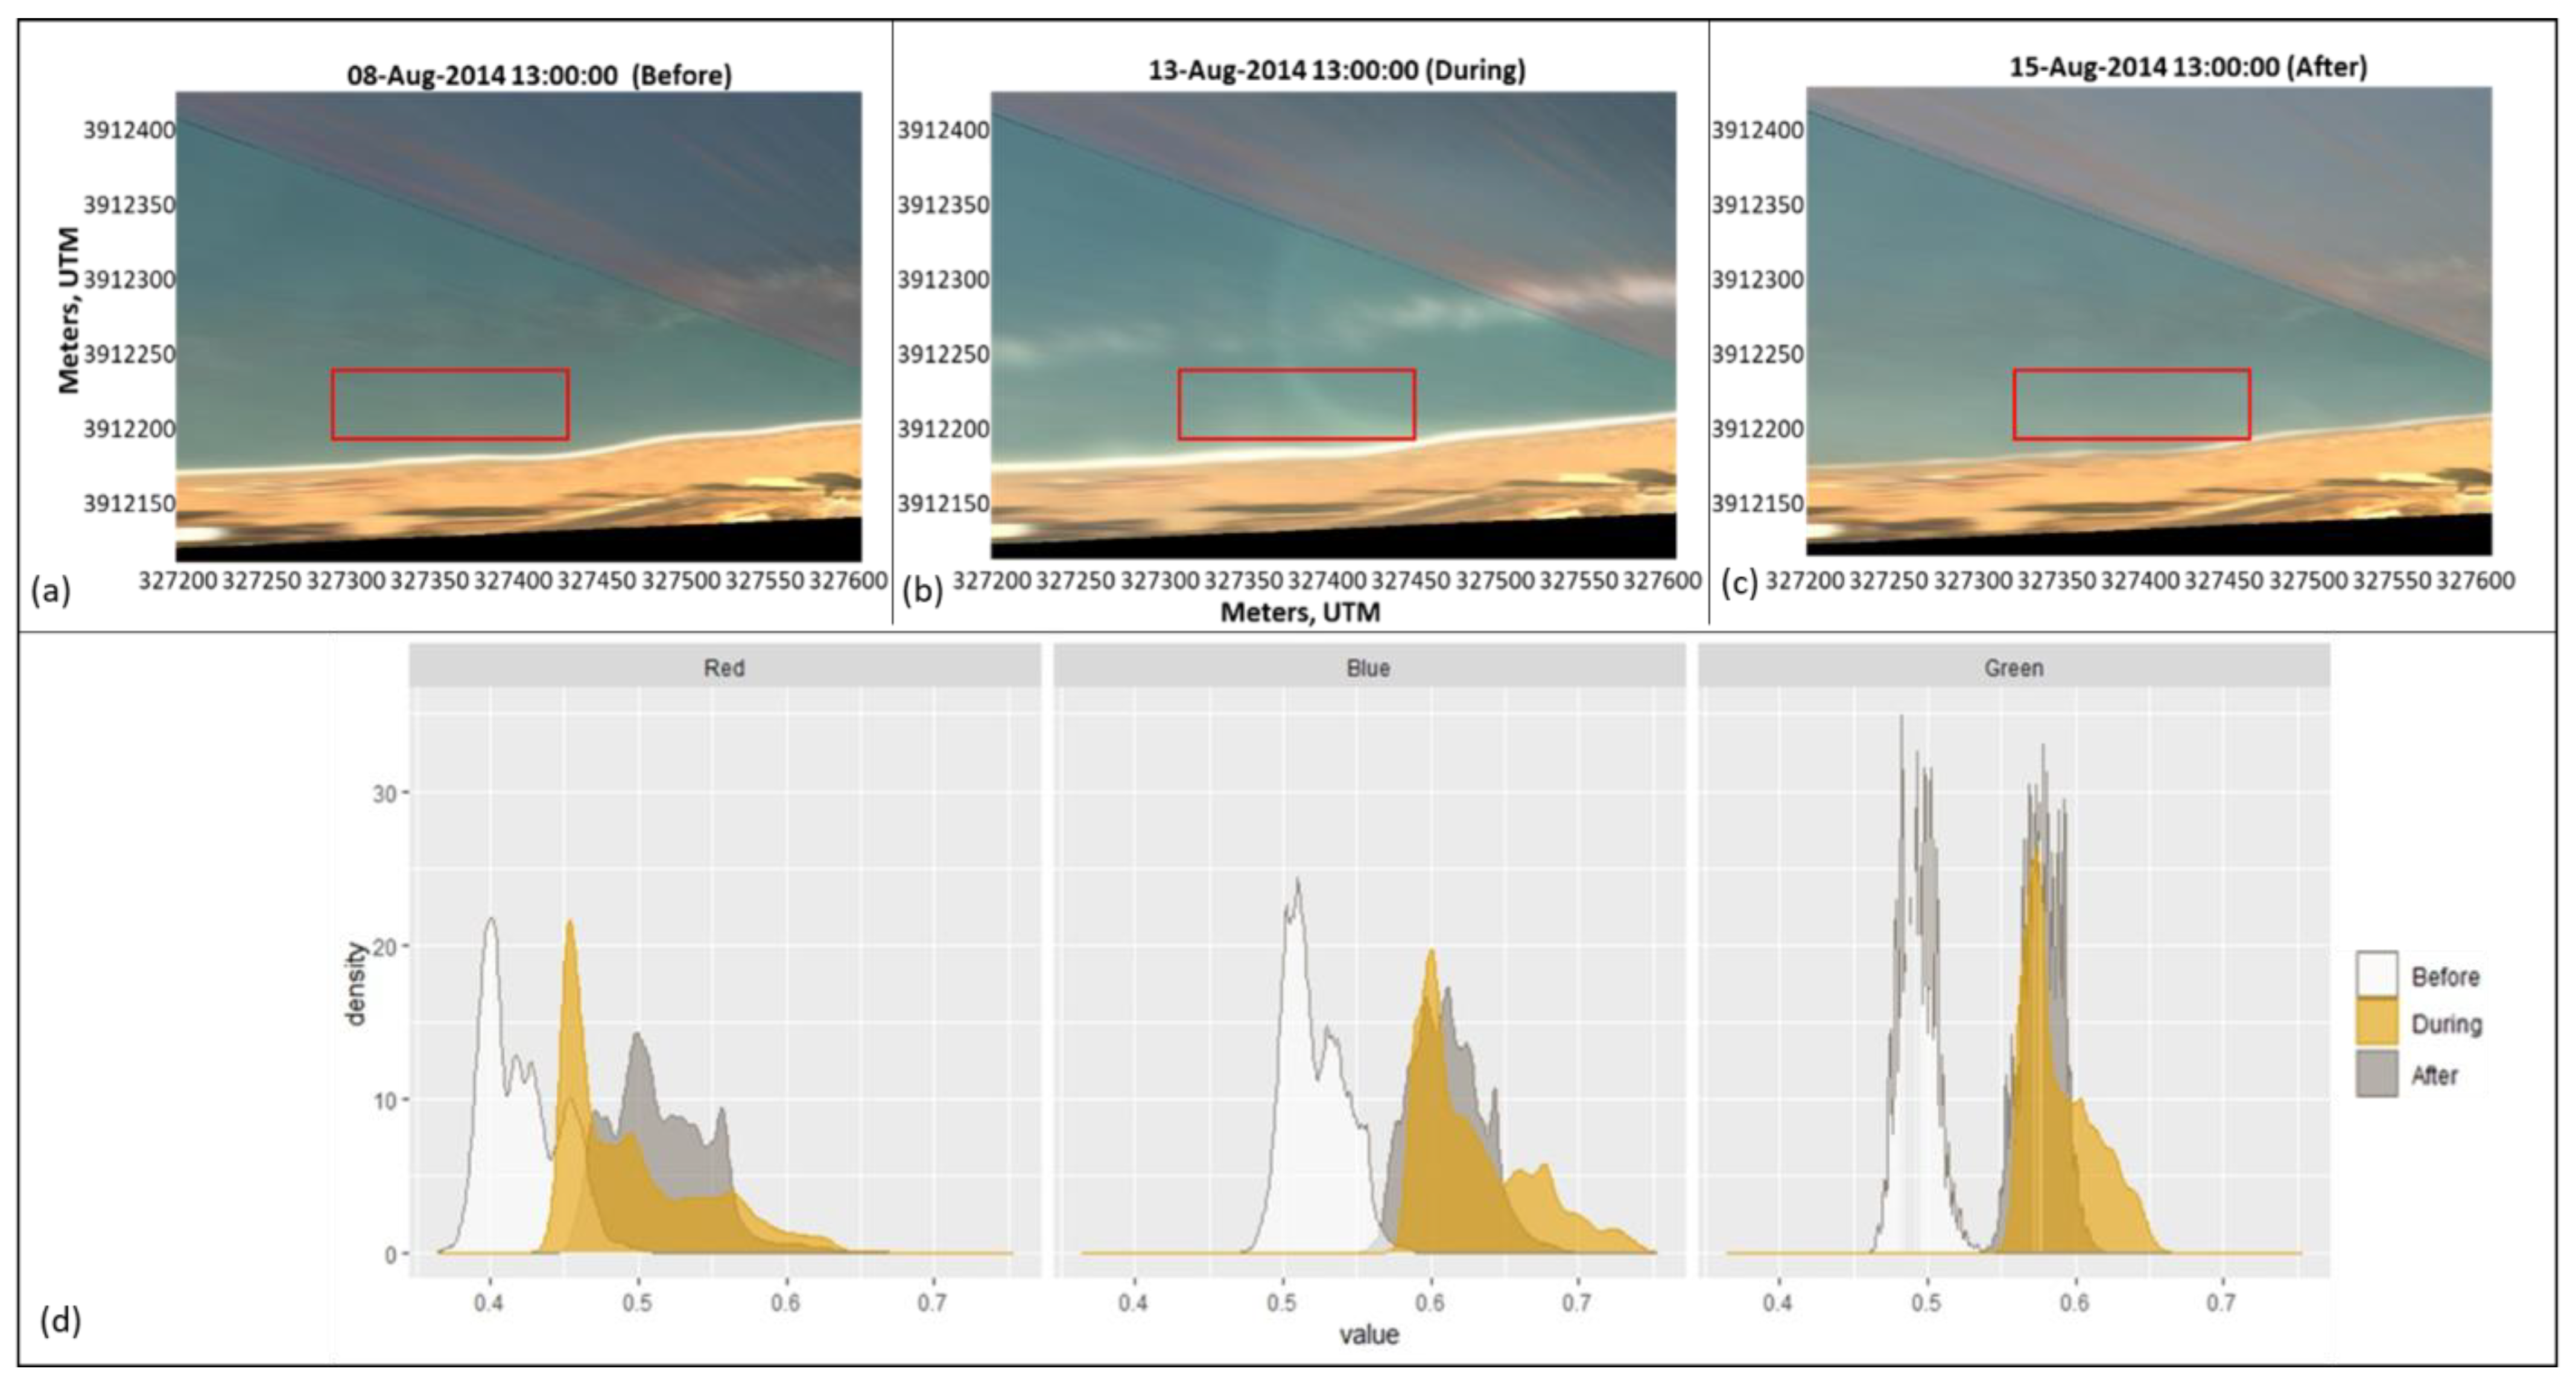
The third selected event occurred on 13 August 2014. In this event, there was no precipitation, whereas the simulated flow had a value of 4.3 cms. Interestingly although no precipitation was recorded during this event, the hydrograph indicates a high flow peak, which may be attributed to increased mountain snowmelt due to increased summer temperatures. This high flow is also evident in the TIMEX imagery of this period: while the RGB histograms representing the “before”, “during” and “after” stages display similar densities (Figure 8). Nevertheless, it should be noted that the histogram expressing the “before” stage is found to have lower values compared to the histograms expressing the “during” and “after” stages. In addition, the histogram expressing the “during” stage of the event shows a wider spreading in the brightness values, similar to the late March event.
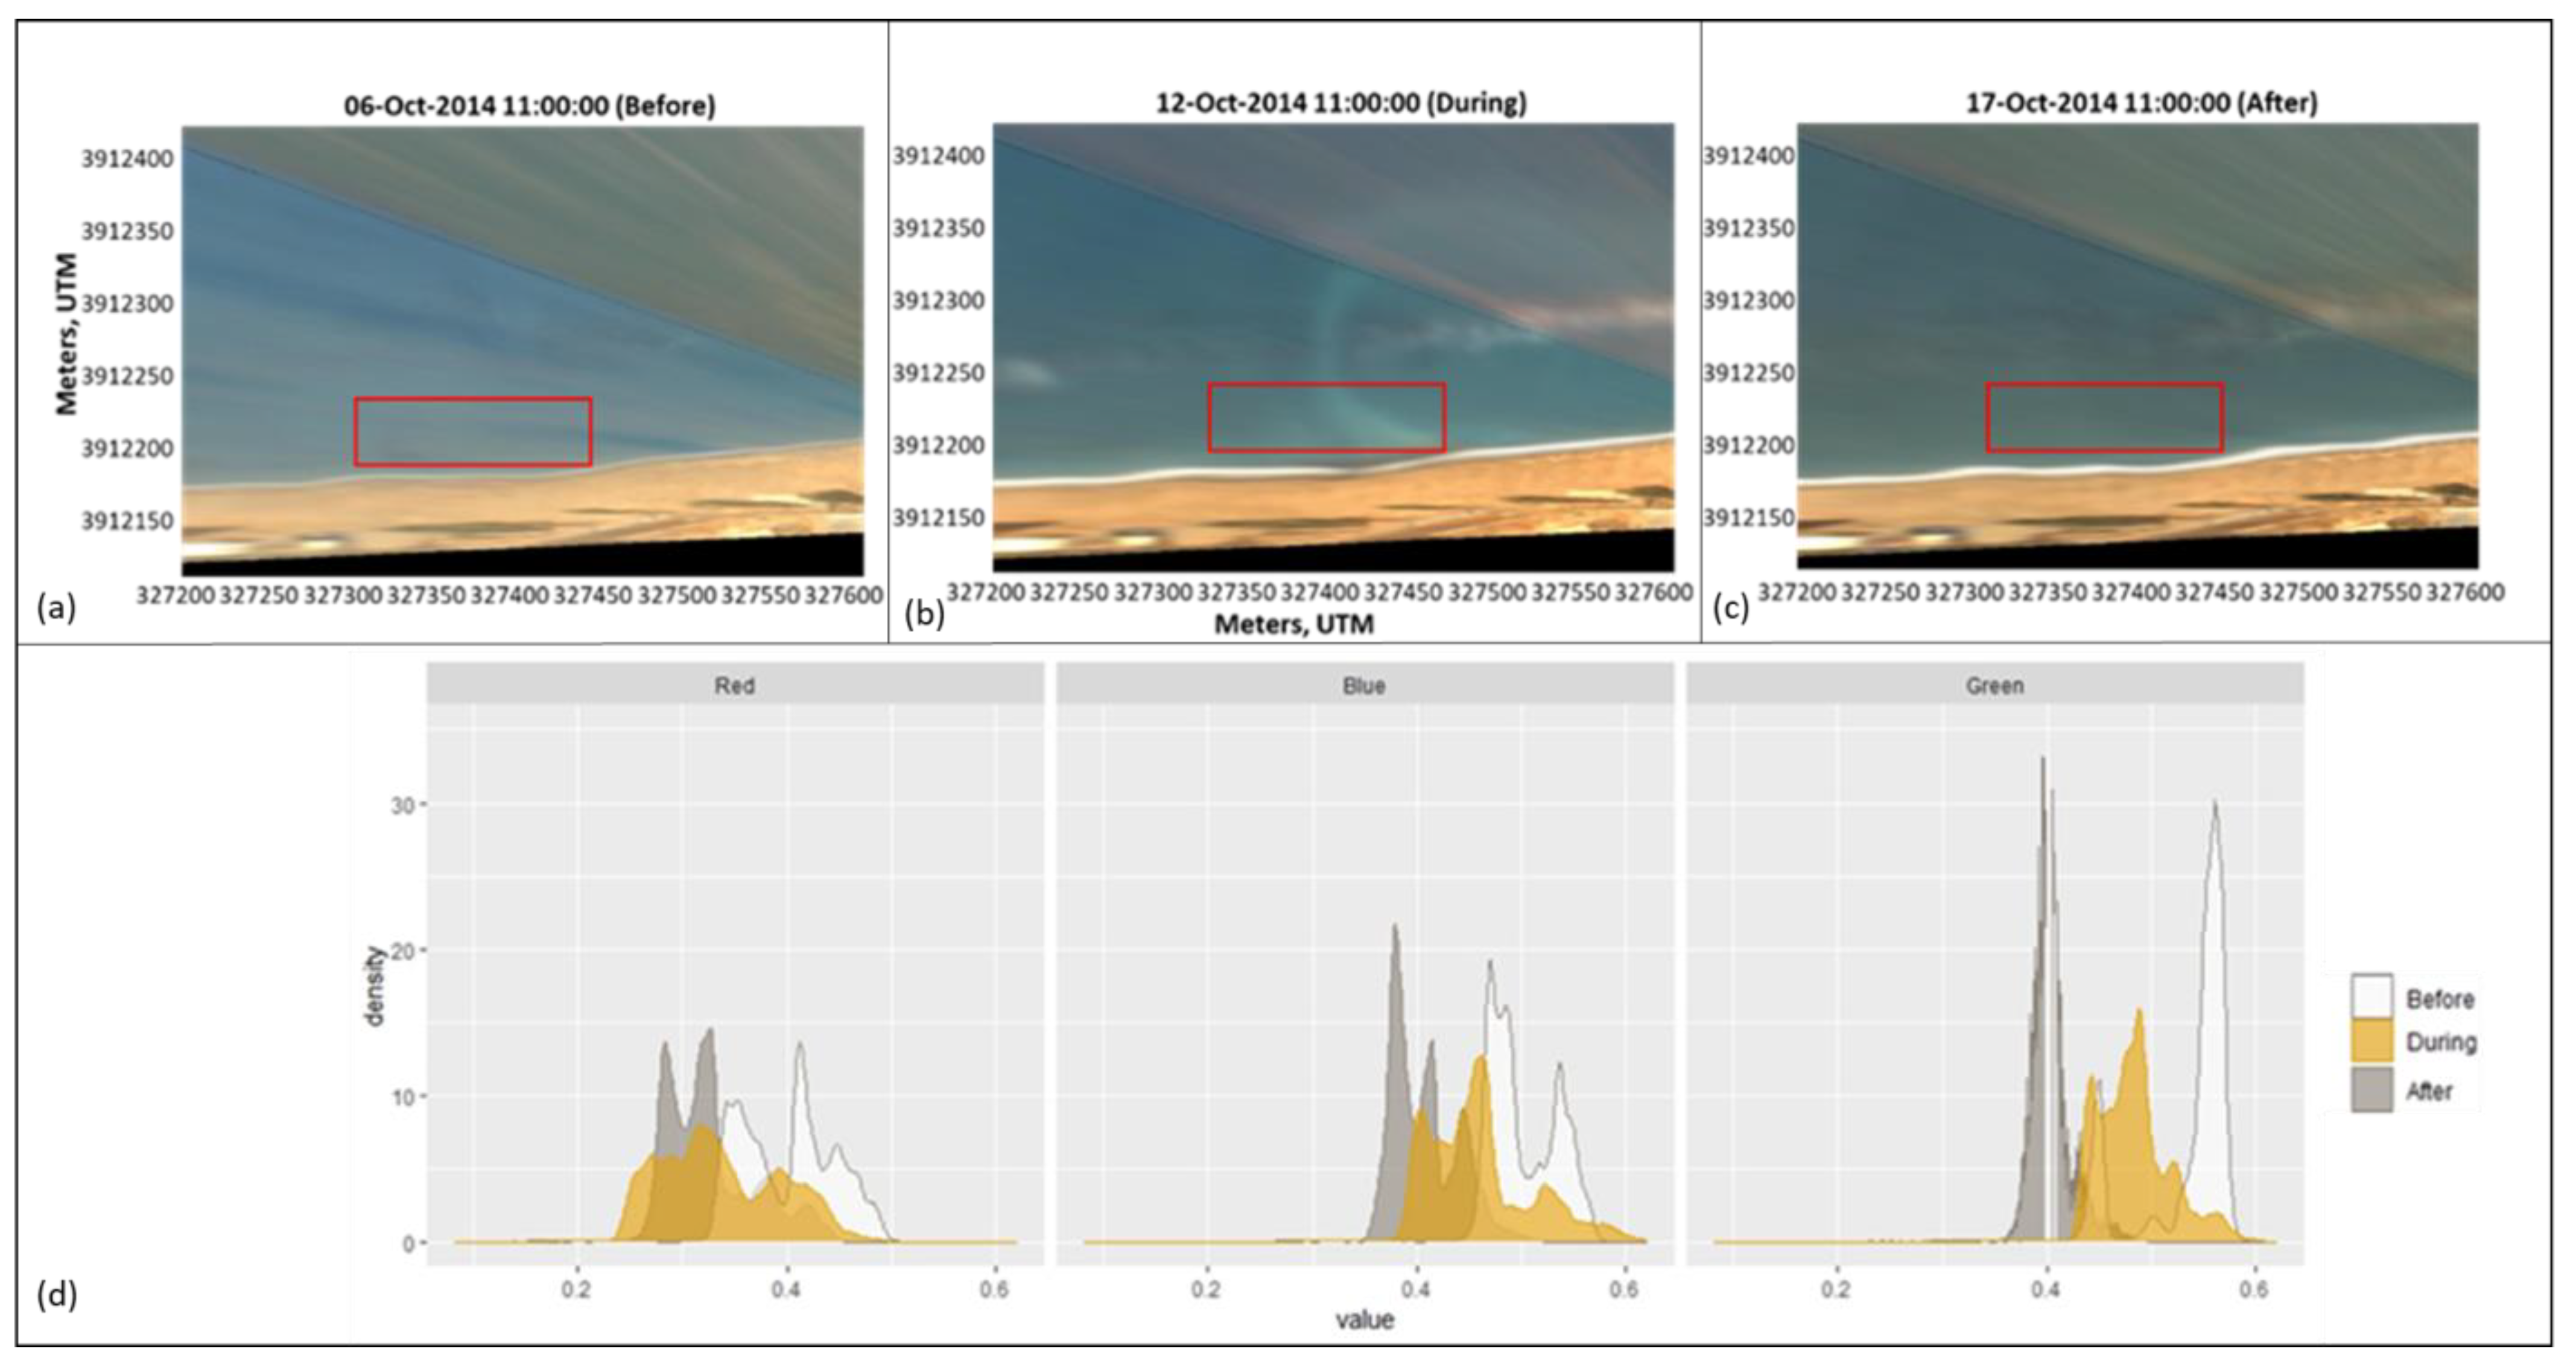
The fourth selected event occurred on 12 October 2014. The recorded precipitation was low (0.1 mm) and the simulated flow was about 0.2 cms. The RGB histograms for this event had similar patterns to those of the spring events, with higher pixel density in the “before” and “after” stages compared to the “during” stage, as well as wider spreading in the pixel brightness during the event (Figure 9).
According to hydrograph of the year 2014, highest flows occurred in the autumn and winter, with the highest peak evident on 1 November 2014 (Figure 5). However, this event could not be isolated for RGB analysis of the TIMEX image, due to the malfunction of the optical system. Nevertheless, during the days with available TIMEX imagery, plumes were found to be more profound during the spring period, as also shown in the investigated events of early and late March (Figure 6 and Figure 7). The results of this work are in agreement to the findings of a previous study carried out in shallow waters, where the histogram of Red channel was found to have values of 0.2–0.6, while the Green and Blue channels values in the range 0.3 to 0.5 [83], these values tend to reduce during the manifestation of plumes, which could be due to absorption of light by suspended sediments especially in the Blue channel [84].

4. Discussion

Hydrological modelling of Giofyros watershed in the present work proved to be a challenging task, mainly due to the absence of data for the upstream part of the basin (where the intermittent flow of the stream is more profound), and the lack of data on the groundwater table fluctuation which presented difficulties in the calibration of the watershed. In fact, different combinations of the hydrological parameters may result in acceptable statistical results while presenting very poor or even unrealistic hydrographs having no or little agreement with the observations, frequently missing the peak runoffs that are crucial for the remainder of the study. This is an effect of the equifinality principle addressed in [85,88]. Generally, the SWAT model was able to project satisfactorily the hydrology of Giofyros stream, which was validated by the observed flow. Additionally, the model reproduced specific riverine flow events during the dry summer period, for which there was an absence of precipitation records. The latter could be attributed to snow melting events occurring in higher latitudes, which has also been suggested in [84] or smaller scale storms not well captured by the rain gauging stations. However, the SWAT was unable to effectively project single, intense rainfall events occurring during the wet, winter period, showing overestimations of the runoff. These discrepancies might be attributed to the use of daily precipitation records which do not include information on rainfall intensity. In Mediterranean regions such as Greece, most rainfall phenomena are typically short in duration (limited from minutes to a few hours) and very intense, potentially causing flash floods, unlike those occurring in other European regions where rainfall is more uniform [89,90]. Therefore, the model may exhibit worse performance in summer flash floods after long dry periods due to limitations in the SCS curve number method to simulate such events on a daily step.
The simulated flows proved to be useful in detecting dynamic coastal sediment plumes at the eastern sector of Ammoudara beach, where both the Giofyros and Xiropotamos river outflow. The flow peaks of the modelled Giofyros hydrograph indicated the presence of plumes, which were also recorded by the coastal optical (TIMEX) imagery, even in days of no precipitation (e.g., the August event–Figure 8). The analysis of the images before, during, and after the flood events allowed the temporal validation of the river plumes. These plumes are usually visible as a stream of suspended sediments in the coast [91] and their occurrence may range from a few days to several months, depending on the river size [92,93]. The Xiropotamos coastal plumes can be classified as small considering their duration, for instance, in the event of the late of March the river plume was evident for two days, as was the case for the August event. In early March, the larger plume event detected might have been due to a flash flood, since the watershed of the rivers outflowing at the eastern Ammoudara beach (i.e., the Giofyros and Xiropotamos watersheds) are prone to high flooding when the late winter and spring rainfall is combined with melting snow at the uplands [86].
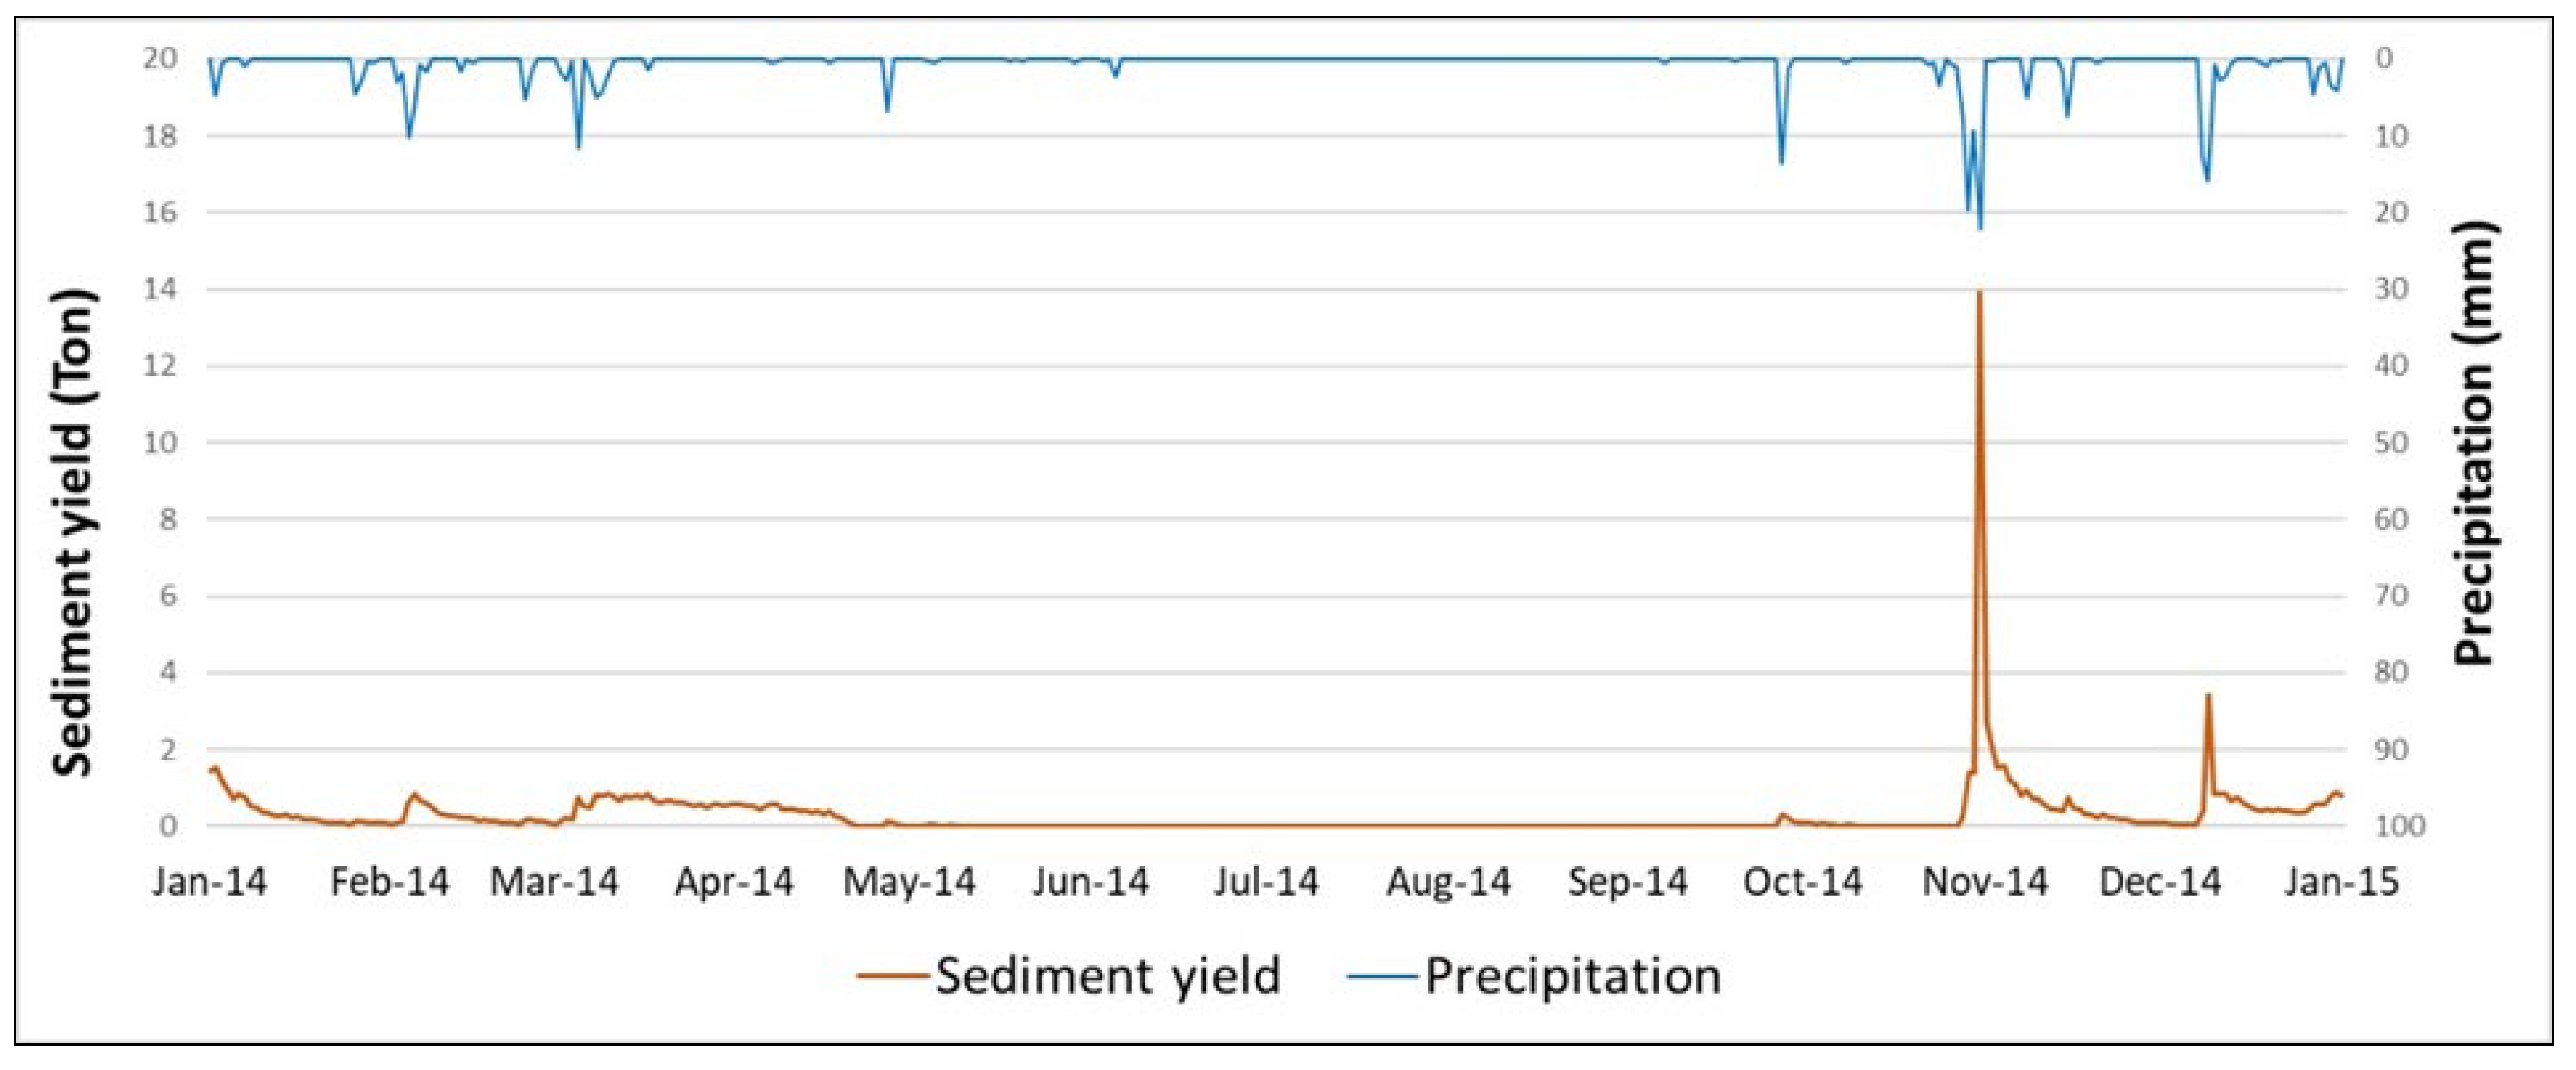
In addition to the flow simulations, SWAT has been also widely used to predict sediment yields to the sea. An initial sediment yield graph was obtained from the calibrated SWAT to show the potential of using observed sediment data to correlate the relationship between the quantity of sediment yield and size of the plumes in the optical images. As shown in Figure 10, during the period of the highest precipitation height and flow level (21 mm and 6 cms in 12 November 2014), a significant amount of sediment yield (of about 14 tonnes) was predicted by the model to be transported to the sea in the day of the event. Under lower precipitation and flow levels (16 mm and <1 cms respectively) the simulated sediment yield was significantly reduced (at about 3.8 tonnes). Interestingly, small amounts of sediment were predicted for the October event (of about 0.5 tonnes), even if significant precipitation heights were measured (at about 12 mm). It also should be noted that during the August plume event, when relatively high flows (of about 4 cms) were simulated, there were no corresponding (simulated) sediment mobilizations. This might be attributed to the lack of available sedimentological data.
The RGB analysis applied in the TIMEX images/mosaics proved to be an effective tool for river plumes detection. This technique could considerably be improved by obtaining information on sediment concentrations; in this case, SWAT projections could be effectively validated and provide quantitative estimations of the suspended sediment outflow. However, there are some limitations, mainly related to potential system downtime and/or during the occurrence of short plume events during the night when images cannot be obtained. The meteorological conditions may also affect image clarity during extreme events.

5. Conclusions

The study showed that the SWAT model was able to project flow events in an intermittent flow watershed that resulted in the development of significant coastal plumes. The RGB analysis of the coastal optical video (TIMEX) imagery was shown to be a useful technique to identify and classify coastal plumes by using the spatio-temporal variability of pixel properties; during plume events, the pixel color intensity at the discharging coastal area appears lower, whereas the pixel brightness has a wider spread compared to the situation before and after the events. The technique was also shown to be useful for the (qualitative) validation of the SWAT output and could be further improved by the collection of ‘ground truth’ data. High turbidity events isolated from the TIMEX imagery showed good agreement with the flow events simulated by the SWAT.
In intermittent river settings, such as those of Giofyros and Xiropotamos watersheds, coastal river plume events are generally difficult to be captured by remote sensing techniques which are limited by the availability of suitable data due to the remote sensing platform schedules and the meteorological conditions present during intense precipitation events. Coastal video optical data, although they could be also constrained by the meteorological conditions, appear to be more efficient, particularly if they can be combined with ground truth data and hydrological modelling.

Author Contributions

Conceptualization, N.J. and O.T.; methodology, N.J., S.N. and O.T.; software calibration/validation, N.J.; data curation, A.C., A.V. and T.H.; supervision, A.C., A.V., O.T., L.B. and J.E.S.E.M.; writing—review and editing, all authors. All authors have read and agreed to the published version of the manuscript.

Funding

The authors N.J. and O.T. acknowledge the ERASMUS + grant from the University of Aegean (Greece), which supported this work during the mobility period. The authors T.H., A.V., O.T. and A.C. acknowledge the Coastal Environment Observatory and Crisis Management in Island Areas (AEGIS +) grant (funded by the Operational Program National Strategic Reference Framework (NSRF) North Aegean 2014–2020).

Data Availability Statement

Not applicable.

Acknowledgments

The authors N.J. and S.N. would like to thank Marinos Kritsotakis from the Directorate of Water of the Decentralized Administration of Crete and the National Meteorological Service for their provision of data to complete this study, Ioannis Kontogeorgos for their invaluable remarks and help, and Shruti Upadhyaya for her guidance in image analysis process.

Conflicts of Interest

The authors declare no conflict of interest.

References

  1. Datry, T.; Larned, S.T.; Tockner, K. Intermittent Rivers: A Challenge for Freshwater Ecology. Bioscience 2014, 64, 229–235. [Google Scholar] [CrossRef] [Green Version]
  2. Magand, C.; Alves, M.H.; Calleja, E.; Datry, T.; Dörflinger, G.; England, J.; Gallart, F.; Gómez, R.; Jorda-Capdevila, D.; Martí, E. Intermittent Rivers and Ephemeral Streams: What Water Managers Need to Know; European Cooperation in Science and Technology: Brussels, Belgium, 2020. [Google Scholar]
  3. Coch, A.; Mediero, L. Trends in Low Flows in Spain in the Period 1949–2009 Trends in Low Flows in Spain in the Period 1949–2009. Hydrol. Sci. J. 2016, 61, 568–584. [Google Scholar] [CrossRef] [Green Version]
  4. De Girolamo, A.M.; Bouraoui, F.; Buffagni, A.; Pappagallo, G.; Lo Porto, A. Hydrology under Climate Change in a Temporary River System: Potential Impact on Water Balance and Flow Regime. River Res. Appl. 2017, 33, 1219–1232. [Google Scholar] [CrossRef]
  5. Marx, A.; Kumar, R.; Thober, S.; Rakovec, O.; Wanders, N.; Zink, M.; Wood, E.F.; Pan, M.; Sheffield, J.; Samaniego, L. Climate Change Alters Low Flows in Europe under Global Warming of 1.5, 2, and 3 C. Hydrol. Earth Syst. Sci. 2018, 22, 1017–1032. [Google Scholar] [CrossRef] [Green Version]
  6. Shumilova, O.; Von Schiller, D.; Zak, D.; Corti, R.; Arnon, S.; Obrador, B.; Allan, D.C.; Altermatt, F.; Banas, D.; Banegas, A.; et al. Simulating Rewetting Events in Intermittent Rivers and Ephemeral Streams: A Global Analysis of Leached Nutrients and Organic Matter. Glob. Chang. Biol. 2019, 25, 1591–1611. [Google Scholar] [CrossRef] [Green Version]
  7. Margat, J.; Treyer, S. L’eau Des Méditerranéens; Editions L’Harmattan: Paris, France, 2004; Volume 158, ISBN 2296600255. [Google Scholar]
  8. Bonada, N.; Resh, V.H. Mediterranean-Climate Streams and Rivers: Geographically Separated but Ecologically Comparable Freshwater Systems. Hydrobiologia 2013, 719, 1–29. [Google Scholar] [CrossRef] [Green Version]
  9. Stahl, K.; Hisdal, H.; Hannaford, J.; Tallaksen, L.M.; Van Lanen, H.A.J.; Sauquet, E.; Demuth, S.; Fendekova, M.; Jódar, J. Streamflow Trends in Europe: Evidence from a Dataset of near-Natural Catchments. Hydrol. Earth Syst. Sci. 2010, 14, 2367–2382. [Google Scholar] [CrossRef] [Green Version]
  10. Tzoraki, O.; De Girolamo, A.-M.; Gamvroudis, C.; Skoulikidis, N. Assessing the Flow Alteration of Temporary Streams under Current Conditions and Changing Climate by Soil and Water Assessment Tool Model. Int. J. River Basin Manag. 2016, 14, 9–18. [Google Scholar] [CrossRef]
  11. Bormann, H.; Pinter, N. Trends in Low Flows of German Rivers since 1950: Comparability of Different Low-flow Indicators and Their Spatial Patterns. River Res. Appl. 2017, 33, 1191–1204. [Google Scholar] [CrossRef]
  12. Rutkowska, A.; Kohnová, S.; Banasik, K.; Szolgay, J. Flow Characteristics of Intermittent Rivers in Slovakia. Ann. Wars. Univ. Life Sci. SGGW Land Reclam. 2018, 50, 215–227. [Google Scholar] [CrossRef]
  13. Tramblay, Y.; Rutkowska, A.; Sauquet, E.; Sefton, C.; Laaha, G.; Osuch, M.; Albuquerque, T.; Alves, M.H.; Banasik, K.; Beaufort, A. Trends in Flow Intermittence for European Rivers. Hydrol. Sci. J. 2021, 66, 37–49. [Google Scholar] [CrossRef]
  14. De Girolamo, A.M.; Barca, E.; Leone, M.; Porto, A. Lo Impact of Long-Term Climate Change on Flow Regime in a Mediterranean Basin. J. Hydrol. Reg. Stud. 2022, 41, 101061. [Google Scholar] [CrossRef]
  15. WFD Directive. 2000/60/EC of the European Parliament and of the Council of 23 October 2000 Establishing a Framework for Community Action in the Field of Water Policy; European Environment Agency: Brussels, Belgium, 2000; Volume 327, Available online: https://eur-lex.europa.eu/legal-content/EN/TXT/PDF/?uri=OJ:L:2000:327:FULL&from=EN (accessed on 14 January 2023).
  16. European Commission. The Water Framework Directive and the Floods Directive: Action towards the “Good Status” of EU Water and to Reduce Flood Risks; European Commission: Brussels, Belgium, 2015; p. 120. [Google Scholar]
  17. Borg Galea, A.; Sadler, J.P.; Hannah, D.M.; Datry, T.; Dugdale, S.J. Mediterranean Intermittent Rivers and Ephemeral Streams: Challenges in Monitoring Complexity. Ecohydrology 2019, 12, e2149. [Google Scholar] [CrossRef]
  18. Datry, T.; Corti, R.; Heino, J.; Hugueny, B.; Rolls, R.J.; Ruhí, A. Chapter 4.9—Habitat Fragmentation and Metapopulation, Metacommunity, and Metaecosystem Dynamics in Intermittent Rivers and Ephemeral Streams. In Intermittent Rivers and Ephemeral Streams; Datry, T., Bonada, N., Boulton, A., Eds.; Academic Press: Cambridge, MA, USA, 2017; pp. 377–403. ISBN 978-0-12-803835-2. [Google Scholar]
  19. Devlin, M.; Waterhouse, J.; Taylor, J.; Brodie, J. Flood Plumes in the Great Barrier Reef: Spatial and Temporal Patterns in Composition and Distribution; Series Research Publication Series No. 68; A Report to Great Barrier Reef Marine Park Authority; TropWater, James Cook University: Townsville, QLD, Australia, 2001. [Google Scholar]
  20. Gaston, T.F.; Schlacher, T.A.; Connolly, R.M. Flood Discharges of a Small River into Open Coastal Waters: Plume Traits and Material Fate. Estuar. Coast. Shelf Sci. 2006, 69, 4–9. [Google Scholar] [CrossRef]
  21. Costigan, K.H.; Kennard, M.J.; Leigh, C.; Sauquet, E.; Datry, T.; Boulton, A.J. Flow Regimes in Intermittent Rivers and Ephemeral Streams. In Intermittent Rivers and Ephemeral Streams; Elsevier: Amsterdam, The Netherlands, 2017; pp. 51–78. [Google Scholar]
  22. Velegrakis, A.F.; Vousdoukas, M.I.; Andreadis, O.; Adamakis, G.; Pasakalidou, E.; Meligonitis, R.; Kokolatos, G. Influence of Dams on Downstream Beaches: Eressos, Lesbos, Eastern Mediterranean. Mar. Georesour. Geotechnol. 2008, 26, 350–371. [Google Scholar] [CrossRef]
  23. Ren, J.; Wu, J. Sediment Trapping by Haloclines of a River Plume in the Pearl River Estuary. Cont. Shelf Res. 2014, 82, 1–8. [Google Scholar] [CrossRef]
  24. Restrepo, J.C.; Schrottke, K.; Traini, C.; Bartholomae, A.; Ospino, S.; Ortíz, J.C.; Otero, L.; Orejarena, A. Estuarine and Sediment Dynamics in a Microtidal Tropical Estuary of High Fluvial Discharge: Magdalena River (Colombia, South America). Mar. Geol. 2018, 398, 86–98. [Google Scholar] [CrossRef]
  25. Gelfenbaum, G.; Pennock, J.; Stumpf, R.P. Wind and Tidal Forcing of a Buoyant Plume, Mobile Bay, Alabama. Cont. Shelf Res. 1993, 13, 1281–1301. [Google Scholar]
  26. Xia, M.; Xie, L.; Pietrafesa, L.J. Modeling of the Cape Fear River Estuary Plume. Estuaries Coasts 2007, 30, 698–709. [Google Scholar] [CrossRef]
  27. Horner-Devine, A.R.; Hetland, R.D.; MacDonald, D.G. Mixing and Transport in Coastal River Plumes. Annu. Rev. Fluid Mech. 2015, 47, 569–594. [Google Scholar] [CrossRef]
  28. Frey, D.; Osadchiev, A. Large River Plumes Detection by Satellite Altimetry: Case Study of the Ob–Yenisei Plume. Remote Sens. 2021, 13, 5014. [Google Scholar] [CrossRef]
  29. Ritchie, J.C.; Zimba, P.V.; Everitt, J.H. Remote Sensing Techniques to Assess Water Quality. Photogramm. Eng. Remote Sens. 2003, 69, 695–704. [Google Scholar] [CrossRef] [Green Version]
  30. Warrick, J.A.; Mertes, L.A.K.; Washburn, L.; Siegel, D.A. Dispersal Forcing of Southern California River Plumes, Based on Field and Remote Sensing Observations. Geo-Mar. Lett. 2004, 24, 46–52. [Google Scholar] [CrossRef]
  31. Alvarez-Romero, J.G.; Devlin, M.; Teixeira da Silva, E.; Petus, C.; Ban, N.C.; Pressey, R.L.; Kool, J.; Roberts, J.J.; Cerdeira-Estrada, S.; Wenger, A.S.; et al. A Novel Approach to Model Exposure of Coastal-Marine Ecosystems to Riverine Flood Plumes Based on Remote Sensing Techniques. J. Environ. Manag. 2013, 119, 194–207. [Google Scholar] [CrossRef] [PubMed] [Green Version]
  32. Zeinali, S.; Dehghani, M.; Rastegar, M.A.; Mojarrad, M. Detecting Shoreline Changes in Chabahar Bay by Processing Satellite Images. Sci. Iran. 2017, 24, 1802–1809. [Google Scholar] [CrossRef] [Green Version]
  33. Guneroglu, A.; Karsli, F.; Dihkan, M. Automatic Detection of Coastal Plumes Using Landsat TM/ETM+ Images. Int. J. Remote Sens. 2013, 34, 4702–4714. [Google Scholar] [CrossRef]
  34. Gancheva, I.; Peneva, E.; Slabakova, V. Detecting the Surface Signature of Riverine and Effluent Plumes along the Bulgarian Black Sea Coast Using Satellite Data. Remote Sens. 2021, 13, 4094. [Google Scholar] [CrossRef]
  35. Haji Gholizadeh, M.; Melesse, A.M.; Reddi, L. Spaceborne and Airborne Sensors in Water Quality Assessment. Int. J. Remote Sens. 2016, 37, 3143–3180. [Google Scholar] [CrossRef]
  36. Schulz, D.; Yin, H.; Tischbein, B.; Verleysdonk, S.; Adamou, R.; Kumar, N. Land Use Mapping Using Sentinel-1 and Sentinel-2 Time Series in a Heterogeneous Landscape in Niger, Sahel. ISPRS J. Photogramm. Remote Sens. 2021, 178, 97–111. [Google Scholar] [CrossRef]
  37. Singh, D.; Kaur, M.; Jabarulla, M.Y.; Kumar, V.; Lee, H.-N. Evolving Fusion-Based Visibility Restoration Model for Hazy Remote Sensing Images Using Dynamic Differential Evolution. IEEE Trans. Geosci. Remote Sens. 2022, 60, 1002214. [Google Scholar] [CrossRef]
  38. Vousdoukas, M. ORASIS—A Coastal Video Monitoring Platform. In Proceedings of the EGU General Assembly Conference Abstracts, Vienna, Austria, 7–12 April 2013. EGU2013-3036. [Google Scholar]
  39. Huntley, D.; Saulter, A.; Kingston, K.; Holman, R. Use of Video Imagery to Test Model Predictions of Surf Heights. WIT Trans. Ecol. Environ. 2009, 126, 39–50. [Google Scholar] [CrossRef]
  40. Hattori, N.; Sato, S.; Yamanaka, Y. Development of an Imagery-Based Monitoring System for Nearshore Bathymetry by Using Wave Breaking Density. Coast. Eng. J. 2019, 61, 308–320. [Google Scholar] [CrossRef]
  41. Kim, J.; Kim, J. Estimation of Water Surface Flow Velocity in Coastal Video Imagery by Visual Tracking with Deep Learning. J. Coast. Res. 2020, 95, 522–526. [Google Scholar] [CrossRef]
  42. Velegrakis, A.F.; Trygonis, V.; Chatzipavlis, A.E.; Karambas, T.; Vousdoukas, M.I.; Ghionis, G.; Monioudi, I.N.; Hasiotis, T.; Andreadis, O.; Psarros, F. Shoreline Variability of an Urban Beach Fronted by a Beachrock Reef from Video Imagery. Nat. Hazards 2016, 83, 201–222. [Google Scholar] [CrossRef]
  43. Chatzipavlis, A.; Tsekouras, G.E.; Trygonis, V.; Velegrakis, A.F.; Tsimikas, J.; Rigos, A.; Hasiotis, T.; Salmas, C. Modeling Beach Realignment Using a Neuro-Fuzzy Network Optimized by a Novel Backtracking Search Algorithm. Neural Comput. Appl. 2019, 31, 1747–1763. [Google Scholar] [CrossRef]
  44. Santos, D.; Abreu, T.; Silva, P.A.; Santos, F.; Baptista, P. Nearshore Bathymetry Retrieval from Wave-Based Inversion for Video Imagery. Remote Sens. 2022, 14, 2155. [Google Scholar] [CrossRef]
  45. Zhan, Y.; Aarninkhof, S.G.J.; Wang, Z.; Qian, W.; Zhou, Y. Daily Topographic Change Patterns of Tidal Flats in Response to Anthropogenic Activities: Analysis through Coastal Video Imagery. J. Coast. Res. 2020, 36, 103–115. [Google Scholar] [CrossRef]
  46. Arnold, J.G.; Moriasi, D.N.; Gassman, P.W.; Abbaspour, K.C.; White, M.J.; Srinivasan, R.; Santhi, C.; Harmel, R.D.; Van Griensven, A.; Van Liew, M.W. SWAT: Model Use, Calibration, and Validation. Trans. ASABE 2012, 55, 1491–1508. [Google Scholar] [CrossRef]
  47. Upadhyay, P.; Linhoss, A.; Kelble, C.; Ashby, S.; Murphy, N.; Parajuli, P.B. Applications of the SWAT Model for Coastal Watersheds: Review and Recommendations. J. ASABE 2022, 65, 453–469. [Google Scholar] [CrossRef]
  48. Daramola, J.; Ekhwan, T.M.; Mokhtar, J.; Lam, K.C.; Adeogun, G.A. Estimating Sediment Yield at Kaduna Watershed, Nigeria Using Soil and Water Assessment Tool (SWAT) Model. Heliyon 2019, 5, e02106. [Google Scholar] [CrossRef] [Green Version]
  49. Nepal, D.; Parajuli, P.B. Assessment of Best Management Practices on Hydrology and Sediment Yield at Watershed Scale in Mississippi Using SWAT. Agriculture 2022, 12, 518. [Google Scholar] [CrossRef]
  50. De Girolamo, A.M.; Lo Porto, A.; Pappagallo, G.; Gallart, F. Assessing Flow Regime Alterations in a Temporary River—The River Celone Case Study. J. Hydrol. Hydromech. 2015, 63, 263–272. [Google Scholar] [CrossRef] [Green Version]
  51. Nabih, S.; Tzoraki, O.; Zanis, P.; Tsikerdekis, T.; Akritidis, D.; Kontogeorgos, I.; Benaabidate, L. Alteration of the Ecohydrological Status of the Intermittent Flow Rivers and Ephemeral Streams Due to the Climate Change Impact (Case Study: Tsiknias River). Hydrology 2021, 8, 43. [Google Scholar] [CrossRef]
  52. Glavan, M.; Ceglar, A.; Pintar, M. Assessing the Impacts of Climate Change on Water Quantity and Quality Modelling in Small Slovenian Mediterranean Catchment—Lesson for Policy and Decision Makers. Hydrol. Process. 2015, 29, 3124–3144. [Google Scholar] [CrossRef]
  53. Glavan, M.; Pintar, M.; Volk, M. Land Use Change in a 200-year Period and Its Effect on Blue and Green Water Flow in Two Slovenian Mediterranean Catchments—Lessons for the Future. Hydrol. Process. 2013, 27, 3964–3980. [Google Scholar] [CrossRef]
  54. Chahinian, N.; Tournoud, M.-G.; Perrin, J.-L.; Picot, B. Flow and Nutrient Transport in Intermittent Rivers: A Modelling Case-Study on the Vène River Using SWAT 2005. Hydrol. Sci. J. J. Sci. Hydrol. 2011, 56, 268–287. [Google Scholar] [CrossRef]
  55. De Girolamo, A.M.; Lo Porto, A. Land Use Scenario Development as a Tool for Watershed Management within the Rio Mannu Basin. Land Use Policy 2012, 29, 691–701. [Google Scholar] [CrossRef]
  56. Gamvroudis, C.; Nikolaidis, N.P.; Tzoraki, O.; Papadoulakis, V.; Karalemas, N. Water and Sediment Transport Modeling of a Large Temporary River Basin in Greece. Sci. Total Environ. 2015, 508, 354–365. [Google Scholar] [CrossRef]
  57. Nerantzaki, S.D.; Giannakis, G.V.; Efstathiou, D.; Nikolaidis, N.P.; Sibetheros, I.A.; Karatzas, G.P.; Zacharias, I. Modeling Suspended Sediment Transport and Assessing the Impacts of Climate Change in a Karstic Mediterranean Watershed. Sci. Total Environ. 2015, 538, 288–297. [Google Scholar] [CrossRef]
  58. Pastor, A.V.; Tzoraki, O.; Bruno, D.; Kaletová, T.; Mendoza-Lera, C.; Alamanos, A.; Brummer, M.; Datry, T.; De Girolamo, A.M.; Jakubínský, J.; et al. Rethinking Ecosystem Service Indicators for Their Application to Intermittent Rivers. Ecol. Indic. 2022, 137, 108693. [Google Scholar] [CrossRef]
  59. Alexandrakis, G.; Ghionis, G.; Poulos, S. The Effect of Beach Rock Formation on the Morphological Evolution of a Beach. The Case Study of an Eastern Mediterranean Beach: Ammoudara, Greece. J. Coast. Res. 2013, 69, 47–59. [Google Scholar] [CrossRef]
  60. Kontogianni, A.; Damigos, D.; Tourkolias, C.; Vousdoukas, M.; Velegrakis, A.; Zanou, B.; Skourtos, M. Eliciting Beach Users’ Willingness to Pay for Protecting European Beaches from Beachrock Processes. Ocean Coast. Manag. 2014, 98, 167–175. [Google Scholar] [CrossRef]
  61. Tsekouras, G.E.; Trygonis, V.; Maniatopoulos, A.; Rigos, A.; Chatzipavlis, A.; Tsimikas, J.; Mitianoudis, N.; Velegrakis, A.F. A Hermite Neural Network Incorporating Artificial Bee Colony Optimization to Model Shoreline Realignment at a Reef-Fronted Beach. Neurocomputing 2018, 280, 32–45. [Google Scholar] [CrossRef]
  62. Rentzepopoulou, M.S. Morphodynamics of Ammoudara Beach, Herakleion, Crete: Interaction with the a Natural Submerged Reef/Wave Breaker. Master’s Thesis, University of the Aegean, Department of Marine Sciences, Mytilene, Greece, 2014. [Google Scholar]
  63. Chatzipavlis, A.E.; Zamboukas, V.; Trygonis, V.; Velegrakis, A.F. Automated 2-D Shoreline and Wave Run-Up Detections from High Frequency Optical Data. Example from an Urban Perched Beach: Ammoudara, Herakleion—Crete. In Proceedings of the HydroMedit International Congress on Applied Ichtyology Oceanography and Aquatic Environment, Athens Greece, 4–6 November 2021; pp. 269–272. [Google Scholar]
  64. Ganoulis, J. The 1994 Flood of the Giofyros on the Crete Island: A Case Study of Risk-Based Floodplain Management. In Proceedings of the U.S.—Italy Research Workshop on the Hydrometeorology, Impacts, and Management of Extreme Floods, Perugia, Italy, 13–17 November 1995. [Google Scholar]
  65. Kontogeorgos, I. Modeling of the Hydrology of the Drainage Basin of Giofyros and Xiropotamos Rivers, Heraklion Crete. Ph.D. Thesis, Environmental Engineering School, Technical University of Crete, Chania, Greece, 2014. [Google Scholar]
  66. Arnold, J.G.; Srinivasan, R.; Muttiah, R.S.; Williams, J.R. Large Area Hydrologic Modeling and Assessment Part I: Model Development 1. JAWRA J. Am. Water Resour. Assoc. 1998, 34, 73–89. [Google Scholar] [CrossRef]
  67. Neitsch, S.; Arnold, J.G.; Kiniry, J.; Williams, J. Soil & Water Assessment Tool Theoretical Documentation Version 2009; Texas Water Resources Institute Technical Report No. 406; Texas A&M University System: College Station, TX, USA, 2011. [Google Scholar]
  68. Jha, M.K. Evaluating Hydrologic Response of an Agricultural Watershed for Watershed Analysis. Water 2011, 3, 604–617. [Google Scholar] [CrossRef] [Green Version]
  69. Mehan, S.; Neupane, R.P.; Kumar, S. Coupling of SUFI 2 and SWAT for Improving the Simulation of Streamflow in an Agricultural Watershed of South Dakota. Hydrol. Curr. Res. 2017, 8, 1000280. [Google Scholar] [CrossRef]
  70. Feyereisen, G.W.; Strickland, T.C.; Bosch, D.D.; Sullivan, D.G. Evaluation of SWAT Manual Calibration and Input Parameter Sensitivity in the Little River Watershed. Trans. ASABE 2007, 50, 843–855. [Google Scholar] [CrossRef]
  71. Abbaspour, K.C.; Vaghefi, S.A.; Srinivasan, R. A Guideline for Successful Calibration and Uncertainty Analysis for Soil and Water Assessment: A Review of Papers from the 2016 International SWAT Conference. Water 2017, 10, 6. [Google Scholar] [CrossRef] [Green Version]
  72. Li, M.; Di, Z.; Duan, Q. Effect of Sensitivity Analysis on Parameter Optimization: Case Study Based on Streamflow Simulations Using the SWAT Model in China. J. Hydrol. 2021, 603, 126896. [Google Scholar] [CrossRef]
  73. Abbaspour, K.C.; Yang, J.; Maximov, I.; Siber, R.; Bogner, K.; Mieleitner, J.; Zobrist, J.; Srinivasan, R. Modelling Hydrology and Water Quality in the Pre-Alpine/Alpine Thur Watershed Using SWAT. J. Hydrol. 2007, 333, 413–430. [Google Scholar] [CrossRef]
  74. Krause, P.; Boyle, D.P.; Bäse, F. Comparison of Different Efficiency Criteria for Hydrological Model Assessment. Adv. Geosci. 2005, 5, 89–97. [Google Scholar] [CrossRef]
  75. Legates, D.R.; McCabe Jr, G.J. Evaluating the Use of “Goodness-of-fit” Measures in Hydrologic and Hydroclimatic Model Validation. Water Resour. Res. 1999, 35, 233–241. [Google Scholar] [CrossRef]
  76. Grayson, R.; Blöschl, G. Spatial Modelling of Catchment Dynamics. In Spatial Patterns in Catchment Hydrology: Observations and Modelling; Cambridge University Press: Cambridge, UK, 2001; pp. 51–81. [Google Scholar]
  77. Moriasi, D.N.; Arnold, J.G.; Van Liew, M.W.; Bingner, R.L.; Harmel, R.D.; Veith, T.L. Model Evaluation Guidelines for Systematic Quantification of Accuracy in Watershed Simulations. Trans. ASABE 2007, 50, 885–900. [Google Scholar] [CrossRef]
  78. Nash, J.E.; Sutcliffe, J.V. River Flow Forecasting Through Conceptual Models Part I—A Discussion of Principles. J. Hydrol. 1970, 10, 282–290. [Google Scholar] [CrossRef]
  79. Gupta, H.V.; Sorooshian, S.; Yapo, P.O. Status of Automatic Calibration for Hydrologic Models: Comparison with Multilevel Expert Calibration. J. Hydrol. Eng. 1999, 4, 135–143. [Google Scholar] [CrossRef]
  80. Lane, S.N.; Richards, K.S.; Chandler, J.H. Discharge and Sediment Supply Controls on Erosion and Deposition in a Dynamic Alluvial Channel. Geomorphology 1996, 15, 1–15. [Google Scholar] [CrossRef]
  81. Goodwin, N.; Turner, R.; Merton, R. Classifying Eucalyptus Forests with High Spatial and Spectral Resolution Imagery: An Investigation of Individual Species and Vegetation Communities. Aust. J. Bot. 2005, 53, 337–345. [Google Scholar] [CrossRef]
  82. Malagò, A.; Efstathiou, D.; Bouraoui, F.; Nikolaidis, N.P.; Franchini, M.; Bidoglio, G.; Kritsotakis, M. Regional Scale Hydrologic Modeling of a Karst-Dominant Geomorphology: The Case Study of the Island of Crete. J. Hydrol. 2016, 540, 64–81. [Google Scholar] [CrossRef]
  83. Huang, D.; Wang, Y.; Song, W.; Sequeira, J.; Mavromatis, S. Shallow-Water Image Enhancement Using Relative Global Histogram Stretching Based on Adaptive Parameter Acquisition. In MultiMedia Modeling; Lecture Notes in Computer Science; Springer: Cham, Switzerland, 2018; Volume 10704, pp. 453–465. [Google Scholar]
  84. Vozinaki, A.-E.; Tapoglou, E.; Tsanis, I.K. Hydrometeorological Impact of Climate Change in Two Mediterranean Basins. Int. J. River Basin Manag. 2018, 16, 245–257. [Google Scholar] [CrossRef]
  85. Dierssen, H.M.; Kudela, R.M.; Ryan, J.P.; Zimmerman, R.C. Red and Black Tides: Quantitative Analysis of Water-Leaving Radiance and Perceived Color for Phytoplankton, Colored Dissolved Organic Matter, and Suspended Sediments. Limnol. Oceanogr. 2006, 51, 2646–2659. [Google Scholar] [CrossRef] [Green Version]
  86. Soulis, K.X. Soil Conservation Service Curve Number (SCS-CN) Method: Current Applications, Remaining Challenges, and Future Perspectives. Water 2021, 13, 192. [Google Scholar] [CrossRef]
  87. Beven, K. Prophecy, Reality and Uncertainty in Distributed Hydrological Modelling. Adv. Water Resour. 1993, 16, 41–51. [Google Scholar] [CrossRef]
  88. Beven, K. A Manifesto for the Equifinality Thesis. J. Hydrol. 2006, 320, 18–36. [Google Scholar] [CrossRef] [Green Version]
  89. Gaume, E.; Borga, M.; Llassat, M.C.; Maouche, S.; Lang, M.; Diakakis, M. Mediterranean Extreme Floods. In The Mediterranean Region under Climate Change. A Scientific Update; IRD Editions: Paris, France, 2016. [Google Scholar]
  90. Gaume, E.; Bain, V.; Bernardara, P.; Newinger, O.; Barbuc, M.; Bateman, A.; Blaškovičová, L.; Blöschl, G.; Borga, M.; Dumitrescu, A. A Compilation of Data on European Flash Floods. J. Hydrol. 2009, 367, 70–78. [Google Scholar] [CrossRef] [Green Version]
  91. Bainbridge, Z.; Lewis, S.; Stevens, T.; Petus, C.; Lazarus, E.; Gorman, J.; Smithers, S. Measuring Sediment Grain Size across the Catchment to Reef Continuum: Improved Methods and Environmental Insights. Mar. Pollut. Bull. 2021, 168, 112339. [Google Scholar] [CrossRef]
  92. Yankovsky, A.E.; Hickey, B.M.; Münchow, A.K. Impact of Variable Inflow on the Dynamics of a Coastal Buoyant Plume. J. Geophys. Res. Ocean. 2001, 106, 19809–19824. [Google Scholar] [CrossRef] [Green Version]
  93. Ostrander, C.E.; McManus, M.A.; DeCarlo, E.H.; Mackenzie, F.T. Temporal and Spatial Variability of Freshwater Plumes in a Semienclosed Estuarine-Bay System. Estuaries Coasts 2008, 31, 192–203. [Google Scholar] [CrossRef]
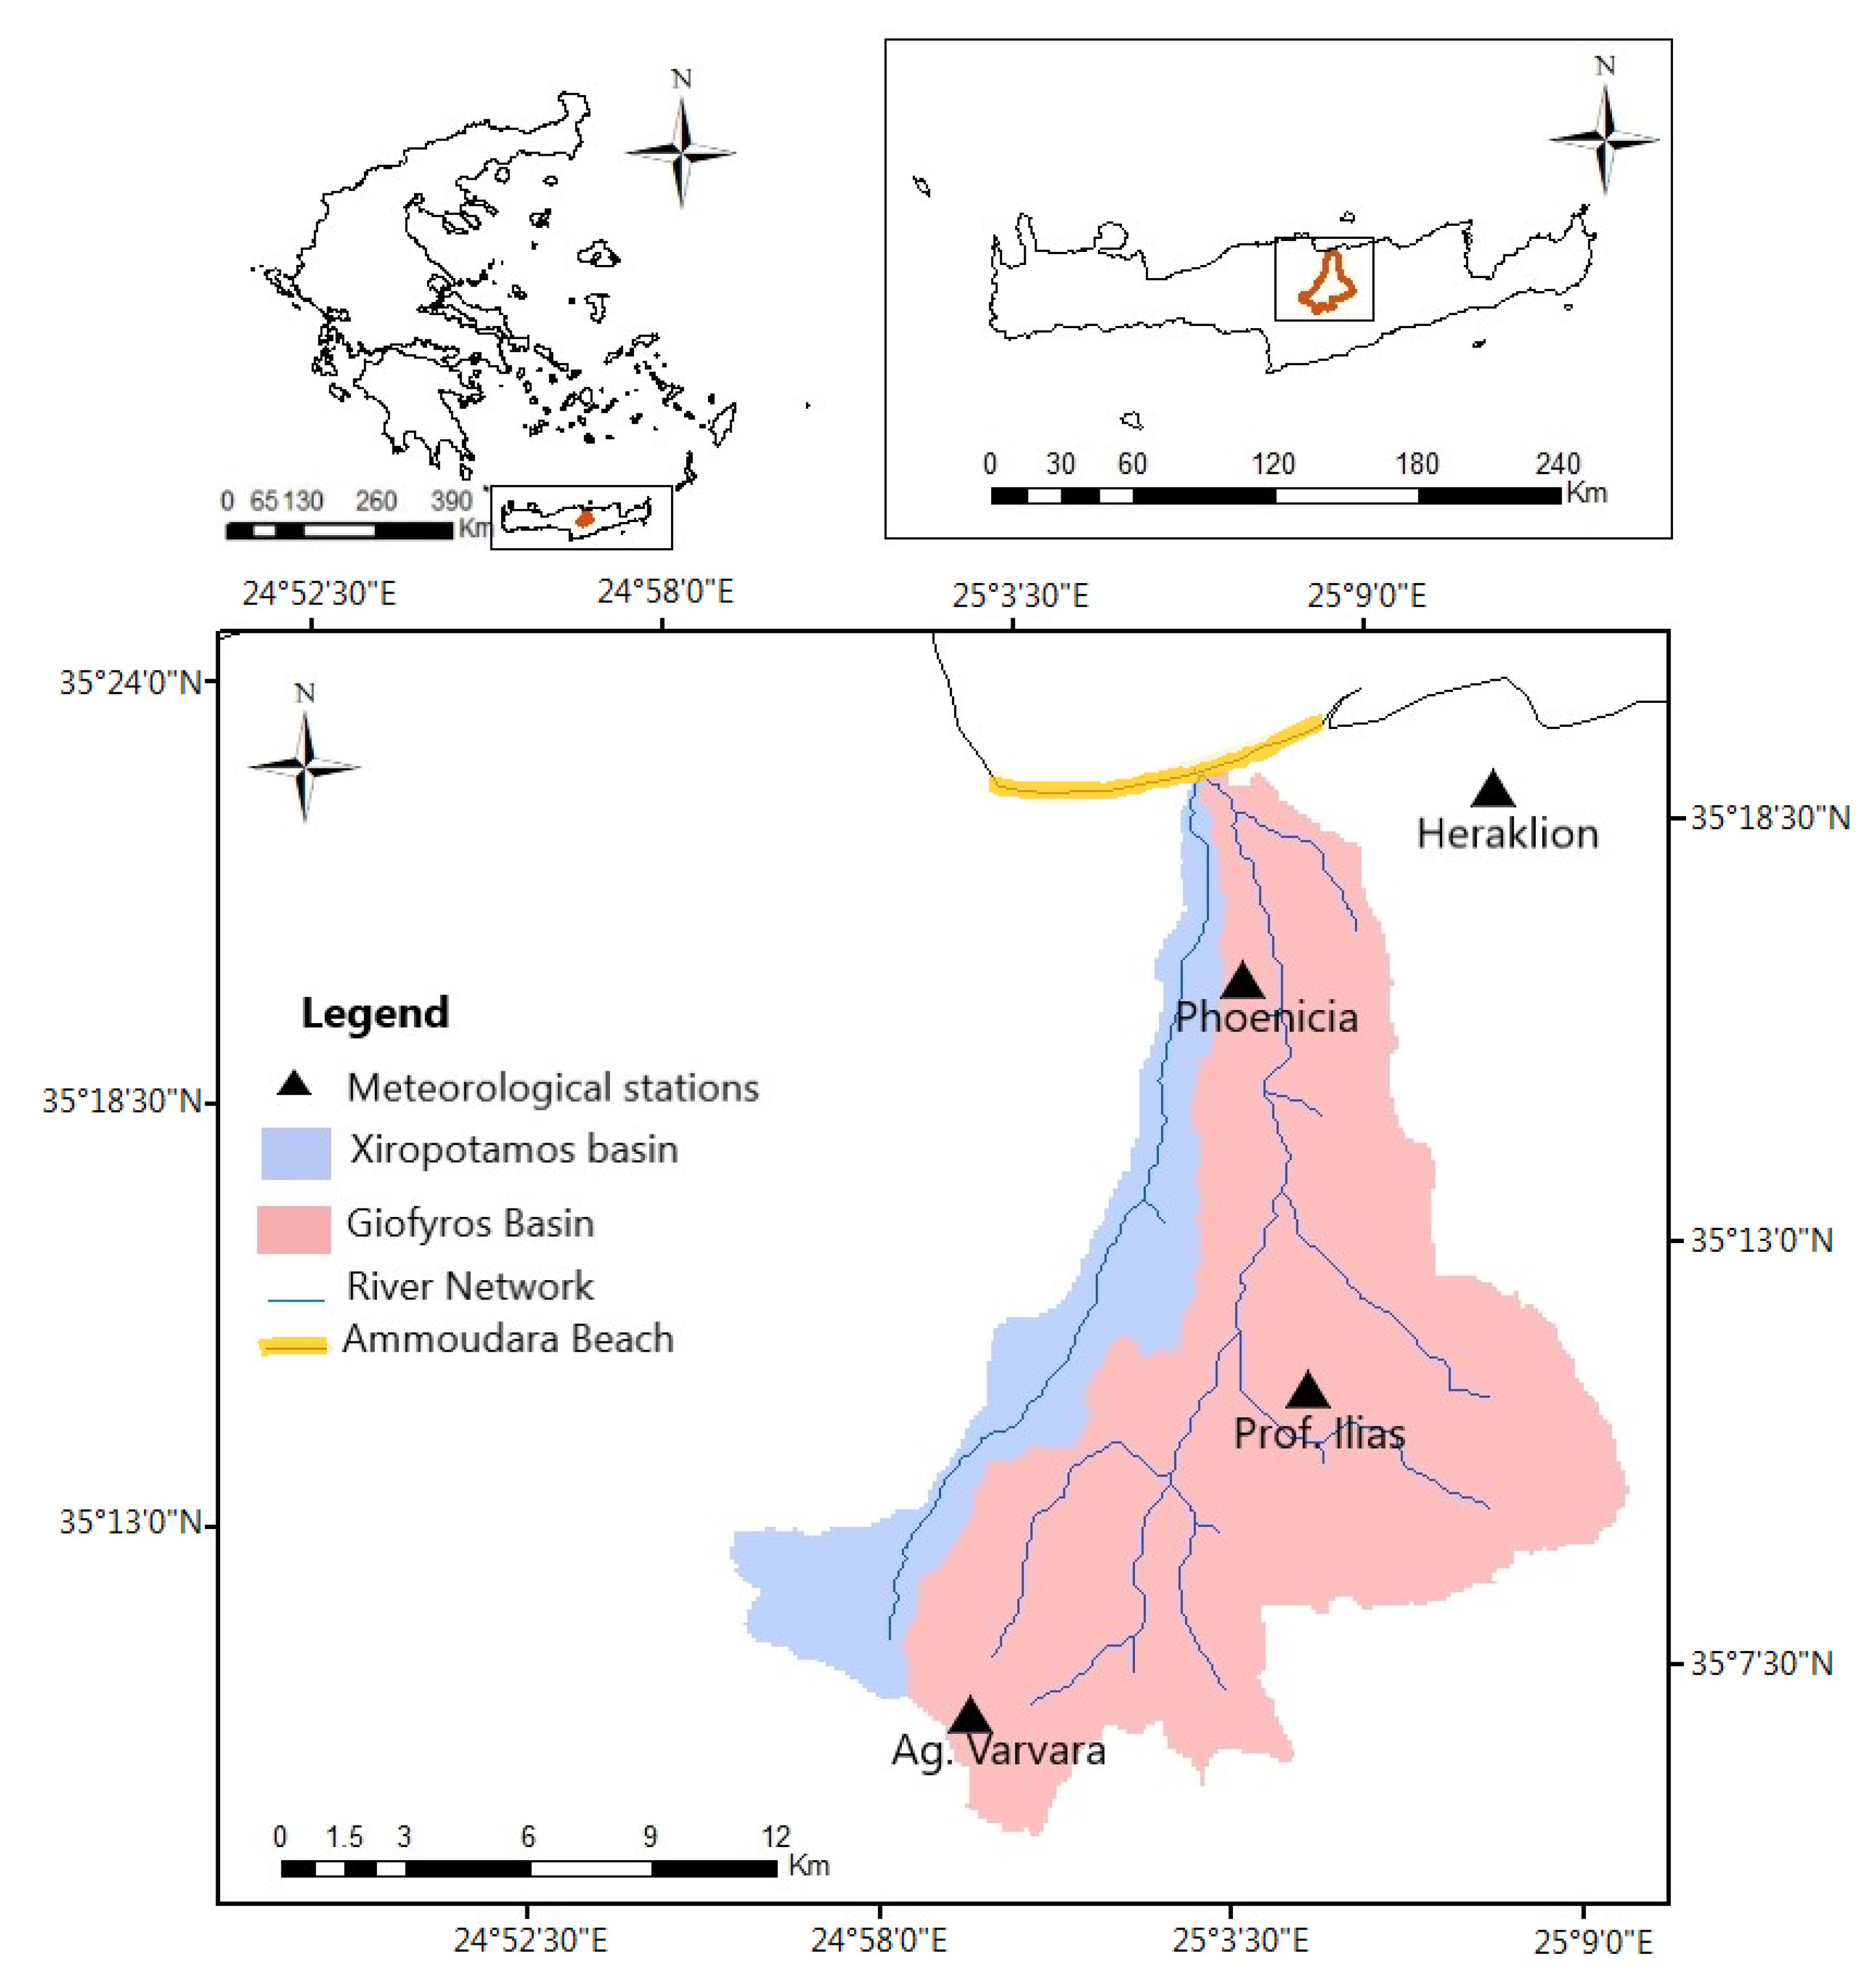
Figure 1. Location of Giofyros and Xiropotamos watersheds and location of the Meteorological stations.
Hydrology 10 00038 g001
Figure 2. (a) Aerial photo showing the central and eastern part of Ammoudara beach; (b,c) satellite images taken in October 2013 and August 2015 respectively, providing evidence of offshore sediment transport. The wave breaking zone in the reed is also evident; (d) satellite image taken in Februaty 2015 showing a plume event offshore Xiropotamos river mouth at the eastern part of Ammoudara beach (satellite image source: Google Earth).
Hydrology 10 00038 g002
Figure 3. (a) Ammoudara beach, Heraklion, Crete; location of the optical system, the field of vision of the cameras, the Heraklion Meteorological station and the mouth of Xiropotamos river, and (b) Example of Geo-rectified TIMEX mosaic of Ammoudara beach (6 February 2014, 10:00).
Hydrology 10 00038 g003
Figure 4. (a) Hydrograph of daily calibration of the total of period 1977–1984; and (b) hydrograph of the validation period during the hydrological year 1995–1996 (Giofyros watershed).
Hydrology 10 00038 g004aHydrology 10 00038 g004b
Figure 5. Simulated flow for the year 2014 using SWAT calibrated model.
Hydrology 10 00038 g005
Figure 6. (a) Geo-rectified TIMEX mosaic of Ammoudara Beach during the rainfall-runoff event (27 February 2014, 12:00); (b) (2 March 2014, 12:00); (c) (5 March 2014, 12:00); (d) (8 March 2014, 12:00) showing the plumes; and (e) graph of the RGB analysis of images before (a), during (stage 1 and 2) (b,c) and after (e).
Hydrology 10 00038 g006
Figure 7. (a) Geo-rectified TIMEX mosaic of Ammoudara Beach during the rainfall-runoff event (23 March 2014, 12:00); (b) (25 March 2014, 12:00); (c) (27 March 2014, 12:00) showing the plumes; and (d) Graph of the RGB analysis of images before (a), during and after the event (b,c).
Hydrology 10 00038 g007
Figure 8. (a) Geo-rectified TIMEX mosaic of Ammoudara Beach during the rainfall-runoff event (8 August 2014, 13:00); (b) (13 August 2014, 13:00); (c) (15 August 2014, 13:00) showing the plumes; and (d) graph of the RGB analysis of images before (a), during and after the event (b,c).
Hydrology 10 00038 g008
Figure 9. (a) Geo-rectified TIMEX mosaic of Ammoudara Beach of the rainfall-runoff event (6 October 2014, 11:00); (b) (12 October 2014, 11:00); (c) (17 October 2014, 11:00) showing the plumes; and (d) graph of the RGB analysis of images before (a), during and after the event (b,c).
Hydrology 10 00038 g009
Figure 10. Daily precipitation heights and daily sediment yield during 2014.
Hydrology 10 00038 g010
Table 1. Data sources used for setting up the SWAT model.
DataSourceResolution
DEMSTRM- United States Geological Survey (USGS) https://earthexplorer.usgs.gov/ (accessed on 15 October 2021)30 m
Land useLand use map of The European Environment Agency (EEA)-
SoilHarmonized world soil database (HWSD)/FAO-
Observed HydrometeorologyDirectorate of Water of the Decentralized Administration of Crete/National Meteorological ServiceDaily
Table 2. Parameters used for the calibration of the SWAT model.
File 1Parameter NameDescriptionRange
.GWGWQMNThreshold depth of water in shallow aquifer required for return flow to occur (mm H2O)0–5000
RCHRG_DP
ALPHA_BF
Deep aquifer percolation fraction
Baseflow alpha factor (1/days)
0–1
0.1–1
.SOLSOL_ZDepth from soil surface to bottom of layer (mm)0–3500
SOL_AWCAvailable water capacity of the soil layer (mm H2O/mm soil)0–1
.HRULAT_TIMELateral flow travel time (days)0–18
EPCOPlant uptake compensation factor.0–1
ESCOSoil evapotranspiration compensation factor0–1
CANMXMaximum canopy storage (mm H2O)0–100
.RTECH_K2Effective hydraulic conductivity in main channel alluvium (mm/h)(−0.01) until 150
.MGTCN2Initial SCS runoff curve number for moisture condition II.35–98
1 with mgt, crop cover management process; gw, groundwater process; sol, soil water dynamics process; rte, water routing; hru, water dynamics at HRU level.
Table 3. SWAT–CUP Sensitivity Analysis results parameter ranges for 12 parameters.
No. 1Parameter NameFitted ValueMinMaxp Value
1R__SOL_K (1).sol0.88450−0.100001.00000.00000
2R__RCHRG_DP.gw0.43550−0.100000.60000.00000
3R__SOL_Z (1).sol1.027650.500001.11000.00005
4V__CANMX.hru12.15000.0000030.0000.01127
5V__EPCO.bsn0.939120.9273360.98210.02186
6R__CH_K1.sub17.625015.000040.0000.12865
7V__ESCO.bsn0.173150.156670.270320.31120
8R__CN2.mgt−0.37277−0.39585−0.349220.40871
9R__SOL_AWC (1).sol0.575010.492900.583630.42238
10R__GWQMN.gw−0.43125−0.500000.750000.65486
11R__ALPHA_BF.gw−1.09526−1.09568−1.01000.72990
Table 4. Statistical criteria for the calibration and the validation period.
Satisfactory LevelCalibrationValidation
NSE>0.50.620.58
PBIAS25%8.6−2.3
RSR<0.70.610.73
Disclaimer/Publisher’s Note: The statements, opinions and data contained in all publications are solely those of the individual author(s) and contributor(s) and not of MDPI and/or the editor(s). MDPI and/or the editor(s) disclaim responsibility for any injury to people or property resulting from any ideas, methods, instructions or products referred to in the content.