Abstract
The Maknessy plain in central Tunisia is one of the most important agricultural basins in Tunisia. Given the semi-arid climate conditions, the irrigation of cultivated crops relies principally on the abstraction from groundwater resources. The assessment of the quality of the used water for agricultural purposes is crucial for safe production. Thus, the objective of this work is to assess the physicochemical quality of the irrigation water resources in this catchment area using a combined chemical, isotopic, and statistical approach. The waters analyzed are represented by two types of groundwater, mainly calcium hyper chloride and calcium sulfate. A multivariate statistical analysis (PCA and HCA) and a geochemical approach have been applied to study water quality as a function of chemical parameters, showing that the EC and TDS are the parameters influencing water quality. The stable isotopic compositions of the sampled waters range from −7.53 to −4.90% vs. VSMOW and from −53.6 to −32.2% vs. VSMOW for δ18O and δ2H; they show the exchange between groundwater and rock and the evaporation effect. The isotopic data form three groups such as recent water, paleowater, and mixing water indicate the evaporation effect and interaction of the groundwater, and confirm that this aquifer has been recharged by current rainwater. So, these aquifers were recharged by precipitation derived from a mixture of cloud masses from the Atlantic Ocean and the Mediterranean Sea. The findings of this research are of important relevance for effective water resources management in this agro-based region. Indeed, the increased exploitation of these resources will induce a continuous reduction in the available resources and progressive degradation of the used water quality that may adversely impact the safe agricultural production and the economic resilience of the local population.
1. Introduction
Groundwater is the principal resource used continuously for agricultural purposes, industrial development, and domestic consumption, especially in arid and semi-arid regions, namely the southern Mediterranean basin, where the scarce and the nonperennial surface waters lead to increasing use of groundwater resources [1,2,3]. This continuous exploitation has induced severe environmental issues constraining optimal natural resources exploitation for sustainable development [2]. In addition to the availability of fresh water resources, the suitability of the used quality for domestic consumption and agricultural needs have a relevant influence, challenging the sustainability of the exploitation and the environmental conservation of agricultural land [4]. Thus, several studies have been conducted, using chemical, isotopic, hydrogeological, geophysical, and statistical approaches [5,6,7,8] to evaluate the quality of the groundwater resources and the suitability of these resources for special purposes in different agro-based regions in India, China, Yemen, Iran, Iraq, Tunisia, and Algeria [1,3,5,9,10,11,12,13,14]. These studies have largely discussed the ecological impacts of the excessive exploitation of groundwater resources, especially in the North African and Middle Eastern regions (MENA). In Tunisia, the environmental issues related to the abusive exploitation of groundwater resources to meet the agricultural requirements have been largely discussed. Previous geochemical and isotopic research indicated that groundwater depletion, aquifer decompression, and progressive quality degradation are increasingly reported in different agricultural regions in Tunisia [6,15].
The Maknessy basin, located in central Tunisia, is an agro-based region characterized by an arid to semi-arid climate. Groundwater is continually decreasing, and groundwater is almost depleted as a result of increasing water demand, such as population growth, over-exploitation, climate change, industrial activities, and the intensification of agriculture since agricultural activity in this region is intensive and the high demand for water coincides with the dry period of the Mediterranean climate [15]. These have resulted not only in reduced water availability but also in deteriorating water quality [16,17]. Indeed, the degradation of groundwater quality and salinization of soils are the main threats to the sustainable use of natural resources [18,19,20]. However, the sustainability of agricultural production is, furthermore, threatened by the emerging salinization issues of fertile lands, inducing progressive abandonment of several managed perimeters. Groundwater and soil efficient management are therefore highly required for this region to maintain the productivity of agriculture and consequently to secure the livelihood of the local population. In this study, we use hydrochemical studies of groundwater to determine the processes that govern the chemistry and quality of groundwater [21,22,23,24,25], and the study of environmental isotopes of oxygen (δ18O) and hydrogen (δ2H), which are excellent tracers for determining the origin of groundwater and are widely used to study groundwater supply, migration routes, and mixing of water from different sources [15,19]. Additionally, the different isotopic compositions of hydrogen and oxygen from different water sources and the stable isotopic ratios of hydrogen and oxygen (δ18O and δ2H) are excellent ways to determine the way to recharge and discharge groundwater [15]. The objectives of this study cover various water issues in The Maknessy basin related to groundwater flow migration, mixing and potential recharge areas, water suitability assessment for particular uses, and mineralization processes and mechanisms via geochemical modeling, statistical analysis, and isotopic characterization.
2. Study Area
The study area, the Maknessy basin (Central Tunisia), part of the Sidi Bouzid Governorate, is located in the southeastern part of the central basin, which belongs to the south of the Mediterranean basin. It covers a geographical area of approximately 1235 km2 and consists of a large syncline basin with Mio-Plio-Quaternary (MPQ) filling by anticline reliefs with Cretaceous cores [26]. It is bounded to the north by the Meloussi and Majoura ranges, to the east by the Jebal Jebbeus and Jebs ranges, to the south by Jebal Bouhedma, and to the west by Jebal El Goussa (Figure 1). The study area is characterized by an arid Mediterranean climate [27,28] with erratic annual precipitation of about 200 mm. However, evapotranspiration is about 1500 mm/year [29]. In this region, intensive agricultural activities depend mainly on the extraction of underground resources, and it is faced with quantitative and qualitative constraints like any region subjected to an arid climate [2,30,31]. The groundwater resources of the studied watershed are found in three major reservoirs: a water table formed by Quaternary detritic deposits and a deep aquifer constitute two levels, the lower Zebbag Formation and the upper Zebbag Formation [16,26].
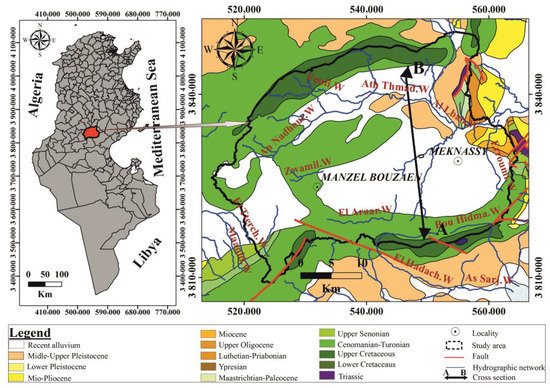
Figure 1.
Location and geological map of the study area [32].
3. Geological and Tectonic Setting
Lithostratigraphic outcrops in the study area have a stratigraphic series from the Triassic to the Quaternary (Figure 2). A few scattered Triassic outcrops are present in the eastern closure of the basin (north–south axis). The Triassic outcrops at the NW–SE alignment, especially at the Jebel Jebbeus, are represented by evaporative sediments with Germanic facies consisting essentially of gypsum, gypsum clay, and dark grey dolomite [33,34]. The Maknessy basin is dominated by Cretaceous outcrops, Lower Cretaceous deposits form the core of the Bouhedma structure, and is marked by the presence of Greso-Dolomitic series, fluvial sands, mixed carbonate deposits, clayey, marno-carbonates and evaporatitics, fine sands, and dolomitic bars. The Late Cretaceous series are widespread within the field of study; they is represented by the middle and upper limbs of the Zebbag Formation, as well as the Annaba and Bireno Formations and the Aleg clay Formation, and the limestone levels of the Abiod/“Berda” Formation characterize the third term [27,35]. The deposits of Mio-Pliocene are rarely found in the Maknassy basin; they are most often intersected by drilling. This series takes the form of a clayey facies with the Segui Formation outcropping along the eastern southern flank of Boudouaou [36]. The deposits of the Quaternary are essentially silts, accumulation glacis, limestone crusts, and gypseous crusts. They cover the agricultural plains on large extensions within the field of study.
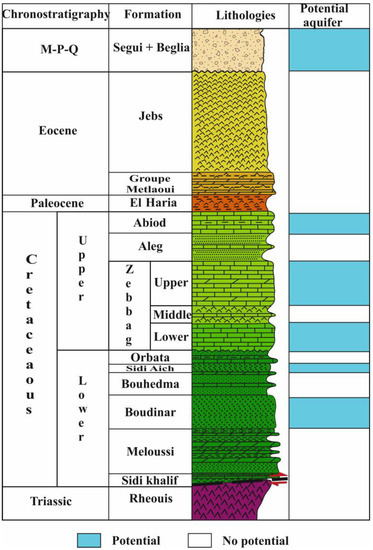
Figure 2.
Lithostratigraphic log of the study area showing the potential of each formation to act as an aquifer [36].
The Maknessy basin is controlled by a set of major transverse faults parallel to the bending directions which are responsible for its current geometry [36] (Figure 1). The western end of the Bouhedma anticline is affected by the major El Mech fault, with an average direction N120 [34,36]. In addition, the Majoura–Meloussi megastructure is affected by a multi-kilometer inverse fault with a series of faults marking the southern flank of this fold. In the center, the Maknessy syncline is broken by a system of normal faults sealed by MPQ filling [34]. Indeed, the end of the Maknessy basin is affected by an N-S fault network leading to the closure of the basin following uplift movements that caused the Triassic outcropping at this level [36].
4. Hydrogeological Setting
The hydrogeological characterization of this mega syncline structure outlines the existence of at least four potential aquifer levels, of which the fractured karst limestones of the Upper Cretaceous and sandstone of the Lower Cretaceous are the most productive [36] (Figure 3). These hydrogeological entities are, top to bottom, (i) the MPQ aquifer, represented as very heterogeneous, consisting of silico clastic formations (sands and sandstone) with alternating clays. The MPQ is the shallow water table of the Maknessy plain. Thus, it is heavily exploited by more than 500 surface wells in the agricultural sector. This level is characterized by a pumping flow of 10 to 23 L/s [29,34]. (ii) The Cenomano–Turonian reservoir is represented by two deep aquifer levels heavily exploited in the Maknessy region. Upper Zebbag (karst carbonate deposits) is the most exploited level in most of the Maknessy basin. It is a karstic dolomitic formation, sometimes allowing excellent catchments with specific flows reaching 21 L/s. The Zebbag lower to carbonate dominance is captured by several boreholes in the Maknessy plain, mainly in the central part. The good test revealed excellent hydrogeological characteristics and a flow rate of about 90 L/s [34,35,36]. (iii) The Lower Cretaceous is characterized by its carbonate, sandstone, and sandy facies and, in particular, the Boudinar Formation, which showed excellent hydrogeological characteristics, especially at the Kharrouba 2 drilling. This drilling yielded an artesian flow of 51 L/s [34,35,36].
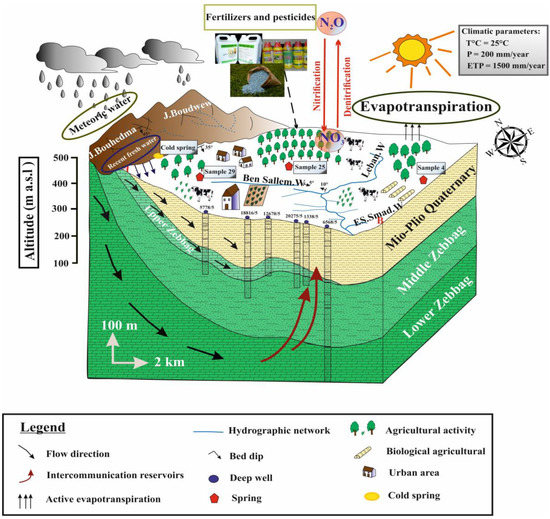
Figure 3.
Conceptual model of the aquifer system for the Maknessy basin (modified from [17]).
In addition, several cold springs emerge at the outcrops of the Lower Cretaceous, the most important of which is the Aïn Djemel (a flow rate of about 8 L/s) which seems to originate from a dolomite bank. The Haddage thermal spring, in the form of several griffins, emerges with a temperature of about 37 °C and a natural flow rate of about 5 L/s [34].
5. Materials and Methods
5.1. Sampling and Analytical Procedure
In this study, sixty-one groundwater samples were collected from the study area in February 2022. The depths of the wells ranged from 15 to 560 m across the study area. Before sampling, the wells were pumped for 10 min to obtain representative stable chemical conditions (pH, EC, and temperature) measured in the field by a conductiviometer. The water temperature and the electrical conductivity (EC) of each sample were measured in the field with a 20 °C conductivity meter, and the pH was measured on the spot using a pH meter. Concentrations of Mg2+, Na+, K+, Ca2+, Cl−, HCO3−, NO3−, and SO42− in groundwater samples were analyzed in the Soil and Water Physicochemical Laboratory of the Regional Commission for Agricultural Development (RCAD) Sidi Bouzid and the Hydrogeology and Geochemistry Laboratory of the Company of Phosphate of Gafsa (CPG). The levels of Mg2+, Cl−, HCO3−, and Ca2+ were determined by titration. Concentrations of other chemical species (SO42−, Na+, K+, and NO3−) were measured by flame atomic absorption spectrophotometry. The accuracy of the chemical analyses was tested by taking the relationship between cation totals (Na+, K+, Ca2+, and Mg2+) and anions (Cl−, NO3−, HCO3−, and SO42−) for each analysis of the complete water sample using the ion load balance equation, as the percentage of error values < 6% was obtained. All ionic concentrations are expressed in milli-equivalents per liter (meq/L):
E = 〖∑ (cations − anions) / ∑ (anions + cations) 〗 × 100
Groundwater sampling locations in the study area (Figure 4) were mapped using kriging interpolation from the ArcGIS 10.2 software. This software is also used for nitrate and salinity to assess the distribution of their concentrations in the shallow Maknessy basin aquifer.
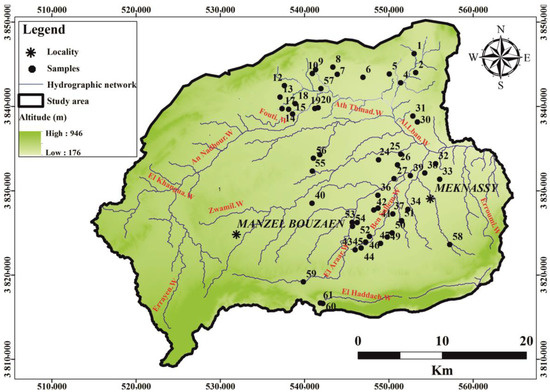
Figure 4.
Map of groundwater sampling.
5.2. Graphical Methods
The Piper diagram [37] is commonly used for representations of hydrochemical types. Recently, it has been used in numerous studies [9,17,26,27,38,39] to analyze the main hydrogeochemical types controlled by anions and cations. It was established using diagram software for Piper, as the hydrochemical data of the aquifer are plotted on a Piper map, and it was also used to represent the chemical composition of a set of water samples. The Gibbs diagram [40] shows the main processes controlling groundwater chemistry. This diagram is widely used in groundwater studies to establish the relationship between water and aquifer characteristics to understand and distinguish the mechanisms that control water chemistry [39,41,42].
5.3. Multivariate Statistical Analysis
The statistical methods were used to interpret the obtained physicochemical proprieties. This technique is a useful tool for obtaining important information about the hydrochemistry dataset in the groundwater system [42]. It is used to independently quantify and classify different types of groundwater samples and to determine the correlation between chemical parameters and groundwater samples. The statistical analysis software used in this article is XLSTAT (version 2022) for Windows to evaluate the analytical data using multivariate statistical techniques, that is to say, PCA (principal component analysis) techniques, HCA (hierarchical upward classification), and the analyzed dataset including all data, as well as stable (δ18O) oxygen isotopes and deuterium (δ2H) data that are analyzed by mass spectrometry in the laboratory of the Gabes Institute of Water Science and Technology (ISSTEG).
Multivariate statistical analysis is used to independently quantify and classify different types of groundwater samples. A PCA can be used to simplify data and determine the relationships between variables and samples. Additionally, the analysis of the main components is evaluated the aggregation or similarity of the data and determines the source of the differences between the parameters. In the PCA, the main components of groundwater data are extracted. Applying the maximum variance method for maximum component rotation to reduce size, Varimax rotations with Kaiser normalizations were used to maximize total variance of factor coefficients; this better explains the possible sources of influence on the water system [9] extract the main influences and identifies factors that can be explained by water or the chemistry of artificial processes. HCA is a statistical aggregation technique widely used in hydrochemistry to examine chemical water quality data and is commonly used to classify water samples into groups based on chemical parameters. This is illustrated by a tree illustrating connection distances and differences between groups. The same PCA variables were also statistically modeled by the HCA technique to measure the similarity of groundwater samples to the corresponding physicochemical parameters, and to display the most distinct groups of hydrochemicals [6,7,43,44].
6. Results and Discussions
6.1. Groundwater Parameters
The results of the geochemical analysis in Table 1 confirm that all water samples have reached the ion balance (Error <6%). Table 2 provides a statistical summary of hydrochemical groundwater data to show chemical characteristics. The pH range from 7.1 to 8.53 indicates that the nature of groundwater is generally alkaline. The EC values range from 1.27 μS/cm to 20.30 μS/cm. The TDS spatial distribution map shows values ranging from 0.88 to 10.21 g/l with an average value of 2.58 g/L (Figure 5). The highest salinity values in the northern part of the basin are practically at Mellousi Jebal and in the Leban Wadi. In addition, the increase in salinity in the northeastern part of the region is explained by the overexploitation of MPQ aquifers such that the high demand for water coincides with the dry period of the Mediterranean climate. Additionally, the high use of water in everything in irrigation, such area agricultural activity, is intense. Salts and other dissolved substances begin to accumulate when water is absorbed by plants and evaporates on the surface. This indicates that the natural solubility of the aquifer is the main reason for the higher salinity [45]. This solubility may be due to biochemical factors or anthropogenic processes after irregular precipitation and high evaporation, so that the high demand for water coincides with the dry period of the Mediterranean climate [15]; also, extensive exploitation of water on everything in the agricultural field leads to the lowering of the water table level [16,17]. The variogram model with salinity is used to avoid the need for sensitivity analysis, as well as to characterize the quantity and quality of groundwater (Figure 6). The concentrations of Ca2+, Mg2+, and SO42− ranged from 4 to 24.8 meq/L; 1.2 to 39.2 meq/L and from 4.58 to 35.07 meq/L, respectively, and the Cl− value ranged from 4 to 80 meq/l. The average bicarbonate value (HCO3−) is 4.33 meq/L and ranges from 2.4 to 9.2 meq/L. The dissolution of carbonate minerals, such as calcite and dolomite, can contribute to bicarbonate in groundwater.

Table 1.
Geochemical data of groundwater in the Maknessy basin.
Table 2.
Descriptive statistics for the physicochemical properties of the groundwater samples.
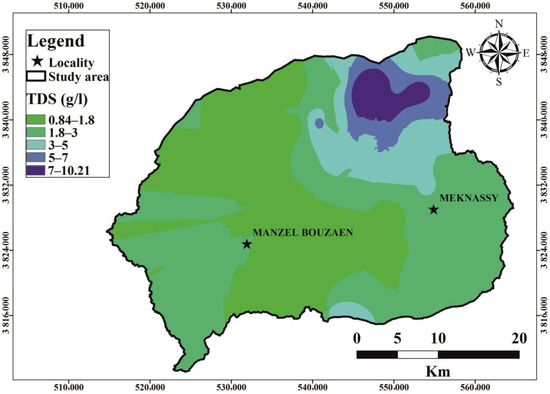
Figure 5.
Spatial distribution map of groundwater salinity in the Maknessy Basin.
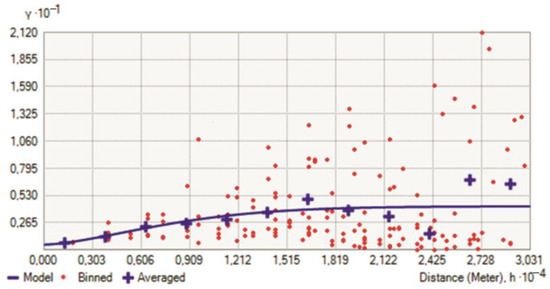
Figure 6.
The variogram model for the salinity.
6.2. Hydrogeochemical Facies
The projection of the water analysis on the Piper diagram (Figure 7) shows the chemical composition of the water [46].There is mainly two types of groundwater: calcium hyper chloride and calcium sulfate. Tests of key elements show that mineralization is regulated by calcium and magnesium for cations and by sulfate for anions (SO42− + Cl− + NO3−—Ca2+ + Mg2+).
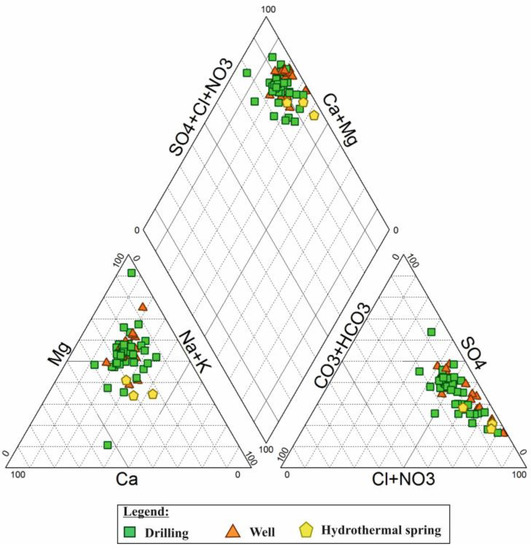
Figure 7.
Piper diagram of the groundwater.
According to the Gibbs diagrams, the relationship between the TDS and Cl−/ (Cl− + HCO3−) and Na+/(Na+ + Ca2+) (Figure 8) shows three sets of samples taken in the middle of the graph; this indicates that the main factor influencing groundwater chemistry is the interaction of rock water. It can be observed that any sample moving toward the predominance of precipitation may be affected by the chemical alteration of rock minerals [47].
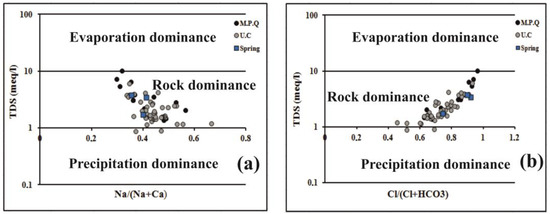
Figure 8.
Gibbs plots showing the mechanism that controls the groundwater chemistry in the study area. (a)- TDS and Na+/(Na+ + Ca2+) and (b)- TDS and Cl−/ (Cl− + HCO3−).
6.3. Major Ion Ratios and Relationships
The relationship between salinity and major element content shows that mineralization is regulated by sodium (Na+) as the correlation coefficient R2 = 0.93 and magnesium (Mg2+) R2 = 0.76 for cations and sulfate (SO42−), knowing that R2= 0.57 for anions. The correlation between calcium (Ca2+) and sulfate (SO42−) reflects a Ca2+ deficit compared to SO42−, which is confirmed by a correlation coefficient, R2 = 0.31. This correlation indicates the dissolution of gypsum and calcium deficiency expressed as Ca2+/SO42−; the ratio is related to the participation of this ion in basic exchange processes with clay minerals during groundwater flow and shows a net excess of calcium (Figure 9a). Thus, the sulphated facies of these waters may be related to the dissolution and/or leaching of abundant gypsum in the soils and geological formations of the Maknessy plains. In addition, the Na+/Cl− ratio correlation is positive, such that R2 = 0.93 (Figure 9b), which was calculated to distinguish the alteration of sodium carbonate and also used for the interaction of water rocks, which is generally very low in carbonate alteration. The dissolution of the halite controls the chemistry of Na+ and Cl−. In fact, the reverse cation exchange process is confirmed by the trace of (Na+ + K+—Cl−) against [((Ca2+ + Mg2+)-(HCO3− + SO42−)] (Figure 9c). The Na+/Cl− versus the TDS curve (Figure 9d) was established to recognize groundwater associated with ion exchange and silicate weathering. The ratio (Ca2+ Mg2+)/HCO3− shows an excess of (Ca2+ + Mg2+) (Figure 9e). Silicate modification can also be deduced by tracing the relationship between (Na+ + K+) and total cations (TC) (Figure 9f). Sodium and potassium (Na+ + K+) showed a good correlation with total cations (TC), especially at higher concentrations, suggesting a role of silicate alteration in solute acquisition. The exchange of ions between groundwater and its host environment during the residence or displacement process is an important determinant of water composition. Chloroalkaline indices (CAI) were used to understand the ion exchange between the groundwater and its host environment. The chloro-alkaline indices are expressed by the following equations:
CAI–I ⇔ Cl− − (Na+ + K+)/Cl−
CAI-II ⇔ Cl− − (Na+ + K+)/SO42−−+ HCO3− + NO3−
NaCl(halite) ⇔ Na+ + Cl−
CaSO4·2H2O(gypsum)⇔ Ca2+ + SO42− + 2H2O
CaCO3(calcite) + H2O + CO2 ⇔ Ca2+ + 2HCO3−
CaMg(CO3)2(dolomite) + 2H2O + 2CO2 ⇔ Ca2+ + Mg2+ + 4HCO3−
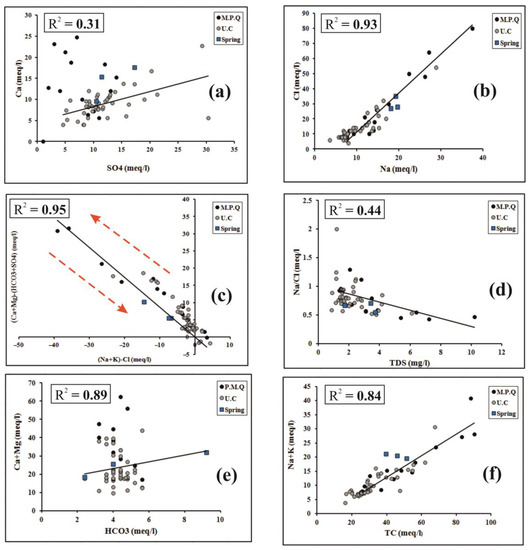
Figure 9.
Plots of major ion ratios and relationships: (a) Ca2+ vs. SO42−; (b) Na+ vs. Cl−; (c) (Na+ + K+)−Cl− vs. (Ca2+ + Mg2+) − (SO42− + HCO3−); (d) TDS vs. (Na+/Cl−); (e) HCO3− vs. (Ca2+ + Mg2+); and (f) TC vs. (Na+ + K+) for the groundwater in the study area.
6.4. Nitrate Contamination
Nitrate is one of the most common chemical pollutants in shallow aquifers in the world. This poses a serious problem and threat to groundwater supplies. Agriculture can also have a major impact on groundwater quality. Nitrate contamination of surface waters is of concern because it can negatively impact water supplies and ecosystems [6,48]. Nitrate is used to describe urban and agricultural lands where nitrate concentrations in groundwater are high [19] because, in modern agriculture, farmers use pesticides and herbicides to increase their yield [30].
The Maknessy region is characterized by intensive agriculture where the concentration of nitrate in the soil is linked to human waste practices. Excessive levels of nitrate in drinking water may indicate the presence of other types of contaminants, which can cause health problems. From dead plants, crop residues, and livestock waste, organic matter is supplied to the soil and aquatic environment [49]. In oxygenated soils and aquatic environments, bacteria transform ammonia into nitrite (NO2−) and nitrate (NO3−) during nitrification (Figure 3). Nitrate concentrations were measured in sixty-one water samples collected in January and February 2022. The highest nitrate value in all groundwater samples is 79 mg/L on irrigated agricultural land, and the groundwater was observed in the northern part of the study area. The presence of nitrates in water in this part is mainly due to human activities. The use of fertilizers and synthetic manure, combined with intensive agriculture and livestock farming, promotes the appearance of nitrates in water. Since this area is considered an agricultural area, there is a large distribution of crops that require high doses of fertilizer, which leaves excess fertilizer in the soil for long periods of time. The latter explains that nitrate comes from fertilizers and from the bacterial transformation of soil organic nitrogen into an inorganic form (mineralization) after temporary grassland tillage. This is because nitrogen is constantly transported through the soil throughout the nitrogen cycle, as nitrate is the predominant form of nitrogen in cropland [2,3,11]. It is soluble in water and easily penetrates the soil to the water table [30,49]. Under hot and dry conditions, nitrate concentrations also increase through evaporation [50]. Therefore, nitrate concentration is an important indicator of groundwater quality. In addition, due to the low mitigation of pollutant loads in soil and water matrices, nitrate is one of the important parameters that can be easily tracked and used to assess the risk of pollution (Figure 10).
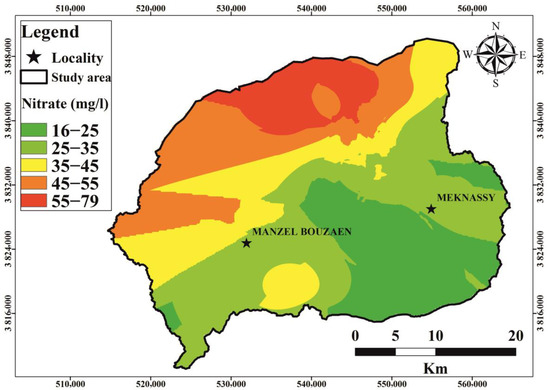
Figure 10.
Spatial distribution map for nitrate analysis.
6.5. Multivariate Statistical Techniques
6.5.1. Correlation Coefficient Matrix
The matrix of correlation coefficients is often used to establish a relationship between two variables. It is also the first step toward statistical modeling using major component analysis (PCA). The Pearson correlation matrix for analytical parameters for groundwater samples is pH, T, EC, and TDS, as well as chemical parameters, including Ca2+, Mg2+, Na+, K+, HCO3−, Cl−, SO42−, and NO3−, which are presented in Table 3.
Table 3.
Pearson’s correlation coefficient matrix for physicochemical parameters in the Maknessy basin.
Table 3 presents the positive and negative correlation parameters. It observed that the correlations between the EC and TDS and other hydrogeochemical parameters were significantly positive, and it was found that Ca2+ and HCO3− were negatively correlated with pH. As indicated, the TDS is strongly correlated with Na+ (0.93), K+ (0.78), Ca2+ (0.74), Cl− (0.95), and Mg2+ (0.76). So, a value above 0.7 indicates a high correlation, and a value below 0.7 indicates a moderate correlation. We find important temperate correlations between anions and cations highlighted between Cl− and Na+ (0.95), Cl− and K+ (0.81), Cl− and Ca2+ (0.73), Cl− and Mg2+ (0.71), SO42− and Na+ (0.53), SO42− and K+ (0.28) and SO42−, and Ca2+ (0.66). These results indicate that the majority of chlorides are due to the dissolution of the evaporitic sediments (NaCl and KCl) but are significantly low with other minerals. Indeed, a high correlation between Cl− and Ca2+ is due to the leaching of evaporation levels and dissolution of gypsum and halite, increasing the contents of calcium and chlorides and exchanges of strongly mineralized bases.
6.5.2. Principal Component Analysis: PCA
Based on a set of water quality parameters, namely pH, EC, TDS, T, Na+, K+, Ca2+, Mg2+, Cl−, SO42−, NO3−, and HCO3−, we performed statistical analyses using the main technology (factor analysis), based on the principal component analyses (PCA) and a hierarchical upward classification (HCA) of chemical data. Positive PCA values indicate that water samples are significantly affected by the loading parameters of a particular component, while negative values indicate that water quality is virtually unaffected. Table 4 shows the PCA component matrix and the rotation component matrix. The first two factors account for approximately 62% of the total variance (47.98% for PC1 and 14.15% for PC2) (Table 4). PC1 includes EC, TDS, Na+, K+, Cl−, Ca2+, Mg2+, and HCO3−. It mainly controls ionic chemistry and represents the natural hydrochemical evolution of groundwater through geological interactions of groundwater. Table 4 shows that PC1 is roughly attributed to mineralization by a good correlation with the TDS and key elements. This may be due to the dissolution of rocks and minerals in the aquifer by chemical alteration [9]. Cl− is obtained from precipitation, the dissolution of impurities, and the evaporation of liquids, as well as industrial wastewater, household waste, and fertilizers [9]. PC2 contains some important chemical elements; thus, that PC2 is correlated with pH, NO3− and moderately with Ca2+ and HCO3− due to the dissolution of carbonates and especially nitrate contamination (0.82).
Table 4.
Varimax-rotated component loadings.
6.5.3. Hierarchical Cluster Analysis: HCA
The HCA and PCA were applied from the groundwater dataset, which creates clusters. Group 1 is composed of pH, Mg2+, SO42−, Na+, Ca2+, and T. Group 2 comprises the TDS, K+, NO3−, EC, and HCO3−. These two groups correspond almost to the results of the PCA. These results are expressed in dendrograms (Figure 11a,b). This technique has been applied to hydrochemical data [9]. The first group is related to the influence of fertilization on the EC, TDS, water, NO3−, and K+ (Figure 11a). The second group shows the dissolution of rocks and minerals in the aquifer by chemical alteration (Figure 11b), the latter being confirmed by the TDS (R2 = 0.973), EC (R2 = 0.728), K+ (R2 = 0.797), and NO3− (R2 = 0.829) groups. It examines all structures affected by precipitation in the soil, including the acquisition of ions by the decomposition of rocks by the hydrolysis of minerals and mineralization processes influenced by anthropogenic activities [26].
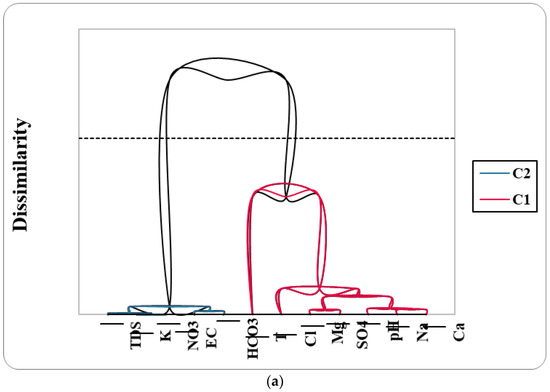
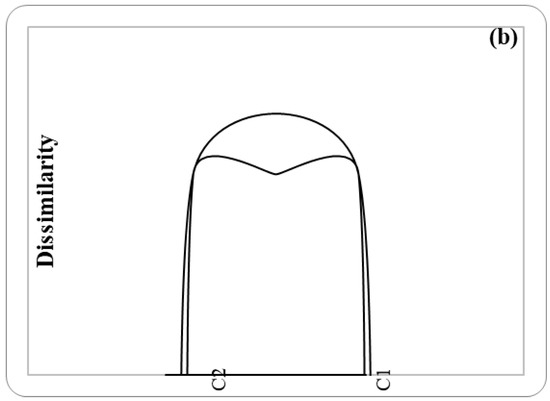
Figure 11.
(a) A dendrogram of the HCA for physicochemical parameters and (b) a dendrogram of the HCA for groundwater samples.
6.6. Environmental Isotopes
In the conventional diagram is δ18O/δ2H for groundwater samples (Figure 12); all samples analyzed were located below the regional meteor water line (RMWL) and defined on the basis of samples of monthly precipitation samples taken at the Sfax station (RMWL: δ2H = 8 δ18O + 13.5 [43]) and the global meteorological waterline (GMWL: δ2H = 8 δ18O + 10 [51]). The global meteorological water line (GMWL) is an average of several local weather lines, each of which is influenced by geographic and climatic factors. The interception of the GMWL is called excess deuterium (d-excess = δ2H − 8 δ18O [52]). The value of this parameter was obtained during evaporation and did not change significantly in subsequent cloud history. It is, therefore, a valuable indicator of the region of origin of water vapor [53]. The d-excess values analyzed varied between 1.93 and 11.19‰, as excess values close to 10% indicate waters of Atlantic origin, and values close to 14 are detected in rainwater falling on the western Mediterranean. This is believed to be due to particular climatic and environmental conditions that cause air instability over the Atlantic Ocean and the Mediterranean Sea, resulting in a strong exchange between moisture and the surface of the sea. This study provided twenty samples from the study area (the Maknessy basin). These samples are taken from different parts of the aquifer. The stable isotopic compositions of the groundwater samples analyzed, which ranged from −7.52% vs. VSMOW to −4.89% vs. VSMOW (δ18O) and −53.6% vs. VSMOW to −32.2% vs. VSMOW (δ2H). The individual data points are listed in Table 5, and this variation is controlled by the parameters of local climatic conditions, including the source of the water vapor mass, re-evaporation and seasonality during precipitation, and monthly precipitation [54,55]. Most of the samples are located near the global weather line, indicating that the groundwater is of atmospheric origin [51], and some samples placed to the left of the GMWL show δ18O enrichment and that the groundwater is the most dilute, confirming that the alluvial groundwater of the Maknessy basin comes from the current storm water.
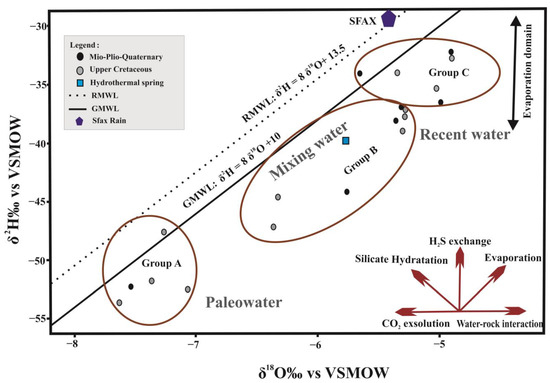
Figure 12.
Diagram δ2H / δ18O of the analyzed groundwater samples.
Table 5.
Isotopic data of the groundwater in the Maknessy basin (February 2021).
Diagram δ18O/δ2H shows the clustering of the MPQ and Upper Cretaceous wells into three groups, which trace mainly between the RMWL and GMWL; this indicates that these aquifers have been recharged by precipitation derived from a mixture of Atlantic Ocean and Mediterranean vapor masses [53]. The first group (A) of the groundwater of the MPQ and Late Cretaceous, characterized by the most depleted 18O/2H content, reveals an ancient origin, probably related to recharge in cold paleoclimatic conditions [27,28].
Certainly, stable isotopic signatures of the paleowater in the Maknessy basin, as all semi-arid regions of low latitude, are more likely to be controlled by the amount and intensity of precipitation than by temperatures, as in high latitude temperate regions [27]. These paleowaters are characterized by an excess of deuterium representing the lowest moisture caused by primary evaporation [56,57]. The second group (B) consists of samples taken from the deepest wells. The 18O and 2H data characterizing these samples show relatively large differences. In diagram δ18O/δ2H, the points representing the groundwater of these aquifers are located almost parallel to the GMWL toward the paleoclimatic waters, suggesting a mixture of two different end elements or direct infiltration of precipitation recent by faults or fractures [19,27]. Group (C) waters are characterized by richer stable isotope contents, which could be explained by an evaporation effect (Figure 12). In these areas, water splits largely to the surface and sub-surface (shallow) due to prolonged exposure to the atmosphere (evaporation domain) [28,53,58,59]. Spring water is shifted to the right of the GMWL line (Figure 12). It can be assumed that the heat source remains relatively constant and that the heat flux is related only to the geothermal gradient and the thermal conductivity of the ground crossed. Therefore, the distribution of underground temperature can be considered to be closely related, in parallel with the hydrodynamics of the aquifer system and the variation of the geothermal gradient which is mainly controlled by deep accidents, either a major water level fault of the southern flank of Jebel Meloussi or at the bottom of wadis Leban, which is heavily settled.
7. Conclusions and Recommendations
In the Maknessy region, groundwater is an essential source of drinking water and irrigation. The Maknessy plain in central Tunisia is one of the most important agricultural areas in the country. Geochemical phenomena and hydrogeochemical tools are used in this study to clarify its general functioning and interaction with its environment. In addition, analyses of water samples from the studied aquifer show that total dissolved solids (TDS) are generally high in hydrochemical studies of the waters of the Maknessy multilayer system, which confirms the contact between the free and deep layers. Two categories of groundwater were observed, namely calcium hyper chloride and calcium sulphate, in order to analyze water quality according to chemical factors, such as multivariate PCA and HCA statistics, with hydrochemical data. Statistical methods are used to independently quantify and classify different types of groundwater samples through geological interactions of the groundwater. In addition, these methods show the dissolution of rocks and minerals in the aquifer by alteration and by important factors with less important correlations between cations and anions, such as Cl− and Na+, Cl− and K+, Cl− and Mg2+, Cl− and Ca2+, SO42− and Ca2+, SO42−, and Mg2+. Ion acquisition through rock decomposition by the hydrolysis of minerals and mineralization processes was influenced by anthropogenic activities. Excess salt content is one of the main concerns with water used for irrigation. High salt concentrations in water or soil will negatively affect crop yields, leading to soil degradation and groundwater pollution. In the study area, the salinity is high, reaching 10 mg/l in the southern part of the basin because of over-exploitation in the agricultural field and noise reduction. The combination of the main geochemical elements, stable isotopes (δ18O and δ2H), was used to confirm the chemical processes and factors governing the mineralization of sub-large variations in groundwater chemistry in some areas of the aquifer. If very high salinity water is used (extreme conditions of a water shortage), the soil must be applicable, drainage must be sufficient, there must be a surplus of water to provide a better filter, and crops must be well-selected (relatively resistant to salinity). The use of chemicals must also be reduced and compensated by natural organic elements.
Author Contributions
Z.M. performed field activities and wrote the original draft of the paper; K.W. and N.H. conceived and designed the study; M.H. and Z.D. collected data with the supervision of Y.H. and M.G.; Y.H. and M.G. visualized and revised the manuscript. All authors have read and agreed to the published version of the manuscript.
Funding
This research received no external funding.
Data Availability Statement
We have included all data in the main manuscript file.
Acknowledgments
The authors thank the laboratory of the Regional Commission for Agricultural Development (RCAD) Sidi Bouzid, the Laboratory of the Gabes Institute of Water Science and Technology (ISSTEG), and the Laboratory of Hydrogeology and Geochemistry of the Phosphate Company of Gafsa (CPG). The authors express their grateful thanks to the reviewers and the editor-in-chief for generously contributing their time and expertise to improve the quality of the manuscript.
Conflicts of Interest
The present paper is an original work and the authors declare that they have no conflicts of interest. The authors confirm that they are not associated with or involved in any profitable organization or company that has any financial interest.
References
- Gasmi, M.; Andrieux, P.; Dhia, B.H.; Amri, F. Electric prospection contribution to the hydrogeological study of groundwater in the Mech and South Sned plain groundwater (Central Tunisia). Houille Blanche 2001, 87, 97–111. [Google Scholar] [CrossRef]
- Hamed, Y.; Hadji, R.; Redhaounia, B.; Zighmi, K.; Bâali, F.; El Gayar, A. Climate impact on surface and groundwater in North Africa: A global synthesis of findings and recommendations. Euro-Mediterr. J. Environ. Integr. 2018, 3, 25. [Google Scholar] [CrossRef]
- El Gayar, A.; Hamed, Y. Climate change and water resources management in Arab countries. In Proceedings of the Euro-Mediterranean Conference for Environmental Integration, Sousse, Tunisia, 20–25 November 2017; pp. 89–91. [Google Scholar]
- Chandrasekar, N.; Selvakumar, S.; Srinivas, Y.; John Wilson, J.S.; Simon Peter, T.; Magesh, N.S. Hydrogeochemical assessment of groundwater quality along the coastal aquifers of southern Tamil Nadu, India. Environ. Earth Sci. 2013, 71, 4739–4750. [Google Scholar] [CrossRef]
- Qian, C.; Wu, X.; Mu, W.; Fu, R.; Zhu, G.; Wang, Z.; Wang, D. Hydrogeochemical characterization and of groundwater in an agro-pastoral area, Ordos Basin, NW China. Environ. Earth Sci. 2016, 75, 1356. [Google Scholar] [CrossRef]
- Hamzaoui-Azaza, F.; Tlili-Zrelli, B.; Bouhlila, R.; Gueddari, M. An integrated statistical methods and modeling mineral–water interaction to identifying hydrogeochemical processes in groundwater in Southern Tunisia. Chem. Speciat. Bioavailab. 2013, 25, 165–178. [Google Scholar] [CrossRef]
- Cloutier, V.; Lefebvre, R.; Therrien, R.; Savard, M.M. Multivariate statistical analysis of geochemical data as indicative of the hydro-geochemical evolution of groundwater in a sedimentary rock aquifer system. J. Hydrol. 2008, 353, 294–313. [Google Scholar] [CrossRef]
- Amiri, V.; Nakagawa, K. Using a linear discriminant analysis (LDA)-based nomenclature system and self-organizing maps (SOM) for spatiotemporal assessment of groundwater quality in a coastal aquifer. J. Hydrol 2021, 603, 127082. [Google Scholar] [CrossRef]
- Al-Hmani, A.; Ben Jamaa, N.; Kharroubi, A.; Agoubi, B. Assessment of groundwater in Sana’a Basin aquifers, Yemen, using hydrogeochemical modeling and multivariate statistical analysis. Arab. J. Geosci. 2022, 15, 684. [Google Scholar] [CrossRef]
- Hamed, H.; Awad, S.; Ben Saad, A. Nitrate contamination in groundwater in the Sidi Aïch-Gafsa oases region, Southern Tunisia. Environ. Earth Sci. 2013, 70, 2335–2348. [Google Scholar] [CrossRef]
- Ncibi, K.; Chaar, H.; Hadji, R.; Baccari, N.; Sebei, A.; Khelifi, F.; Abbes, M.; Hamed, Y. A GIS-based statistical model for assessing groundwater susceptibility index in shallow aquifer in Central Tunisia (Sidi Bouzid basin). Arab. J. Geosci. 2020, 13, 98. [Google Scholar] [CrossRef]
- Nematollahi, M.J.; Ebrahimi, P.; Razmara, M.; Ghasemi, A. Hydrogeochemical investigations and groundwater quality assessment of Torbat-Zaveh plain, Khorasan Razavi, Iran. Environ. Monit. Assess. 2016, 188, 2. [Google Scholar] [CrossRef]
- Rajmohan, N.; Elango, L. Identification and evolution of hydrogeochemical processes in the groundwater environment in an area of the Palar and Cheyyar River Basins, Southern India. Environ. Geol. 2004, 46, 47–61. [Google Scholar] [CrossRef]
- AL-Hussein, A.A.M.; Khan, S.; Ncibi, K.; Hamdi, N.; Hamed, Y. Flood Analysis Using HEC-RAS and HEC-HMS: A Case Study of Khazir River (Middle East-Northern Iraq). Water 2022, 14, 3779. [Google Scholar] [CrossRef]
- Mokadem, N.; Demdoum, A.; Hamed, Y.; Bouri, S.; Hadji, R.; Boyce, A.; Laouar, R.; Sâad, S. Hydrogeochemical and stable isotope data of groundwater of a multi-aquifer system: Northern Gafsa basin—Central Tunisia. J. Afr. Earth Sci. 2016, 114, 174–191. [Google Scholar] [CrossRef]
- Chenini, I.; Msaddek, M.H.; Dlala, M. Hydrogeological characterization and aquifer recharge mapping for groundwater resources management using multicriteria analysis and numerical modeling: A case study from Tunisia. J. Afr. Earth Sci. 2019, 154, 59–69. [Google Scholar] [CrossRef]
- Smida, H. Apports des Systèmes d’Informations Géographiques (SIG) pour Une Approche intégrée Dans L’étude et la Gestion des Ressources en Eau des Systèmes Aquifères de la Région de Sidi Bouzid (Tunisie centrale). Ph.D. Thesis, Université de Sfax-Tunisie, Sfax, Tunisia, 2008. [Google Scholar]
- Smida, H.; Dassi, L.; Boukhachem, K.; Masrouhi, A. Satellite remote sensing and GIS-based multi-criteria analysis for the assessment of groundwater potentiality in fractured limestone aquifer: Case study of Maknassy Basin, central Tunisia. J. Afr. Earth Sciences. 2022, 104, 643. [Google Scholar] [CrossRef]
- Hamed, Y.; Ahmadi, R.; Hadji, R.; Mokadem, N.; Ben Dhia, H.; Ali, W. Groundwater evolution of the Continental Intercalaire aquifer of Southern Tunisia and a part of Southern Algeria: Use of geochemical and isotopic indicators. Desalin. Water Treat. 2013, 52, 1990–1996. [Google Scholar] [CrossRef]
- Besser, H.; Hamed, Y. Causes and risk evaluation of oil and brine contamination in the Lower Cretaceous Continental Intercalaire aquifer in the Kebili region of southern Tunisia using chemical fingerprinting techniques. Environ. Pollut. 2019, 253, 412–423. [Google Scholar] [CrossRef] [PubMed]
- Liu, C.W.; Jang, C.S.; Chen, C.P.; Lin, C.N.; Lou, K.L. Characterization of groundwater quality in Kinmen Island using multivariate analysis and geochemical modelling. Hydrol. Process. 2008, 22, 376–383. [Google Scholar] [CrossRef]
- Singh, A.K.; Mondal, G.; Kumar, S.; Singh, T.; Tewary, B.; Sinha, A. Major ion chemistry, weathering processes and water quality assessment in upper catchment of Damodar River basin, India. Environ. Geol. 2008, 54, 745–758. [Google Scholar] [CrossRef]
- Rajmohan, N.; Al-Futaisi, A.; Al-Touqi, S. Geochemical process regulating groundwater quality in a coastal region with complex contamination sources: Barka, Sultanate of Oman. Environ. Earth Sci. 2009, 59, 385–398. [Google Scholar] [CrossRef]
- Tirumalesh, K.; Shivanna, K.; Sriraman, A.; Tyagi, A. Assessment of quality and geochemical processes occurring in groundwaters near central air conditioning plant site in Trombay, Maharashtra, India. Environ. Monit. Assess. 2010, 163, 171–184. [Google Scholar] [CrossRef] [PubMed]
- Rajesh, R.; Brindha, K.; Murugan, R.; Elango, L. Influence of hydrogeochemical processes on temporal changes in groundwater quality in a part of Nalgonda District, Andhra Pradesh, India. Environ. Earth Sci. 2012, 65, 1203–1213. [Google Scholar] [CrossRef]
- Chenini, I.; Ben Mammou, A. Hydrochimie et caractérisation qualitative des ressources en eaux d’un systéme aquifére multicouche en zone aride: Application au bassin de Maknassy (Tunisie centrale). Sécheresse 2009, 20, 217–222. [Google Scholar] [CrossRef]
- Hamed, Y.; Ahmadi, R.; Demdoum, D.; Bouri, S.; Gargouri, I.; Ben Dhia, H.; Al-Gamal, S.; Laouar, R.; Choura, A. Use of geochemical, isotopic, and age tracer data to develop models of groundwater flow: A case study of Gafsa mining basin-Southern Tunisia. J. Afr. Earth Sci. 2014, 100, 428–436. [Google Scholar] [CrossRef]
- Hamed, Y.; Dassi, L.; Ahmadi, R.; Ben Dhia, H. Geochemical and isotopic study of the multilayer aquifer system in the Moulares- Redayef basin, southern Tunisia (Etude géochimique et isotopique du système aquifère multicouche du bassin de Moulares- Redayef, sud tunisien). Hydrol. Sci. J. 2008, 53, 1241–1252. [Google Scholar] [CrossRef]
- Regional Agency of Agricultural Development (CRDA). The Main Characteristics of the Agricultural Sector in Sidi Bouzid; Internal Report; Regional Agency of Agricultural Development: Sidi Bouzid, Tunisia, 2019. [Google Scholar]
- Missaoui, R.; Abdelkarim, B.; Ncibi, K.; Hamed, Y.; Choura, A.; Essalami, L. Assessment of Groundwater Vulnerability to Nitrate Contamination Using an Improved Model in the Regueb Basin, Central Tunisia. Water Air Soil Pollut. 2022, 233, 320. [Google Scholar] [CrossRef]
- Ncibi, K.; Hadji, R.; Hamdi, M.; Mokadem, N.; Abbes, M.; Khelifi, F.; Zighmi, K.; Hamed, Y. Application of the analytic hierarchy process to weight the criteria used to determine the Water Quality Index of groundwater in the northeastern basin of the Sidi Bouzid region, Central Tunisia. Euro-Mediterr. J. Environ. Integr. 2020, 5, 19. [Google Scholar] [CrossRef]
- Ben Haj Ali, M.; Jedoui, Y.; Dali, T.; Ben Salem, H.; Memmi, L. Carte Géologique de la Tunisie 1/500000; Office Nationale des Mines: Tunis, Tunisia, 1985. [Google Scholar]
- Zouaghi, T. Subsurface Distribution of Cretaceous (Aptien-Maastrichtian) Deposition Sequences: Tectonic Deformation Role, Halocienese and Geodynamic Evolution (Atlas of Central Tunisia). Ph.D. Thesis, Tunis El Manar University, Tunis, Tunisia, 2008. [Google Scholar]
- Bouri, S.; Gasmi, M.; Jaouadi, M.; Souissi, I.; Lahlou Mimi, A.; Ben Dhia, H. Integrated study of surface and subsurface data for the prospecting of hydroelectric thermal basins: Case of the Maknassy basin (Central Tunisia). J. Hydrol. Sci. 2007, 52, 1298–1315. [Google Scholar] [CrossRef]
- Zouaghi, T.; Ferhi, I.; Bédir, M.; Ben Youssef, M.; Gasmi, M.; Inoubli, M.H. Analysis of Cretaceous (Aptian) strata in central Tunisia, using 2D seismic data and well logs. J. Afr. Earth Sci. 2011, 61, 38–61. [Google Scholar] [CrossRef]
- Ouda, B. Isotopic Palaeohydrology of the Maknassy Basin (Central Tunisia) during the Quaternary Recent. Ph.D. Thesis, Faculty of Sciences of Tunis, Master of Science Faculty of Sfax, University of Sfax, Sfax, Tunisia, 2000; pp. 121–234. [Google Scholar]
- Piper, A.M. A graphical procedure in the geochemical interpretation of water analysis. Am. Geophys. Union Trans. 1944, 25, 914–928. [Google Scholar] [CrossRef]
- Bakhara, B.; Mahanta, N.; Sahoo, H.K. Interpretation of Groundwater Chemistry using Piper AND Chadha‘s Diagrams: A Comparative Study from Balangir and Puintala Block of Balangir District, Odisha, India. ETIR J. 2019, 6, 35–39. [Google Scholar]
- Ren, X.; Li, P.; He, X.; Su, F.; Elumalai, V. Hydrogeochemical processes affecting groundwater chemistry in the central part of the Guanzhong Basin, China. Arch. Environ. Contam. Toxicol. 2021, 80, 74–91. [Google Scholar] [CrossRef]
- Gibbs, R.J. Mechanisms controlling world water chemistry. Sci. J. 1970, 170, 1088–1090. [Google Scholar] [CrossRef] [PubMed]
- Chebbah, M.; Allia, Z. Geochemistry and hydrogeochemical processes of groundwater in the Souf Valley of low Septentrional Sahara, Algeria. Afr. J. Environ. Sci. Technol. 2015, 9, 261–273. [Google Scholar] [CrossRef]
- Islam, S.M.D.; Majumder, R.K.; Uddin, M.J.; Khalil, M.I.; Alam, M.F. Hydrochemical characteristics and quality assessment of groundwater in Patuakhali district, southern coastal region of Bangladesh. Expo. Health 2017, 9, 43–60. [Google Scholar] [CrossRef]
- Maliki, M.A. Etude Hyrogéologique, Hydrochimique et Isotopique du Systéme Aquifeére de Sfax (Tunisie). Ph.D. Thesis, Tunis II University, Tunis, Tunisia, 2000. [Google Scholar]
- Rana, R.; Ganguly, R.; Gupta, A.K. Indexing method for assessment of pollution potential of leachate from non-engineered landfill sites and its effect on ground water quality. Environ. Monit. Assess. 2018, 190, 46–69. [Google Scholar] [CrossRef]
- SBWMP. Hydrogeochemistry of Sana’a Basin. Sana’a Basin Water Management Project (SBWMP); Final Report; Alderwish Consultants Ltd.: Sana’a, Yemen, 2009. [Google Scholar]
- Kharroubi, A.; Tlahigue, F.; Agoubi, B.; Azri, C.; Bouri, S. Hydrochemical and statistical studies of the groundwater salinization in Mediterranean arid zones, Jerba coastal aquifer in southeast Tunisia. Environ. Earth Sci. 2012, 67, 2089–2100. [Google Scholar] [CrossRef]
- Jmal, I.; Ayed, B.; Boughariou, E.; Allouche, N.; Saidi, S.; Hamdi, M.; Bouri, S. Assessing groundwater vulnerability to nitrate pollution using statistical approaches: A case study of Sidi Bouzid shallow aquifer, Central Tunisia. Arab. J. Geosci. 2017, 10, 364. [Google Scholar] [CrossRef]
- Ncibi, K.; Hadji, R.; Hajji, S.; Besser, H.; Hajlaoui, H.; Hamad, A.; Mokadem, N.; Ben Saad, A.; Hamdi, M.; Hamed, Y. Spatial variation of groundwater vulnerability to nitrate pollution under excessive fertilization using index overlay method in central Tunisia (Sidi Bouzid basin). Irrig. Drain. 2021, 70, 1209–1226. [Google Scholar] [CrossRef]
- Wu, J.; Li, P.; Wang, D.; Ren, X.; Wei, M. Statistical and multivariate statistical techniques to trace the sources and affecting factors of groundwater pollution in a rapidly growing city on the Chinese Loess Plateau. Hum. Ecol. Risk Assess. 2020, 26, 1603–1621. [Google Scholar] [CrossRef]
- Amiri, V.; Nakhaei, M.; Lak, R.; Kholghi, M. Investigating the salinization and freshening processes of coastal groundwater resources in Urmia aquifer, NW Iran. Environ. Monit Assess 2016, 188, 233–256. [Google Scholar] [CrossRef] [PubMed]
- Craig, H. Isotopic variation in meteoric waters. Sciences 1964, 133, 1702–1703. [Google Scholar] [CrossRef] [PubMed]
- Dansgaard, W. Stable isotopes in precipitation. Tellus 1961, 16, 436e468. [Google Scholar]
- Mokadem, N.; Younes, H.; Hfaid, M.; Ben Dhia, H. Hydrogeochemical and Isotope Evidence of Groundwater Evolution in El Guettar Oasis Area, Southwest Tunisia. Carbonates Evaporites. 2015, 30, 417–437. [Google Scholar] [CrossRef]
- Hamed, Y. Stable isotope ratios in meteoric waters in El Kef Region, Northwestern Tunisia: Implications for changes of moisture sources. J. Earth Sci. Clim. Change 2014, 5, 203. [Google Scholar]
- Hamed, Y.; Redhaounia, B.; Sâad, A.; Hadji, R.; Zahri, F.; Zighmi, K. Hydrothermal waters from karst aquifer: Case study of the Trozza basin (Central Tunisia). J. Tethys 2017, 5, 33–44. [Google Scholar]
- Edmunds, W.M.; Guendouz, A.; Mamou, A.; Moulla, A.; Shand, P.; Zouari, K. Groundwater evolution in the Continental Intercalaire aquifer of southern Algeria and Tunisia: Trace element and isotopic indicators. Appl. Geochem. 2003, 18, 805–822. [Google Scholar] [CrossRef]
- Andreoa, B.; Linana, C.; Carrascob, F.; Jiménez de Cisnerosb, C.; Caballerob, F.; Mudryc, J. Influence of rainfall quantity on the isotopic composition (18O and 2H) of water in mountainous areas. Application for groundwater research in the Yunquera-Nieves karst aquifers (S Spain). Appl. Geochem. 2004, 19, 561–574. [Google Scholar] [CrossRef]
- Hamed, Y. The hydrogeochemical characterization of groundwater in Gafsa-Sidi Boubaker region (Southwestern Tunisia). Arab. J. Geosci. 2013, 6, 697–710. [Google Scholar]
- Mokadem, N.; Hamed, Y.; Ben Sâad, A.; Gargouri, I. Atmospheric pollution in North Africa (Ecosystems-Atmosphere interactions): A case study in the mining basin of El Guettar-M’Dilla (Southwestern Tunisia). Arab. J. Geosci. 2012, 7, 2071–2079. [Google Scholar] [CrossRef]


Disclaimer/Publisher’s Note: The statements, opinions and data contained in all publications are solely those of the individual author(s) and contributor(s) and not of MDPI and/or the editor(s). MDPI and/or the editor(s) disclaim responsibility for any injury to people or property resulting from any ideas, methods, instructions or products referred to in the content. |
© 2023 by the authors. Licensee MDPI, Basel, Switzerland. This article is an open access article distributed under the terms and conditions of the Creative Commons Attribution (CC BY) license (https://creativecommons.org/licenses/by/4.0/).