Article

Electrification of Compressor in Steam Cracker Plant: A Path to Reduced Emissions and Optimized Energy Integration

by
Joana Cordeiro Torcato
1,
Rodrigo Silva
2 and
Mário Eusébio
1,*
1
LAQV/REQUIMTE, Department of Chemistry, NOVA School of Science and Technology, NOVA FCT, Universidade NOVA de Lisboa, 2829-516 Caparica, Portugal
2
Repsol Polímeros, S.A., Complexo Petroquímico, Aptd. 41 Monte Feio, 7520-954 Sines, Portugal
*
Author to whom correspondence should be addressed.
ChemEngineering 2025, 9(3), 55; https://doi.org/10.3390/chemengineering9030055
Submission received: 22 March 2025 / Revised: 12 May 2025 / Accepted: 19 May 2025 / Published: 27 May 2025

Abstract

Electrification is a highly effective decarbonization and environmental incentive strategy for the chemical industry. Nevertheless, it may lead to downstream challenges in the process. This study analyzes the consequences of electrifying compressors within the steam cracker (SC) condensate system, focusing on the reduction in greenhouse gas (GHG) emissions and energy consumption without compromising the process’s energy efficiency. The aim is to study the impact that the reduction in steam expanded by turbines has on boiler feedwater (BFW) temperature and, subsequently, the behavior it triggers in fuel gas (FG) consumption and carbon dioxide (CO2) emissions in furnaces. It was concluded that condensate imports from the Energies and Utilities Plant (E&U) would increase by a factor of four, with approximately 60% of the imported condensate being cold condensate. The study revealed a mitigation of CO2 emissions, resulting in a 1.3% reduction and a reduction in FG consumption of 1.8% preventing an increase in site energy consumption by 795.4 kW in furnaces. Condenser optimization reduces CO2 emissions by 60%. Energy integration with quench water resulted in heat saving of 1824 kW in hot utility consumption and generating annual savings of EUR 2.3 M. The global carbon dioxide balance can achieve up to a 25% reduction.

1. Introduction

1.1. Steam Cracker: The Key to Ethylene Production

Ethylene is a high valuable chemical (HVC) intermediate in the petrochemical and chemical process industries (CPIs), owing to its diverse applications as a feedstock and its contribution to a more robust market. Its value is further enhanced through downstream processing into end products such as polyethylene, ethylene dichloride, ethylene oxide, ethylbenzene, and vinyl acetate [1]. The era of large-scale ethylene plants began in the 1970s, with standard plant sizes reaching 300–400 kt/y. Since then, typical plant capacity has continuously increased to over 1 Mt/y [2]. The global ethylene market is projected to reach 406.5 million tonnes by 2030, with continued growth anticipated at a compound annual growth rate of 3.6% between 2023 and 2030 [3]. The associated global polyethylene market is expected to increase 9.6% by 2032.
Steam cracker (SC) is a complex facility integral to the heart of petrochemical complexes. This unit is responsible for ethylene production from hydrocarbon feedstocks, predominantly naphtha. In this case study, the furnace’s design specifications are configured for liquid feedstock. If naphtha is used, it undergoes preheating prior to entering the furnaces. SC process can be described by five fundamental stages: pyrolysis, Primary Fractionation, compression, Caustic Treatment, and fractionation (see Figure 1).
The feedstock is fed into the furnace, where it is preheated with combustion gases in the convection zone. In the radiant coil, the carbon–hydrogen bonds are broken, initiating the pyrolysis process. A key feature of the SC is the injection of dilution steam into the feedstock. The steam acts as a catalytic agent, reducing the hydrocarbon partial pressure and thus suppressing coke deposition through gasification reactions [4]. The operating conditions within the furnace include high temperatures (800–850 °C), short residence times (0.1–0.5 s), and low partial pressures (0.3–1 kg steam/kg hydrocarbons [5]). The economizer, situated within the convective section of the furnace, serves to preheat the boiler feedwater, which constitutes the primary focus of this article.
Primary Fractionation enables the separation of heavier compounds, such as pyrolysis fuel oil. The compression stage prepares the cracked gas for the cryogenic separation section, allowing it to reach pressures up to 35 bars while maintaining temperatures below 100 °C [6]. The Caustic Treatment, integrated into the compression stage, promotes the removal of acid gases such as H2S and CO2 by contacting the gas stream with an alkaline solution, such as caustic soda [2].
Fractionation is based on cryogenic separation, and it is the predominant method for cracked-gas separation. The byproducts of this section include methane and hydrogen, which constitute fuel gas, value-added products such as ethylene and propylene, C4 fractions, and ethane and propane used as fuel in the furnaces.

1.2. Decarbonization: Key Technologies in Steam Cracker Plants

Steam cracking is the most energy-demanding process in the petrochemical industry, consuming around 2.8 EJ, where EJ is Exajoule (1018 Joule), globally (excluding feedstock) [7] and accounting for approximately 8% of the sector’s total primary energy use [8].
According to energy intensity data, the most energy-intensive zone, in naphtha-based steam cracking, is the cracking furnace (6.5 GJ/t HVC), followed by cryogenic separation (2 GJ/t HVC) and fractionation and compression (1.5 GJ/t HVC). To meet the thermodynamic, endothermic cracking reactions, and utility demands of the steam cracking process, fuel gas (FG) is predominantly used (it consists of methane and hydrogen, byproducts of the process). The combustion of these fuels generates large quantities of CO2 emissions. This process emits around 180–200 Mt/y of CO2, and energy prices account for about 70% of the net product cost of an olefin process [8,9]. The literature suggests a ratio of 1.8 to 2 tonnes of CO2 emitted per tonne of ethylene produced. It is important to note that the HVC production depends on the feedstock, severity, and residence time. An average yield of 30% is estimated for naphtha-based operation with low residence times and high severity.
Greenhouse gas emissions are a major bottleneck in the petrochemical industry. Ethylene production stands among the top three CO2 emitters in the CPI, with studies indicating that worldwide CO2 emissions from steam crackers could increase by 33%, from 198.9 million mt/y to 264 million mt/y [10]. Therefore, it is increasingly urgent to invest in technologies that enable decarbonization, energy integration, and a reduction in the industry’s ecological footprint in order to reduce CO2 global emissions according to European commission plan [11].
Cross-cutting decarbonization methodologies include electrification, energy transition, process integration, and renewable energy integration. Studies indicate that the most effective way to reduce greenhouse gas (GHG) emissions is to improve energy efficiency by reducing heat loss and recovering enthalpy from the process, and previous studies have reported that implementing low-cost measures could reduce 10–30% of GHG emissions [12,13]. The principle of energy consumption conservation lies in either reducing energy waste or increasing the production rate per unit of energy used [13].
While the electrification of cracking furnaces is a prominent area of focus within the broader themes of decarbonization, sustainability, and steam cracker plants, a wide range of methodologies contribute to the reduction in CO2 emissions. The following technologies are applied in steam cracker plants to promote decarbonization with significant CO2 reductions [14]: The utilization of hydrogen derived from reforming processes reduces CO2 emissions by 65–85%, while hydrogen produced via electrolysis offers emission reductions of up to 70%. However, the efficacy of this technology is contingent upon the environmental impact of the electricity generation source. Electric furnaces demonstrate emission reductions exceeding 90%, and prominent licensors such as Linde, SABIC, BASF, and Technip Energies have developed such technologies [15]. Carbon capture and storage (CCS) can achieve emission reductions of 90–95%. Energy integration strategies offer a wide range of potential CO2 reductions, from 13 to 95%. Finally, equipment electrification contributes to emission reductions ranging from 10 to 25%. This article will focus primarily on electrification through the adoption of electric motors and process integration.

1.2.1. Electrification: A Greener Energy

Electrification is a step closer to achieving the emissions goals set during the Paris Agreement. Electrification is an asset because it does the following:
  • Reduces the use of fossil fuels in end-use sectors;
  • Has higher efficiency of electric solutions compared to conventional technologies, which allows for a reduction in total energy demand.
Electric motors are generally responsible for about two-thirds of industrial power consumption in each nation [13,16]. It is imperative to adopt strategies that contribute to increasing the efficiency of motorized equipment and participate in reducing associated heat emissions. Some methods that allow for energy saving are classified as follows:
  • Application of Technology: Variable Frequency Drives (VFDs) and improving the power factor [17];
  • Energy Audit: monitor energy consumption and reduce waste [18].
However, most refiners opt to maintain their existing steam cracker configuration, implementing energy optimization and carbon reduction strategies without significant alterations to hardware and infrastructure, rather than undertaking substantial process or equipment redesign. This article holds relevance across steam cracker plants equipped with steam-driven turbines, as it facilitates the evaluation of alterations within the condensate network to preserve process efficiency and implement energy integration. In this case study, two steam cracker compressors were electrified. As these compressors were driven by steam turbines, this will contribute to excess steam in the system, which is subsequently used to generate electricity. Within this framework, process optimization, integration, and transformation are key considerations.

1.2.2. Process Integration: Pinch Analysis

Process integration is defined as a holistic approach to design and operation that emphasizes the unity of the process (Encyclopedia of Sustainable Technologies, 2017) [19]. It is a systematic approach used in the optimization of production processes, with a view to appropriate intra- and inter-process articulation that allows for reduction in production costs, energy ratio, and raw materials.
Pinch technology is a comprehensive method that was developed by Bodo Linnhoff and his collaborators (Linnhoff et al., 1982) [20]. It originally emerged as an approach to achieving maximum heat recovery from the heat exchanger network (HEN) [20] and its optimal design (Hohmann, 1971) [21]. In this method, utility targets are identified based on thermodynamic principles [20,22]. Pinch analysis has been employed in various studies as a methodology for resource mitigation, such as targeting and design of water networks [23], refinery hydrogen distribution system [24], targeting of cracker plant [25], and energy saving for a petrochemical cluster [26].
Pinch analysis has become a prominent methodology integrated into the toolkit for carbon emission reduction within the industry. The central concept involves reducing carbon emissions through the optimal integration of heat and renewable energy resources across a total site [27]. However, other tools exist within this toolkit: Tan and Foo [28] developed a methodology using a carbon emissions planning approach specifically within the power sector; Wong et al. [29] represented CO2 levels over a finite time period based on CO2 emission limits; and Klemes et al. [30] proposed a methodology for reducing energy demands and emissions across multiple sites by focusing on heat integration. Furthermore, Varbanov and Klemes [31] demonstrated that by optimizing energy demands and local generation capacities within a given area and efficiently integrating renewable sources into the total site’s combined heat and power system, this approach reduces both waste heat and carbon footprint. More recently, in 2012, Munir et al. developed the Carbon Management Hierarchy [27], which is structured as a pyramid of priorities designed to avoid CO2 emissions.

1.3. Condensate System

The recovered condensate, expanded from turbines, circulates in the condensate system integrated into the plant. There are obvious advantages to its recovery, including the following [32]:
  • Lower fuel costs: boiler fuel needs can be potentially reduced from 10% to 20% by economically recovering hot condensate;
  • Safety and environmental benefits: lower boiler fuel consumption means lower CO2, NOx, and SOx emissions, reducing air pollution.
Figure 2 shows a system for reusing condensate to produce boiler feedwater (BFW). Expanded steam from the turbines, not utilized by the plant’s customers, is cooled and condensed within the condenser, forming the condensate system. Due to the potential for contamination from other water sources feeding into the condensate system, regular sampling and analysis of condensate water quality are essential. Furthermore, the condensate typically exhibits elevated levels of dissolved oxygen, which are mechanically removed in the deaerator, an equipment responsible for removing dissolved gases from the water to prevent corrosion and equipment wear, resulting in BFW [33,34]. Within the deaerator, low-pressure (LP) steam injection can be introduced at the base of the deaerator head, flowing counter-current to the water flow, or via side injection in a cross-flow configuration. The primary objective, irrespective of the injection method, is to maximize agitation and interfacial contact between the steam and water to achieve the target water temperature [35].

1.4. Defining the Problem: Scenarios and Consequences Post-Electrification

This case study focuses on near-zero emissions strategies to drive decarbonization of the steam cracker. In this context, an electrification project for the ethylene and propylene compressors has been implemented, aiming to be at the forefront of decarbonization, reducing its CO2 emissions to align with the Paris Agreement’s commitment to achieving carbon neutrality by 2050.
While the electrification of compressors represents a significant technological and process advancement, the decommissioning of two backpressure turbines contributes to a reduction in condensate circulating within the cracker’s BFW network. Consequently, condensate compensation and BFW replenishment are achieved through the import of cold condensates from the Energies and Utilities Plant. This imported condensate is introduced upstream of the deaerator.
The problem addressed in this case study centers on the importation of condensate at a lower temperature than the steam cracker BFW system temperature. This energy differential gives rise to three considerable impacts on downstream system variables.

1.4.1. Deaerator Inefficiency

The imported cold condensate stream will lead to a reduction in the deaerator inlet temperature. As the deaerator’s operation is directed by Henry’s Law, the lower the inlet temperature, the more soluble the gas will be in the liquid, and in turn, the greater the difficulty in removing dissolved gases from the water.

1.4.2. Increased LP Steam Consumption

Given the deaerator’s inefficiency and assuming no changes to the equipment’s mechanical design, the quantity of LP steam used for gas stripping will be greater. The fact that LP steam is used in greater quantity also contributes, through direct contact and indirectly, to an increase in the temperature of the cold condensate.
If the plant’s utility consumption is to remain constant (i.e., increased LP steam consumption in the deaerator is not an option), the risk of gas contamination becomes a real concern. The presence of O2 promotes the formation of hematite, which directly causes pitting corrosion [36]. Downstream of the furnace, the BFW fed to the transfer line heat exchangers, responsible for high-pressure (HP) steam production, may contain impurities that can damage the turbine blades [37] driving the main compressor.

1.4.3. Increased Fuel Gas Consumption in Furnaces

The temperature of the BFW fed to the furnace economizer must be regulated by controlling the amount of fuel supplied to the furnace. Software tools are available to predict the amount of fuel gas to be used in order to control the coil outlet temperature at the furnace outlet and the HP steam temperature (e.g., SPYRO).
The main issue is the lower estimated temperature at which the BFW feeds the furnaces, necessitating a higher fuel gas consumption to achieve the desired outlet temperatures. The most severe impacts of these problems include increased carbon dioxide emissions, since both—steam production and increased heat in the furnace’s convection zone—rely on the burning of fossil fuels.
The objective of this paper is to preheat the imported cold condensate stream through energy integration techniques, thereby avoiding the utilization of external utilities. This solution mitigates the consequences of electrification, such as deaerator inefficiency and increased fuel consumption in the furnaces. Notwithstanding the viability and commendability of electrification as a renewable energy source, as addressed in Section 1.3, the requisite process adaptation and the consequential impact stemming from the diminished expanded steam from the turbines, with particular regard to the BFW circuit, necessitate thorough study and analysis.

2. Materials and Methods

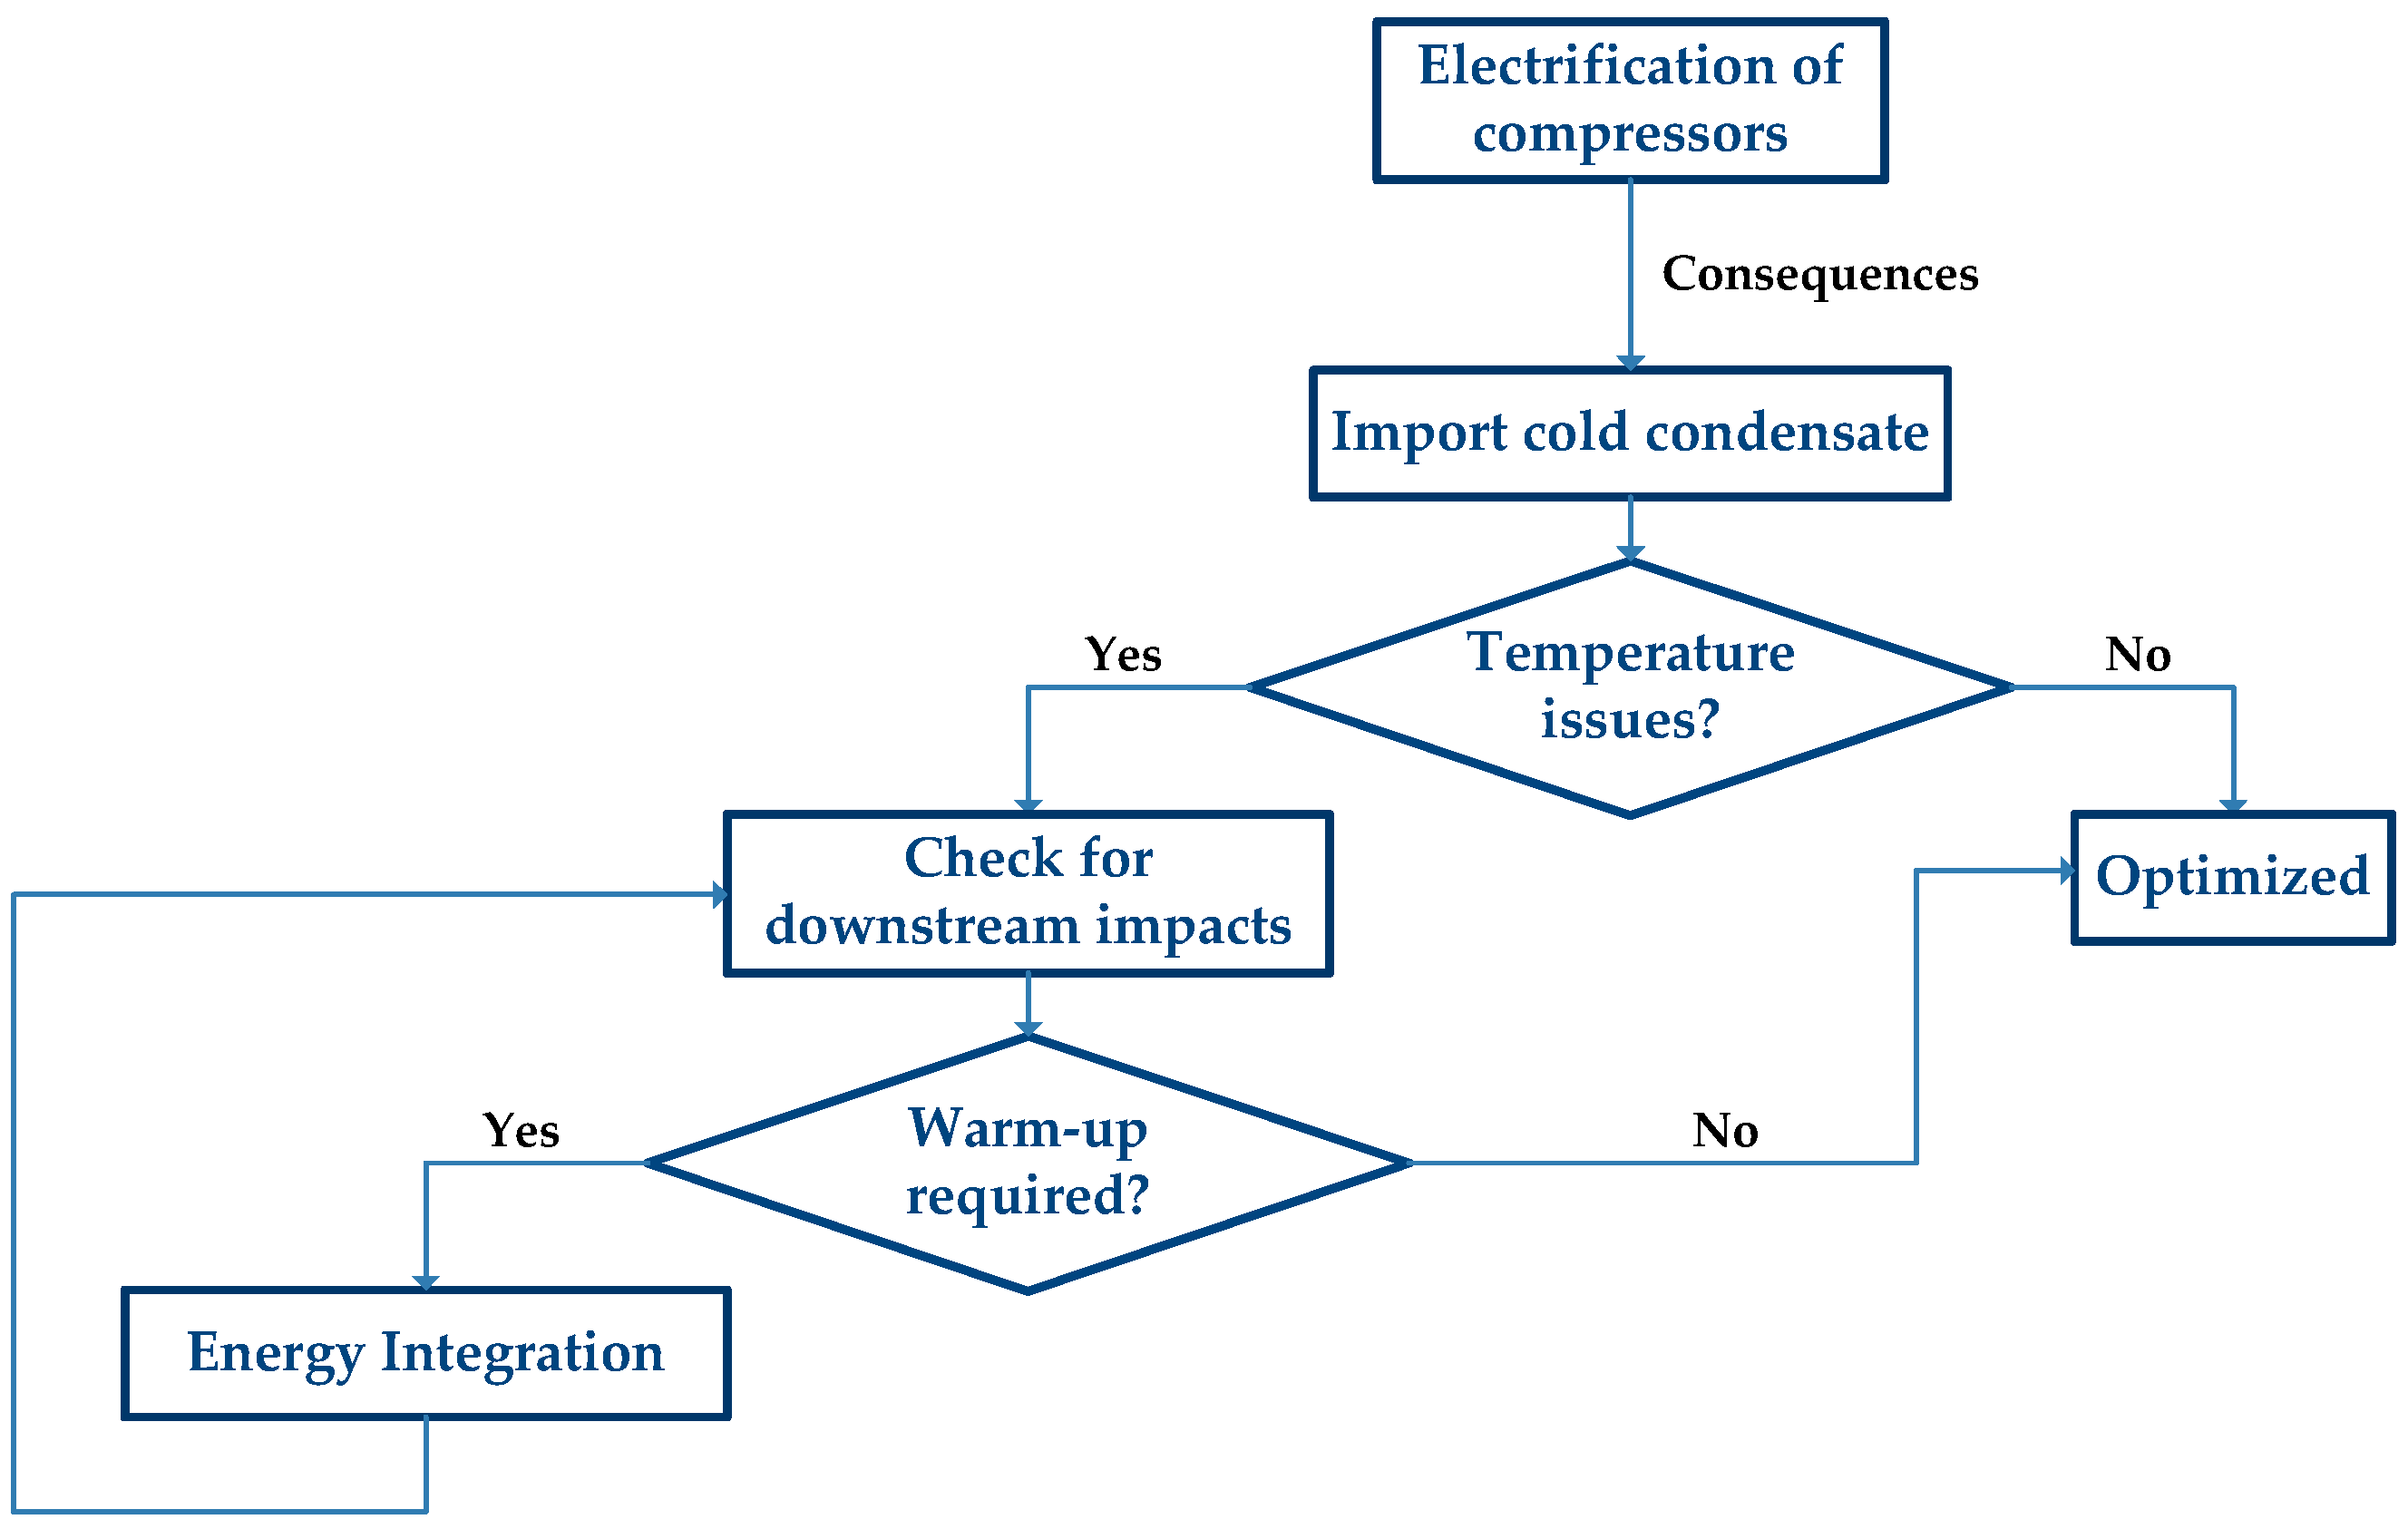
The case study was conducted following a series of discrete steps, which are grouped into larger stages (see Figure 3).
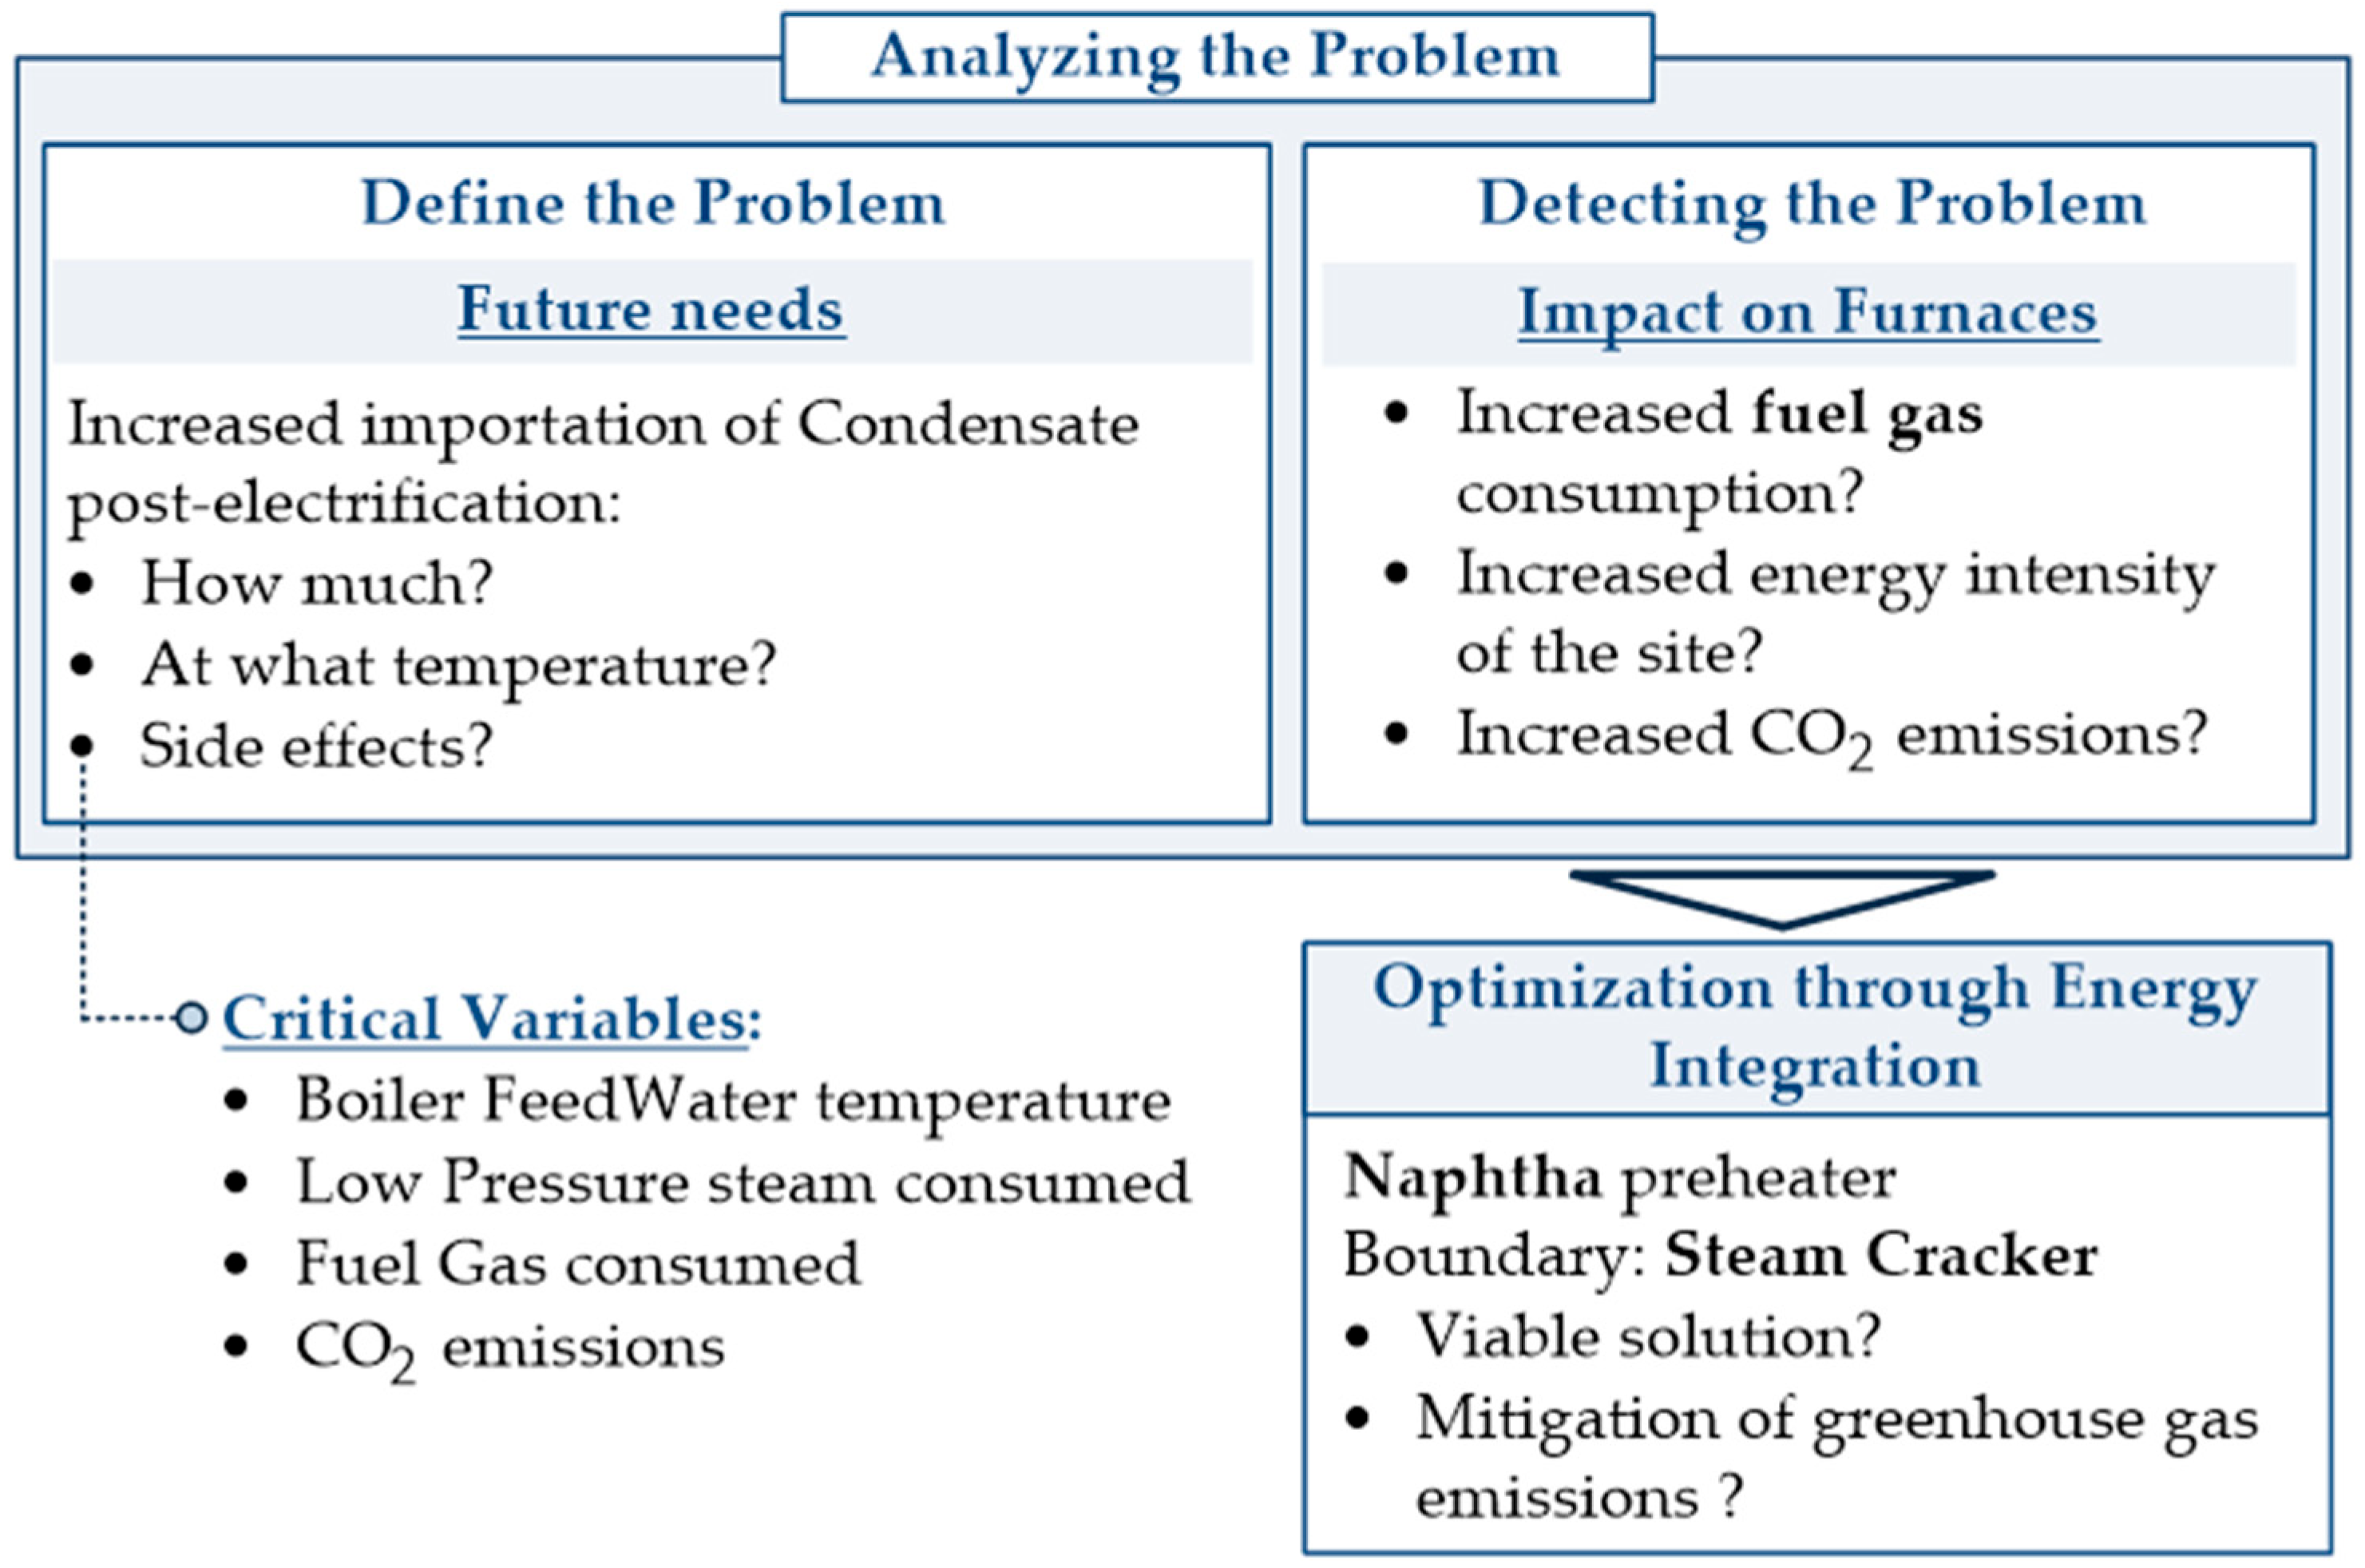
The problem analysis was delineated into problem definition and problem detection, as illustrated in Figure 4. Problem definition pertains to the perception of the impact that electrification will realize. Problem detection refers to the identification of the root cause intended to be rectified through improvement actions. Within this parameter, energy integration is incorporated, aiming to correct potential deviations from the normal process.
For the development of this study, Aspen Hysys® V11 software was employed to simulate the steam cracker’s BFW system before and after electrification (see 
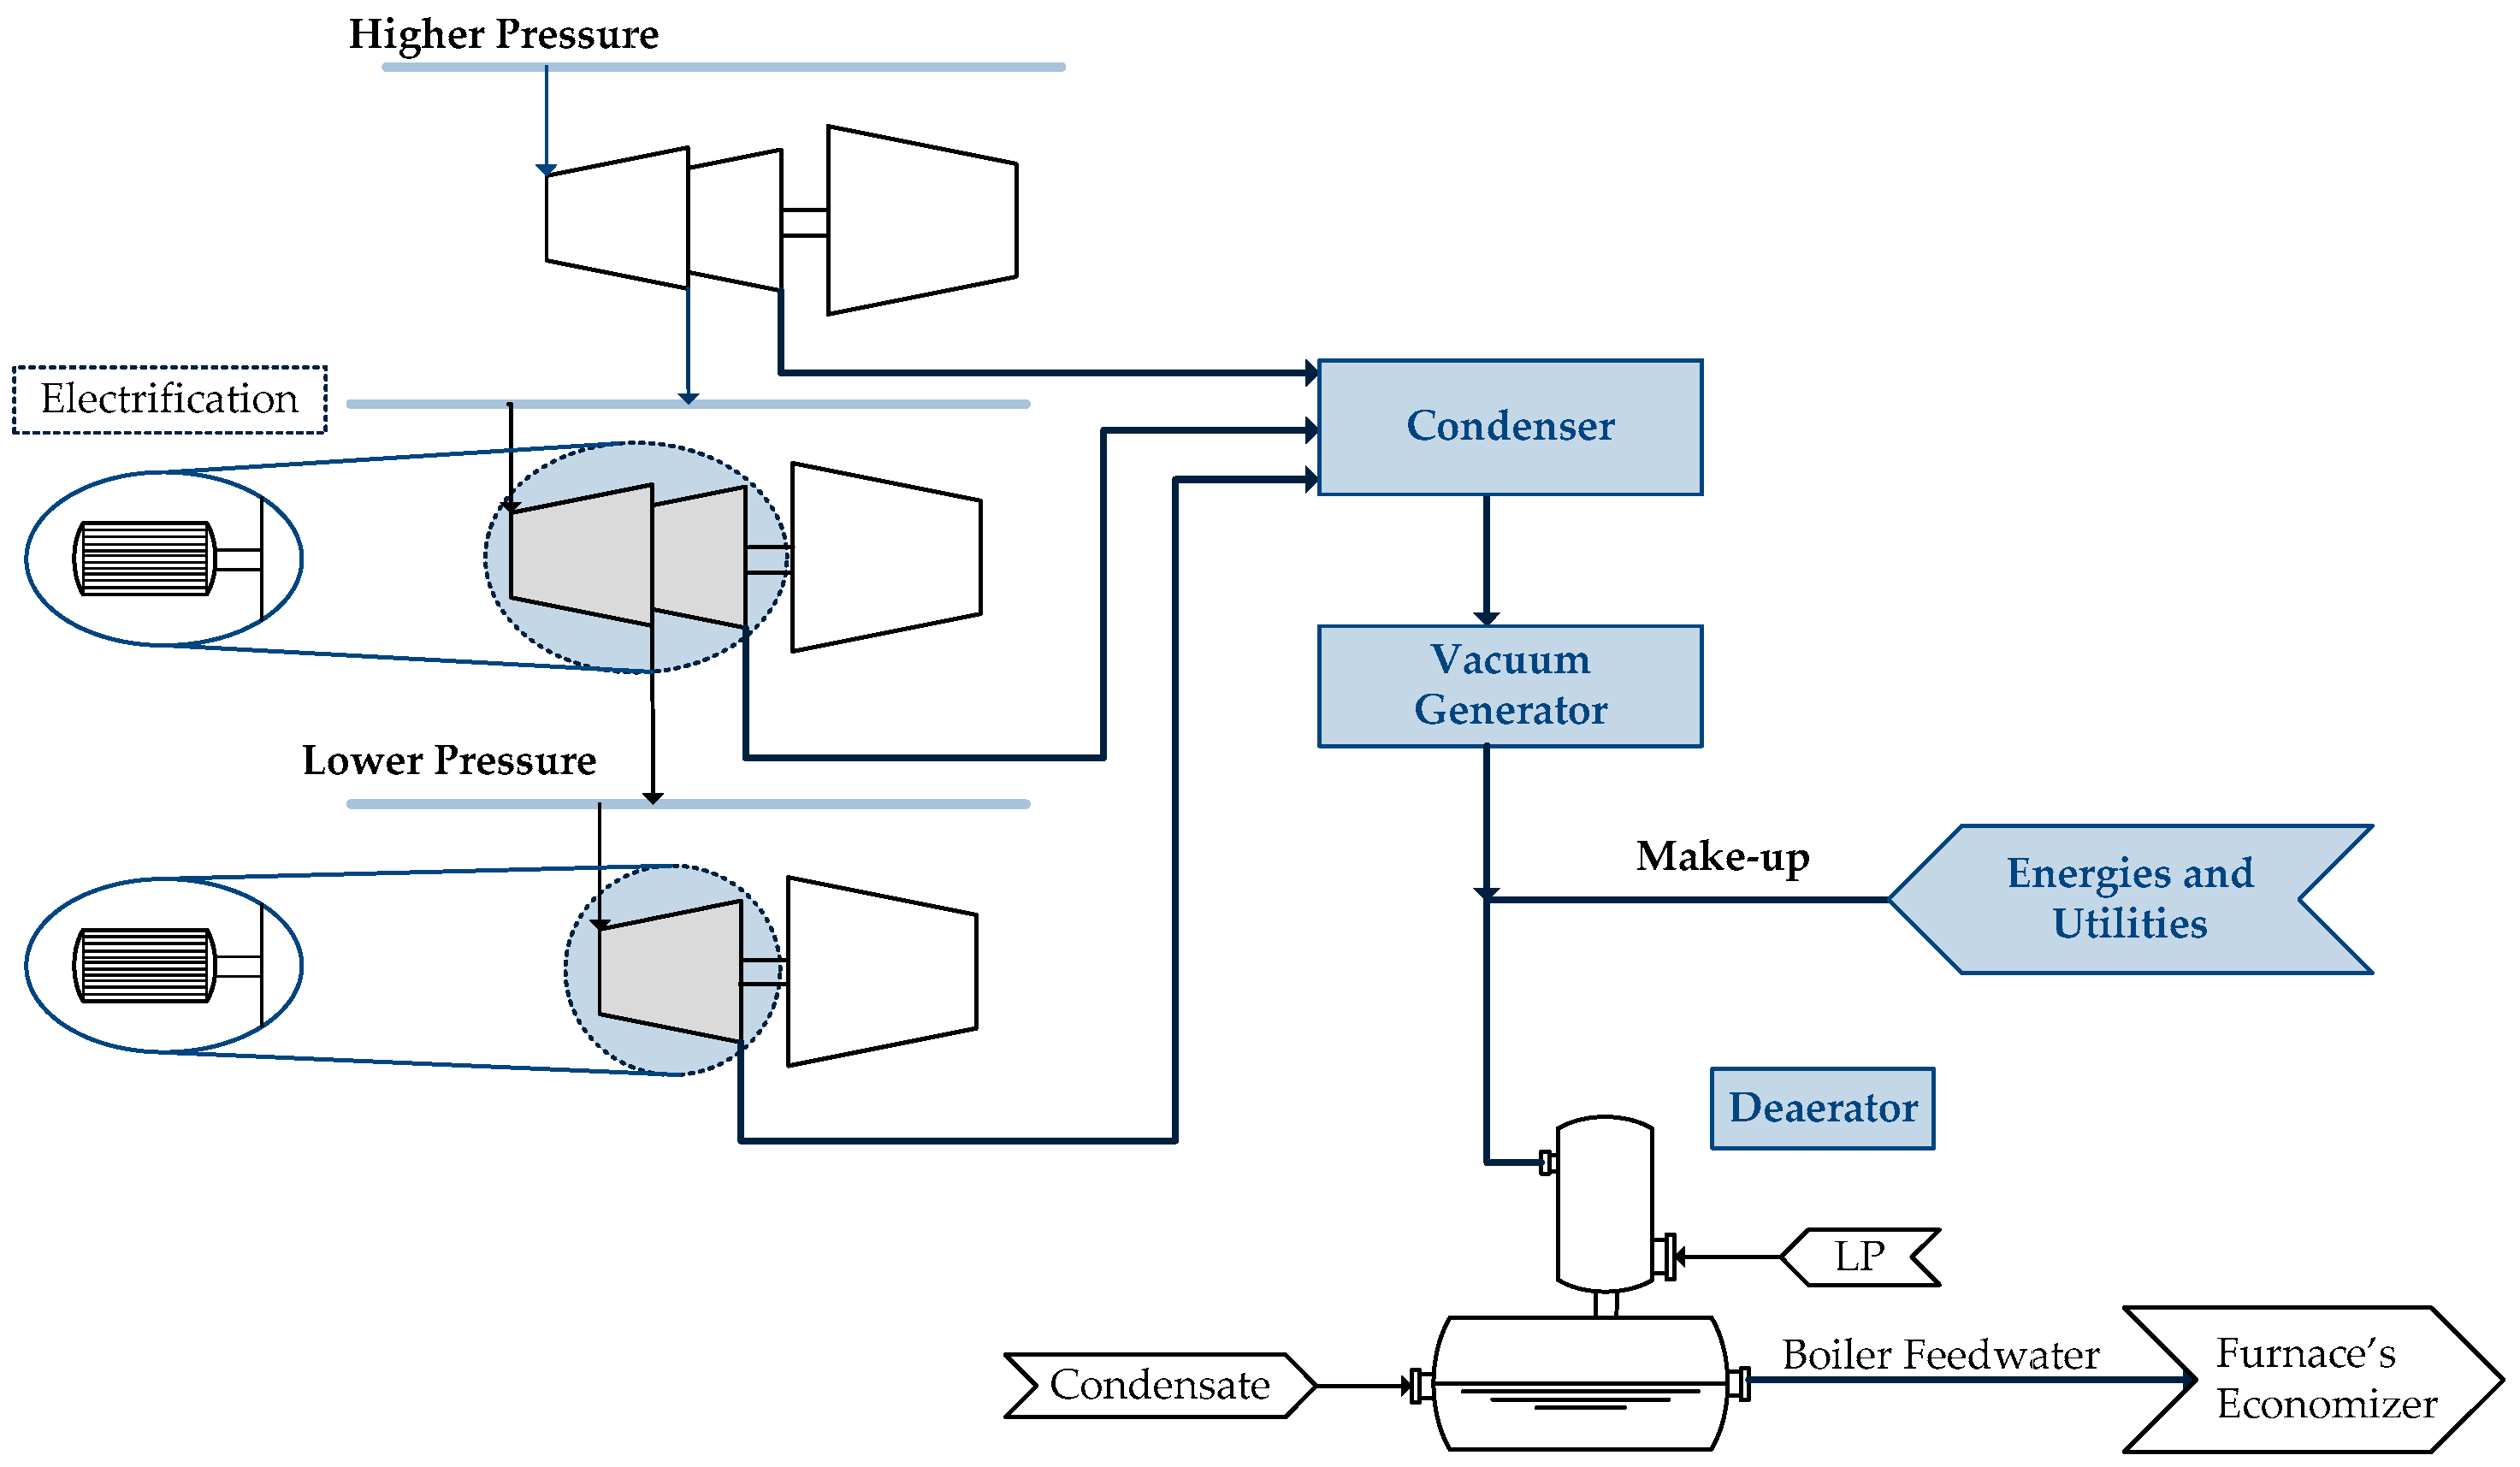
Table 1). The simulation of the steam cracker’s condensate network, prior to electrification, was conducted utilizing equipment specification data (illustrated in Figure 2) and design conditions. Its validation was performed using actual operational values provided by the plant.
For the development of the simulation, only water was included as a component. Subsequently, the ASME Steam property package was employed, given its basis in the ASME 1967 steam tables. The associated limitation is the absence of inert gases or air in the simulation, as their presence can alter heat transfer within the air cooler, consequently reducing its efficiency. Operation was conducted under steady-state conditions, and energy loss in the piping was considered negligible, although certain equipment, such as the deaerator, would benefit from a more detailed analysis under transient conditions.
In terms of equipment mechanics, an air cooler was utilized as the condenser, chosen for its efficient heat exchange facilitated by its fin design and twelve fans. The number of fans can be adjusted according to the heat transfer requirements. Each fan has two operational modes: high and low power. In the post-electrification scenario, the air cooler exhibits oversizing due to the condensate flow rate, necessitating cooling being reduced by a factor of 2.3. As a consequence, it became feasible to optimize the air cooler through iterative adjustments to the quantity of operational fans and their respective power output. The optimization of the air cooler was effectuated through iterative modifications to the number of operational fans and their corresponding power output (high or low). Ergo, the indirect correlation between the air cooler’s operational capability and the energy expenditure of the fans was leveraged. Consequently, it was posited that the electrical energy expenditure (relative to the power output echelon of each fan) was commensurate with indirect carbon dioxide emissions. These emissions are classified under Scope 2 of CO2 emissions—encompassing purchased electricity for proprietary utilization. The inherent constraints within the air cooler simulation, when employing the rudimentary design functionalities of Aspen Hysys® V11, are attributable to the ambiguity surrounding the fan blade pitch, the recirculation of thermally elevated air returning to the intake flow, which consequently impairs operational efficacy, the ambient wind speed, and the precise arrangement of fans intended for activation at each designated power output stratum.
The first critical variable evaluated (see Figure 4) was the BFW temperature. The thermal analysis of the BFW was conducted to forestall an escalation in fuel gas consumption within the furnaces. To this end, an energy balance calculation (see Equation (1)) was employed to ascertain the BFW temperature at the deaerator outlet under conditions where the imported cold condensate stream is not heated and no additional steam is consumed in the deaerator.
m C v d T d t = m ˙ i n H ^ i n m ˙ o u t H ^ o u t + Q ˙ W ˙
where m is flow rate (kg/h), C v is the specific heat isochoric (kcal/kg°C), T is temperature (°C), t is time (h), H ^ i n and H ^ o u t specify enthalpy (kcal/kg), Q ˙ is heat transferred (kcal/h), and W ˙ is work (kcal/h).
However, the main limitation of this programming model lies in the assumption of steady state (i.e., transient operation was not considered), according to Equation (2). The reference state considered was 25 °C, 1 atm, and water in the liquid state.
m C v d T d t = 0
SPYRO suit 7 software was utilized to quantify two supplementary critical variables: the excess fuel gas consumed by the furnace as well as the resultant carbon dioxide emissions. The purpose of Table 2 is to evaluate the CO2 emissions typically emitted by a furnace, considering the combustion of fuel gas. The advantage of fuel gas lies in the fact that it uses a percentage of hydrogen (approx. 10–20%), which reduces CO2 emissions. According to Chemical Reaction 3, the estimated ratio of CO2 emissions per fuel gas consumed is 2.5.
Fuel   Gas + 1.78   O 2 ( g )   0.85   C O 2 ( g ) + 1.85   H 2 O   ( v )
To counteract the increased use of fossil fuels and the emission of greenhouse gases into the atmosphere, an energy analysis of the hot section of the steam cracker was conducted.
Initially, the SC unit was designed to consume only naphtha as a raw material. With industrial evolution, the furnaces were adapted to receive different raw materials, such as ethane and propane, as they have a higher yield in the cracking reaction for the production of ethylene and propylene [38]. The amount of naphtha for cracking and co-cracking was moderated, and consequently, the preheating system was out of service most of the time. The repurposing of the idled heat exchanger was studied in this article.
The bottom of the Water Quench (see Figure 1) is rich in quench water. Quench water is a process stream that inherently carries substantial energy due to its high flow rate. This stream is commonly utilized in steam crackers to preheat process stages, typically through process energy integration to recover the heat present in the quench water.
One of the streams preheated with quench water is the furnace-fed naphtha. However, this preheating system was designed for an exclusive naphtha feed scenario; therefore, this exchanger will be utilized to preheat the condensate streams. For this proposal, it was considered that the naphtha is fully preheated with the quench oil removed in the primary fraction. The heat exchanger was designed to work with quench water in the shell, while the dirtier fluid, naphtha, remains inside the tubes. In this case, it is proposed to replace the passage of naphtha with the condensate stream in the exchanger tubes.
The tool used was AspenEDR® V11, as it allows for detailed equipment specification, approximating real-world operating conditions and resulting in more accurate and robust results. The ASME Steam property package was used, as the two fluids involved are again water. In this case, the characteristics of an existing heat exchanger were utilized. According to Tubular Exchangers Manufacturing Association standards, the heat exchanger type is a horizontal AES (removable bundle, internal split ring floating head) [39].
Finally, economic analysis was conducted to forecast the project’s cost estimates. The global carbon dioxide emission balance is observed post-electrification and after the implementation of the present study’s improvement proposal.

3. Results and Discussion

3.1. Validation of the Steam Cracker Condensate Network

The validation of the steam cracker plant’s condensate network was executed for the pre-electrification scenario. Therefore, after network calibration, it becomes practicable to extrapolate the simulation to the post-electrification scenario. However, due to a confidentiality agreement, the precise operational values of the plant cannot be divulged. Notwithstanding this limitation, the simulation demonstrates a maximum error of 17%.
The BFW flow rate at the deaerator outlet has an error of 13% compared to the data sheet, resulting in a deviation of 25 t/h. This is primarily due to variations in condensate consumption by customers and condensate export. It was assessed that the most critical scenarios, exhibiting a relative error exceeding 10%, do not significantly impact the inlet temperature of the deaerator. Emphasizing the most critical scenarios, a 12% variation in the air cooler outlet temperature corresponds to a 9% variation in the vacuum generator outlet temperature, and a 15% variation in the vacuum generator outlet flow rate only impacts its outlet temperature by 2%.
Inasmuch as the computed relative error is diminished for parameters encompassing flow rate, temperature, and energy, it is posited that the simulation furnishes a propitious approximation of empirical reality and may be employed for the prognostication of prospective scenarios. Considering the utilization of an extant steam cracker facility operating under actual process conditions, the calibration of the simulation and the intrinsic mathematical framework of AspenTech’s suite were meticulously developed to closely approximate real-world behavior, thus substantiating the reliability of the derived results.

3.2. Effects of Reduced Condensate Post-Electrification

The simulation outcomes pertaining to the SC plant’s condensate network are presented in the form of ratios (pre-/post-electrification), with the objective of facilitating a more readily discernible comparison regarding the impact that the electrification of the compressors shall exert upon the BFW network. Table 3 delineates the results expressed as a ratio comparing pre-electrification and post-electrification. Heat transferred by the condenser is significantly greater pre-electrification due to the vacuum expansion of the three turbines (which reduced the expansion by a factor of 2.30). The simulation of the condensate system concluded that condensate imports from the Energies and Utilities Plant (E&U) would increase by a factor of four, with approximately 60% of the imported condensate being cold condensate, relative to operational data. Furthermore, the energy balance revealed discrepancies in the BFW temperature at both the deaerator inlet and outlet, compared to the current operating data.
The temperature at the deaerator inlet and outlet are, approximately, 30% and 15%, respectively, higher before compressor electrification in the steam cracker. This temperature decrease will impact the BFW preheating stage at the furnace economizer level. Section 3.4 studies the furnace process adaptations and their environmental impacts.

3.3. Condenser Optimization in Steam Cracker’s BFW System

Subsequent to the findings presented in Section 3.2, the ratio of the condensate flow rate pre- and post-electrification undergoes diminution by a factor of 2.30. This consequential curtailment in the condensate supplied to the BFW network correspondingly mitigates the imperative for efficacious energy transfer across the air cooler.
As meticulously elucidated within Section 2, the parameters susceptible to alteration comprised the aggregate of operational fans and their corresponding power output echelon. This resultant finding engendered the understanding that, contingent upon a diminished quantity of fans in service, the electrical energy expenditure is attenuated, a condition likewise observed with a lower power output echelon. The mean emission coefficient of carbon dioxide per unit of electrical energy expenditure within a designated geographical area was subjected to scrutiny. This coefficient facilitates the transformation between the curtailment in electrical energy consumption subsequent to electrification and the consequent indirect carbon dioxide emissions.
Table 4 illustrates a significant 60% decrease in carbon dioxide emissions when contrasting the air cooler dimensions prior to and subsequent to electrification. Post-electrification, the implementation of an optimized air cooler design facilitates a reduction in electrical energy requirements and, as a result, diminishes indirect CO2 emissions. This ecological assessment elucidates a substantial incremental benefit within the carbon dioxide abatement trajectory, grounded upon the principles of Scope 2 emissions.
In this case, as the flow rate received by the condenser significantly reduces by half post-electrification, it is anticipated that the requirement for the number of fans will decrease as well as the electrical energy consumed for fan rotation. This scenario demonstrates an additional advantage to the electrification project, since an indirect reduction in CO2 emissions is expected due to lower energy consumption by the power plant.
In a broader context, the extent of steam expansion through the turbines will diminish proportionally to the quantity of electrified compressors. Nevertheless, the analysis concludes that a recalibration of the condenser within the boiler feedwater circuit is imperative, with the feasibility of parameter adjustments contingent upon the specific utility utilized (e.g., air, cooling water, process water).

3.4. Decarbonization

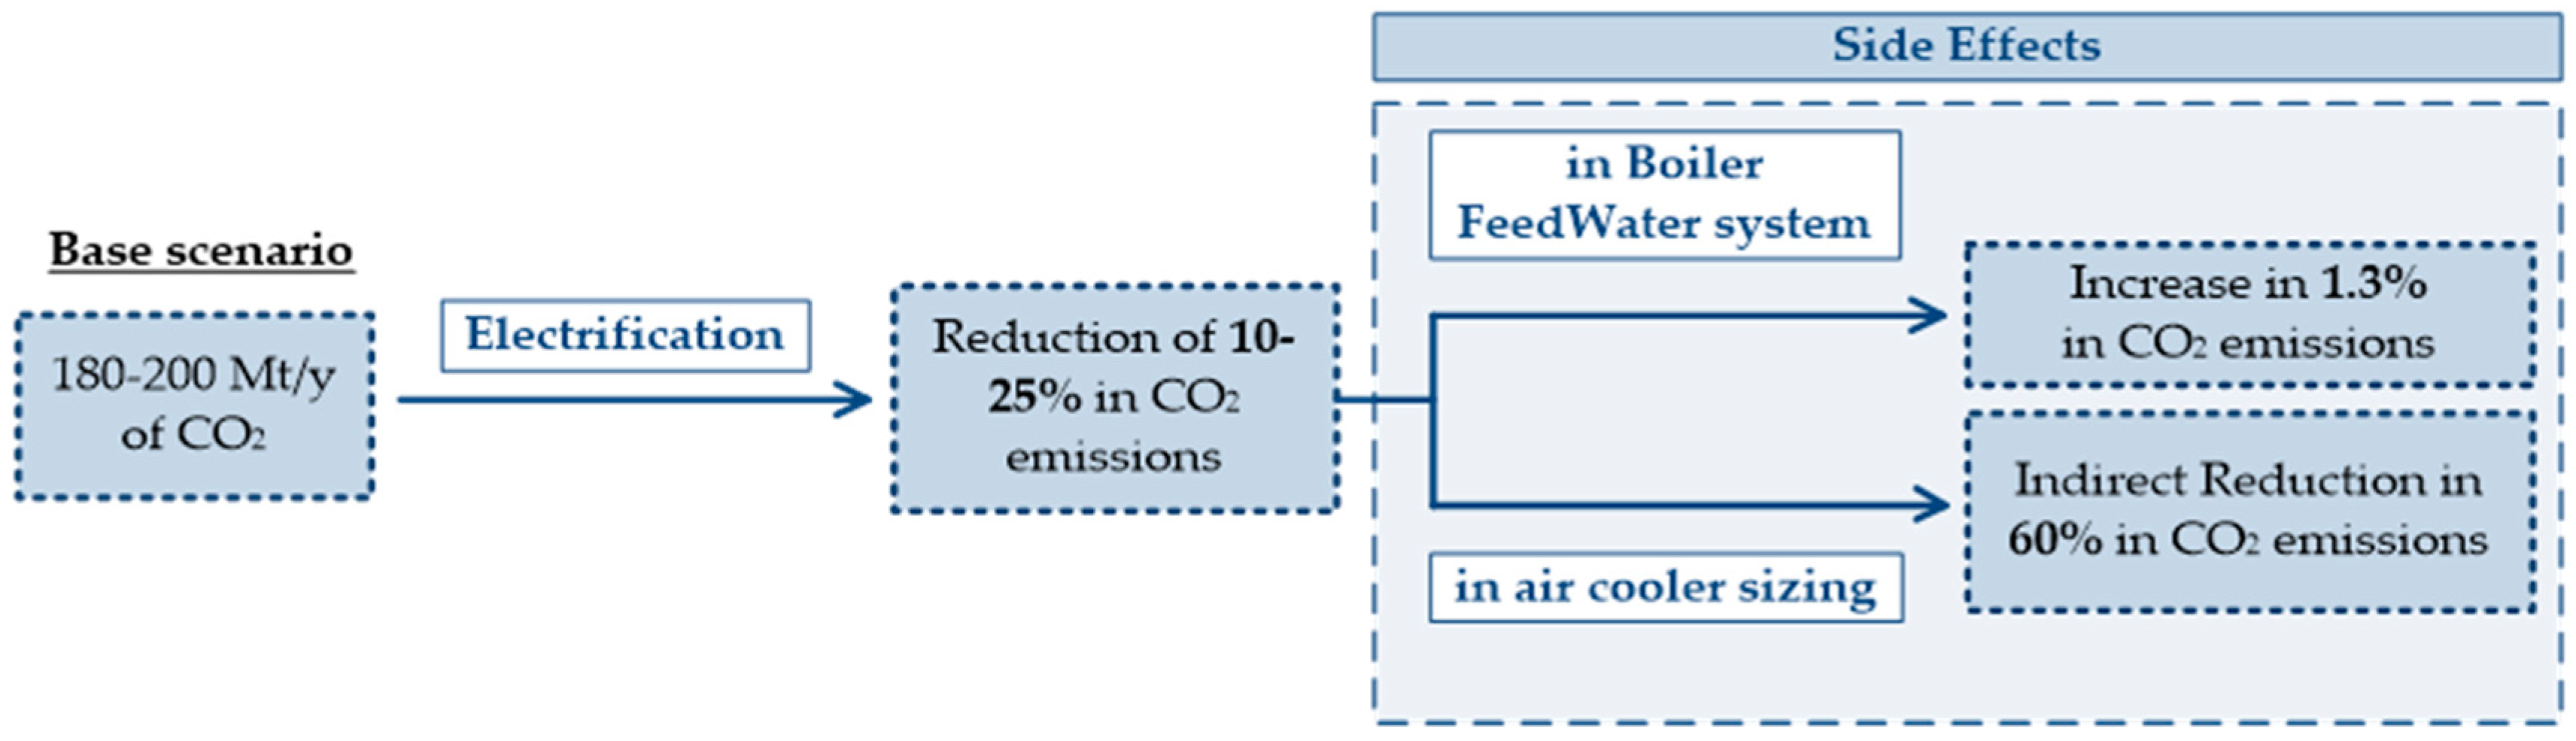
This section examines in detail the impacts of electrification on the condensate network and its downstream effects on the furnaces. While electrification is a valuable asset for the complex’s decarbonization, there are side effects on the deaerator inlet stream. The increase presented in Table 5 is relative to the post-electrification scenario and demonstrate the bottleneck created by the electrification of the compressors. While the electrification scenario reduces approximately 10 to 25% of emissions [14], an additional 1.3% increase in CO2 emissions is expected.
The temperature decrease may compromise the deaerator’s efficiency, as described in Section 1.4. Following the energy balance performed on the deaerator with the simulation results, it was possible to predict the impact that the temperature decrease would have on the BFW temperature, FG consumption, and CO2 emissions, using SPYRO, a furnace simulator. An increase in FG consumption in the furnaces can be observed (see Figure 5) with the objective of raising the temperature at the furnace economizer level.
As observed in Section 1.2, steam cracker plants tend to augment their carbon dioxide emissions in the order of millions of tonnes per annum. The initial phase involves the implementation of electrification, followed by the reduction in energy resources and the mitigation of associated CO2 emissions. It was possible to compare the pre-electrification and post-electrification scenarios for CO2 emissions exclusively taking into account the effects generated on the condensate system. Table 6 examines the impact that the electrification of compressors will have on fuel gas consumption in furnaces due to BFW heating in the economizer. The viability of this analysis was attributed to SPYRO simulation, incorporating the precise conditions of the furnaces and the calibration of generated HP steam.
Despite this difference representing an insignificant fraction of the total annual CO2 emissions (200 MtCO2/y [8]), it is a value that must be addressed to move closer to achieving the objectives of the Paris Agreement. Table 7 delineates the impact of the findings upon the ratios derived from the literature. This marginal deviation manifests solely within the consequential domain of electrification.
In order to avoid increasing the ecological footprint through fossil fuel consumption, an energy integration strategy was utilized. An energy requirement of approximately 2035 kW is needed to heat the deaerator inlet stream when using only cold condensate, and 1824 kW for the total imported condensate. The implementation of a preventive measure requires immediate study upstream of the deaerator, as a result of equipment efficiency and operational constraints.

3.5. Process Integration

The next step involved repurposing the heat exchanger idled by the unit. This heat exchanger utilizes quench water in counter-current flow for its heat exchange. The simulation validation resulted in a heat transfer area error of 4%, resulting in a deviation of 12 m2.
The heat exchanger allocated in the SC with the newly proposed stream modification can be visually observed in Figure 6. This is an effective and viable strategy for over-dimensioned steam crackers to crack a large amount of naphtha. Despite naphtha’s heat capacity being approximately two times lower than water’s, the thermal equilibrium of the quench water is not compromised.
A more conventional alternative would be the implementation of a new heat exchanger utilizing a hot utility, typically low-pressure (LP) steam. In this scenario, an energy equivalent to 1824 kW of steam would be required to heat the cold condensate stream. As all excess steam production is associated with CO2 emissions, an increase of 4 tonnes of CO2 per year is anticipated. Table 8 is constructed for the conventional scenario employing a hot utility. The steam price is contingent upon the fossil fuel cost, the steam type (in this case, LP), and the boiler efficiency [41]. For this case study, values from the Aspen Hysys® simulation were utilized.
As discussed in Section 1.2, in a scenario where emissions range between 180 and 200 MtCO2/y [8,9], equipment electrification contributes to a reduction of 10 to 25% in emissions [14]. In the present case study, an alternative to CO2 emissions caused by low temperatures in the condensate system is further implemented, and a solution for energy integration with process streams, as opposed to the use of external utilities, is investigated. Thus, it is possible to further reduce CO2 emissions by 1.3% as well as fuel gas consumption by 1.8%. Through the study of energy integration, a reduction of 1824 kW in hot utilities was achieved.

Economic Analysis

As this heat exchanger is already integrated into the plant’s process, the final concept would involve only modifying the piping, studying the piping material, and performing periodic maintenance. The investment allocated to the modifications that the exchanger will undergo is approximately EUR 135,000, as only the expenditures for piping alterations, the addition of fittings, control valves, and instrumentation were considered. The marginal augmentation of 1.3% in carbon dioxide emissions engenders consequential emission levies, coupled with a foreseeable 1.8% elevation in fuel gas consumption within the combustion chambers. Notwithstanding the proprietary nature of the corporation’s strategic framework, an anticipated financial advantage of circa EUR 2.3 million is forecasted upon the deployment of energy integration protocols. Regarding the environmental benefits, there is the possibility of reducing costs associated with CO2 emissions and decreasing fuel gas consumption. The advantages of the case study are shown in Table 9. As may be discerned, the payback period demonstrates commendable values; consequently, it is inferred that this undertaking possesses economic viability. The determination of the payback period was rendered practicable by virtue of the projected capital outlay for the heat exchanger conduit modification, the basis of which was the application of established engineering heuristics.

3.6. Deaerator: Consuming Excess of LP Steam

Industrial deaerators utilize low-pressure steam injection. The objective is to provide maximum agitation and contact between the steam and water flows to elevate the water to the requisite temperature. The incoming steam further serves to conduct the following [35]:
  • Facilitate the conveyance of gases to the air vent;
  • Establish a steam head above the stored deaerated water.
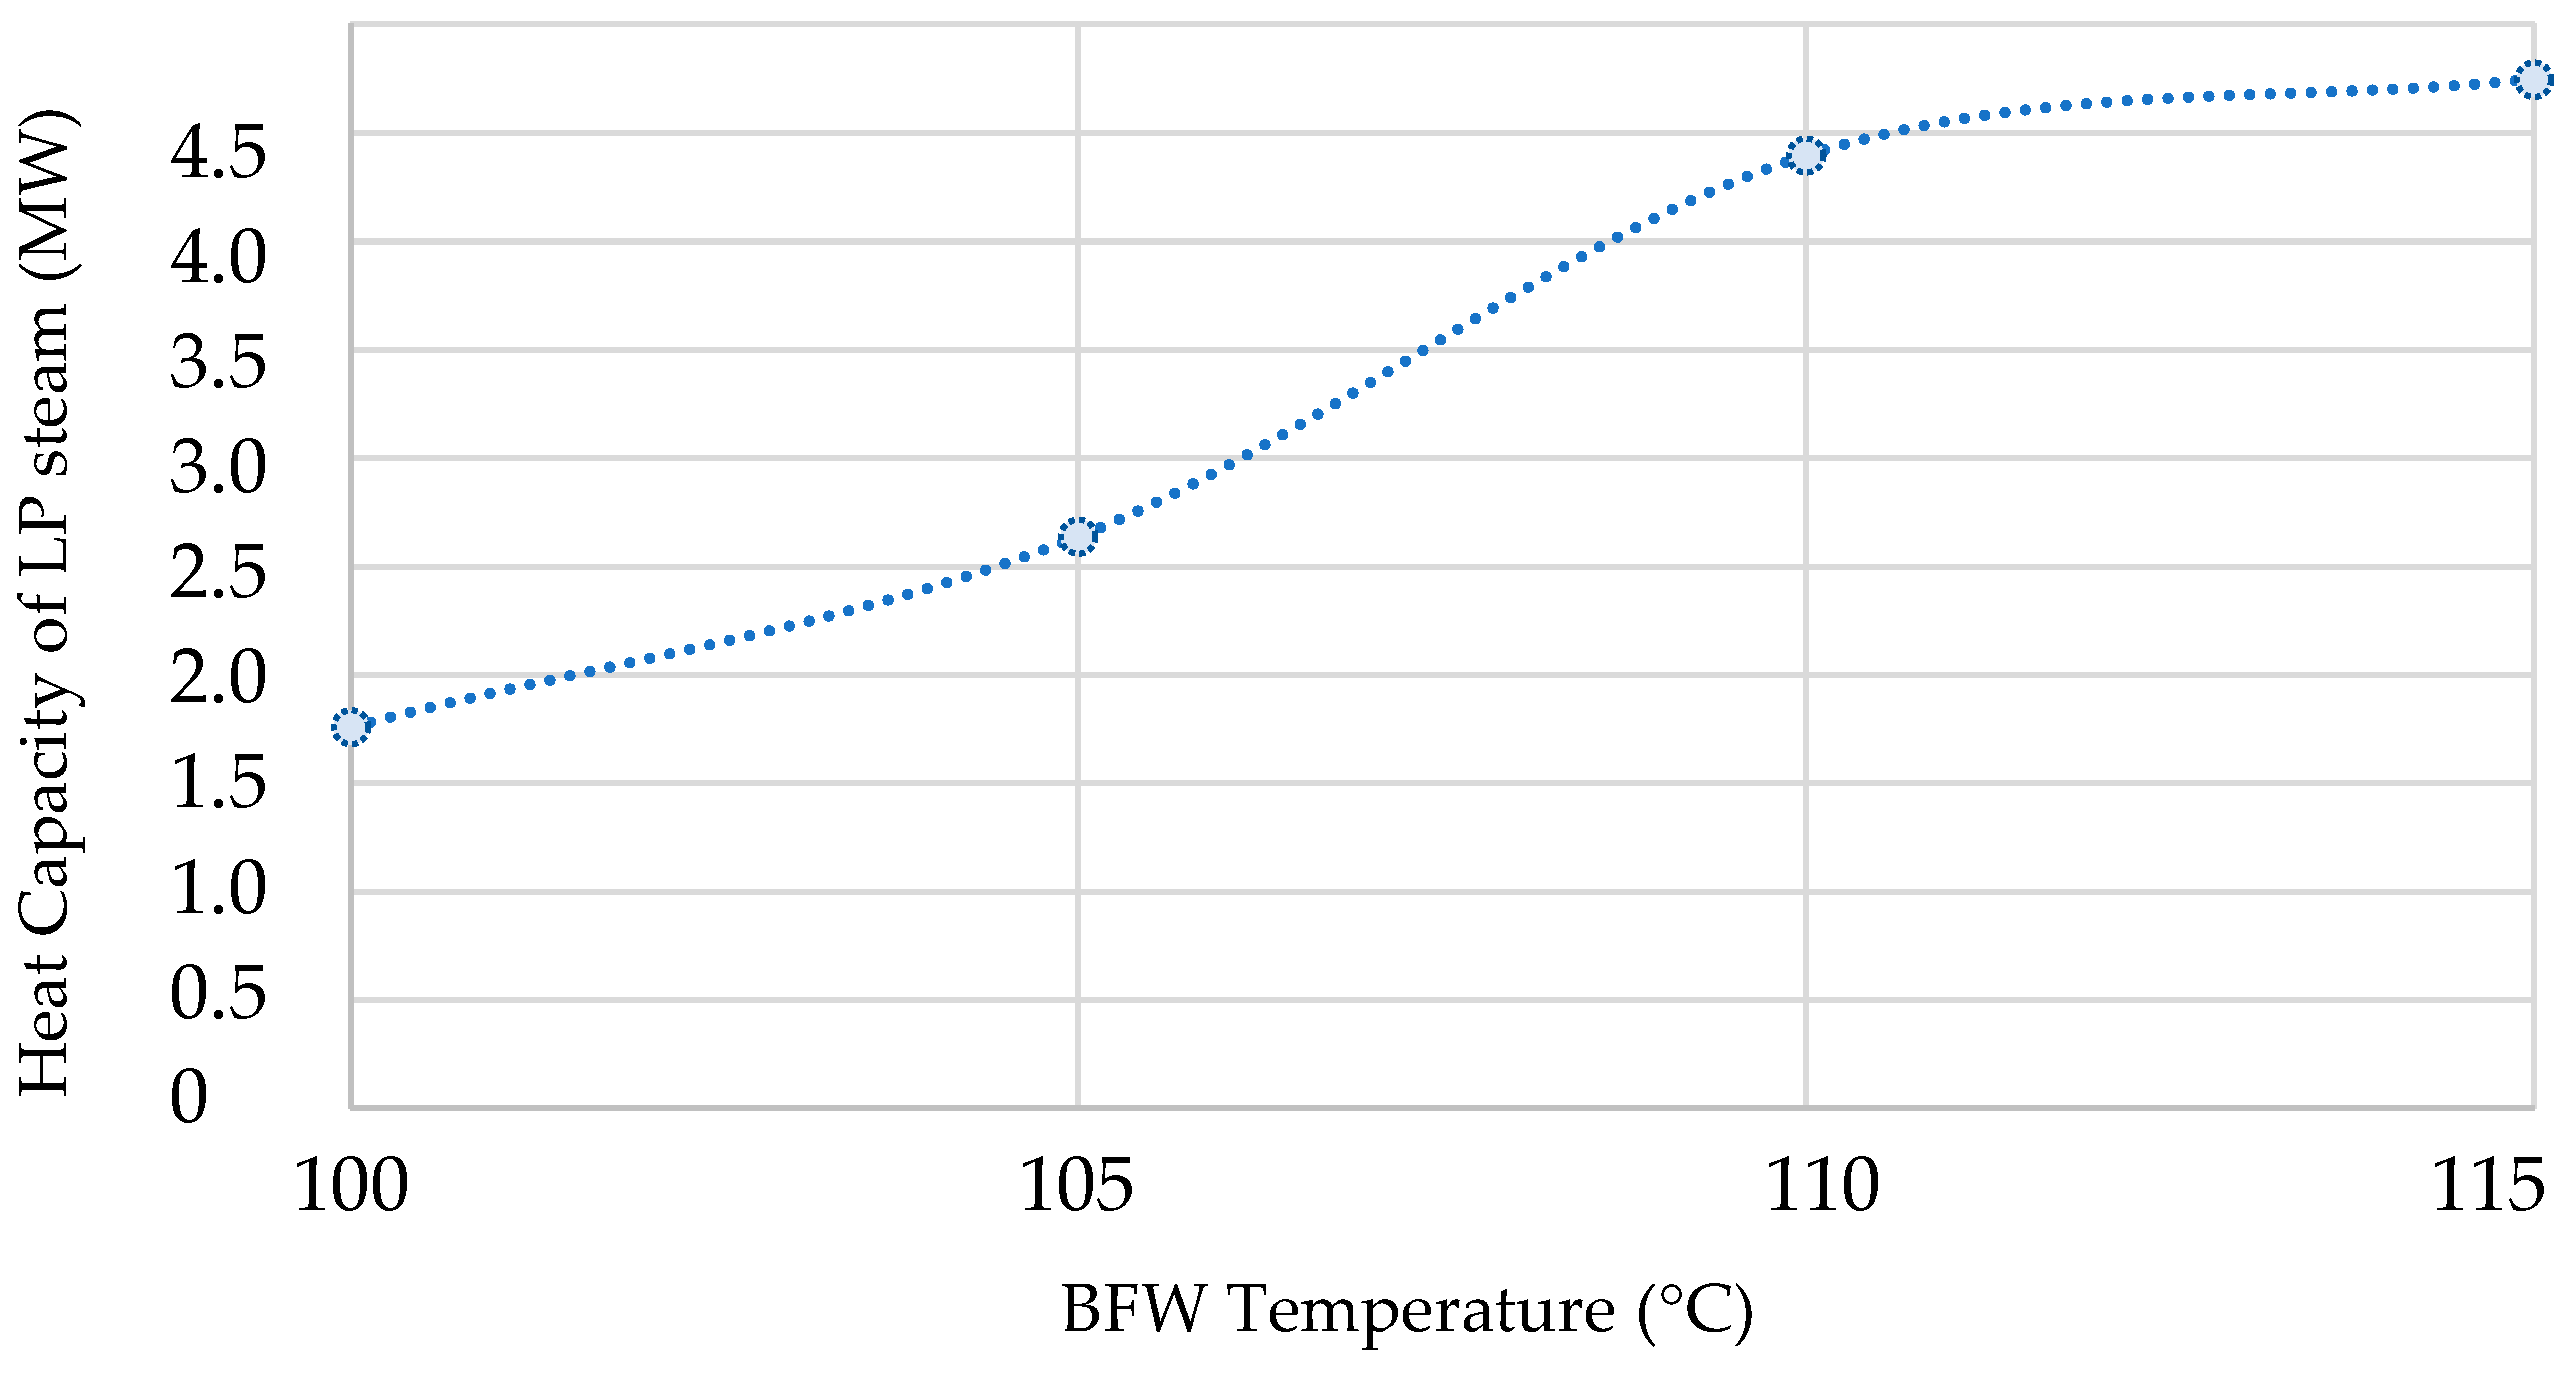
An evaluation was conducted regarding the feasibility of augmenting LP steam injection into the deaerator to regulate the imported water temperature (see Figure 7). Applying an energy balance to the deaerator, it was determined that 4396 kW of LP steam would be necessary to attain an optimal BFW temperature of 110 °C.
This represents an approximate three-fold increase in steam injection compared to the data sheet scenario, resulting in increased boiler steam generation, around 3.8 times. In accordance with the investigation presented in Section 3.3, the augmentation of steam generation leads to consequential carbon dioxide emissions. A commensurate analysis was executed to determine the thermal energy cost arising from the steam differential within the deaerator (see Table 10).
Notwithstanding operational expenditures, an overabundance of injection into the deaerator can precipitate equipment inefficiency. This phenomenon is attributable to the augmented volume of vented steam; the equipment may prove to be inadequately dimensioned for these altered conditions, thereby potentially inducing flooding and impeding the efficacious removal of dissolved gases. A sensitivity analysis of oxygen affinity in water should be performed according to the temperature profile in the deaerator to promote the remotion efficiency.

3.7. Overview of Global CO2 Emissions: A Balanced Perspective

The case study investigates the benefits and delineates the side effects of compressor electrification within the steam cracker facility. Although substantial and foreseen advantages concerning greenhouse gas emissions are anticipated with electrification, its repercussions necessitate scrutiny and, despite being diminished, mitigation. Figure 8 provides a synopsis of the executed study.
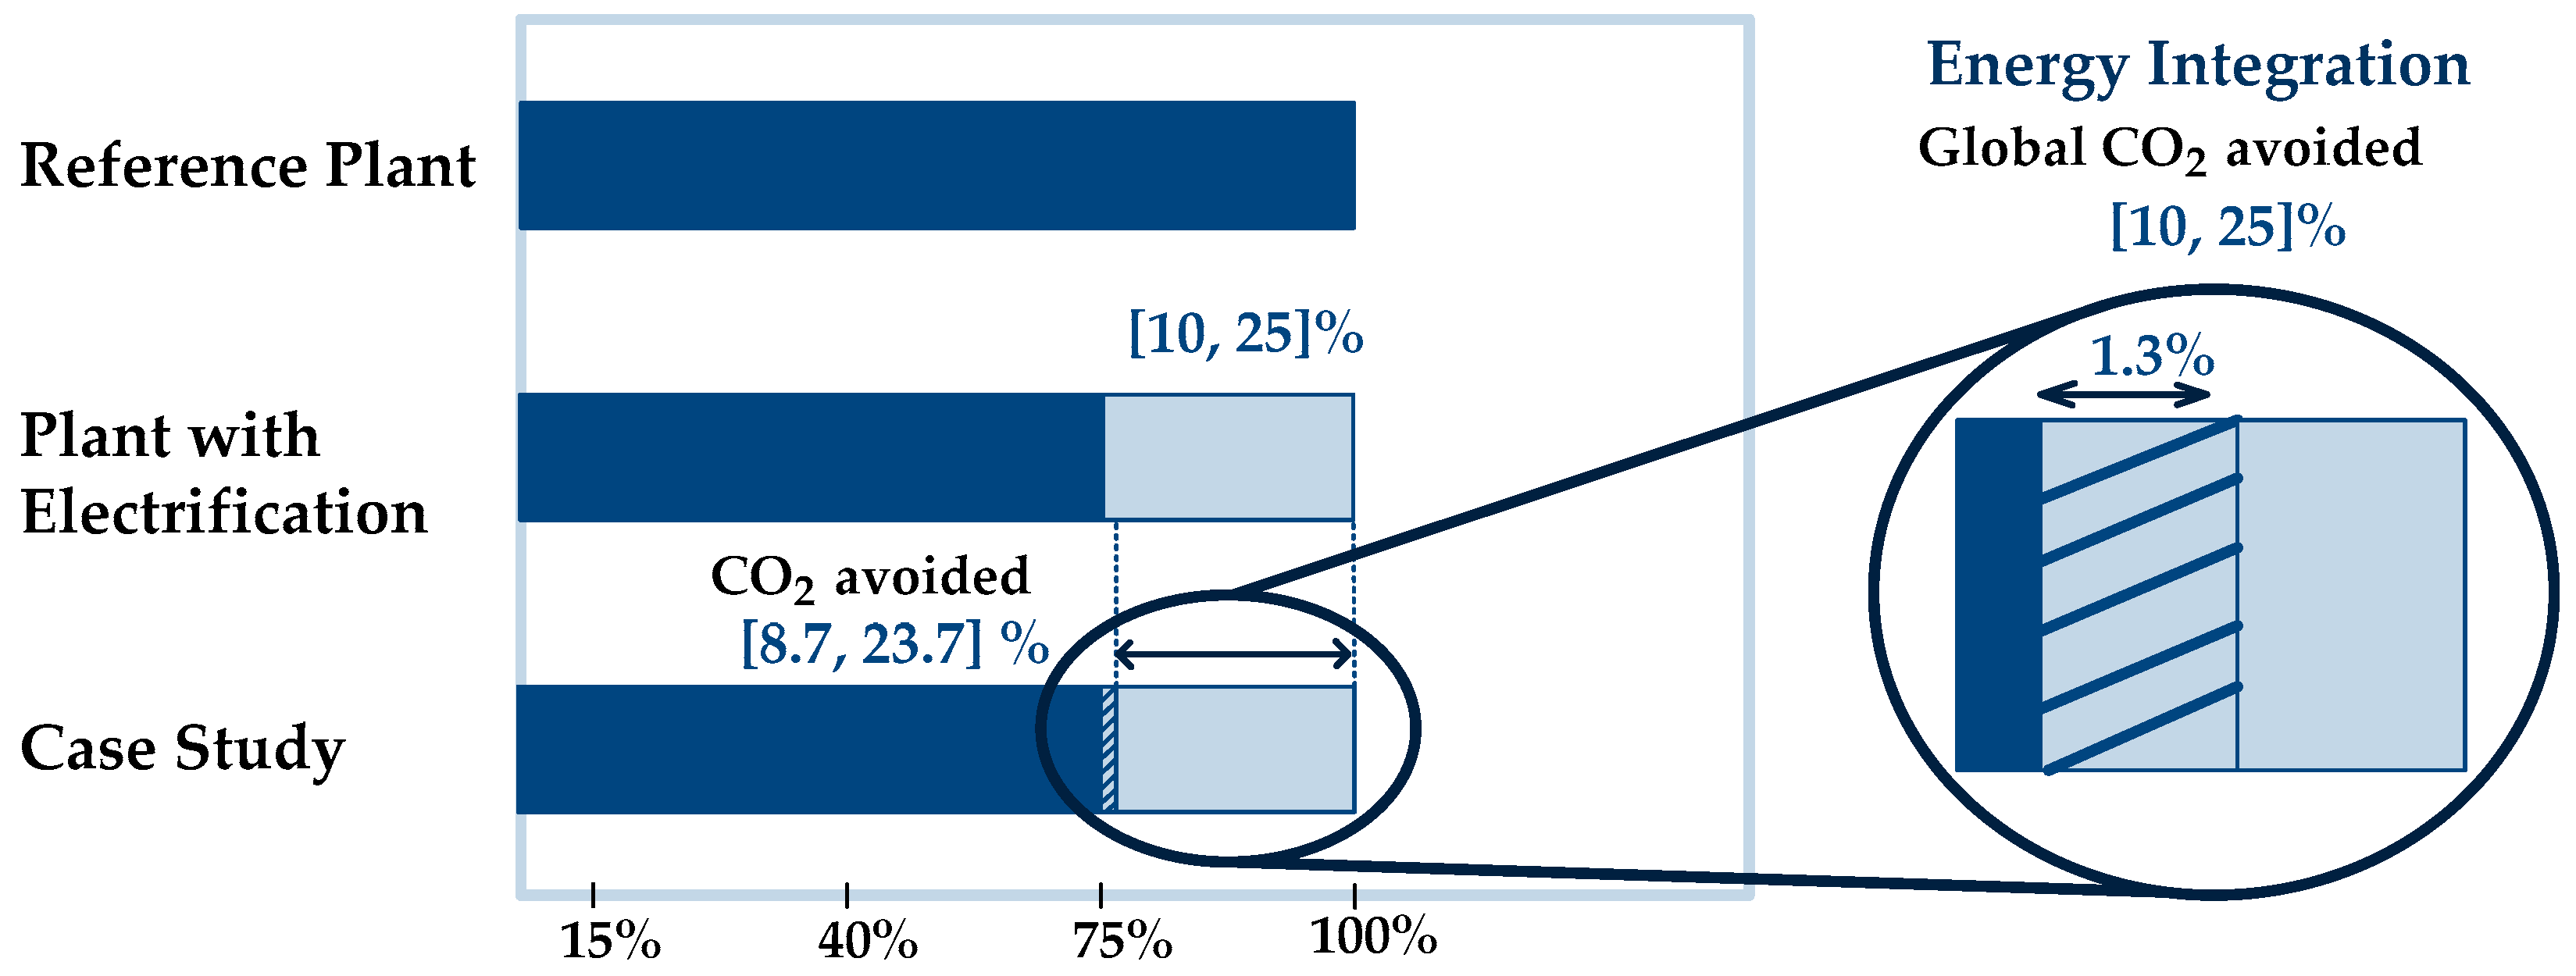
Therefore, the overall result of electrification is positive, with an expected substantial reduction in carbon dioxide emissions, despite downstream repercussions on the condensate network (see Figure 9). As this study emphasizes the reduction in CO2 emissions from the secondary effects of electrification, and employing energy integration, the annual ecological footprint’s impact has been entirely mitigated. The emission reduction values used for electrification were derived from the literature.
As depicted in Figure 9, electrification exerts a considerable influence on CO2 emissions, exhibiting a range of 10–25%, as documented in the literature [14]. The effects on the condensate network represent a mere 1.3% fraction of the CO2 emissions increase. Owing to the possibility of mitigating this GHG emissions increase through site energy integration, the total CO2 balance is determined to be 25%.

4. Conclusions

This study originates from the compressor electrification project in a steam cracker plant, which resulted in an approximate 2.3-fold reduction in the expanded steam flow to the condensate system. This case study demonstrates the capability to introduce versatility into plants designed for high-volume naphtha processing, thereby rendering the process continuous, self-sufficient, and more competitive within the market.
Key aspects of this investigation include the condensate network simulation and energy integration aimed at preheating the imported cold condensate stream. For this purpose, the condensate network was simulated using Aspen Hysys® V11, employing data sheet conditions and the ASME Steam property package. Subsequent validation and calibration with operational conditions and historical data yielded a maximum error of 17%. Consequently, it was determined that a four-fold increase in condensate importation from the Energies and Utilities Plant (E&U) was needed. This importation revealed an increase in fuel gas (FG) consumption of 1.8% and a 1.3% increase in carbon dioxide (CO2) emissions, attributed to the low temperature of the condensates, resulting in annual costs of EUR 2.3 million.
The aforementioned increase in CO2 emissions manifests as an augmentation of 905.2 metric tonnes of CO2 per annum; concurrently, the fuel gas increment corresponds to an additional energy expenditure of 795.4 kW/furnace. Accordingly, energy integration methodologies were adopted to remediate this divergence. The energy integration involved a simulation within AspenEDR® V11, utilizing the specifications of a designated heat exchanger and the ASME Steam property package. The repurposing of an existing heat exchanger facilitated a reduction of 1824 kW in hot utilities (e.g., LP steam). The heat exchanger must be installed upstream of the deaerator to maintain the functional integrity of this equipment and to ensure undiminished performance and efficiency in the removal of dissolved gases.
Adjustments were implemented on the condensate network equipment, and a reduction in electrical energy consumption at the condenser is anticipated, yielding a 60% decrease in CO2 emissions, given that this equipment, subsequent to electrification, was over-specified.
In conclusion, a balance of carbon dioxide emissions was performed, and it was determined that the compressor electrification project for the steam cracker can reduce atmospheric CO2 emissions by up to 25%. Considering the collateral impact on the BFW network, a reduction of only 23.7% was initially projected. However, this discrepancy (1.3%) was effectively addressed through energy integration, resulting in a positive overall balance.
This methodology enhances the plant’s independence from external energy sources. While energy integration constitutes an industrial methodology that significantly contributes to the achievement of the Paris Agreement objectives and the tenets of the circular economy, further advancements are imperative. The subsequent phase will involve the implementation of green energy initiatives, encompassing electric furnaces, fuel gas with an elevated hydrogen content, the utilization of green hydrogen, and electricity derived from renewable sources.

Author Contributions

Conceptualization, M.E. and R.S.; methodology, M.E. and R.S.; software, M.E. and J.C.T.; validation, M.E. and J.C.T.; formal analysis, M.E. and J.C.T.; investigation, J.C.T.; data curation, M.E. and J.C.T.; writing—original draft preparation, J.C.T.; writing—review and editing, M.E. and R.S.; visualization, M.E.; supervision, M.E. and R.S.; project administration, M.E. All authors have read and agreed to the published version of the manuscript.

Funding

This work received support and help from FCT/MCTES (LA/P/0008/2020 DOI 10.54499/LA/P/0008/2020, UIDP/50006/2020 DOI 10.54499/UIDP/50006/2020 and UIDB/50006/2020 DOI 10.54499/UIDB/50006/2020) through Portuguese national funds.

Data Availability Statement

Restrictions apply to the datasets. The datasets presented in the article are not readily available because the data is proprietary to Repsol Polímeros. Requests to access the datasets should be directed to them.

Acknowledgments

The authors are grateful to the company Repsol Polímeros ensured all necessary conditions for the execution of the work, guaranteeing its safe and efficient completion.

Conflicts of Interest

Rodrigo Silva was employed by the company Repsol Polímeros, S.A. The remaining authors declare that the research was conducted in the absence of any commercial or financial relationships that could be construed as a potential conflict of interest.

Abbreviations

The following abbreviations are used in this manuscript:
BFWBoiler feedwater
CCSCarbon capture and storage
CO2Carbon dioxide
CPIsChemical process industries
E&UEnergies and Utilities Plant
FGFuel gas
GHGGreenhouse gas
HENHeat exchanger network
HPHigh-pressure
HVCHigh valuable chemical
MPMedium Pressure
LPLow-pressure
SCSteam cracker

References

  1. EMERSON. Ethylene Production. 2010. Available online: https://www.emerson.com/documents/automation/manuals-guides-chemical-sourcebook-chapter-1-2-ethylene-production-polysilicone-production-fisher-en-138242.pdf (accessed on 19 March 2025).
  2. Zimmermann, H.; Walzl, R. Ethylene. In Ullmann’s Encyclopedia of Industrial Chemistry; Wiley-VCH Verlag GmbH & Co. KGaA: Weinheim, Germany, 2012. [Google Scholar]
  3. GlobeNewswire. Global Ethylene Industry Report 2024–2030. 2024. Available online: https://www.globenewswire.com/news-release/2024/05/09/2878493/28124/en/Global-Ethylene-Industry-Report-2024-2030-Featuring-SINOPEC-E-I-du-Pont-De-Nemours-and-Co-Exxon-Mobil-LyondellBasell-Industries-Royal-Dutch-Shell-and-SABIC.html (accessed on 19 March 2025).
  4. Le Van Mao, R.; Yan, H.; Muntasar, A.; Al-Yassir, N. Blending of non-petroleum compounds with current hydrocarbon feeds to use in the thermo-catalytic steam-cracking process for the selective production of light olefins. In New and Future Developments in Catalysis; Elsevier: Amsterdam, The Netherlands, 2013; pp. 143–173. [Google Scholar] [CrossRef]
  5. Fakhroleslam, M.; Sadrameli, S.M. Thermal/catalytic cracking of hydrocarbons for the production of olefins; a state-of-the-art review III: Process modeling and simulation. Fuel 2019, 252, 553–566. [Google Scholar] [CrossRef]
  6. Sundaram, K.M.; Shreehan, M.M.; Olszewski, E.F. Ethylene. In Kirk-Othmer Encyclopedia of Chemical Technology; John Wiley & Sons, Inc.: Hoboken, NJ, USA, 2000. [Google Scholar]
  7. Neelis, M.L.; Patel, M.K.; Bach, P.W.; Haije, W.G. Analysis of Energy Use and Carbon Losses in the Chemical and Refinery Industries; Report ECN-I-05-008; Energy Research Centre of the Netherlands: Petten, The Netherlands, 2005. [Google Scholar]
  8. Ren, T.; Patel, M.; Blok, K. Olefins from conventional and heavy feedstocks: Energy use in steam cracking and alternative processes. Energy 2006, 31, 425–451. [Google Scholar] [CrossRef]
  9. Amghizar, I.; Vandewalle, L.A.; Van Geem, K.M.; Marin, G.B. New Trends in Olefin Production. Engineering 2017, 3, 171–178. [Google Scholar] [CrossRef]
  10. Chemical Engineering. Investigating Decarbonization Strategies for Steam Cracker Furnaces. 2023. Available online: https://www.chemengonline.com/investigating-decarbonization-strategies-for-steam-cracker-furnaces/ (accessed on 21 March 2025).
  11. European Commission. A Hydrogen Strategy for a Climate-Neutral Europe, Brussels: European Commission 2020. Available online: https://energy.ec.europa.eu/system/files/2020-07/hydrogen_strategy_0.pdf (accessed on 18 May 2025).
  12. Ghaddar, N.; Mezher, T. Modeling of current and future energy intensity and greenhouse gas emissions of the Lebanese industrial sector: Assessment of mitigation options. Appl. Energy 1999, 63, 53–74. [Google Scholar] [CrossRef]
  13. Saidur, R. A review on electrical motors energy use and energy savings. Renew. Sustain. Energy Rev. 2010, 14, 877–898. [Google Scholar] [CrossRef]
  14. Technip Energies. Decarbonisation of Steam Crackers. 2023. Available online: https://www.ten.com/sites/energies/files/2023-05/decarbonisation_of_steam_crackers_technipenergies.pdf (accessed on 21 March 2025).
  15. AIChE. Electrification of Steam Cracker Furnaces—Technology Demonstration and the Route to Commercialization. 2023. Available online: https://www.aiche.org/conferences/videos/conference-presentations/electrification-steam-cracker-furnaces-technology-demonstration-and-route-commercialization (accessed on 19 March 2025).
  16. APEC. Electric Motors—Alignment of Standards and Best Practice Programmes within APEC; Final Report; APEC: Singapore, 2008; Available online: https://www.apec.org/docs/default-source/Publications/2008/10/Electric-Motors-Alignment-of-Standards-and-Best-Practice-Programmes-within-APEC-October-2008/08_ewg_motor_final_report.pdf (accessed on 18 May 2025).
  17. Ipieca. Electric Motors. 2023. Available online: https://www.ipieca.org/resources/energy-efficiency-compendium/electric-motors-2023 (accessed on 19 March 2025).
  18. Jayamaha, L. Energy Management and Energy Auditing. In Energy-Efficient Building System; McGraw Hill Professional: New York, NY, USA, 2006; pp. 1–21. ISBN 0071777342. [Google Scholar]
  19. Abraham, M.A. Encyclopedia of Sustainable Technologies; Elsevier: Oxford, UK, 2017; Volume 2, ISBN 978-0-12-804677-7. [Google Scholar]
  20. Linnhoff, B.; Flower, J.R. Synthesis of heat exchanger networks: II. Evolutionary generation of networks with various criteria of optimality. AIChE J. 1978, 24, 642–654. [Google Scholar] [CrossRef]
  21. Hohmann, E. Optimum Networks for Heat Exchange. Ph.D. Thesis, University of Southern California, Los Angeles, CA, USA, 1971. [Google Scholar]
  22. Linnhoff, B.; Hindmarsh, E. The pinch design method for heat exchanger networks. Chem. Eng. Sci. 1983, 38, 745–763. [Google Scholar] [CrossRef]
  23. Alwi, S.R.W.; Manan, Z.A. Generic Graphical Technique for Simultaneous Targeting and Design of Water Networks. Ind. Eng. Chem. Res. 2008, 47, 2762–2777. [Google Scholar] [CrossRef]
  24. Alves, J.J.; Towler, G.P. Analysis of Refinery Hydrogen Distribution Systems. Ind. Eng. Chem. Res. 2002, 41, 5759–5769. [Google Scholar] [CrossRef]
  25. Hedström, H.; Johansson, D. A Pinch Targeting Study of the Borealis Cracker Plant in Stenungsund. Master’s Thesis, Chalmers University of Technology, Gothenburg, Sweden, 2008. [Google Scholar]
  26. Johansson, D.; Harvey, S. An Analysis for Identifying Energy Saving Opportunities for a Petrochemical Cluster in Times of Climate Change. Int. J. Greenh. Gas Control Chem. Eng. Trans. 2009, 18, 469–474. [Google Scholar] [CrossRef]
  27. Munir, S.M.; Manan, Z.A.; Alwi, S.R.W. Holistic carbon planning for industrial parks: A waste-to-resources process integration approach. J. Clean. Prod. 2012, 33, 74–85. [Google Scholar] [CrossRef]
  28. Tan, R.R.; Foo, D.C. Pinch analysis approach to carbon-constrained energy sector planning. Energy 2007, 32, 1422–1429. [Google Scholar] [CrossRef]
  29. Wong, W.H.; Foo, D.C.; Tan, R.R. Chronologically constrained composite curves for carbon constrained agricultural planning. Biomass Bioenergy 2011, 35, 1716–1720. [Google Scholar] [CrossRef]
  30. Klemeš, J.J.; Varbanov, P.S.; Pierucci, S.; Huisingh, D. Minimising emissions and energy wastage by improved industrial processes and integration of renewable energy. J. Clean. Prod. 2010, 18, 843–847. [Google Scholar] [CrossRef]
  31. Varbanov, P.S.; Klemeš, J.J. Total Sites Integrating Renewables with Extended Heat Transfer and Recovery. Heat Transf. Eng. 2010, 31, 733–741. [Google Scholar] [CrossRef]
  32. Zeb, A. Design Rules for Steam Condensate System. Master’s Thesis, Lappeenranta University of Technology, Lappeenranta, Finland, 2017. [Google Scholar]
  33. Shokri, A.; Fard, M.S. Principles, operational challenges, and perspectives in boiler feed water treatment process. Environ. Adv. 2023, 13, 100389. [Google Scholar] [CrossRef]
  34. Tpowertec.com. Thermal PowerTec GmbH. 2025. Available online: https://www.tpowertec.com/STPP-Repowering.htm (accessed on 19 March 2025).
  35. Spirax Sarco, Pressurised Deaerators|Spirax Sarco. Available online: https://www.spiraxsarco.com/learn-about-steam/the-boiler-house/pressurised-deaerators#article-top (accessed on 19 March 2025).
  36. Guo, P.; La Plante, E.C.; Wang, B.; Chen, X.; Balonis, M.; Bauchy, M.; Sant, G. Direct observation of pitting corrosion evolutions on carbon steel surfaces at the nano-to-micro-scales. Sci. Rep. 2018, 8, 7990. [Google Scholar] [CrossRef] [PubMed]
  37. Ketrick, B. Boiler Water Treatment. Available online: https://www.awt.org/pub/?id=08efb5f9-04d8-6cc9-8173-d600ab4ebb80 (accessed on 19 March 2025).
  38. Brooks, R. Modeling the North American market for natural gas liquids. In Proceedings of the 32nd US Association of Energy and Economics (USAEE) Conference, Anchorage, AK, USA, 28–31 July 2013. [Google Scholar]
  39. Heat Exchangers World. TEMA Standards and the Shell & Tube Heat Exchanger Design; Heat Exchanger World: Toronto, ON, Canada, 2023; Available online: https://heat-exchanger-world.com/tema-standards-and-the-shell-and-tube-heat-exchanger-design/ (accessed on 18 May 2025).
  40. Agência Portuguesa do Ambiente (APA). Fator de Emissão da Eletricidade 2024 Portugal. 2024. Available online: https://apambiente.pt/sites/default/files/_Clima/Inventarios/FE_GEE_Eletricidade_2024_final.pdf (accessed on 19 March 2025).
  41. Inveno Engineering. Knowing the Cost of Steam. Available online: https://invenoeng.com/wp-content/uploads/2017/12/Best-Practice-No.-16-Cost-of-Steam-Updated.pdf (accessed on 19 March 2025).
Figure 1. Schematic representation of a steam cracker plant consisting of the hot section and the cold section.
Chemengineering 09 00055 g001
Figure 2. Plant’s condensate system.
Chemengineering 09 00055 g002
Figure 3. Block diagram of methodology.
Chemengineering 09 00055 g003
Figure 4. Characterization of the case study and measures to correct the problem.
Chemengineering 09 00055 g004
Figure 5. Contribution of BFW temperature decrease to the aggravation of carbon dioxide emissions.
Chemengineering 09 00055 g005
Figure 6. Heat exchanger, naphtha preheater, repurposing strategy for energy integration.
Chemengineering 09 00055 g006
Figure 7. Increased need for LP steam at the deaerator to raise the BFW temperature.
Chemengineering 09 00055 g007
Figure 8. Global analysis of CO2 emissions in the case study.
Chemengineering 09 00055 g008
Figure 9. Global carbon dioxide balance.
Chemengineering 09 00055 g009
Table 1. Parameters introduced in the steam cracker BFW system.
ParameterVariable Input
Reduction in expanded steam flow to the condensate system 12.3
High-pressure steam energy produced (kW) 272,190.0
LP steam requirement at the deaerator before electrification (kW)1172.3
1: Reduction ratio between pre-electrification and post-electrification of compressors; 2: BFW flow rate is to be maintained consistently across both pre- and post-electrification scenarios.
Table 2. Study of fuel gas consumption in a furnace.
ParameterVariable Input
Fuel gas energy consumed per furnace (kW/furnace)44,190.0
Ratio of CO2 emissions per consumption of fuel gas2.5
Hydrogen content in fuel gas (%)[10, 20]
CO2 emissions per furnace (tCO2/y/furnace)69,630.0
Table 3. Pre-electrification to post-electrification scenario ratio.
Variable (Output)Pre-Electrification/Post-Electrification
Heat exchange in condenser2.30
Energies and Utilities Plant importation0.25
Temperature inlet deaerator1.30
Temperature outlet deaerator1.15
Table 4. Optimization of condenser in BFW system.
ParameterVariable (Output)
Emission Factor (tCO2eq/MWh) [40]0.23
Reduction in CO2 emissions, annual 12.6
Reduction in CO2 emissions (%)60
1: Reduction ratio between pre-electrification and post-electrification of compressors.
Table 5. Results of CO2 analysis before and after electrification.
ParameterIncrease
Carbon dioxide emissions (%)1.3
Fuel gas consumption (%)1.8
Table 6. Quantitative increase in CO2 emissions and fuel gas energy consumption.
ParameterVariable (Output)
CO2 emissions per furnace (t CO2/y/furnace)70,536.3
Excess CO2 emissions per furnace (t CO2/y/furnace) 1905.2
Fuel gas energy consumed per furnace post-electrification (kW/furnace)44,984.7
Excess fuel gas energy consumed per furnace (kW/furnace) 1795.4
1: Excess relative to the base scenario (pre-electrification).
Table 7. Increased energy demand of the furnaces.
LiteratureInfluence on the LiteratureIncrease Factor
Ethylene production (kt/y) [2]300–400-
Mass ratio of CO2 emissions to HVC production (tCO2/t HVC) [8,9]1.801.82 10.9%
Mass ratio of fuel gas energy consumption to HVC production (GJ/t HVC)6.506.51 10.2%
1: Based on the literature calculation base of 400 kt ethylene/y [2].
Table 8. Annual cost of excess steam production in energy integration case study.
ParameterValue (Output)
Cost per unit of LP energy consumed (USD/Gcal) 18.6
Energy required for the cold condensate stream (kW)1823.5
Annual cost per produced thermal energy (M USD/y)424.4
1: Values obtained from the Aspen Hysys® database (an extrapolation was performed considering pressure).
Table 9. Synopsis of the benefits of the study after applying energy integration.
Heat Saving (kW)Reduction Emissions
(t CO2/y)
Reduction Energy (kW)Payback Time (Months)
1823.5905.2795.46.2
Table 10. Annual cost of excess steam production in deaerator case study.
ParameterValue (Output)
Excess of energy injection in deaerator (kW) 13223.8
Annual cost per produced thermal energy (103 M USD/y)378.1
1: In terms of the difference in LP steam.
Disclaimer/Publisher’s Note: The statements, opinions and data contained in all publications are solely those of the individual author(s) and contributor(s) and not of MDPI and/or the editor(s). MDPI and/or the editor(s) disclaim responsibility for any injury to people or property resulting from any ideas, methods, instructions or products referred to in the content.

