Abstract
The development of rapid, sensitive and cost-effective lateral flow assays is crucial for the detection of mycotoxins, ideally at the point-of-care level. This study presents the design and optimization of a competitive lateral flow assay based on gold nanoparticles (AuNPs) for the detection of zearalenone in food samples. Beginning with the synthesis and functionalization of gold nanoparticles, it proceeds to compare the immobilization of antibodies using chemical conjugation and physical adsorption binding strategies, upon optimizing parameters including the pH, antibody concentration and blocking conditions to enhance the stability of the prepared bioconjugates. The bioconjugates are characterized using UV–visible absorption spectroscopy and dynamic light scattering to monitor changes in the spectra and hydrodynamic size of AuNPs upon the addition of antibodies. The assessment of these bioconjugates is based on their ability to bind and manifest a color, developed due to nanoparticle binding with the test zone on the strip with the toxin–protein conjugate. The lateral flow immunochromatographic assay (LFIA) strips are then prepared by dispensing a control line (IgG) and test line (toxin–protein conjugate) on a nitrocellulose membrane using a lateral flow strip dispenser. The sensitivity of the LFIA strips is evaluated after standardizing the conditions by varying the concentration of zearalenone in the spiked samples and optimizing the running buffer solution. The limit of detection and limit of quantification under optimized conditions are determined to be 0.7 ng/mL and 2.37 ng for zearalenone-spiked samples. Furthermore, the mean pixel intensity and RGB values are plotted against the concentration of zearalenone, which can be used in a colorimetric smartphone-based application for the quantification of the amount of mycotoxin in the sample.
1. Introduction
Ubiquitous in agricultural commodities, mycotoxins are toxic metabolites produced by filamentous fungi and represent a hidden yet pervasive threat to global food safety and agricultural sustainability [1]. The contamination of food products such as cereals, crops and nuts by mycotoxins can lead to both acute and chronic health issues, including carcinogenic, immunosuppressive and hepatotoxic effects [2,3]. Rapid and sensitive detection methods are essential to monitor mycotoxin contamination and mitigate the associated risks. Conventional methods of detecting mycotoxins, such as high-performance liquid chromatography (HPLC), enzyme-linked immunosorbent assays (ELISAs) and mass spectrometry, offer high sensitivity and specificity but are time-consuming and require sophisticated laboratory equipment and skilled personnel, which limits their practicality for routine monitoring in the field or low-resource settings [4]. Given the urgent need to address these limitations, there is an increasing demand for point-of-care (POC) diagnostic tools that allow the rapid, reliable and cost-effective detection of mycotoxins.
The possibility of achieving results in minutes through such POC diagnostic devices makes them ideal alternatives for routine and robust use [5]. Due to its simple operation and convenient readout, the colorimetric detection of biomarkers is of great significance for practical POC applications [6]. In this context, lateral flow immunochromatographic assay colorimetric sensors based on gold nanoparticles (AuNPs) have become increasingly prevalent [7,8]. AuNPs are considered efficient bioreporters in healthcare technologies due to their amenability to surface modifications that facilitate their selective binding with a specific analyte in biosensing and diagnostic applications [5,9]. AuNPs can be functionalized with sensing probes like nucleic acid aptamers, antibodies and other chemical ligands that interact with an analyte and trigger the assembly of AuNPs to manifest a visible color response [8]. A lateral flow immunochromatographic assay (LFIA), shown schematically in Figure 1, consists of prefabricated strips embedded with dry reagents on a carrier probe. These reagents are activated upon the addition of a fluid sample. The presence or absence of the target analyte is then indicated by the appearance of colored lines on the membrane.
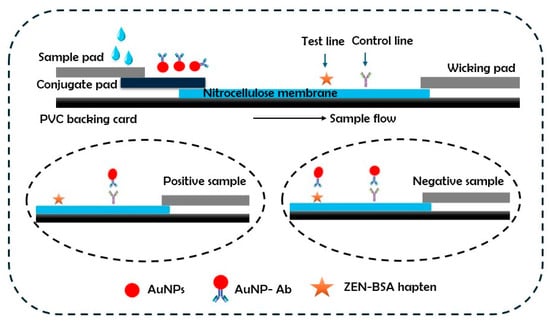
Figure 1.
Development of lateral flow immunoassay strip and its components.
To develop a sensitive LFIA for mycotoxins, the AuNPs can be functionalized with appropriate antibodies. The stability and robustness of these gold nanoparticle–antibody complexes plays a key role [10], however. The ability of antibodies (Ab) to bind to a specific antigen or target analyte attached to the surface of AuNPs has been studied as a function of immobilization, molecular orientation, surface crowding and solid surface properties [11]. The analytical functions of these colorimetric bioassays can be manipulated via the coupling density and orientation of the attached proteins or the antibodies on the surface of the AuNPs [12]. The antigen-binding capability correlates with the number of accessible domains (Fab) on the surfaces of antibodies that are responsible for antigen binding with the antibodies [13,14,15,16]. It is well known that the activity of the immobilized antibodies varies depending upon the immobilization strategy used and the accessibility of the Fab domains of the antigens [14]. However, knowledge of how the chemical coupling conditions within a certain immobilization approach impact the antibody’s accessibility is scarce, and the underlying mechanisms are not fully understood. The methods used to couple the antibodies to the AuNP surface are physical adsorption [17,18] and chemical conjugation techniques [19]. Through physical adsorption, however, the antibodies are organized randomly on the surfaces of the nanoparticles, which causes the biosensors to exhibit low sensitivity [20]. The antibodies create layers on the surfaces of gold nanoparticles, and the layer nearest to the AuNPs forms a hard corona, while the layer outside it is loosely bound due to a lower electrostatic force, creating a soft corona. Studies have shown that the ideal antibody-to-AuNP ratio to achieve high sensitivity in bioassays is not always sufficient to yield a stabilized concentration of conjugates [21,22].
A stable and effective AuNP–mAb conjugate can also be generated via the chemical conjugation of antibodies on the AuNP surface [23,24]. Surface modification with various ligands can result in site-specific antibody immobilization with high-affinity attachment [25] and controlled antibody orientation. The linker creates a barrier that shields the AuNPs and offers chemical functionality, facilitating interaction with the amino-, carboxyl- or glycosyl groups of the antibodies [26,27]. Crosslinking chemistry, using 1- ethyl-3-3 dimethylaminopropyl carbodiimide hydrochloride and N-hydroxy succinimide (EDC/NHS), has been used to immobilize peptides, proteins and other biomolecules on the surfaces of AuNPs for their application in biosensing and diagnostics [28,29]. Chemical conjugation has numerous advantages over non-covalent forms as (i) fewer antibodies are required; (ii) the risk of AuNP aggregation during conjugation is reduced; (iii) multiple trials to conjugate antibodies and AuNPs are not required, as the mechanism is already well established; and (iv) various crosslinking techniques can be used, depending on the application.
The stability of these bioconjugates prepared by immobilizing antibodies using physical or chemical attachment on the surfaces of AuNPs can be evaluated by creating a high-salt hypertonic environment. The addition of NaCl reduces the electrostatic repulsive interactions between the gold nanoparticles, which impacts their electrostatic stability and results in their aggregation [30], indicated by a color change. This effect can be demonstrated in pristine AuNP suspensions, indicating the critical concentration of NaCl solution that is required to disturb the electrostatic stability of the AuNP–mAb complex. A similar color change in colloidal suspensions of AuNP–mAb conjugates appears when a high-salt hypertonic solution above this critical concentration is added, which is indicative of aggregation and unstable conjugates, whereas no color change indicates a well-dispersed AuNP–mAb conjugate whose surface is fully covered with antibodies [31].
As zearalenone frequently occurs in foodstuffs [32], it was selected as the target toxin in the development of this LFIA. Zearalenone (ZEN) is a mycotoxin synthesized by various species of Fusarium fungi, particularly Fusarium graminearum and Fusarium culmorum [33]. These fungi primarily infect cereal crops such as wheat, maize, barley and oats, thereby posing a significant threat to food safety and public health. Human exposure to zearalenone predominantly occurs through the ingestion of contaminated food products [34]. The maximum tolerable level of zearalenone in food, under European Commission regulation (EC) No. 1881/2006, is 75 µg/kg in unprocessed cereals and 50 µg/kg in cereal-based food for infants and young children. Emerging evidence indicates that zearalenone may exhibit immunotoxic, hepatotoxic and potentially carcinogenic effects [35], highlighting the necessity of comprehensive risk assessment and management strategies.
This study aims to provide a guide to developing a lateral flow immunochromatographic assay by elucidating the influence of gold nanoparticle–antibody conjugates and different buffer solutions to obtain an LFIA with better assay sensitivity. The current LFIA designs, while widely used, often face critical limitations that affect the assay sensitivity and reproducibility. A major drawback is the reliance on physical adsorption for antibody conjugation, which can lead to desorption over time and reduced stability under variable storage conditions [36]. Additionally, this method results in random antibody orientation, potentially masking antigen-binding sites and compromising the detection efficiency [37]. Inconsistent conjugation strategies further contribute to batch-to-batch variability [38]. These limitations underscore the need for improved surface modification approaches to enhance the assay robustness and performance. This study addresses these challenges by exploring both approaches to the conjugation of antibodies on gold nanoparticles, the characterization of these conjugates and their performance in lateral flow assay strips, aiming to advance the reliability of LFIA platforms. To compare the efficacy of the attachment of the anti-zearalenone antibody to the surface of AuNPs, immobilization was performed through physical and chemical immobilization. The stability of these bioconjugates was evaluated by creating a hypertonic environment with a high-salt solution. To assess the strength of the bond between the gold nanoparticle surface and antibodies, the conjugates were subjected to a series of washing steps, and, after every step, the change in absorbance was observed. The effective binding of these conjugates was assessed on the test zones of lateral flow immunoassay strips, and the resultant color developed was compared for both prepared AuNP–mAb conjugates in a test for zearalenone toxins. As compared to the other developed LFIA for the detection of mycotoxins [39,40], this assay was more sensitive, having a detection limit of 1 ng/mL. Furthermore, the prepared lateral flow assay strips were optimized with various buffer solutions to yield a valid test result with proper visible control and test lines. Unlike previously published studies [41,42], this work delved deeply into the synthesis and characterization of gold nanoparticle conjugates and systematically optimized critical parameters, including the pH, antibody conjugation and blocking conditions, to enhance the stability of the conjugates. While previous studies have focused on pH and NaCl optimization for gold nanoparticle–antibody conjugates using physical adsorption [41], the current study considered the relative merits of the two immobilization strategies, compared the efficiency of the prepared conjugates on the lateral flow assay strips and optimized the working of the lateral flow assay strips. By correlating the mean pixel intensity and RGB values with the zearalenone concentration, this study paves the way for a novel colorimetric smartphone-based application to enhance the usability of the LFIA.
2. Materials and Methods
N-(2-Hydroxyethyl) piperazine-N′-(2-ethane sulfonic acid) (HEPES) buffer, gold (III) chloride trihydrate (HAuCl4·3H2O), sodium phosphate dibasic (Na2HPO4), sodium hydroxide (NaOH), polyethylene glycol (PEG, molecular weight 2000 g/mol), ethyl(dimethylaminopropyl)carbodiimide (EDC) and N-hydroxy succinimide (NHS) were purchased from Sigma Aldrich, Ireland. Anti-zearalenone [11C9] mouse monoclonal antibody was procured from Abcam Ireland. Deionized water (DI) was produced using an Elix Reference Water Purification System from Millipore, Ireland and was used for the preparation of the solutions used in the study. All chemicals were used as received from the supplier, without further purification or modification.
2.1. Instruments and Data Analysis
UV–visible absorption spectra were measured in the range of 300 to 700 nm by using a Perkin Elmer Lambda 900 UV–visible spectrometer. A Thermo Scientific™ Orion™ 3-Star Benchtop pH Meter (Dublin, Ireland) was used to monitor the pH; the dynamic light scattering (DLS) analysis was performed on a Zetasizer Nano ZS Analyzer from Malvern Instruments (Worcestershire, UK); transmission electron microscopy (TEM) was performed using a JEOL2100; and FT-IR spectroscopy was performed using a Perkin Elmer Spotlight 400N FT-IR UATR spectrometer. Origin 8.5 Pro was used for the UV–visible, DLS and statistical data analyses.
2.2. Synthesis of Gold Nanoparticles
Gold nanoparticles were synthesized via a protocol derived by Sharma et al. [43]. Stock solutions of gold chloride trihydrate (1 mM) and HEPES buffer (10 mM) were prepared in DI water; 100 mM of disodium phosphate (Na2HPO4) solution was also prepared in DI. The reaction ratio of the molar concentration of Na2HPO4 and HEPES was kept at 25:1. The reaction was initiated by adding 500 µL of HEPES buffer solution to 500 µL of gold chloride 1 mM; subsequently, 600 µL of 100 mM of Na2HPO4 was introduced into the reaction mixture. The mixture was kept undisturbed for ~15 min until it changed color to red, indicating the formation of gold nanoparticles. The synthesized AuNPs were characterized by dynamic light scattering (DLS), UV–visible absorption spectroscopy and scanning electron microscopy (SEM).
2.3. Conjugation of AuNPs with Antibodies
2.3.1. Physical Adsorption
A checkerboard titration analysis [21] was conducted to optimize the pH and concentration of the antibody to bind with the AuNPs under ambient conditions. This entailed incubating 150 μL of the AuNPs with a concentration of 2–20 μg/mL of antibodies, at different pH values in the range of 7.5 to 9.0, and measuring the change in optical absorption to determine the optimum pH for the attachment of antibodies. The AuNPs were washed and resuspended in DI water and adjusted to the desired pH using 0.2 M potassium carbonate. Keeping the volume of AuNPs at 150 μL, the concentration of antibodies was varied from 2 to 20 μg/mL. The mixture was incubated at 25 °C for 30 min, after which 200 mM of NaCl prepared in DI water was added to check the stability of the conjugates. Finally, the supernatant was removed through centrifugation (17,620× g RCF for 20 min), and the resultant pellet was washed three times to remove unbound antibodies and later resuspended in a buffer containing 0.1% bovine serum albumin (BSA) and 0.1% sucrose.
2.3.2. Chemical Conjugation
In order to achieve the chemical conjugation of the antibody, the surface modification of the AuNPs was performed by using polyethylene glycol (PEG MW 2000). PEG 2000 was used because, in applications like lateral flow assays, it provides enough passivation to reduce background interference without compromising the signal or analyte binding. The molecule is also long enough to form a layer that keeps the nanoparticles dispersed but not so long to impede functionalization and reduce non-specific interactions [43,44]. Thus, 1 mL of 5% PEG solution was added to the AuNP solution, and the mixture was kept at 25 °C for 4 h at 600 rpm. The modified AuNPs were washed thrice with DI, centrifuged and resuspended in ultrapure water. The bioconjugation of AuNPs was achieved through the EDC/NHS click chemistry method [26]. Briefly, 1.2 mL of surface-functionalized AuNPs was mixed with 20 μL (40 μg) of 2 mg/mL EDC solution, and, after 10 min of mixing, 8 μL (80 μg) of NHS 10 mg/mL was added, and the solution was stirred at 1000 rpm for 30 min. Functionalized AuNPs were washed thrice with DI water and resuspended in the buffer solution. An antibody solution with different concentrations, from 2 to 20 μg/mL, was added to 150 μL of the AuNP solution. After 30 min of stirring at 25 °C, the AuNP–mAb conjugates were washed three times and redispersed in the buffer containing 0.1% of BSA to block the active sites of the nanoparticle surface and prevent the further attachment of biomolecules, along with 0.1% of sucrose, which protected the secondary structures of proteins [39].
The hydrodynamic size and zeta potential of the prepared bioconjugates were measured using DLS, and the UV–visible absorption spectra were recorded before and after the addition of NaCl to check the changes in size and absorption. FT-IR spectroscopy was performed in the range 4000–400 cm−1, using the Perkin Elmer Spotlight FT-IR with a UATR attachment, to confirm the presence of the functional groups after functionalization with polyethylene glycol and EDC-NHS.
2.4. Fabrication and Optimization of Lateral Flow Immunochromatographic Strips
The LFIA strips were assembled using a conjugate pad, nitrocellulose membrane, absorbent pad and sample pad. All pre-treatment and fabrication steps were performed in a clean air flow chamber. The sample and conjugate pad underwent pre-treatment prior to assembly. This pre-treatment is essential for membrane equilibration, preventing the fouling of membrane pores and ensuring the uniform and efficient flow of the sample and conjugate across the membrane [45]. The conjugate pad was immersed in 50 mM PBS buffer solution containing 0.1% BSA, 5% sucrose and 0.05% tween 20 and dried at 60 °C for 1 h. The sample pad and absorbent pad were immersed in 50 mM PBS containing 0.1% BSA, 5% sucrose, 0.01 g sodium azide and 0.05% tween 20 [46]. For the optimization of the performance of AuNP–mAb conjugates, on the nitrocellulose membrane, a test zone was created using ZEN–BSA hapten (Supplementary Figure S1), added at different concentrations from 0.2 mg/mL to 0.8 mg/mL. Then, 10 µL each of AuNP–mAb solution was dropped on the treated conjugate pad and it was dried at 37 °C for 2 h. The assembled strips were then placed in a plastic airtight bag and stored at room temperature for further studies.
After the assessment of the developed conjugates, the strips were again prepared with ZEN–BSA (0.3 mg/mL) as a test line and mouse immunoglobin (IgG) antibodies (0.5 mg/mL) as a control line. The strips were optimized with different buffer solutions with BSA to block the remaining surface of the NC membrane where no antibody was attached. Phosphate, phosphate-buffered saline and borate buffer were used to coat the nitrocellulose membrane to avoid non-specific binding during testing. The optimized blocking buffer was added to the membrane and it was dried at 37 °C. Variable concentrations of zearalenone were prepared at 10-fold serial dilutions in a linear range from 10 µg/mL to 0.1 ng/mL in a methanol–water (70:30) mixture. The spiked samples were mixed with borate buffer for ease of flow across the LFIA strips. The calibration curve was plotted by taking the color intensity ratio of the test line (T) and control line (T0) on the y axis, with the concentration of zearalenone on the x axis. The samples at different concentrations were measured in triplicate, and the limit of detection (LOD) was calculated as the mean signal of blank samples plus three times their standard deviation (LOD = mean (blank) + 3 × SD (blank)). The limit of quantification (LOQ) was determined as the concentration corresponding to the blank signal plus ten times its standard deviation (LOQ = mean (blank) + 10× SD (blank)) [47], calculated using the calibration curve. The color developed was monitored after 10 min, and images were captured under white light. The mean intensity of the test line was quantified using the ImageJ software and plotted against the zearalenone concentration. Similarly red, green and blue pixels were also obtained and plotted against the zearalenone concentration.
The developed LFIA was also analyzed based on its sensitivity with other two toxins, Aflatoxin B1 and Fumonisin. For all mycotoxins, the concentration was 10 ng/mL in a methanol–water solution. The LFIA images are shown in Supplementary Figure S2. The prepared strips were analyzed for their storage stability for a period of one month. After every 2 weeks, the strips were subjected to testing via both control and positive samples to check whether there were any issues or changes in the color intensity of the test line and control line (Supplementary Figure S3). The assembled strips were stored at room temperature in a sealed plastic polybag for further use.
3. Results
3.1. Synthesis of Gold Nanoparticles and Assessment of Their Critical Aggregation Under High NaCl Hypertonic Concentrations
AuNPs of size 20–25 nm were synthesized using the protocol described by Liu et al. [48]. The UV–visible absorption spectrum was recorded in the range of 400 nm to 700 nm, which confirmed the absorbance peak at 530 nm for the formation of AuNPs, as shown in Figure 2a. The hydrodynamic diameter measured using DLS revealed a size of 22 ± 3 nm, as shown in Figure 2b, with a zeta potential of −31.7 mV, indicating good colloidal stability [48]. The critical NaCl concentration to induce the aggregation of the AuNPs in solution was investigated by varying the concentration of NaCl from 10 to 200 mM (Figure 2c). After successfully keeping the gold nanoparticles in the NaCl solution for 15 min, their changes in color and size were evaluated. At low concentrations, i.e., from 20 to 100 mM of NaCl, there was no change in the color of the AuNP solution. A slight color change was observed (Figure 2d) at 150 mM, but, at 200 mM, the solution exhibited a distinctly grey color, indicative of AuNP aggregation. Although the original peak at ~530 nm is still evident in the spectrum in Figure 2c, a broad redshifted absorption band is evident, in the region of 600–700 nm, which was responsible for the observed color change.
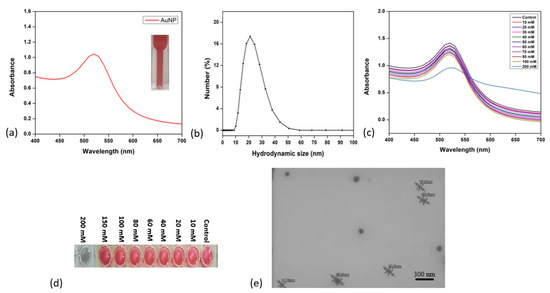
Figure 2.
Characterization of HEPES-reduced gold nanoparticles. (a) UV–visible absorbance spectra of AuNPs; (b) dynamic light scattering analysis; (c) gold nanoparticles with different concentrations of NaCl (20–400 Mm); (d) AuNPs’ colors with different concentrations of NaCl; (e) scanning electron micrographs of AuNPs.
The A630/530 absorption peak ratio (Supplementary Figure S4) increased with the increase in the salt concentration, showing the gold nanoparticles’ aggregation. The hydrodynamic diameter increased from 22 nm to 350 nm in the presence of a high-NaCl hypertonic solution, which confirmed the aggregation of the AuNPs (Supplementary Figure S5). Therefore, in order to evaluate the stability and aggregation behavior of the prepared AuNP–mAb conjugates, a concentration of 200 mM NaCl was considered critical, such that, up to this concentration, the AuNP–mAb conjugates should be stable, and an increase above this concentration was employed to probe the stability. The morphology of the synthesized AuNPs was analyzed using TEM by drop-casting a concentrated solution of AuNPs onto copper grids, which indicated uniform particles with a monodispersed size distribution of 20 ± 4 nm (Figure 2e).
3.2. Surface Modification of Gold Nanoparticles
AuNPs were surface-modified with polyethylene glycol (PEG molecular weight 2000 g/mol), using 1%, 2.5% and 5% (w/v) of PEG to cap the AuNPs. Among the different concentrations of PEG 2000, the sample with a concentration of 5% (w/v) was used for antibody immobilization due to its stability and its polydispersity index of 0.321, showing moderate polydispersity (Table 1). The zeta potential of the AuNPs also decreased from −31 mV to −16 mV because of steric shielding [49,50]. An increase in hydrodynamic size was observed, indicating the presence of a polymer coating on the nanoparticle surface. Based on these data, as a result of PEG attachment, it could be deduced that the PEG chains on the surfaces of the AuNPs had adopted a somewhat extended coil conformation, as suggested by reference [51].

Table 1.
Dynamic light scattering data for PEG 2000-coated AuNPs.
In samples containing 1% and 2.5% of PEG, aggregation was observed through the changes in the hydrodynamic size and polydispersity index of 0.82 and 0.64, respectively. The functional groups present on the surfaces of PEG-functionalized AuNPs were analyzed by FT-IR spectroscopy, as shown in Figure 3. The characteristic peak at 1085 cm−1 is derived from C-O-C stretch vibrations, while that at 1634 cm−1 is from C=O stretching, and the peak at 3294 cm−1 corresponds to O-H stretching. The crosslinking agent EDC/NHS also exhibits its characteristic peaks at 1500 cm−1, showing the transformation of the -COOH group to an amide group, along with the presence of an amide II band at 1472 cm−1 and amide III at 1242 cm−1. These bands confirm the presence of functional linkers on the surfaces of AuNPs for effective conjugation with antibodies.
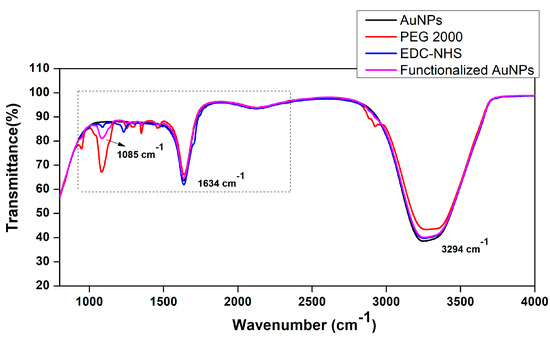
Figure 3.
FT-IR spectra of the functionalized AuNPs with polyethylene glycol and EDC-NHS, recorded in the range of 400–4000 cm−1.
3.3. Conjugation of Anti-Zearalenone Antibodies with AuNPs
3.3.1. Physical Adsorption
The optimal pH for the gold nanoparticle solution, at which minimal changes were observed in both the optical density at 530 nm and the color for antibody conjugation, was pH 8, as shown in Figure 4a. After adding antibody solutions ranging from 2 to 20 μg/mL, the change in OD at 530 nm before and after adding the NaCl solution was plotted, as shown in Figure 4b, to identify the differences. During the physical adsorption process, for different concentrations of antibodies in the range of 2–20 μg/mL, a fixed concentration of AuNPs was added, resulting in a continuous shift in the UV–visible absorption maximum from 530 nm (control) to 541 nm at 20 μg/mL (Figure 4c,d). This redshift occurred due to the change in the refractive index of the particle’s surroundings [46], and this was caused by the conjugation of the antibodies on the biochemical corona layer on the particle surface.
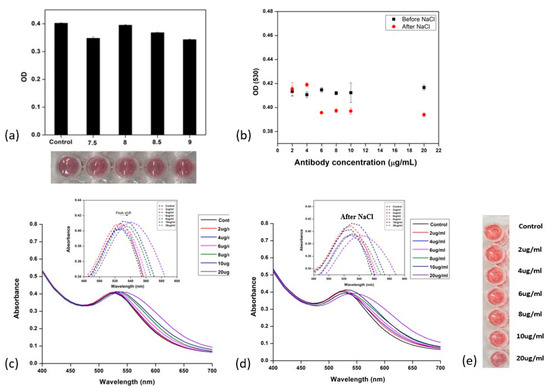
Figure 4.
Direct adsorption of anti-zearalenone antibody on AuNPs. (a) Determination of optimum pH for antibody attachment (OD) (530)—antibody concentration was kept at 4 µg/mL; (b) change in OD (530) with different concentrations of anti-zearalenone, i.e., from 2 to 20 µg/mL, before and after adding NaCl (200 Mm); (c) UV–visible spectroscopy for different concentrations of anti-zearalenone (without NaCl); (d) UV–visible spectroscopy for different concentrations of anti-zearalenone (with NaCl); (e) AuNPs with different concentrations of anti-zearalenone antibody, 2–20 µg/mL.
In the case of the physical attachment of the antibodies on AuNPs, the hydrodynamic size (Figure 4e) of the AuNP–mAb conjugates increased from 22 nm to 180–200 nm as the concentration of antibodies increased.
A slight change in the color of the AuNP–mAb solution was observed as the concentration of antibodies in the solution was increased from 2 μg/mL to 10 μg/mL, and, at 20 μg/mL, the mixture turned dark pink (Figure 4e) due to strong electrostatic interactions between the antibodies and the AuNPs [46]. The absorbance value increased when antibodies were added at the concentrations of 2 and 4 μg/mL, which was observed as an increase in the peak height. The physical adsorption of antibodies on the AuNP surface is a result of electrostatic and hydrophobic interactions. However, some of the interaction can be disturbed by mechanical agitation, such as ultrasonication, which can lead to the loss of biomolecular activity [52]. The excessive introduction of antibodies in the colloidal reaction mixture can lead to an increase in the thickness of the biochemical coating on the particle surface. It can be elucidated that the layer of Ab attached closest to the surface of the AuNPs is strongly attached, becoming part of the hard protein corona on the AuNP surface. The outer soft coronae on the surfaces of the AuNPs are based on protein-to-protein interactions and can be easily removed or dismantled during nanoparticle washing or buffer exchange steps [53,54].
It has been shown that, on increasing the incubation time during physical adsorption, the Ab conjugated on the AuNP surface will undergo reorientation and rearrangement, leading to a more thermodynamically stable interaction [55]. The AuNP–mAb interactions can be reversed by the deprotonation of the antibody, as this electrostatic interaction results in a loosely attached corona [19]. A thorough study of the AuNP–protein (including antibody) interactions has been conducted to elucidate the underlying principles and shed light on the process of formation of protein coronae via direct adsorption methods. These works suggest that (i) long-range electrostatic attraction drives the interaction between antibodies in the outer layer and the surfaces of gold nanoparticles [56,57]; (ii) S-Au bonds form between the cysteine residues of antibodies, and AuNPs are formed when they are incubated for a longer period of time [58]. According to the extended Derjaguin–Landau–Verwey–Overbeek (xDLVO) theory, when proteins are bound to surfaces, the competitive interactions between electrostatic repulsive forces and van der Waals attractive forces affect the conjugate’s stability [59]. Moreover, it is evident from some studies that proteins might cause nanoparticle aggregation through an electrostatic bridging process; as more nanoparticles become interconnected through these protein bridges, an aggregation process begins [60]. These aggregates grow as more nanoparticles and proteins participate in the bridging, leading to the formation of larger clusters of nanoparticles [61]. The non-covalent interaction requires a high concentration of antibodies [37]. The random orientation of antibodies makes the analyte–antibody biological response difficult to control, because it does not confirm the exposure of the receptor surface, which leads to the reduced sensitivity of the analytical device [62].
3.3.2. Chemical Conjugation
This type of conjugation involves a chemical process to link antibodies to the surfaces of AuNPs to ensure the stability and functionality of the conjugates, which play a significant role in the reproducibility of the assays’ results and the detection of smaller amounts of toxins. As compared to physical adsorption, there was no noticeable change in the color of the functionalized AuNPs when the antibody concentration was increased along with the functional linkers present on the surface. Antibody binding through linkage was confirmed by measuring the change in the UV–visible absorption spectra before and after antibody attachment. The absorption peak showed a redshift after the particle surface was covered by antibodies (Figure 5a).
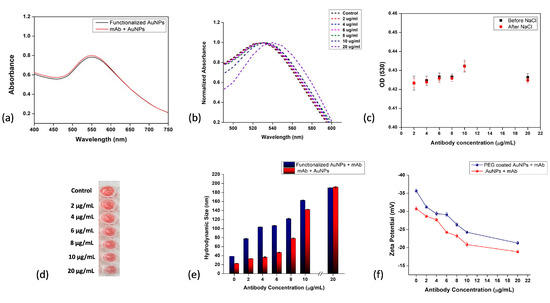
Figure 5.
Covalent immobilization of AuNP–antibody conjugates. (a) UV–visible spectroscopy of EDC/NHS-functionalized AuNPs and antibody-attached AuNPs after functionalization; (b) UV–visible spectroscopy of AuNP–mAb conjugates after adding NaCl; (c) change in OD (530) with different concentrations of anti-zearalenone, i.e., from 2 to 20 µg/mL, before and after adding NaCl (200 Mm); (d) functionalized AuNPs with different concentrations of anti-zearalenone antibody, 2–20 µg/mL; (e) changes in hydrodynamic size after adding antibodies (2–20 µg/mL); (f) changes in zeta potential of AuNP–mAb conjugates.
Replacing the functional groups present on the AuNPs before binding with the carboxylic acid group for effective attachment to EDC/NHS linkers has further advantages in terms of binding antibodies strongly by creating a stable conjugate bond. The addition of BSA to the colloidal antibody reaction mixture as a blocking agent further caused a slight redshift of 1 to 5 nm at every antibody concentration due to the increased volume of antibodies immobilizing on the particle surface (Figure 5b). The change in OD at 530 nm before and after adding NaCl to the conjugate solution was plotted, as shown in Figure 5c, and only a very minute change in the OD was observed. Figure 5d shows the change in the color of the AuNP–mAb solution with increasing concentrations of antibodies from 2 to 20 μg/mL. At the highest concentration of antibodies, i.e., 20 μg/mL, the UV–visible absorption curve showed a shift from 530 nm to 540 nm, which is shown in Figure 5b. The hydrodynamic diameter (Figure 5e) of the functionalized AuNPs (PEG + EDC/NHS) changed from 38 ± 3 nm to 77 ± 1 nm when an antibody solution of 2 μg/mL was added. This change was constant throughout when increasing the antibody concentration to 20 μg/mL, at which stage the hydrodynamic size reached 190 ± 3.05 nm. The change in the zeta potential, indicated in Figure 5f, is a measure of the change in the surface charge on the AuNPs, ranging from −35.6 mV to −29 mV and to −21 mV after the immobilization of the antibodies. Figure 5e,f compare the changes in the hydrodynamic size and zeta potential when the antibodies were adsorbed directly and immobilized covalently.
3.4. Stability of Conjugates
The stability of the prepared AuNP–mAb conjugates from both methods was investigated by observing the change in the absorbance of the conjugates after a sequence of washing steps. The antibody concentration used was 1–7 μg/mL, and the particles were washed and resuspended in the buffer solution. The change in absorbance was taken after the first and third washes, as depicted in Figure 6. In the case of physical adsorption, the absorbance was reduced after the vigorous washing steps, which could have been the result of the removal of antibodies from the particle surface, leading to the aggregation of the AuNPs. In contrast, a very minute change was observed in the case of chemical conjugation, indicating higher stability and more robust bonding between the AuNPs and antibodies.
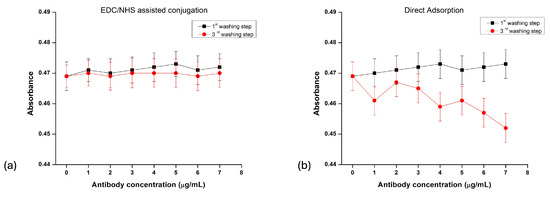
Figure 6.
Absorbance of gold nanoparticle–antibody conjugates upon washing with buffer solution. (a) Chemically (EDC/NHS) functionalized conjugation; (b) physical adsorption.
The use of chemical linkage chemistry between AuNPs and antibodies has a greater advantage over direct adsorption in synthesizing conjugates with oriented antibodies, which are attached through Fc regions from the counterparts and are more accessible for linkage through other biomolecules when used for sensing applications [63]. This kind of attachment needs fewer antibodies for binding, which will eventually reduce the overall cost of the assay when produced in bulk for commercialization. It was confirmed that the chemical conjugations provided stable conjugates with high specificity. However, the detection of the analyte and their roles in improving the sensitivity of the lateral flow assay for antigen binding require further investigation.
3.5. Comparison of Color Intensity of Conjugates on LFIA Strips
Once synthesized, the bioconjugates were evaluated using fabricated lateral flow assay strips by confirming their association with a test zone containing ZEN–BSA hapten and an assessment of the resultant color intensity. The UV–visible spectroscopy analysis of ZEN–BSA hapten is shown in Supplementary Figure S3. ZEN–BSA was dispensed as a dot at different concentrations from 0.2 to 0.8 mg/mL on multiple strips to check the binding of the conjugates. Both conjugates were dropped on the conjugate pad, and the assay was performed with a buffer solution with no toxin present to check the affinity with ZEN–BSA, as shown in Figure 7a,b. The developed color intensity was analyzed by ImageJ and was plotted with different concentrations of hapten, as shown in Figure 7c. On examining the color intensity, chemically immobilized antibodies were seen to yield better results than physically immobilized ones, as the color intensity was higher in each case, as shown in Figure 7. The intensity of the color was calculated using its RGB values analyzed through ImageJ [64,65]. The formula for the calculation of the pixel intensity was
where I is the intensity of the color, and R, G and B are the red, green and blue components of the color.
I = 0.2989 × R + 0.5870 × G + 0.114 × B
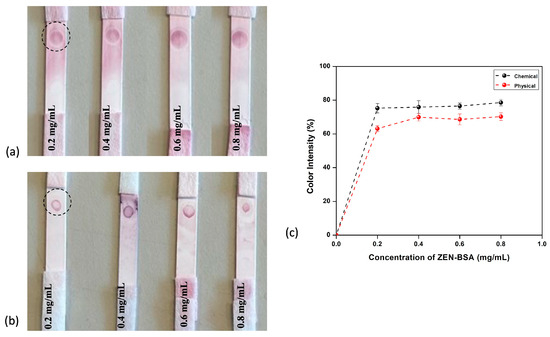
Figure 7.
(a) LFIA strips developed using chemically conjugated AuNP–mAb; (b) physical conjugation; and (c) comparison of color intensity developed in both cases.
3.6. Analytical Performance of Lateral Flow Immunochromatographic Strips
For the optimum results, different buffer solutions were optimized to block the nitrocellulose membrane after the deposition of the control and test lines. Blocking was carried out using phosphate buffer, phosphate-buffered saline and borate buffer with BSA to block the remaining surface. Optimal sample flow with the conjugate and the clear development of the test line and control lines (Figure 8a), free from background staining, were achieved by blocking BSA in 0.01 M borate buffer, which was further used to block the membrane, as shown in Figure 8b. Borate buffer was selected because it maintained the colloidal stability of the gold nanoparticle–antibody conjugates and minimized non-specific binding, which in turn reduces background noise, enhancing the clarity and accuracy of the results. On the other hand, the use of phosphate buffer is linked to increased aggregation, leading to higher background signals, reduced assay sensitivity, the fading of test lines and increased non-specific binding [66,67]. The developed strips were checked for the limit of detection (LOD) using the spiked samples over the range of 10 µg/mL to 0.1 ng/mL. There was no test line observed down to a concentration of 1 ng/mL, but, as the concentration was reduced to 0.1 ng/mL, there was a slight color developed, which could be seen by the naked eye, as shown in Figure 8c. The visual LOD was determined by the minimum concentration of toxin used that led to color development on the test line as visualized by the naked eye. The captured images of the LFIA strips were uploaded to the ImageJ software to analyze the white color mean intensity of the test line plotted against the zearalenone concentration, which showed a decrease in color intensity in the control sample as compared to the positive samples shown in in Figure 8d with decreasing concentrations.
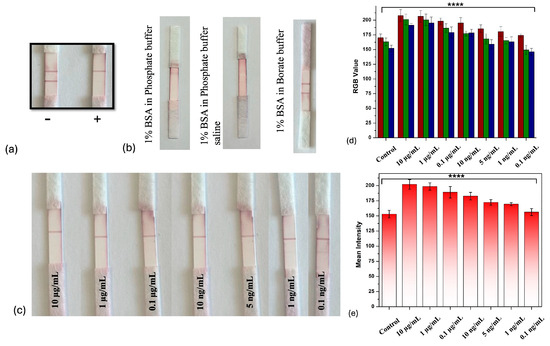
Figure 8.
(a) LFIA strip with positive and negative sample; (b) optimization of buffer solutions with BSA; (c) test run results on strips with concentrations from 10 µg/mL to 0.1 ng/mL; (d) ImageJ software test line RGB value compared against different concentrations of zearalenone; (e) mean intensity of test line compared against different zearalenone concentrations. ****, p < 0.0001.
In the color spectrum, RGB values tend towards a minimum value 0 for black and a maximum of 255 for white. It was observed that the RGB values plotted with the zearalenone concentration (Figure 8e) were higher in the case of the concentration of 10 µg/mL and slowly decreased at the concentration of 0.1 ng/mL, which indicated the slight formation of a color on the test line. The developed LFIA sensor achieved a very low LOD compared to other previous works (Table 2). Figure 9a shows the calibration curve for zearalenone, in which the color response T, relative to the unexposed response T0, is plotted as a function of the exposure concentration (C), in the range of 0.1–10,000 ng/mL. As the concentration of the analyte increases, the intensity of the test line decreases, due to the binding to the substrate receptors. This binding should follow a Langmuir isotherm-like [68] behavior, although other factors should be considered, such as the amount of gold nanoparticle–antibody conjugate binding to the control line, where IgG is present. The T/T0 plots in Figure 9a can be well fitted with a Hill-like equation of the form
where x(0) is the unexposed value of T/T0; x(sat) is the high-concentration, saturated value; n is the Hill slope; and K is the equivalent of the Langmuir constant. In the fit in Figure 9a, plotted semi-logarithmically in Figure 9b for the better visualization of the lower-concentration region, n = 0.29 and K = 20.1 ng/mL. Based on the methodology described in Section 2.4, the LOD was calculated to be 0.71 ng/mL, while the visual LOD was 1 ng/mL. The LOQ was calculated to be 2.37 ng/mL. The LOD achieved for the detection of zearalenone as compared to other developed strips is much lower [69,70], and it can provide both qualitative and quantitative results.
f(x) = x(0) + (x(sat) − x (0)) × Cn/(Kn + Cn)
Table 2.
Comparison of the developed LFIA sensor with previous work.
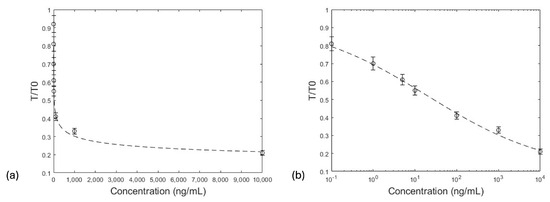
Figure 9.
Color response of the LFIA, T, relative to the unexposed response, T0, plotted (linear–linear (a), linear–logarithmic (b)) as a function of the exposure concentration (C) for zearalenone. Error bars represent the standard deviation as each concentration was analyzed in triplicate (n = 3).
The results of the analysis of the response to two different toxins, Aflatoxin B1 and Fumonisin, are shown in Supplementary Figure S2. The presence of a test line signature for only zearalenone and not the other two shows the specificity of the developed LFIA. The strips were also seen to be stable for a period of one month, as there was no change in the intensity of the control line and test line when stored, as shown in Supplementary Figure S3. Therefore, the developed LFIA can be considered a useful and cost-effective tool for the detection of mycotoxins in food samples.
4. Conclusions
This study demonstrates the development of a lateral flow immunochromatographic assay using a AuNP-labeled antibody probe for the rapid and sensitive detection of zearalenone. The detection limit of this portable, cost-effective device is 0.71 ng/mL for zearalenone-spiked sample solutions, and the limit of quantification is 2.37 ng, which is much lower than the regulated limits under European Commission regulation (EC) No. 1881/2006. The mean peak intensity and RGB value were plotted against the concentration of zearalenone to verify the results, and it can be further used in smartphone detection applications. The application of the chemically conjugated AuNP–mAb in LFIA strips yielded better results and developed a color on the test zone as compared to the physical conjugation of antibodies. These findings address critical challenges in the synthesis of robust gold nanoparticle–antibody conjugates, particularly for applications in lateral flow immunoassays and other biosensing devices. The optimization of the LFIA strips with different buffer solutions and stable gold nanoparticle–antibody conjugates enhanced the assay sensitivity, thereby improving the reliability and accuracy of the LFIA. LFIAs are highly scalable due to their low cost per test, minimal instrumentation needs and compatibility with roll-to-roll manufacturing processes. Their simple design allows for mass production using automated dispensing and lamination equipment, enabling rapid scale-up. In terms of practical validation, LFIAs have been successfully applied to detect mycotoxins like aflatoxins and deoxynivalenol in complex matrices, such as maize and wheat extracts. These tests often demonstrate strong correlations with HPLC, LC-MS/MS data, confirming their reliability for on-site screening. Their robustness, speed and user-friendliness make them ideal for food safety monitoring in field or processing environments. Future research should focus on sample matrix effects, which can significantly influence the assay’s performance and validation in real samples, in order to assess potential interferences, recovery and practical applicability. This would enable the further refinement of these methods and the exploration of their applicability to a broader range of mycotoxins.
Supplementary Materials
The following supporting information can be downloaded at: https://www.mdpi.com/article/10.3390/chemengineering9030054/s1, Figure S1: UV-Visible spectroscopic analysis of prepared ZEN-BSA conjugate, Figure S2: Specificity of the developed lateral flow strips against other mycotoxins Aflatoxin B1 and Fumonisin, Figure S3: Stability of the fabricated strips for one month, Figure S4: Ratio of absorbance peak of A630/530 nm in case of detecting optimum NaCl concentration from 20–400 Mm. Figure S5: Aggregation of gold nanoparticles in the presence of high alkaline solution i.e. 400 Mm as compared to normal dispersed particles.
Author Contributions
Conceptualization, methodology, software, V.S.; validation, B.J., H.J.B., and F.T.; formal analysis, V.S. and F.T.; investigation, V.S.; resources, V.S. and F.T.; data curation, V.S., B.J., and H.J.B.; writing—original draft preparation, V.S., B.J., H.J.B., and F.T.; writing—review and editing, F.T. and H.J.B.; supervision, V.S. and F.T.; project administration, F.T.; funding acquisition, V.S. and F.T. All authors have read and agreed to the published version of the manuscript.
Funding
This research was funded by the Irish Research Council (IRC) via postgraduate scholarship GOIPG/2021/978.
Institutional Review Board Statement
Not applicable.
Informed Consent Statement
Not applicable.
Data Availability Statement
Data are contained within the article.
Conflicts of Interest
The authors declare no conflicts of interest.
References
- Anater, A.; Manyes, L.; Meca, G.; Ferrer, E.; Luciano, F.B.; Pimpão, C.T.; Font, G. Mycotoxins and their consequences in aquaculture: A review. Aquaculture 2016, 451, 1–10. [Google Scholar] [CrossRef]
- Bräse, S.; Encinas, A.; Keck, J.; Nising, C.F. Chemistry and Biology of Mycotoxins and Related Fungal Metabolites. Chem. Rev. 2009, 109, 3903–3990. [Google Scholar] [CrossRef]
- da Rocha, M.E.B.; da Chagas Oliveira Freire, F.; Feitosa Maia, F.E.; Florindo Guedes, M.I.; Rondina, D. Mycotoxins and their effects on human and animal health. Food Control 2014, 36, 159–165. [Google Scholar] [CrossRef]
- Maragos, C.; Busman, M. Rapid and advanced tools for mycotoxin analysis: A review. Food Addit. Contam. Part A 2010, 27, 688–700. [Google Scholar] [CrossRef]
- Verma, M.S.; Rogowski, J.L.; Jones, L.; Gu, F.X. Colorimetric biosensing of pathogens using gold nanoparticles. Biotechnol. Adv. 2015, 33, 666–680. [Google Scholar] [CrossRef]
- Yang, J.; Wang, K.; Xu, H.; Yan, W.; Jin, Q.; Cui, D. Detection platforms for point-of-care testing based on colorimetric, luminescent and magnetic assays: A review. Talanta 2019, 202, 96–110. [Google Scholar] [CrossRef] [PubMed]
- Sun, J.; Lu, Y.; He, L.; Pang, J.; Yang, F.; Liu, Y. Colorimetric sensor array based on gold nanoparticles: Design principles and recent advances. TrAC Trends Anal. Chem. 2020, 122, 115754. [Google Scholar] [CrossRef]
- Nejati, K.; Dadashpour, M.; Gharibi, T.; Mellatyar, H.; Akbarzadeh, A. Biomedical Applications of Functionalized Gold Nanoparticles: A Review. J. Clust. Sci. 2021, 33, 1–16. [Google Scholar] [CrossRef]
- Zhao, W.; Brook, M.A.; Li, Y. Design of Gold Nanoparticle-Based Colorimetric Biosensing Assays. ChemBioChem 2008, 9, 2363–2371. [Google Scholar] [CrossRef]
- Saha, K.; Agasti, S.S.; Kim, C.; Li, X.; Rotello, V.M. Gold Nanoparticles in Chemical and Biological Sensing. Chem. Rev. 2012, 112, 2739–2779. [Google Scholar] [CrossRef]
- Sapsford, K.E.; Algar, W.R.; Berti, L.; Gemmill, K.B.; Casey, B.J.; Oh, E.; Stewart, M.H.; Medintz, I.L. Functionalizing Nanoparticles with Biological Molecules: Developing Chemistries that Facilitate Nanotechnology. Chem. Rev. 2013, 113, 1904–2074. [Google Scholar] [CrossRef]
- Dallari, C.; Capitini, C.; Calamai, M.; Trabocchi, A.; Pavone, F.S.; Credi, C. Gold Nanostars Bioconjugation for Selective Targeting and SERS Detection of Biofluids. Nanomaterials 2021, 11, 665. [Google Scholar] [CrossRef] [PubMed]
- Saha, B.; Evers, T.H.; Prins, M.W.J. How Antibody Surface Coverage on Nanoparticles Determines the Activity and Kinetics of Antigen Capturing for Biosensing. Anal. Chem. 2014, 86, 8158–8166. [Google Scholar] [CrossRef] [PubMed]
- Saha, B.; Songe, P.; Evers, T.H.; Prins, M.W.J. The influence of covalent immobilization conditions on antibody accessibility on nanoparticles. Analyst 2017, 142, 4247–4256. [Google Scholar] [CrossRef]
- Kausaite-Minkstimiene, A.; Ramanaviciene, A.; Kirlyte, J.; Ramanavicius, A. Comparative Study of Random and Oriented Antibody Immobilization Techniques on the Binding Capacity of Immunosensor. Anal. Chem. 2010, 82, 6401–6408. [Google Scholar] [CrossRef]
- Joshi, P.P.; Yoon, S.J.; Hardin, W.G.; Emelianov, S.; Sokolov, K.V. Conjugation of Antibodies to Gold Nanorods through Fc Portion: Synthesis and Molecular Specific Imaging. Bioconjugate Chem. 2013, 24, 878–888. [Google Scholar] [CrossRef]
- Taghipour, Y.D.; Kharrazi, S.; Amini, S.M. Antibody conjugated gold nanoparticles for detection of small amounts of antigen based on surface plasmon resonance (SPR) spectra. Nanomed. Res. J. 2018, 3, 102–108. [Google Scholar] [CrossRef]
- Okyem, S.; Awotunde, O.; Ogunlusi, T.; Riley, M.B.; Driskell, J.D. Probing the Mechanism of Antibody-Triggered Aggregation of Gold Nanoparticles. Langmuir 2021, 37, 2993–3000. [Google Scholar] [CrossRef]
- van der Heide, S.; Russell, D.A. Optimisation of immuno-gold nanoparticle complexes for antigen detection. J. Colloid Interface Sci. 2016, 471, 127–135. [Google Scholar] [CrossRef]
- Di Nardo, F.; Cavalera, S.; Baggiani, C.; Giovannoli, C.; Anfossi, L. Direct vs Mediated Coupling of Antibodies to Gold Nanoparticles: The Case of Salivary Cortisol Detection by Lateral Flow Immunoassay. ACS Appl. Mater. Interfaces 2019, 11, 32758–32768. [Google Scholar] [CrossRef]
- Byzova, N.A.; Safenkova, I.V.; Slutskaya, E.S.; Zherdev, A.V.; Dzantiev, B.B. Less is More: A Comparison of Antibody–Gold Nanoparticle Conjugates of Different Ratios. Bioconjugate Chem. 2017, 28, 2737–2746. [Google Scholar] [CrossRef]
- Fagúndez, P.; Botasini, S.; Tosar, J.P.; Méndez, E. Systematic process evaluation of the conjugation of proteins to gold nanoparticles. Heliyon 2021, 7, e07392. [Google Scholar] [CrossRef]
- Lin, P.-C.; Chen, S.-H.; Wang, K.-Y.; Chen, M.-L.; Adak, A.K.; Hwu, J.-R.R.; Chen, Y.-J.; Lin, C.-C. Fabrication of Oriented Antibody-Conjugated Magnetic Nanoprobes and Their Immunoaffinity Application. Anal. Chem. 2009, 81, 8774–8782. [Google Scholar] [CrossRef] [PubMed]
- Duval, F.; van Beek, T.A.; Zuilhof, H. Key steps towards the oriented immobilization of antibodies using boronic acids. Analyst 2015, 140, 6467–6472. [Google Scholar] [CrossRef] [PubMed]
- Ngernpimai, S.; Srijampa, S.; Thongmee, P.; Teerasong, S.; Puangmali, T.; Maleewong, W.; Chompoosor, A.; Tippayawat, P. Insight into the Covalently Oriented Immobilization of Antibodies on Gold Nanoparticle Probes to Improve Sensitivity in the Colorimetric Detection of Listeria monocytogenes. Bioconjugate Chem. 2022, 33, 2103–2112. [Google Scholar] [CrossRef]
- Tan, G.; Kantner, K.; Zhang, Q.; Soliman, M.G.; Del Pino, P.; Parak, W.J.; Onur, M.A.; Valdeperez, D.; Rejman, J.; Pelaz, B. Conjugation of Polymer-Coated Gold Nanoparticles with Antibodies—Synthesis and Characterization. Nanomaterials 2015, 5, 1297–1316. [Google Scholar] [CrossRef] [PubMed]
- Eck, W.; Craig, G.; Sigdel, A.; Ritter, G.; Old, L.J.; Tang, L.; Brennan, M.F.; Allen, P.J.; Mason, M.D. PEGylated Gold Nanoparticles Conjugated to Monoclonal F19 Antibodies as Targeted Labeling Agents for Human Pancreatic Carcinoma Tissue. ACS Nano 2008, 2, 2263–2272. [Google Scholar] [CrossRef]
- Milan, J.; Niemczyk, K.; Kus-Liśkiewicz, M. Treasure on the Earth—Gold Nanoparticles and Their Biomedical Applications. Materials 2022, 15, 3355. [Google Scholar] [CrossRef]
- Yang, J.; Wang, X.; Sun, Y.; Chen, B.; Hu, F.; Guo, C.; Yang, T. Recent Advances in Colorimetric Sensors Based on Gold Nanoparticles for Pathogen Detection. Biosensors 2022, 13, 29. [Google Scholar] [CrossRef]
- Filbrun, S.L.; Filbrun, A.B.; Lovato, F.L.; Oh, S.H.; Driskell, E.A.; Driskell, J.D. Chemical modification of antibodies enables the formation of stable antibody–gold nanoparticle conjugates for biosensing. Analyst 2017, 142, 4456–4467. [Google Scholar] [CrossRef]
- Retout, M.; Jabin, I.; Bruylants, G. Synthesis of Ultrastable and Bioconjugable Ag, Au, and Bimetallic Ag_Au Nanoparticles Coated with Calix[4]arenes. ACS Omega 2021, 6, 19675–19684. [Google Scholar] [CrossRef]
- Bennett, J.W.; Klich, M. Mycotoxins. Clin. Microbiol. Rev. 2003, 16, 497–516. [Google Scholar] [CrossRef]
- Ropejko, K.; Twarużek, M. Zearalenone and Its Metabolites—General Overview, Occurrence, and Toxicity. Toxins 2021, 13, 35. [Google Scholar] [CrossRef]
- Zsarnovszky, A.; Kiss, D.; Jocsak, G.; Nemeth, G.; Toth, I.; Horvath, T.L. Thyroid hormone- and estrogen receptor interactions with natural ligands and endocrine disruptors in the cerebellum. Front. Neuroendocr. 2018, 48, 23–36. [Google Scholar] [CrossRef] [PubMed]
- Zhang, G.-L.; Feng, Y.-L.; Song, J.-L.; Zhou, X.-S. Zearalenone: A Mycotoxin With Different Toxic Effect in Domestic and Laboratory Animals’ Granulosa Cells. Front. Genet. 2018, 9, 667. [Google Scholar] [CrossRef] [PubMed]
- Zhang, L.; Mazouzi, Y.; Salmain, M.; Liedberg, B.; Boujday, S. Antibody-Gold Nanoparticle Bioconjugates for Biosensors: Synthesis, Characterization and Selected Applications. Biosens. Bioelectron. 2020, 165, 112370. [Google Scholar] [CrossRef] [PubMed]
- Lu, Z.-Y.; Chan, Y.-H. The importance of antibody orientation for enhancing sensitivity and selectivity in lateral flow immunoassays. Sensors Diagn. 2024, 3, 1613–1634. [Google Scholar] [CrossRef]
- Wu, S.; Liu, L.; Duan, N.; Li, Q.; Zhou, Y.; Wang, Z. Aptamer-Based Lateral Flow Test Strip for Rapid Detection of Zearalenone in Corn Samples. J. Agric. Food Chem. 2018, 66, 1949–1954. [Google Scholar] [CrossRef]
- Jin, Y.; Chen, Q.; Luo, S.; He, L.; Fan, R.; Zhang, S.; Yang, C.; Chen, Y. Dual near-infrared fluorescence-based lateral flow immunosensor for the detection of zearalenone and deoxynivalenol in maize. Food Chem. 2021, 336, 127718. [Google Scholar] [CrossRef]
- Duong, N.-D.; Nguyen-Phuoc, K.-H.; Do, K.-Y.T.; Mai-Hoang, T.-D.; Nguyen, N.-T.T.; Tran, T.L.; Tran-Van, H. A Protocol for the Optimization of Lateral Flow Immunoassay Strip Development. Biomed. Res. Ther. 2023, 10, 5500–5508. [Google Scholar] [CrossRef]
- Parolo, C.; Sena-Torralba, A.; Bergua, J.F.; Calucho, E.; Fuentes-Chust, C.; Hu, L.; Rivas, L.; Álvarez-Diduk, R.; Nguyen, E.P.; Cinti, S.; et al. Tutorial: Design and fabrication of nanoparticle-based lateral-flow immunoassays. Nat. Protoc. 2020, 15, 3788–3816. [Google Scholar] [CrossRef]
- Sharma, V.; Javed, B.; Estrada, G.; Byrne, H.J.; Tian, F. In situ tuning and investigating the growth process of size controllable gold nanoparticles and statistical size prediction analysis. Colloids Surfaces A Physicochem. Eng. Asp. 2023, 681, 132733. [Google Scholar] [CrossRef]
- Ye, J.; Chen, Z.; Chen, W.; Zhao, Y.; Ding, C.; Huang, Y. Gold Nanoparticles Coated with Silica Shells as High-Performance Fluorescence Nanoprobe. ACS Appl. Nano Mater. 2024, 7, 5543–5553. [Google Scholar] [CrossRef]
- Zhang, G.; Yang, Z.; Lu, W.; Zhang, R.; Huang, Q.; Tian, M.; Li, L.; Liang, D.; Li, C. Influence of anchoring ligands and particle size on the colloidal stability and in vivo biodistribution of polyethylene glycol-coated gold nanoparticles in tumor-xenografted mice. Biomaterials 2009, 30, 1928–1936. [Google Scholar] [CrossRef] [PubMed]
- Butreddy, A.; Janga, K.Y.; Ajjarapu, S.; Sarabu, S.; Dudhipala, N. Instability of therapeutic proteins—An overview of stresses, stabilization mechanisms and analytical techniques involved in lyophilized proteins. Int. J. Biol. Macromol. 2021, 167, 309–325. [Google Scholar] [CrossRef]
- Serebrennikova, K.V.; Samsonova, J.V.; Osipov, A.P.; Senapati, D.; Kuznetsov, D.V. Gold Nanoflowers and Gold Nanospheres as Labels in Lateral Flow Immunoassay of Procalcitonin. Nano Hybrids Compos. 2017, 13, 47–53. [Google Scholar] [CrossRef]
- Liu, K.; He, Z.; Curtin, J.F.; Byrne, H.J.; Tian, F. A novel, rapid, seedless, in situ synthesis method of shape and size controllable gold nanoparticles using phosphates. Sci. Rep. 2019, 9, 7421. [Google Scholar] [CrossRef]
- Raghunathan, K.; Antony, J.; Munir, S.; Andreassen, J.-P.; Bandyopadhyay, S. Tuning and tracking the growth of gold nanoparticles synthesized using binary surfactant mixtures. Nanoscale Adv. 2020, 2, 1980–1992. [Google Scholar] [CrossRef]
- Suk, J.S.; Xu, Q.; Kim, N.; Hanes, J.; Ensign, L.M. PEGylation as a strategy for improving nanoparticle-based drug and gene delivery. Adv. Drug Deliv. Rev. 2016, 99, 28–51. [Google Scholar] [CrossRef]
- Mohd-Zahid, M.H.; Zulkifli, S.N.; Abdullah, C.A.C.; Lim, J.; Fakurazi, S.; Wong, K.K.; Zakaria, A.D.; Ismail, N.; Uskoković, V.; Mohamud, R.; et al. Gold nanoparticles conjugated with anti-CD133 monoclonal antibody and 5-fluorouracil chemotherapeutic agent as nanocarriers for cancer cell targeting. RSC Adv. 2021, 11, 16131–16141. [Google Scholar] [CrossRef]
- Aboudzadeh, M.A.; Iturrospe, A.; Arbe, A.; Grzelczak, M.; Barroso-Bujans, F. Cyclic Polyethylene Glycol as Nanoparticle Surface Ligand. ACS Macro Lett. 2020, 9, 1604–1610. [Google Scholar] [CrossRef] [PubMed]
- Ciaurriz, P.; Fernández, F.; Tellechea, E.; Moran, J.F.; Asensio, A.C. Comparison of four functionalization methods of gold nanoparticles for enhancing the enzyme-linked immunosorbent assay (ELISA). Beilstein J. Nanotechnol. 2017, 8, 244–253. [Google Scholar] [CrossRef] [PubMed]
- Kihara, S.; Ghosh, S.; McDougall, D.R.; Whitten, A.E.; Mata, J.P.; Köper, I.; McGillivray, D.J. Structure of soft and hard protein corona around polystyrene nanoplastics—Particle size and protein types. Biointerphases 2020, 15, 051002. [Google Scholar] [CrossRef]
- Casals, E.; Pfaller, T.; Duschl, A.; Oostingh, G.J.; Puntes, V. Time Evolution of the Nanoparticle Protein Corona. ACS Nano 2010, 4, 3623–3632. [Google Scholar] [CrossRef]
- Ackerson, C.J.; Jadzinsky, P.D.; Jensen, G.J.; Kornberg, R.D. Rigid, Specific, and Discrete Gold Nanoparticle/Antibody Conjugates. J. Am. Chem. Soc. 2006, 128, 2635–2640. [Google Scholar] [CrossRef] [PubMed]
- Wang, A.; Perera, Y.R.; Davidson, M.B.; Fitzkee, N.C. Electrostatic Interactions and Protein Competition Reveal a Dynamic Surface in Gold Nanoparticle–Protein Adsorption. J. Phys. Chem. C 2016, 120, 24231–24239. [Google Scholar] [CrossRef]
- Brewer, S.H.; Glomm, W.R.; Johnson, M.C.; Knag, M.K.; Franzen, S. Probing BSA Binding to Citrate-Coated Gold Nanoparticles and Surfaces. Langmuir 2005, 21, 9303–9307. [Google Scholar] [CrossRef]
- Vangala, K.; Ameer, F.; Salomon, G.; Le, V.; Lewis, E.; Yu, L.; Liu, D.; Zhang, D. Studying Protein and Gold Nanoparticle Interaction Using Organothiols as Molecular Probes. J. Phys. Chem. C 2012, 116, 3645–3652. [Google Scholar] [CrossRef]
- Wijenayaka, L.A.; Ivanov, M.R.; Cheatum, C.M.; Haes, A.J. Improved Parametrization for Extended Derjaguin, Landau, Verwey, and Overbeek Predictions of Functionalized Gold Nanosphere Stability. J. Phys. Chem. C 2015, 119, 10064–10075. [Google Scholar] [CrossRef]
- Busch, R.T.; Karim, F.; Weis, J.; Sun, Y.; Zhao, C.; Vasquez, E.S. Optimization and Structural Stability of Gold Nanoparticle–Antibody Bioconjugates. ACS Omega 2019, 4, 15269–15279. [Google Scholar] [CrossRef]
- Bharti, B.; Meissner, J.; Klapp, S.H.L.; Findenegg, G.H. Bridging interactions of proteins with silica nanoparticles: The influence of pH, ionic strength and protein concentration. Soft Matter 2013, 10, 718–728. [Google Scholar] [CrossRef] [PubMed]
- Ruiz, G.; Tripathi, K.; Okyem, S.; Driskell, J.D. pH Impacts the Orientation of Antibody Adsorbed onto Gold Nanoparticles. Bioconjugate Chem. 2019, 30, 1182–1191. [Google Scholar] [CrossRef] [PubMed]
- Parolo, C.; de la Escosura-Muñiz, A.; Polo, E.; Grazú, V.; de la Fuente, J.M.; Merkoçi, A. Design, Preparation, and Evaluation of a Fixed-Orientation Antibody/Gold-Nanoparticle Conjugate as an Immunosensing Label. ACS Appl. Mater. Interfaces 2013, 5, 10753–10759. [Google Scholar] [CrossRef]
- Nelis, J.L.D.; Bura, L.; Zhao, Y.; Burkin, K.M.; Rafferty, K.; Elliott, C.T.; Campbell, K. The Efficiency of Color Space Channels to Quantify Color and Color Intensity Change in Liquids, pH Strips, and Lateral Flow Assays with Smartphones. Sensors 2019, 19, 5104. [Google Scholar] [CrossRef]
- Park, S.B.; Shin, J.H. Pressed Lateral Flow Assay Strips for Flow Delay-Induced Signal Enhancement in Lateral Flow Assay Strips. BioChip J. 2022, 16, 480–489. [Google Scholar] [CrossRef]
- Roberts, A.; Prakashan, D.; Dhanze, H.; Gandham, R.K.; Gandhi, S.; Sharma, G.T. Immuno-chromatic probe based lateral flow assay for point-of-care detection of Japanese encephalitis virus NS1 protein biomarker in clinical samples using a smartphone-based approach. Nanoscale Adv. 2022, 4, 3966–3977. [Google Scholar] [CrossRef]
- Sasse, S.; Geballa-Koukoula, A.; Bovee, T.F.H. Development and validation of an indirect competitive lateral flow immunoassay for the detection of acetaminophen (paracetamol) in bovine urine. Anal. Bioanal. Chem. 2025, 417, 1177–1186. [Google Scholar] [CrossRef] [PubMed]
- Ayawei, N.; Ebelegi, A.N.; Wankasi, D. Modelling and Interpretation of Adsorption Isotherms. J. Chem. 2017, 2017, 3039817. [Google Scholar] [CrossRef]
- Caglayan, M.O.; Şahin, S.; Üstündağ, Z. Detection Strategies of Zearalenone for Food Safety: A Review. Crit. Rev. Anal. Chem. 2020, 52, 294–313. [Google Scholar] [CrossRef]
- Jiang, X.; Li, X.; Yang, Z.; Eremin, S.A.; Zhang, X. Evaluation and Optimization of Three Different Immunoassays for Rapid Detection Zearalenone in Fodders. Food Anal. Methods 2016, 10, 256–262. [Google Scholar] [CrossRef]
- Tran, T.V.; Do, B.N.; Nguyen, T.P.T.; Tran, T.T.; Tran, S.C.; Van Nguyen, B.; Van Nguyen, C.; Le, H.Q. Development of an IgY-based lateral flow immunoassay for detection of fumonisin B in maize. F1000Research 2019, 8, 1042. [Google Scholar] [CrossRef] [PubMed]
- Pan, M.; Ma, T.; Yang, J.; Li, S.; Liu, S.; Wang, S. Development of Lateral Flow Immunochromatographic Assays Using Colloidal Au Sphere and Nanorods as Signal Marker for the Determination of Zearalenone in Cereals. Foods 2020, 9, 281. [Google Scholar] [CrossRef] [PubMed]
- Wang, Y.; Wang, X.; Wang, S.; Fotina, H.; Wang, Z. A Novel Lateral Flow Immunochromatographic Assay for Rapid and Simultaneous Detection of Aflatoxin B1 and Zearalenone in Food and Feed Samples Based on Highly Sensitive and Specific Monoclonal Antibodies. Toxins 2022, 14, 615. [Google Scholar] [CrossRef] [PubMed]
- Zhang, Y.; Wang, Z.; Qu, X.; Zhou, J.; Yang, H.; Wang, W.; Yang, C. A photothermal lateral flow immunoassay for zearalenone with high sensitivity and wide detection range. Sens. Actuators B Chem. 2023, 390, 133909. [Google Scholar] [CrossRef]
Disclaimer/Publisher’s Note: The statements, opinions and data contained in all publications are solely those of the individual author(s) and contributor(s) and not of MDPI and/or the editor(s). MDPI and/or the editor(s) disclaim responsibility for any injury to people or property resulting from any ideas, methods, instructions or products referred to in the content. |
© 2025 by the authors. Licensee MDPI, Basel, Switzerland. This article is an open access article distributed under the terms and conditions of the Creative Commons Attribution (CC BY) license (https://creativecommons.org/licenses/by/4.0/).