Article

An Upgraded FOS/TAC Titration Model Integrating Phosphate Effects for Accurate Assessments of Volatile Fatty Acids and Alkalinity in Anaerobic Media

1
Université de Technologie de Compiègne, ESCOM, TIMR, Alliance Sorbonne Université, 60203 Compiègne, France
2
Institut Polytechnique UniLaSalle, Université d’Artois, ULR 7519, Rue Pierre Waguet, 60026 Beauvais, France
*
Author to whom correspondence should be addressed.
ChemEngineering 2025, 9(3), 53; https://doi.org/10.3390/chemengineering9030053
Submission received: 30 March 2025 / Revised: 3 May 2025 / Accepted: 20 May 2025 / Published: 22 May 2025

Abstract

The accurate determination of volatile fatty acids (VFAs) and total alkalinity (TAC, mostly carried by bicarbonate ions) is critical for operating anaerobic digesters. The FOS/TAC titration method developed by Nordmann is widely used due to its simplicity and affordability. This method has known limitations in dosing VFAs and TAC, since the presence of one interferes with the determination of the other, especially at higher VFA or bicarbonate concentrations. This study builds upon our prior research in 2021 by integrating the influence of phosphate (H2PO4/HPO42−) into numerical models correcting FOS/TAC titration results. A Scilab-based program was used to assess the impact of phosphate on titration results, revealing significant biases at lower concentrations. A revised multivariate regression formula was developed, incorporating phosphate effects, and demonstrating superior accuracy. The mean absolute percentage errors (MAPE) for TAC and VFA estimation were reduced to less than 0.3%. The model maintains compatibility with standard Nordmann’s titration protocols and equipment while significantly improving reliability. These findings highlight the necessity of considering phosphate interference in FOS/TAC titration, particularly in AD systems with variable buffering conditions. The proposed correction model enhances process monitoring and control, providing a more robust tool for both research and industrial practice in anaerobic digestion.

1. Introduction

Biogas production from waste has continued thriving during the last decade, reaching worldwide production of 1.6 EJ in 2022 [1]. Biogas, a gas mixture mainly composed of methane and carbon dioxide, can be used as biofuel for renewable energy generation or as a primary material for platform molecule synthesis. It is produced from the anaerobic digestion (AD) of the organic fraction of feedstock (wastewater, solid waste, biomass, etc.) via a series of biological transformations. This bioprocess can be summarized, in a very general and simple way, into four successive steps: hydrolysis, acidogenesis, acetogenesis, and methanogenesis.
The acidogenesis step, plays a key role in AD since the produced volatile fatty acids (VFA, i.e., acetic, propionic, butyric and valeric acid) have an acid character that, if not consumed in time by the subsequent steps, could lower the media pH in the digester. The methanogens (Archaea) are extremely sensitive to pH. Only at a pH between 6.5 and 8 could the methanogens be active and efficient in methane production. The supervision of the VFA content is therefore one of the most important parameters for the good operation of anaerobic digesters.
Another way to maintain the optimal pH for AD against VFA accumulation could be the presence of a certain buffer capacity in the reactors. In the case of AD, given the operating pH and the high bicarbonate concentration in AD media, the buffer capacity is ensured mainly by the carbonic acid and its dissociated forms (pKa = 6.35 and 10.35) [2]. The buffer capacity of other couples, like phosphoric acid with its dissociated forms (pKa = 2.15, 7.2 and 12.4) and ammonium/ammonia (pKa = 9.24) [2], have a limited effect, either because their pKa values do not correspond to the operational pH range of AD or because their concentrations are too low (see details in Table A1 and Figure A1 in Appendix A). The buffer capacity in anaerobic digestion is defined as “total alkalinity” (TAC) and often expressed in g CaCO3·L−1. TAC is among the major operational parameters to be supervised, along with the VFA content.
Since the 1960s, pH-metric titration has been largely developed to measure both VFA and TAC contents during the AD of wastewater. In 1977, Nordmann (1977) [3] developed a two-point titration method to estimate the VFA and TAC contents. The method is called FOS/TAC titration with FOS representing “Volatile Fatty Acids” in German (Flüchtige Organische Säuren). Sulfuric acid (H2SO4) is usually used as a titrant, and its quantity consumed from the initial pH to pH = 5 (denoted A) is used to calculate the buffer capacity mainly carried by the bicarbonate (i.e., total alkalinity) of the sample [3]. The quantity of H2SO4 consumed in order to achieve pH = 4.4 from pH = 5 (denoted B) is considered linearly proportional to the VFA concentration (FOS) [4] because the VFA (i.e., acetic, propionic, butyric, and valeric acid) are supposed to be the unique targets of this titration part due to their similar pKa, all around 4.8. The ratio of VFA over TAC (FOS/TAC) is recommended to be between 0.2 and 0.4 [5]. A ratio lower than 0.2 suggests the underfeeding of the substrate input leading to less productivity, and a ratio higher than 0.5 suggests the overfeeding of the input leading to the possible inhibition of biogas production. Nordmann’s titration with the FOS/TAC ratio is largely used by the academic and industrial world since it is simple to implement, requires few and affordable materials, gives a rapid result, and can be easily interpreted by the operators. Many automatic titrators propose titration programs using this method to dose VFA and TAC contents in anaerobic media.
Nevertheless, this method has its drawbacks [6]. For pH levels between 6 and 8, it is naturally bicarbonate ions that primarily consume the titrant. However, below pH = 6, VFAs also undergo titration. At pH = 5, while over 95% of the bicarbonate is titrated, almost 36.5% of VFAs is also converted into acetic acid. As the pH drops from 5 to 4, VFA titration intensifies, reaching 86.5%, while bicarbonate’s influence diminishes (<5% left). This overlap complicates the interpretation of titration results since VFAs, in their dissociated form, contribute to what is typically considered bicarbonate alkalinity [7]. Ultimately, VFAs interfere with TAC titration, and vice versa, especially when VFAs and TAC are in high concentrations.
Many previous studies focused on the mitigation of this bias by changing or increasing equivalent points [8,9,10,11,12], by applying back titration [13,14,15], by integrating the buffer intensity of the chemical species involved in titration [16], and by coupling pH-metric titration with complementary analyses, like total inorganic carbon [7,17], electrical conductivity [6], dry matter content [6], and spectrometric information [18]. Recent work showed the possibility of using 5-point titration assisted by PID feedback control [19], NIR spectrophotometry [20], and deep neural network models [21] to complete VFA prediction. The titration can also be numerically simulated following fundamental acid–base equilibrium theory [22,23,24]. The pros and cons of various methods are summarized in many papers [2,7,24,25,26,27,28,29]. In these newly proposed titration methods, complex complementary or supplementary analyses are often required for accurate calibration of the titration results. This means using other instruments and adding additional cost for the routine monitoring of reactors. Certain papers proposed multiple equivalent points. It is of great interest since the equipment will be the same as that for Nordmann’s method. Nevertheless, these methods will increase the titration time and are generally developed to fit smaller ranges of VFAs and TAC (<5 g·L−1) in conventional AD reactors.
Our previous paper published in 2021 [24] developed an open accessible Scilab program simulating Nordmann’s FOS/TAC titration and proved that the titration of VFAs or TAC interfered with the determination of the other, especially in unconventional AD conditions where extremely high concentrations of VFAs or TAC up to 20 g·L−1 are possible (e.g., 2 phased reactors or very special substrates). This finding was confirmed by experiments. We, in that paper, proposed a multivariate regression model taking into account both the values of A and B obtained by Nordmann’s titration to correct either VFA or TAC contents, even when they are extremely high. The mean absolute percentage errors (MAPE) were reduced significantly from 1346% to 0.33% for TAC and 159% to 0.37% for VFAs.
However, despite its encouraging performance, the proposed model in 2021 continues to have certain limitations. The objective of the model was to increase the accuracy of the titration results and, at the same time, to extend the validation range of VFA and TAC concentrations. The model parameters were thus calibrated using the simulated results covering a very large range of VFAs and TAC (both from 0 to 20 g·L−1). The mentioned model did not consider other ions potentially involved in the titration, like phosphate (H2PO4/HPO42−, pKa = 7.2), in the concerned titration pH range (4.4–8). The total phosphate concentration varies from 58 to 1302 mg·kg−1 [30]. The presence of phosphate could have an impact on the titration of TAC and FOS specially when they are at low levels. It is for these reasons that the present paper continues to refine the corrective equations of Nordmann’s method published in 2021. The objectives of this study are (1) to confirm that Nordmann’s equations and the previously developed model in 2021 could not address the interference of phosphate in lower VFA and TAC ranges, (2) to propose an improved model more adaptive to the range of VFA and TAC concentrations used for calibration and to the phosphate concentration, and (3) to study the effect of the phosphate concentration on the new model parameters.
Compared to the existing titration methods reported in literature that either neglected the phosphate influence or required complex analytical alternatives, the present study pioneeringly integrates the influence of phosphate species (H2PO4/HPO42−) into the upgraded numerical correction model of Nordmann’s classical FOS/TAC titration. This model significantly reduces the estimation errors of volatile fatty acids and alkalinity, particularly in conditions where phosphate interference is not ignorable, thereby enhancing the accuracy and robustness of anaerobic digestion monitoring. This innovation significantly extends the validity and accuracy of the widely used, low-cost operational method.

2. Materials and Methods

2.1. FOS/TAC Titration

According to Nordmann (1977) [3] and McGhee (1968) [4], the titration is realized using 20 mL of samples. In the program of the HACH AT1102 potentiometric titrator (HACH, Loveland, CO, USA), 5 mL of sample diluted with 15 mL of water is used instead. By noting the volume to bring 5 mL of sample from its initial pH to pH = 5 with 0.1 N H2SO4, the buffering capacity carried by bicarbonate (TAC) can be calculated using Equation (1).
TAC Nord =   A   ×   C tit   ×   50045 V sample
where TACNord (mg CaCO3·L−1) is the total alkalinity content obtained from Nordmann’s method; A (mL) is the equivalent volume of H2SO4 at pH = 5; Ctit (moleq H+·L−1 or N) is the concentration of H2SO4 (Ctit = 0.1 N); Vsample (mL) is the volume of the sample to titrate (Vsample = 5 mL); FOSNord (mg HAc·L−1) is the VFA content obtained from Nordmann’s method; and B (mL) is the difference between two equivalent volumes at pH = 5 and 4.4.
The titration of the solution from pH = 5 to pH = 4.4 allows for the determination of FOS (VFA concentration) using Equation (2), as suggested by McGhee (1968) [8].
FOS Nord = ( B   ×   4   ×   1.66 0.15 )   ×   500
where FOS (mg HAc·L−1) is the VFA concentration equivalent to acetic acid.
The coefficient in these formulas should be adapted if a different volume of titration (other than 5 mL) is used. Our previous experience confirms that if B values are too small (in the order of hundreds of microliters, often obtained by an automatic titrator), the FOS/TAC titration should be reperformed, or a higher quantity of raw samples (like 20 mL) should be used for titration.
Sodium bicarbonate (NaHCO3) was supposed to be the main carrier of the total alkalinity. The reported TAC value given by the titrator can therefore be reconverted to the equivalent sodium bicarbonate concentration [NaHCO3] (expressed in mg NaHCO3·L−1) using Equation (3). This helps to simulate the acid-base equilibrium during the titration.
NaHC O 3 = TAC   ×   84   ×   2 100 = TAC 0.595

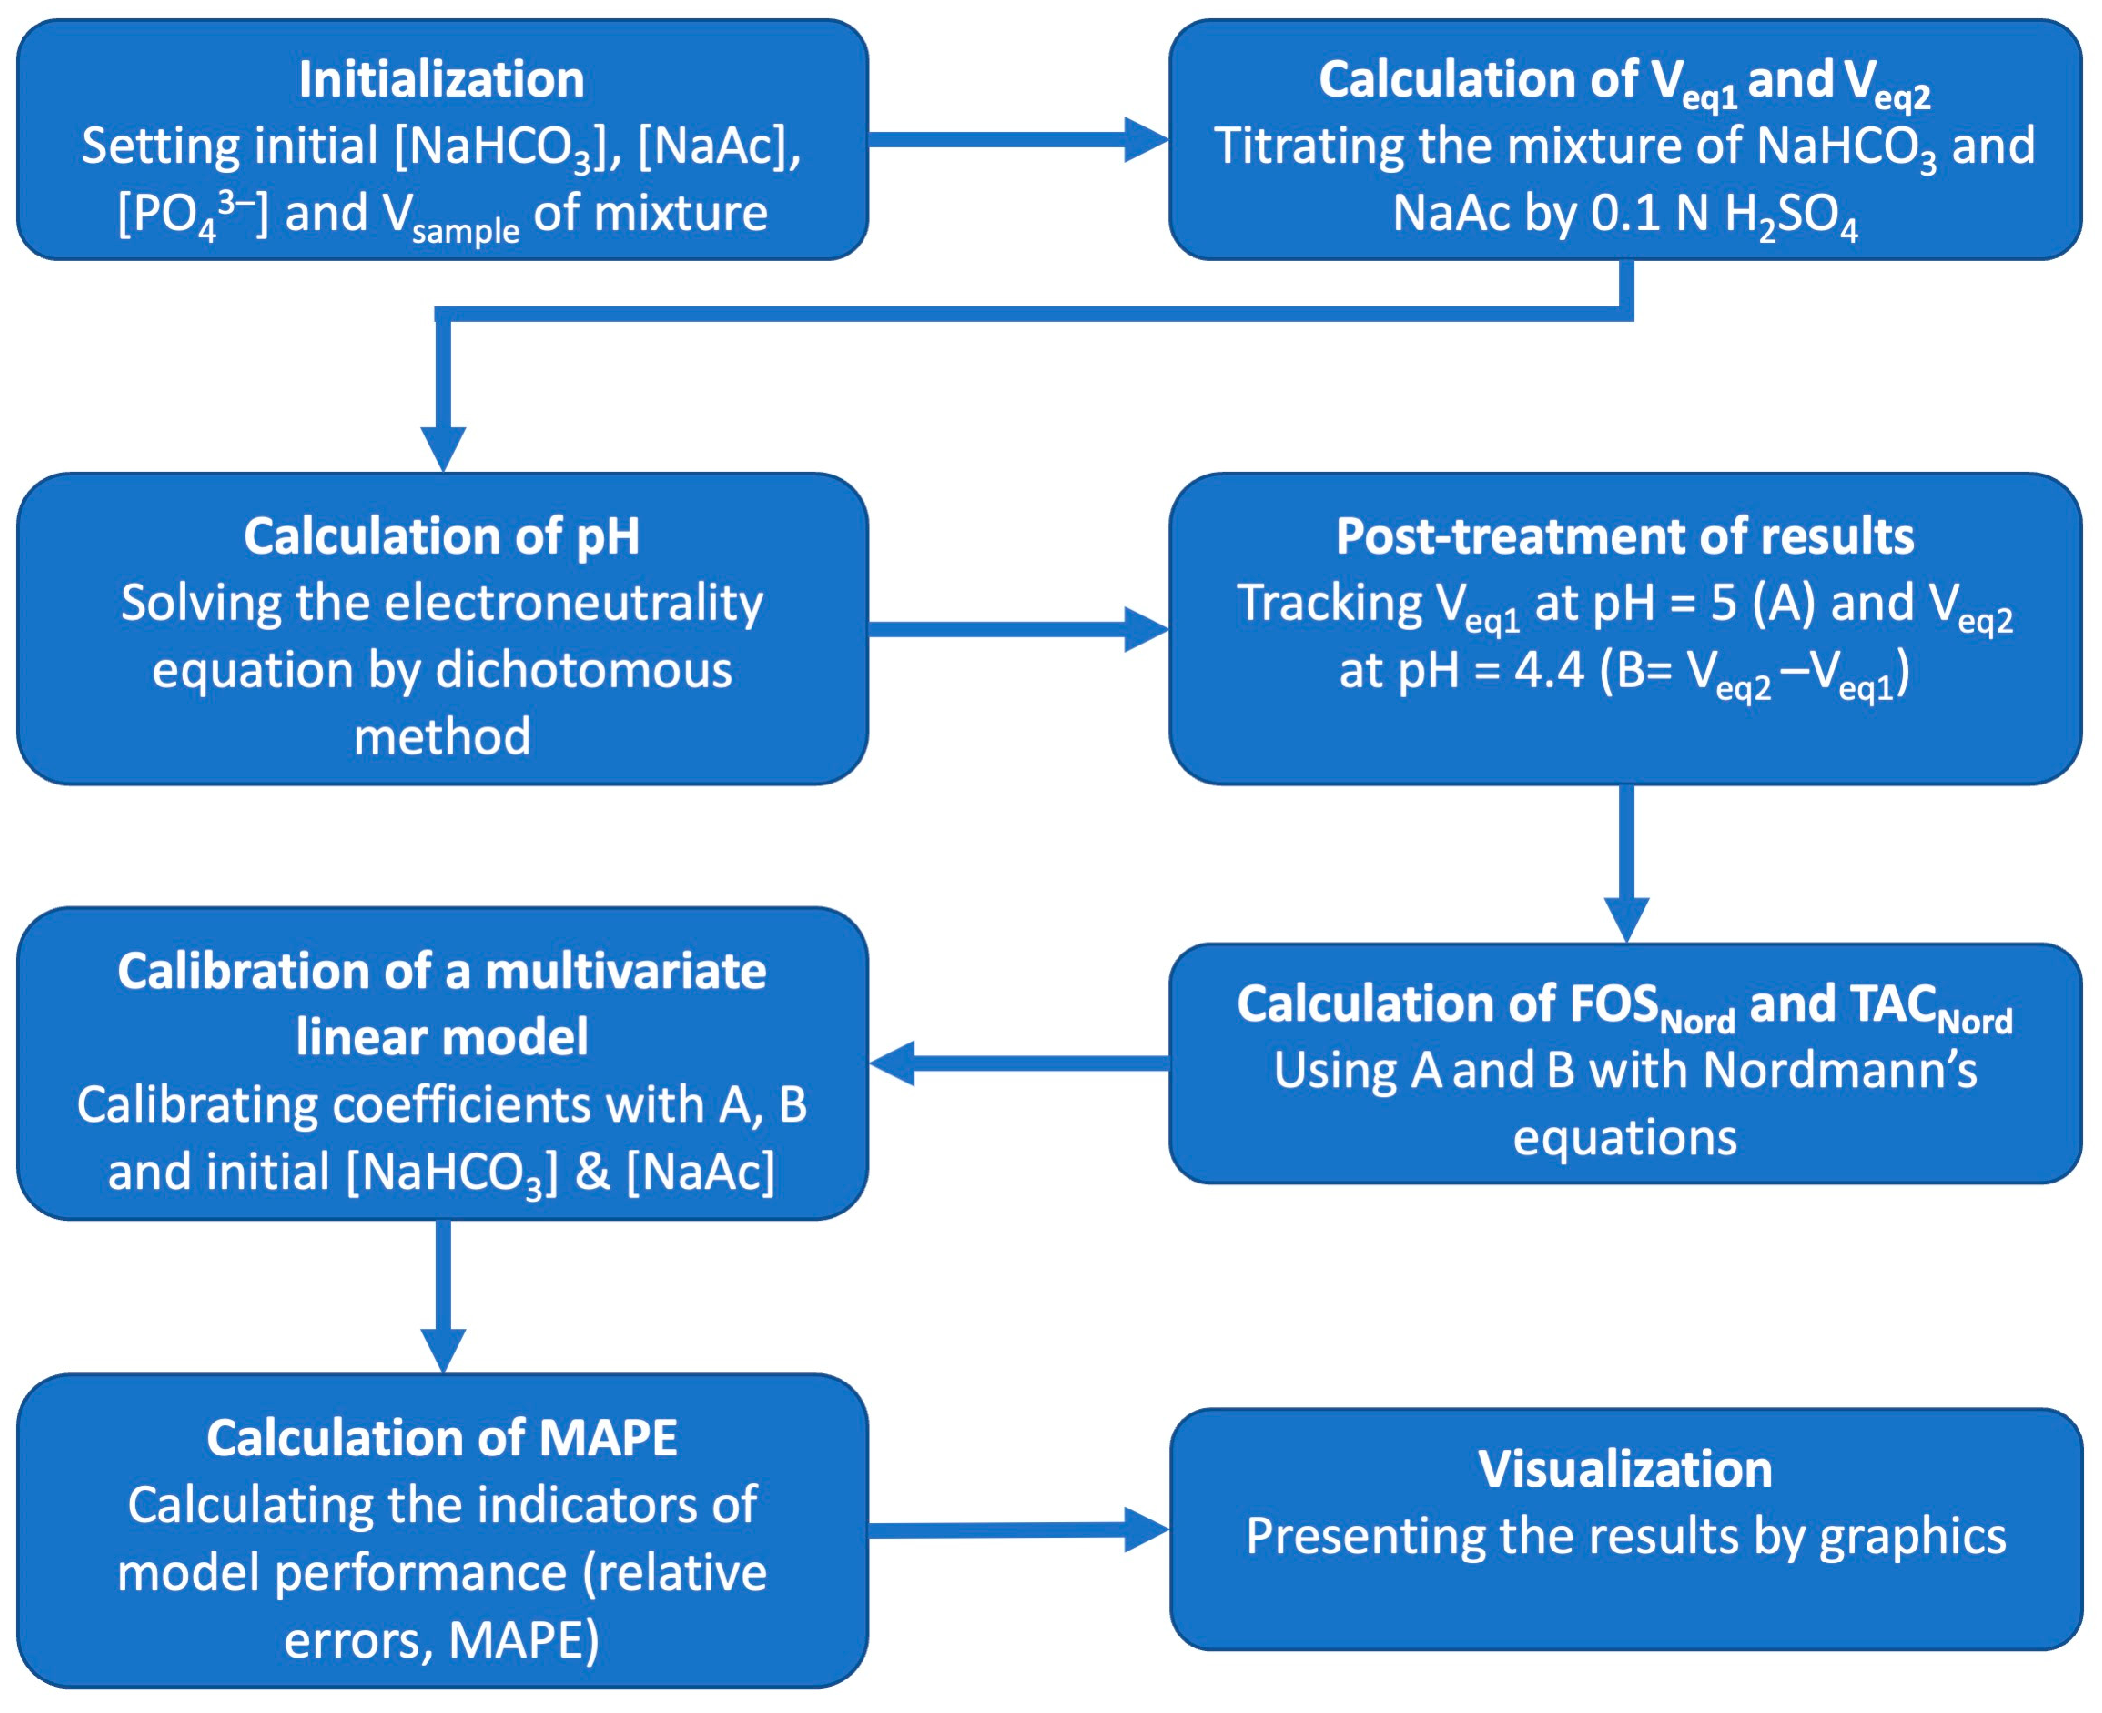
2.2. Numerical Simulation of FOS/TAC Titration by Scilab

The phenomena of acid–base equilibrium during Nordmann’s titration are simulated by using Scilab software 2025.0.0 (Dassault Système, Vélizy-Villacoublay, France), adapted from the previous model developed in 2021 [24]. The simulation accuracy of the equivalent volumes of different mixtures of bicarbonate and acetate was validated by the previous experiments on both artificial and real samples [24], which means that the Scilab program could safely provide experimentally validated data for subsequent modeling. The reactions taken into account in this model are shown below.
H2O ⇔ H+ + OH     pKe = 14
HAc ⇔ H+ + Ac      pKa = 4.76
H2CO3 ⇔ H+ + HCO3    pKa = 6.35
HCO3 ⇔ H+ + CO32−     pKa = 10.35
H2PO4 ⇔ H+ + HPO42−   pKa = 7.2
The flowchart of the Scilab program is shown in Figure 1. Scilab files with detailed code for simulations are available in the Program S1 of the Supplementary Materials. With regard to the code of Scilab developed in 2021, some improvements have been made: (1) combining two separate files in one and increasing the number of little concentrations for calibration, (2) studying the effect of the maximal calibration ranges of bicarbonate and acetate on the modeling performance, and (3) considering the effect H2PO4/HPO42− on titration. The total phosphate concentration was set at 500 mg·L−1 by default in Section 3.1 and Section 3.2 [30] and was modified in Section 3.3. The model developed in 2021 [24] did not consider phosphate.
The multiple linear regression was realized by using the optimization function “FMINCON” available in Scilab. The model coefficients (in Equations (4) and (5)) were calibrated using the dataset composed of equivalent volumes A and B estimated by the program for different mixtures of known sodium bicarbonate (for TAC) and acetic acid (for VFA) concentrations.
[ NaHCO 3 ] 2025 = α 1 × A + α 2 × B + α 3
[ HAc ] 2025 = FOS 2025 = β 1 × A + β 2 × B + β 3
where [NaHCO3]2025 (mg NaHCO3·L−1) is the NaHCO3 concentration estimated by the present model in 2025 and can be converted to TAC2025 using Equation (3); [HAc]new (mg HAc·L−1) is the acetic acid concentration estimated by the present model in 2025, namely FOS; A (mL) is the equivalent volume of 0.1 N H2SO4 to obtain pH = 5; B (mL) is the difference in the two equivalent volumes at pH = 5 and 4.4; α 1 , α 2 , and α 3 and β 1 , β 2 , and β 3 are the parameters for multiple linear regression.
In this paper, the FOS/TAC titration of solutions containing various combinations of HAc and NaHCO3 at concentrations of 0, 100, 300, 500, 1000, 3000, 5000, 7000, 10,000, 13,000, 15,000, 17,000, and 20,000 (in mg·L−1) was numerically simulated in Scilab, with initial pH = 8 and the total [PO43−] = 500 mg·L−1. The equivalent values of A and B were extracted from the simulation to calibrate the model parameters in Equations (4) and (5).
The values of A and B were also accordingly used to calculate TAC and HAc concentrations using Nordmann’s equations, the formula proposed in 2021, and the formula of the present study.
The effect of the total phosphate concentration ([PO43−]) on α 3 and β 3 was further investigated in Section 3.3. Linear equations were used to investigate the relationship of [PO43−] vs. α 3 and [PO43−] vs. β 3 .

3. Results

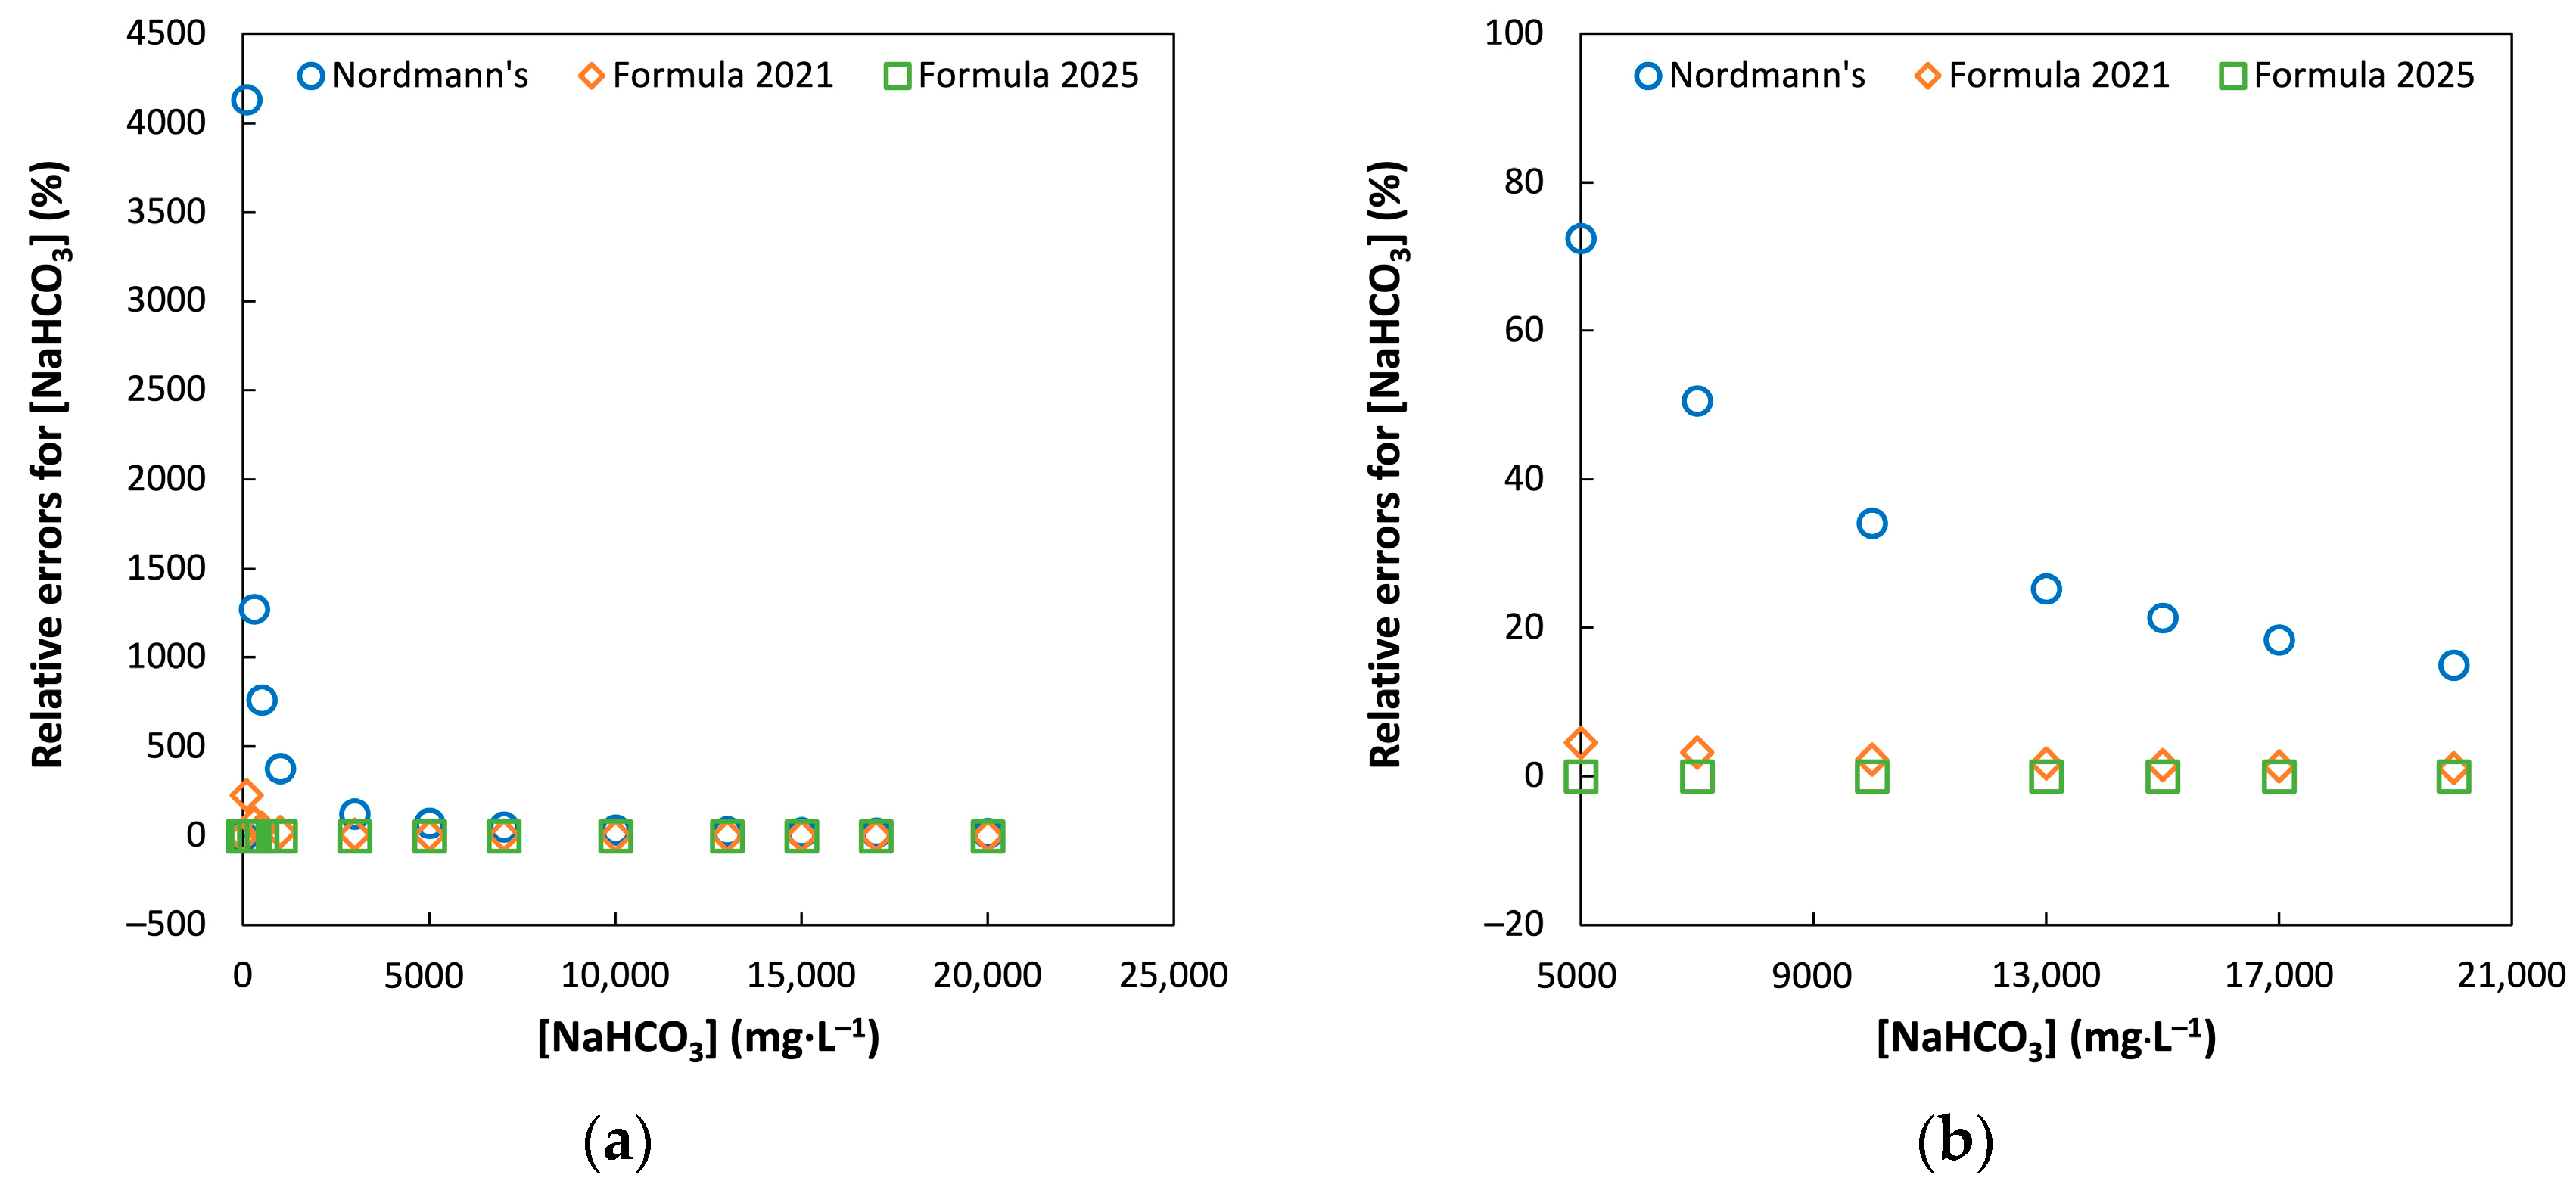
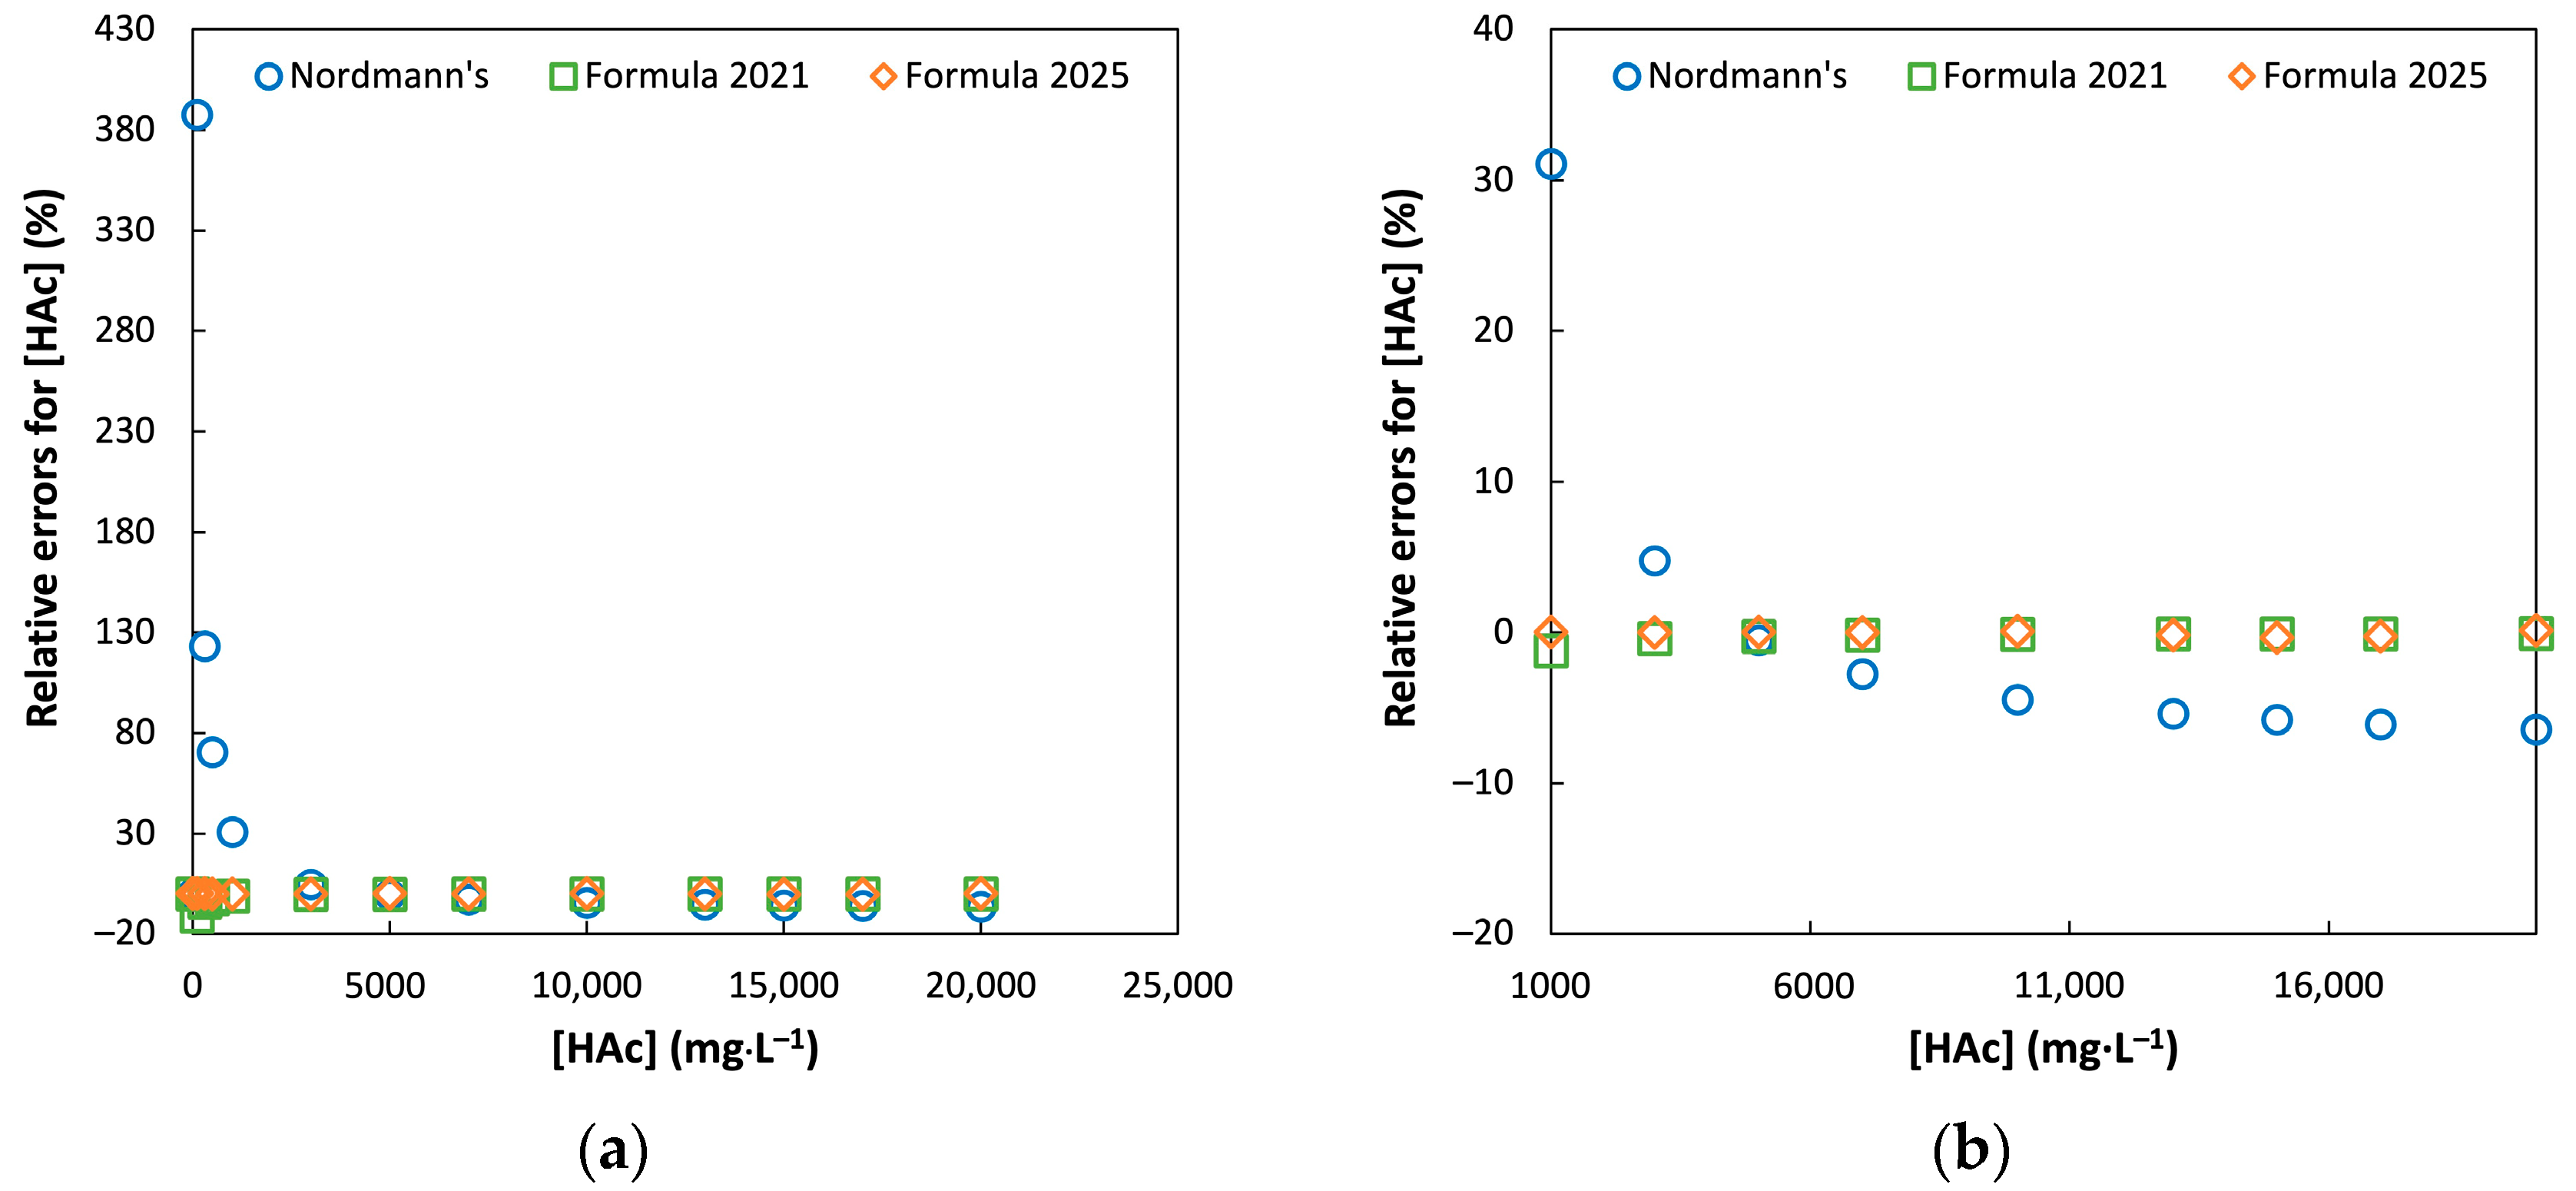
3.1. Comparison of Model Accuracy

Nordmann’s equations and formula used in our previous work in 2021 [24] (noted Formula 2021) did not consider the effect of phosphate on the equivalent values. By numerically simulating the titration of various combinations of HAc and NaHCO3 at concentrations of 0, 100, 300, 500, 1000, 3000, 5000, 7000, 10,000, 13,000, 15,000, 17,000, and 20,000 (in mg·L−1) with the presence of phosphate at 500 mg·L−1, new model parameters were obtained in Equations (6) and (7) (noted Formula 2025):
[ NaHCO 3 ] 2025 = 1822   ×   A 2011   ×   B 219
[ HAc ] 2025 = FOS 2025 = 126 × A + 3763 × B 11.1
By replacing A and B of Equations (6) and (7) by Equations (1) and (2), the old Nordmann’s FOS and TAC values could be corrected by following Equations (8)–(10):
[ NaHCO 3 ] 2025 = 1.820   ×   TAC Nord 0.606   ×   FOS Nord 264
TAC 2025 = 0.595   ×   [ NaHCO 3 ] 2025 = 1.084   ×   TAC Nord   0.360   ×   FOS Nord 157
FOS 2025 = 0.126   ×   TAC Nord + 1.134   ×   FOS Nord + 73.99
Figure 2 and Figure 3 show the relative errors of [NaHCO3] and [HAc] estimated by Nordmann’s equations, Formula 2021, and Formula 2025, with regard to the theoretical concentrations.
It is evident that Nordmann’s equations have difficulty in estimating the bicarbonate concentration (therefore TAC) in the solutions for small values. The average relative errors vary from 4131% at [NaHCO3] = 100 mg·L−1 to 15% at [NaHCO3] = 20,000 mg·L−1 (see details in Tables S1–S3 of Supplementary Materials). Nevertheless, Formula 2021 loses its accuracy at smaller bicarbonate concentrations (<1000 mg·L−1) with the interference of phosphate concentrations (Figure 2). Although more accurate than Nordmann’s equations, its average relative errors vary from 227% to 1.1%. However, Formula 2025 has very good performance in estimating the bicarbonate concentration with average relative errors ranging less than 0.3%. The mean absolute percentage error (MAPE) for [NaHCO3] estimation is 509%, 31%, and 0.13% for Nordmann’s equations, Formula 2021, and Formula 2025, respectively. The huge accuracy difference between Formula 2021 and Formula 2025 is due to the interference of phosphate during titration.
When it comes to the estimation of volatile fatty acids (in our case supposed to be acetic acid) in Figure 3, like bicarbonate, the estimation by Nordmann’s equations is not satisfactory, since the average relative errors go up to 387% against the theoretical values. The estimation by Formula 2021 is still acceptable in a limit of 10% (mostly <5%), while Formula 2025 remains most accurate in the VFA estimation with an average error less than 0.3%. The MAPE for the [HAc] estimation is 56%, 1.5%, and 0.13% for Nordmann’s equations, Formula 2021, and Formula 2025, respectively (see details in Tables S4–S6 of Supplementary Materials). The interference of phosphate in the VFA estimation, contrary to the case of bicarbonate, is less significant. However, Nordmann’s equations show its limitation in predicting more acceptable results than the other two multivariate linear models, especially in extreme conditions and moderate levels of phosphate concentrations.

3.2. Model Parameter Variation with Calibration Ranges

The model parameters in Equations (6) and (7) are calibrated with a range of both NaHCO3 and HAc up to 20,000 mg·L−1. It is found that the values of the model parameters could vary as a function of the range used. Figure 4 shows the variation of the model parameters calibrated to a range of NaHCO3 and HAc concentrations from 0 to different values (100, 300, 500, 1000, 3000, 5000, 7000, 10,000, 13,000, 15,000, 17,000, 20,000 mg·L−1) with the phosphate concentration at 500 mg·L−1.
The results show that certain parameters are sensible for the maximum values used for calibration, especially when it comes to α 2 , β 1 , and β 2 (all parameter values are available in Tables S7–S12 of the Supplementary Materials). The variation is more remarkable when the concentrations of NaHCO3 and HAc are in extreme conditions (either too high or too low). The parameters obtained using intermediary concentrations for calibration remain relatively stable and close to the values shown in Equations (6) and (7).
Considering the simplicity of using Formula 2025 for TAC and FOS estimation, we recommend, for most cases, directly using the parameter values reported in Equations (6) and (7). They offer acceptable results, since the variation of the parameter values is usually less than 0.5%, except for β 3 : α 1   = 1822   ±   2.3 ,   α 2   = 2011   ±   2.6 ,   α 3   = 219   ±   0.7 ,   β 1   = 126   ±   0.6 , β 2   = 3763   ±   2.6 , and β 3   = 11.1   ±   0.9 . However, the value of β 3 (−11.1) is too low to have a real significant impact on the final results of the VFA concentration (always at hundreds or thousands of milligrams per liter). Consequently, Equations (6) and (7) could be safely used for most circumstances.
If extreme conditions are stated after the titration and high accuracy for FOS and TAC estimation is exceptionally required, the values of α 1 , α 2 , α 3 , β 1 , β 2 , and β 3 , according to the maximum NaHCO3 and HAc concentrations used for calibration, are provided in Table A2, Table A3, Table A4, Table A5, Table A6 and Table A7 of Appendix A.

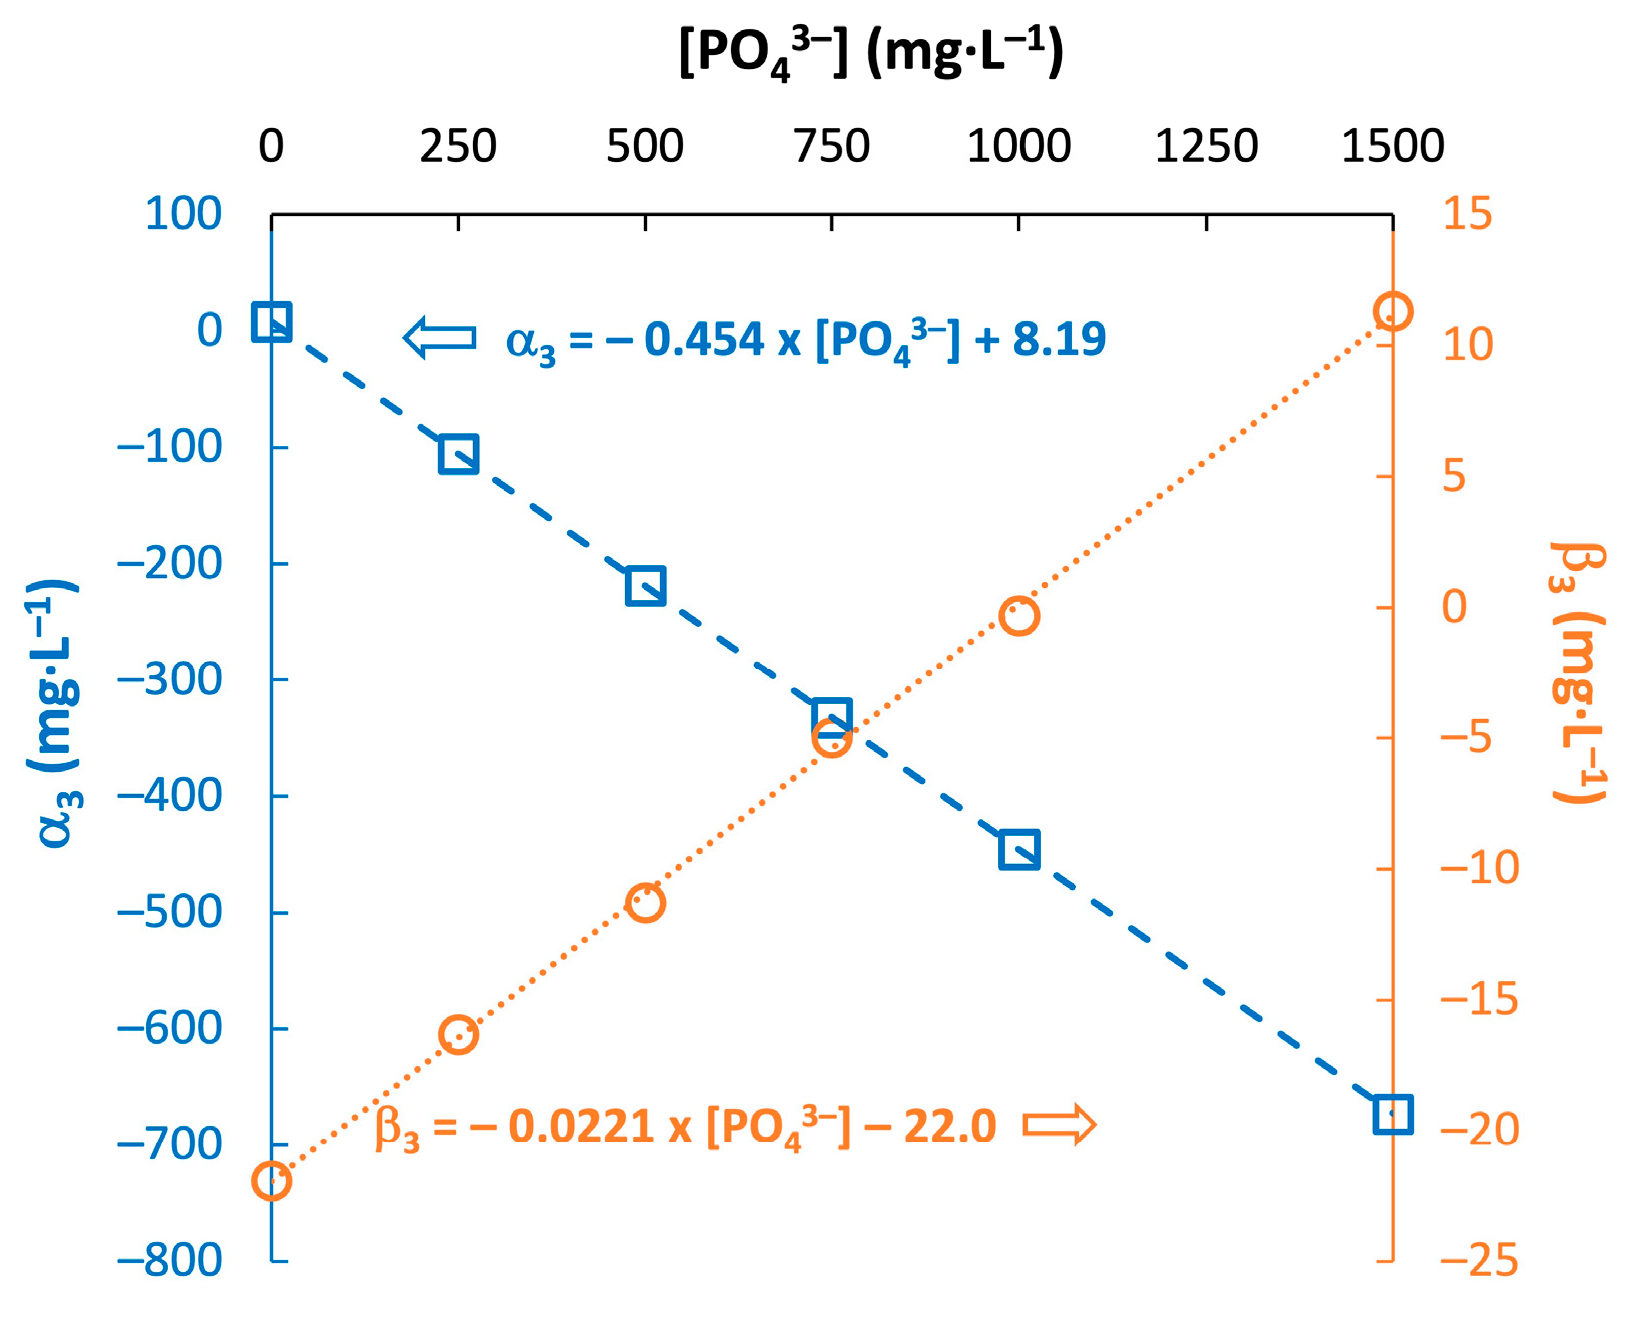
3.3. Effect of Total Phosphate Level on the Modeling Parameters

The above studies were realized based on a fixed total phosphate at 500 mg·L−1. This is an intermediary concentration that one could find in anaerobic media [30]. It is clear that, according to the results in Section 3.1, Formula 2025, which integrates the effect of phosphate, has much better performance in NaHCO3 and HAc estimation than those that do not. The couple H2PO4/HPO42−, due to its pKa close to that of H2CO3/HCO3, may interfere greatly with the determination of the bicarbonate content and thereby the total alkalinity (TAC). It would be interesting to study the evolution of model parameters with total phosphate concentrations.
Different levels of phosphate ([PO43−] = 0, 250, 500, 750, 1000, 1500 mg·L−1) were fixed to extract the values of α 1 , α 2 , α 3 , β 1 , β 2 , and β 3 . In fact, only the values of constant terms ( α 3 and β 3 ) depend on [PO43−]. The relationship between them is linear, as shown in Figure 5. α 3 varies greatly from 8.06 to −673 when it comes to the estimation of bicarbonate, while β 3 varies from −21.9 to 11.3 when the VFA concentration is concerned.
Since the numerical values of β 3 remain low as compared to the conventional VFA concentration, it could be safely neglected. Therefore, only α 3 is really concerned by the phosphate level present in the tested samples. Table 1 shows the MAPE of bicarbonate and VFA estimated using three methods (Nordmann’s, Formula 2021, and Formula 2025) with increasing phosphate concentrations. The parameters are calibrated using a range of [0–20,000 mg·L−1] for both NaHCO3 and HAc concentrations.
Formula 2025 remains the best model to calculate bicarbonate and VFA concentrations, thus to better estimate the TAC and FOS contents. Formula 2021, initially calibrated without considering phosphate, loses its accuracy in NaHCO3 estimation (up to 99%) when phosphate is highly present in the media; VFA is less impacted. However, the high phosphate level could significantly fake the results of both FOS (61%) and TAC (616%) when one uses Nordmann’s equations. It is because the Nordmann’s equations fail to consider the interference of either bicarbonate or VFA in the estimation of the other, let alone the extra impact of phosphate.
If one has extra data on the phosphate concentration, it is therefore recommended to integrate it into the calculation. The linear relationship between α 3 and [PO43−] could be safely used so that Equations (4) and (5) could be rewritten as below:
[ NaHCO 3 ] 2025 = 1822   ×   A 2011   ×   B 0.454 ×   P O 4 3 + 8.19
[ HAc ] 2025 = FOS 2025 = 126 × A + 3763   ×   B 11.1
The old Nordmann’s FOS and TAC values could be further corrected by following Equations (13)–(15), considering at the same time equivalent values of A and B from titration and the concentration of total phosphate:
[ NaHCO 3 ] 2025 = 1.820   ×   TAC Nord 0.606   ×   FOS Nord 0.454 ×   P O 4 3 37.2
TAC 2025 = 0.595   ×   [ NaHCO 3 ] 2025 = 1.084   ×   TAC Nord   0.360   ×   FOS Nord 0.270 ×   P O 4 3 22.1
FOS 2025 = 0.126   ×   TAC Nord + 1.13   ×   FOS Nord + 74.0
If additional accuracy is expected, our Scilab program available in the Program S1 of the Supplementary Materials was accordingly made so that the users can manually enter the concentration of phosphate before starting the simulation and model parameter estimations.

4. Discussion

As mentioned in the Introduction section, previous work studied the correction of Nordmann’s results by changing equivalent points [8,9,10,11,12], by applying back titration [13,14,15], by using the buffer intensity [16], and by coupling pH-metric titration with complementary analyses, like total inorganic carbon [7,17], electrical conductivity [6], dry matter content [6], and spectrometric information [18,20]. Advanced informatic tools, like PID feedback control [19] and deep neural network models [21], have been used to refine the VFA prediction. The present study, based on previous work, uses a numerical method to simulate the titration process in a bid to build a multivariate model taking into account the interfering effects of chemical species involved in titration. The equipment remains the same as required by conventional FOS/TAC titration methods.
In conventional AD reactors, phosphate concentrations are common in the range of 250–500 mg·L−1 [30]. Our findings demonstrate that neglecting phosphate interference in this range can cause up to 555% and 61% error in TAC and VFA estimation, which may mislead process control decisions. This correction becomes critical in stable systems where subtle changes in the VFA/TAC ratio can indicate early signs of imbalance. This upgraded model would also be of great interest for the reactors working in conventional operational conditions, such as highly imbalanced VFA and TAC ratios (2-phased reactors) and special substrates (like seafood waste).
The program is also made open access so that users can adjust the model if more chemical phenomena are to be considered. The results can be further upgraded if the total phosphate concentration is known (or even a rough estimation based on the total solid content). This complementary information helps in a better determination of TAC. The prediction of the VFA content remains accurate even without considering phosphate.
The perspectives of this work could rely on the introduction of other chemical species into the chemical equilibrium, such as proteins and ammonia. The differentiation of the VFA species would also be of importance for the impact of using an equivalent VFA concentration instead of individual VFA concentrations on the determination of the VFA and TAC concentrations. The use of the present model in a real industrial context may help to validate and adjust the model parameters for improved applicability.

5. Conclusions

The accurate determination of FOS and TAC is essential to provide credible information so that the anaerobic digesters could be operated properly. The largely used Nordmann’s titration method is simple to operate and its result is easy to interpretate. However, significant bias could be seen, since it fails to consider the interference of either bicarbonate or VFA in the estimation of the other, let alone the extra impact of phosphate. Our present study further improved our previous work to correct the FOS and TAC values obtained by Nordmann’s titration method. It corrects and safely estimates the values of VFA content and the buffer capacity of the anaerobic media, by considering both the reciprocal interference of bicarbonate, acetate, and phosphate during titration. The model is ready for application, as it follows the same experimental protocol and equipment as Nordmann’s titration. If phosphate concentration data are available, the results can be further refined using the equations provided in this study.

Supplementary Materials

The following supporting information can be downloaded at: https://www.mdpi.com/article/10.3390/chemengineering9030053/s1, Table S1. Relative errors for bicarbonate estimation at [PO43−] = 500 mg·L−1 using Nordmann’s equations; Table S2. Relative errors for VFA estimation at [PO43−] = 500 mg·L−1 using Nordmann’s equations; Table S3. Relative errors for bicarbonate estimation at [PO43−] = 500 mg·L−1 using Formula 2021; Table S4. Relative errors for VFA estimation at [PO43−] = 500 mg·L−1 using Formula 2021; Table S5. Relative errors for bicarbonate estimation at [PO43−] = 500 mg·L−1 using Formula 2025; Table S6. Relative errors for VFA estimation at [PO43−] = 500 mg·L−1 using Formula 2025; Table S7. Coefficient α1 of Formula 2025 for bicarbonate estimation at [PO43−] = 500 mg·L−1; Table S8. Coefficient α2 of Formula 2025 for bicarbonate estimation at [PO43−] = 500 mg·L−1; Table S9. Coefficient α3 of Formula 2025 for bicarbonate estimation at [PO43−] = 500 mg·L−1; Table S10. Coefficient β1 of Formula 2025 for VFA estimation at [PO43−] = 500 mg·L−1; Table S11. Coefficient β2 of Formula 2025 for VFA estimation at [PO43−] = 500 mg·L−1; Table S12. Coefficient β3 of Formula 2025 for VFA estimation at [PO43−] = 500 mg·L−1; Program S1. Scilab program for titration simulation and model calibration (separate.sce file).

Author Contributions

Conceptualization, X.L. and A.P.; methodology, X.L., A.P., L.A. and T.R.; software, A.P. and X.L.; validation, X.L., A.P., L.A. and T.R.; formal analysis, A.P. and X.L.; investigation, A.P. and X.L.; resources, X.L., A.P. and T.R.; writing—original draft preparation, X.L. and A.P.; writing—review and editing, X.L., A.P., L.A. and T.R.; visualization, X.L. and A.P.; project administration, X.L. and A.P. All authors have read and agreed to the published version of the manuscript.

Funding

This research received no external funding.

Data Availability Statement

Data used for model calibration can be found in Supplementary Materials.

Acknowledgments

The authors would like to extend their thanks to Stéphane Mottelet (TIMR, Université de technologie de Compiègne) for his valuable support for Scilab code realization.

Conflicts of Interest

The authors declare no conflicts of interest.

Appendix A

Table A1. pKa of the main chemical species potentially present in an anaerobic digester at 25 °C (data extracted from Sun et al., 2016 [2]).
Acid/Base CoupleDissociation ReactionpKa (−)
Volatile fatty acid
Acetic acid CH 3 COOH     CH 3 COO + H + 4.76
Propionic acid C 2 H 5 COOH     C 2 H 5 COO + H + 4.87
Butyric acid C 3 H 7 COOH     C 3 H 7 COO + H + 4.82
Valeric acid C 4 H 9 COOH     C 4 H 9 COO + H + 4.82
Alkalinity
H2CO3/HCO3 H 2 C O 3     HC O 3 + H + 6.35
HCO3/CO32− HC O 3     C O 3 2 +   H + 10.35
H3PO4/H2PO4 H 3 P O 4     H 2 P O 4 +   H + 2.15
H2PO4/HPO42− H 2 P O 4     HP O 4 2 + H + 7.20
HPO42−/PO43− HP O 4 2     P O 4 3 + H + 12.4
NH4+/NH3 N H 4 +     N H 3 +   H + 9.24
Figure A1. Acid–base equilibria of different compounds as a function of the pH at 25 °C (adapted from Liu et al. (2021) [24]).
Chemengineering 09 00053 g0a1
Table A2. Coefficient α 1 for bicarbonate estimation at [PO43−] = 500 mg·L−1.
[HAc]max100300500100030005000700010,00013,00015,00017,00020,000
[NaHCO3]max
100
300
500
1000
3000
5000 1822 *
7000
10,000
13,000
15,000
17,000
20,000
* An average of 1822 with standard deviation of 2.3 (0.12%).
Table A3. Coefficient α 2 for bicarbonate estimation at [PO43−] = 500 mg·L−1.
[HAc]max100300500100030005000700010,00013,00015,00017,00020,000
[NaHCO3]max
100 −1996−2002−2003−2027−2013
300
500
1000
3000
5000 −2011 *
7000
10,000−2050−2016
13,000−1948−2000
15,000−2096−2033
17,000−2031−2014
20,000−2033−2031
* An average of −2011 with standard deviation of 2.6 (0.13%).
Table A4. Coefficient α 3 for bicarbonate estimation at [PO43−] = 500 mg·L−1.
[HAc]max100300500100030005000700010,00013,00015,00017,00020,000
[NaHCO3]max
100
300
500
1000
3000
5000 −219 *
7000
10,000
13,000
15,000
17,000
20,000
* An average of −219 with standard deviation of 0.7 (0.32%). This constant has little effect regarding the high HAc concentration.
Table A5. Coefficient β 1 for acetic acid estimation at [PO43−] = 500 mg·L−1.
[HAc]max100300500100030005000700010,00013,00015,00017,00020,000
[NaHCO3]max
100 −131−120−114−118−123−153−133
300 −134−131−133−125
500 −134−135
1000
3000
5000 −126 *
7000
10,000
13,000
15,000
17,000
20,000
* An average of −126 with standard deviation of 0.6 (0.45%).
Table A6. Coefficient β 2 for acetic acid estimation at [PO43−] = 500 mg·L−1.
[HAc]max100300500100030005000700010,00013,00015,00017,00020,000
[NaHCO3]max
100 37943770
300 37703761
500 37713774
1000
3000
5000 3763 *
7000
10,0003805
13,0003696
15,0003873379237803774
17,000
20,0003775378937733776
* An average of 3763 with standard deviation of 2.6 (0.07%).
Table A7. Coefficient β 3 for acetic acid estimation at [PO43−] = 500 mg·L−1.
[HAc]max100300500100030005000700010,00013,00015,00017,00020,000
[NaHCO3]max
100
300
500
1000
3000
5000 −11.1 *
7000
10,000
13,000
15,000
17,000
20,000
* An average of −11.1 with standard deviation of 0.9 (8.4%). This constant has little effect regarding the high NaHCO3 concentration.

References

  1. IEA. Renewables 2023; IEA: Paris, France, 2024.
  2. Sun, H.; Wu, S.; Dong, R. Monitoring Volatile Fatty Acids and Carbonate Alkalinity in Anaerobic Digestion: Titration Methodologies. Chem. Eng. Technol. 2016, 39, 599–610. [Google Scholar] [CrossRef]
  3. Nordmann, W. Die Überwachung Der Schlammfaulung. KA-Informationen Für Das Betriebspersonal Beil. Zur Korresp. Abwasser 1977, 3, 77. [Google Scholar]
  4. McGhee, T.J. A Method for Approximation of the Volatile Acid Concentrations in Anaerobic Digesters. Water Sew. Work. 1968, 165, e166. [Google Scholar]
  5. Nkuna, R.; Roopnarain, A.; Rashama, C.; Adeleke, R. Insights into Organic Loading Rates of Anaerobic Digestion for Biogas Production: A Review. Crit. Rev. Biotechnol. 2022, 42, 487–507. [Google Scholar] [CrossRef] [PubMed]
  6. Sun, H.; Guo, J.; Wu, S.; Liu, F.; Dong, R. Development and Validation of a Simplified Titration Method for Monitoring Volatile Fatty Acids in Anaerobic Digestion. Waste Manag. 2017, 67, 43–50. [Google Scholar] [CrossRef]
  7. Nativ, P.; Gräber, Y.; Aviezer, Y.; Lahav, O. A Simple and Accurate Approach for Determining the VFA Concentration in Anaerobic Digestion Liquors, Relying on Two Titration Points and an External Inorganic Carbon Analysis. ChemEngineering 2021, 5, 15. [Google Scholar] [CrossRef]
  8. Jenkins, S.R.; Morgan, J.M.; Sawyer, C.L. Measuring Anaerobic Sludge Digestion and Growth by a Simple Alkalimetric Titration. J. Water Pollut. Control Fed. 1983, 55, 448–453. [Google Scholar]
  9. Kapp, H. Schlammfaulung Mit Hohem Feststoffgehalt. In Stuttgarter Berichte Zur Siedlungswasserwirtschaft; Oldenbourg Verlag: Munich, Germany, 1984; p. 300. [Google Scholar]
  10. Moosbrugger, R.E.; Wentzel, M.C.; Ekama, G.A.; Marais, G.v.R. A 5 pH Point Titration Method for Determining the Carbonate and SCFA Weak Acid/Bases in Anaerobic Systems. Water Sci. Technol. 1993, 28, 237–245. [Google Scholar] [CrossRef]
  11. Lahav, O.; Shlafman, E.; Morgan, B.E.; Loewenthal, R.E.; Tarre, S. Accurate On-Site Volatile Fatty Acids (VFA) Measurement in Anaerobic Digestion—Verification of a New Titrative Method. Acad. Edu J. 2002, 9, 118–125. [Google Scholar]
  12. Lahav, O.; Morgan, B.E.; Loewenthal, R.E. Rapid, Simple, and Accurate Method for Measurement of VFA and Carbonate Alkalinity in Anaerobic Reactors. Environ. Sci. Technol. 2002, 36, 2736–2741. [Google Scholar] [CrossRef]
  13. DiLallo, R.; Albertson, O.E. Volatile Acids by Direct Titration. J. Water Pollut. Control Fed. 1961, 33, 356–365. [Google Scholar]
  14. O’Brien, J.E.; Donlan, R.J. Direct Method for Differentiating Bicarbonate and Acetate in Digester Control. In Abstracts of Papers of the American Chemical Society; American Chemical Society: Washington, DC, USA, 1977; Volume 173, p. 121. [Google Scholar]
  15. Pauss, A.; Roza, A.; Ledrut, M.-J.; Naveau, H.; Nyns, E.-J. Bicarbonate Determination in Complex Acid-Base Solutions by a Back-titration Method. Environ. Technol. 1990, 11, 469–476. [Google Scholar] [CrossRef]
  16. Zan, F.; Zeng, Q.; Chi, K.; Hao, T.; Ekama, G.A. A Novel Approach for Rapidly Measuring Volatile Fatty Acids in Anaerobic Process. Water Res. 2020, 182, 115960. [Google Scholar] [CrossRef]
  17. Scherer, P.; Pydde, M.; Antonczyk, S.; Krakat, N. The FOS/TAC (VFA/TIC) Value Put to the Test; German Biogas Association: Freising, Germany, 2021. [Google Scholar]
  18. Chatterjee, B.; Radhakrishnan, L.; Mazumder, D. New Approach for Determination of Volatile Fatty Acid in Anaerobic Digester Sample. Environ. Eng. Sci. 2018, 35, 333–351. [Google Scholar] [CrossRef]
  19. Lin, Q.; Yuan, Y.; Zan, F.; Lu, H.; Wang, Z.; Guo, G. A Novel Online Analyzer for Accurate and Rapid Measurement of Volatile Fatty Acids in Anaerobic Wastewater Treatment. J. Environ. Sci. 2022, 122, 72–82. [Google Scholar] [CrossRef]
  20. Xu, Y.; Liu, J.; Sun, Y.; Chen, S.; Miao, X. Fast Detection of Volatile Fatty Acids in Biogas Slurry Using NIR Spectroscopy Combined with Feature Wavelength Selection. Sci. Total Environ. 2023, 857, 159282. [Google Scholar] [CrossRef] [PubMed]
  21. Park, S.; Kim, G.-B.; Pandey, A.K.; Park, J.-H.; Kim, S.-H. Prediction of Total Organic Acids Concentration Based on FOS/TAC Titration in Continuous Anaerobic Digester Fed with Food Waste Using a Deep Neural Network Model. Biomass Bioenergy 2024, 190, 107411. [Google Scholar] [CrossRef]
  22. Mu, Z.-X.; He, C.-S.; Jiang, J.-K.; Zhang, J.; Yang, H.-Y.; Mu, Y. A Modified Two-Point Titration Method for the Determination of Volatile Fatty Acids in Anaerobic Systems. Chemosphere 2018, 204, 251–256. [Google Scholar] [CrossRef]
  23. Münch, E.V.; Greenfield, P.F. Estimating VFA Concentrations in Prefermenters by Measuring pH. Water Res. 1998, 32, 2431–2441. [Google Scholar] [CrossRef]
  24. Liu, X.; André, L.; Mercier-Huat, M.; Grosmaître, J.-M.; Pauss, A.; Ribeiro, T. Accurate Estimation of Bicarbonate and Acetic Acid Concentrations with Wider Ranges in Anaerobic Media Using Classical FOS/TAC Titration Method. Appl. Sci. 2021, 11, 11843. [Google Scholar] [CrossRef]
  25. Buchauer, K. A Comparison of Two Simple Titration Procedures to Determine Volatile Fatty Acids in Influents to Waste-Water and Sludge Treatment Processes. Water SA 1998, 24, 49–56. [Google Scholar]
  26. Lili, M.; Biró, G.; Sulyok, E.; Petis, M.; Borbély, J.; Tamás, J. Novel Approach on the Basis of FOS/TAC Method. In Proceedings of the Analele Universităţ ii din Oradea, Fascicula Protecţia Mediului, Oradea, Romania, 4–5 November 2011; Volume 17, pp. 713–718. [Google Scholar]
  27. Jobling Purser, B.J.; Thai, S.-M.; Fritz, T.; Esteves, S.R.; Dinsdale, R.M.; Guwy, A.J. An Improved Titration Model Reducing over Estimation of Total Volatile Fatty Acids in Anaerobic Digestion of Energy Crop, Animal Slurry and Food Waste. Water Res. 2014, 61, 162–170. [Google Scholar] [CrossRef] [PubMed]
  28. Lahav, O.; Morgan, B. Titration Methodologies for Monitoring of Anaerobic Digestion in Developing Countries? A Review. J. Chem. Technol. Biotechnol. 2004, 79, 1331–1341. [Google Scholar] [CrossRef]
  29. Vannecke, T.P.W.; Lampens, D.R.A.; Ekama, G.A.; Volcke, E.I.P. Evaluation of the 5 and 8 pH Point Titration Methods for Monitoring Anaerobic Digesters Treating Solid Waste. Environ. Technol. 2015, 36, 861–869. [Google Scholar] [CrossRef]
  30. Mazzini, S.; Borgonovo, G.; Scaglioni, L.; Bedussi, F.; D’Imporzano, G.; Tambone, F.; Adani, F. Phosphorus Speciation during Anaerobic Digestion and Subsequent Solid/Liquid Separation. Sci. Total Environ. 2020, 734, 139284. [Google Scholar] [CrossRef]
Figure 1. Flowchart for the simulation of chemical equilibrium by Scilab.
Chemengineering 09 00053 g001
Figure 2. (a) Relative errors of [NaHCO3] estimated by Nordmann’s equations [3,4], Formula 2021 [24], and Formula 2025; (b) zoomed-in of the range 5000–20,000 mg·L−1.
Chemengineering 09 00053 g002
Figure 3. (a) Relative errors of [HAc] estimated by Nordmann’s equations [3,4], Formula 2021 [24], and Formula 2025; (b) zoomed-in of the range 1000–20,000 mg·L−1.
Chemengineering 09 00053 g003
Figure 4. Values of model coefficients (a) α 1 , (b) α 2 , (c) α 3 , (d) β 1 , (e) β 2 , and (f) β 3 as a function of the [NaHCO3] and [HAc] ranges used for calibration.
Chemengineering 09 00053 g004
Figure 5. Model parameters of α 3 and β 3 as a function of the phosphate concentration [PO43−].
Chemengineering 09 00053 g005
Table 1. Mean absolute percentage errors (MAPEs) of [NAHCO3] and [HAc] as a function of the phosphate concentration [PO43−].
[PO43−]
(mg·L−1)
α 3
(mg·L−1)
β 3
(mg·L−1)
MAPE for [NaHCO3] (%)MAPE for [HAc] (%)
Nordmann’sFormula 2021Formula 2025Nordmann’sFormula 2021Formula 2025
08.06−21.95250.1390.15160.90.1170.118
250−105−16.353916.40.15161.00.8800.135
500−218−11.355533.00.14561.11.680.153
750−333−4.9957049.60.17661.22.500.141
1000−445−0.29058566.10.12361.33.300.156
1500−67311.361699.10.18061.44.990.129
Disclaimer/Publisher’s Note: The statements, opinions and data contained in all publications are solely those of the individual author(s) and contributor(s) and not of MDPI and/or the editor(s). MDPI and/or the editor(s) disclaim responsibility for any injury to people or property resulting from any ideas, methods, instructions or products referred to in the content.

