Article

Removal of Pb(II) and Cd(II) Ions from Aqueous Solutions Using Modified Fish Scale Bioadsorbent

by
Yamilet Hernández Pérez
1,
Everth J. Leal Castañeda
1,*,
Jorge Meléndez Estrada
1,
Edith Montesinos-Pedro
1,
Ahmad Abo Markeb
2,3,* and
Xavier Font
2
1
National Polytechnic Institute, Postgraduate and Research Section, ESIA Z, Av. Luis Enrique Erro S/N, Adolfo López Mateos Professional Unit, Zacatenco, Gustavo A. Madero Municipality, Mexico City 07738, Mexico
2
Department of Chemical, Biological and Environmental Engineering, Escola d’Enginyeria, Universitat Autònoma de Barcelona, 08193 Bellaterra, Spain
3
Chemistry Department, Faculty of Science, Assiut University, Assiut 71516, Egypt
*
Authors to whom correspondence should be addressed.
ChemEngineering 2025, 9(2), 23; https://doi.org/10.3390/chemengineering9020023
Submission received: 15 December 2024 / Revised: 14 February 2025 / Accepted: 18 February 2025 / Published: 24 February 2025

Abstract

The need to conserve water is important, as it is predicted that in approximately 20 years there will be a global water shortage. In Mexico and the rest of the world, scientists are constantly looking for methods to help conserve and improve the processes used to treat the wastewater generated and reuse it safely. In this work, Tilapia fish scales modified with acetic acid were used for the removal of heavy metals from model water. For this experiment, the following adsorbent dose range was applied: 0.4 g to 1 g; the pH ranged from 4 to 7; and the contact time varied between 60 and 120 min. A three-factor experimental design was considered, including variables such as the adsorbent dose, contact time, and pH, each at three levels. The chemical modification produced a more porous surface on the flakes, facilitating metal adsorption, as confirmed by morphological and physicochemical analyses. The results obtained confirmed the removal of 94 and 83% of Cd(II) and Pb(II) metal ions, respectively, with an bioadsorbent dose of 1 g at a pH of 4 and a contact time of 120 min for Cd(II) and an adsorbent dose of 0.4 g, a pH of 4, and a contact time of 90 min for Pb(II), with an initial concentration of 200 mg/L for both metals. The Brunauer–Emmett–Teller (BET) analysis results provide critical insights into the textural properties of modified fish scales. The modified fish scales have great potential for removing heavy metals from industrial wastewater.

1. Introduction

Water pollution can have serious consequences, such as the spread of diseases, degradation of aquatic ecosystems, loss of biodiversity, scarcity of drinking water, and degradation of quality of life. To address water pollution, prevention and mitigation measures are required, including the regulation of industrial and municipal discharges, proper waste management, wastewater treatment, the promotion of sustainable agricultural practices, and watershed conservation. Water contamination by heavy metals is a serious environmental problem that can have adverse effects on human health and aquatic ecosystems [1]. Heavy metals, such as lead, mercury, cadmium, arsenic, and chromium, are toxic substances that can enter water from various sources, including industrial activity, mining, agriculture, and the release of chemicals [2,3,4]. The cadmium(II) ion is considered a poisonous and deadly metal that causes severe poisoning at low concentrations [5]. This metal is generally found in the discharges of metal refineries and galvanizing plants, in paint spills, in leachates from battery waste, and as a product of the corrosion of domestic pipes and can easily reach bodies of water to contaminate them [6]. On the other hand, the lead(II) ion can enter the environment through leachate from lead batteries, construction metals, paints, bullets, and some polymers. The lead(II) ion can damage the nervous system, especially in children, as well as the kidneys and reproductive system [7]. When heavy metals reach aquatic systems, they are deposited in the sediments, so any physicochemical alteration, such as the pH, conductivity, temperature, or salinity, among others, can generate the release of these metals and cause serious damage to the aquatic ecosystem and human beings [6].
Various research projects have been carried out for the removal of chromium and lead from wastewater, such as through chemical precipitation [8], coagulation [9], electrocoagulation [10], extraction with solvents [11], electrolysis, membrane separation [12], ion exchange [2], and biological methods [13], among others. However, the adsorption process has been found to be economically and operationally effective. Although it is a very old and, in some cases, rudimentary operation, it is currently still used to treat wastewater in the secondary stage to remove dyes [14], fertilizers [15], chemicals from the pharmaceutical industry [16] and food industry [17], and heavy metals from the mining and galvanizing industries [18,19,20].
The protection and restoration of water quality are essential to ensure safe and sustainable access to water resources. In recent years, natural products such as proteins, polysaccharides, terpenes, and lipids have emerged as a novel option for applications such as contaminant removal in wastewater treatment [21]. Fish scales (FSs) are mineralized plates located in the dermis of the epidermis and act as the only protection for the skin of fish. FSs are composed of 41 to 45% organic components such as collagen, fat, lecithin, sclerotin, vitamins, etc., and 38 to 46% of inorganic components such as hydroxyapatite and calcium and also contain trace elements such as magnesium, iron, zinc, and calcium [22]. FSs are considered as waste from the aquaculture sector, such as from canning, filleting, salting, and smoking fish [23]. It is estimated that between 7 and 12 million tons of FSs are discarded in the world every year [24], and there is still no commercial approach that captures all this waste to be used, which causes this waste to reach landfills and cause serious environmental pollution problems [25]. Various investigations have used fish scales as bioadsorbents to treat wastewater by removing biological, chemical, and physical contaminants. However, most of the investigations use complex chemical extractions of hydroxyapatite [26,27] or even chitosan [28,29], which is a well-studied natural coagulant. Activated carbon has also been generated from fish scales using physical activation, which requires large amounts of energy to achieve [24,30,31]. Hydroxyapatite has been synthesized from the FSs and fish bones of different species since this compound has a porous structure similar to that of natural bone, which has been applied as an adsorbent for heavy metals such as chromium(IV) with remission efficiencies greater than 60% [26,27], thus demonstrating its high efficiency in removing heavy metals. Likewise, fish scales are transformed into activated carbon through physical and chemical activation to eliminate dyes from residual effluents of the textile industry [24,30,31]. FSs have even been used natively [32] or with just acidic or alkaline chemical modification, which is enough to generate mesopores on the surface of the FSs and fulfill the purpose of removing contaminants from wastewater [6]. However, the exploration of suitable acidic or alkaline agents for the modification of the scale surface still requires research. Therefore, it is necessary to propose alternatives that do not cause secondary pollution, using chemical methods that are not harmful to health and that also take advantage of a waste product from the agro-food industry. In the present work, a simple chemical modification using an edible organic acid is proposed to generate porous fish scales using acetic acid to remove Cd(II) and Pd(II) ions from model wastewater.

2. Materials and Methods

2.1. Materials

Tilapia fish scales were sourced from a local market (La Viga, Iztapalapa, Mexico City, Mexico). Cadmium iodide (98% of purity) and NaOH (97% of purity) were purchased from Meyer, Mexico. Glacial acetic acid RA ACS (aldehyde free) with 98% purity (J.T. Baker, Phillipsburg, NJ, USA) was used. Lead nitrate (99% of purity) was purchased from Merck (Rahway, NJ, USA). Distilled water (conductivity 1.01 µohms/cm; total hardness < 1.00 mg/L; chlorides 2.34 mg/L; pH 5.89; total dissolved solids < 6.00 ppm; turbidity 0.12 UTN) was used to prepare stock standard solutions for the model wastewater.

2.2. Preparation of the Bioadsorbent

For the preparation of the bioadsorbent, the FSs were washed with distilled water to remove impurities and fish skin. They were dried in an oven (Thermo Scientific, Waltham, MA, USA) for 24 h at 70 °C. Subsequently, chemical modification was carried out, and for this, 100 mL of acetic acid 80% (Vol./Vol.) was used for every 25 g of FSs. The modification was carried out by mixing the FSs with the acid for 1 h with constant stirring at room temperature, and after this time, the treated FSs were washed with distilled water and neutralized with a 0.1 N NaOH solution for 1 h. After this time, the FSs were removed from the water and dried in an oven at 60 °C for 24 h.

2.3. Characterization of Native and Modified FSs

2.3.1. Fourier Transform Infrared (FTIR) Spectroscopy Analysis

The FS chemical modification was studied with FTIR spectroscopy aiming to demonstrate that the modification of the FSs had been carried out. For this analysis, the technique of Leal-Castañeda et al. [33] was followed. The equipment used was an FTIR module IR2 equipped with an Indium Gallium Arsenide (InGaAs) detector, coupled to a Jobin-Yvon LabRam HR800 spectrometer (Horiba, Kioto, Japan). The starch samples were placed in a holder and analyzed over a wave number range of between 4000 and 450 m−1 with a spectral resolution of 4 cm−1, performing 36 scans per measurement, using an ATR contact objective.

2.3.2. Scanning Electron Microscopy (SEM) Analysis

Gold-coated FS samples were placed on a support and observed in an SEM (Carl Zeiss EVO LS 10, Life Science, Mainz, Germany). For this analysis, the technique of Leal-Castañeda et al. [33] was followed. The equipment operates using a tungsten filament (W). High-vacuum (HV) conditions were used at approximately 10−5 Pa. A secondary electron detector for high vacuum (SE1) was used. Samples were processed at low voltage (5 kV).

2.3.3. X-Ray Diffraction Analysis

For this analysis, the technique of Leal-Castañeda et al. [33] was followed. The X-ray diffraction (XRD) patterns of the FSs were obtained on a Rigaku Miniflex 600 diffraction instrument (Rigaku Denki Co., Ltd., Chiyoda City, Japan) operating at 40 kV and 15 mA with a CuK radiation wavelength of λ = 1.54 Å. The scanning angle ranged between 8° and 60° on a 2Ɵ scale with a step size of 0.01 and 0.03º/min. The relative crystallinity (Rc) of starch granules was calculated as the ratio of the crystalline area to the total area under the main diffraction peaks. The software used to analyze the spectrum was OriginPro 8 (OriginLab Corporation, Northampton, MA, USA).

2.3.4. X-Ray Photoelectron Spectroscopy (XPS) Analysis

For this analysis, the technique of Leal-Castañeda et al. [33] was followed. The samples were dried under a high vacuum (1.9 × 10⁻⁸, –9.8 × 10⁻⁹ mBar) before being transferred to the analysis chamber. To obtain the overall spectra, a scan from 0 to 1370 eV was performed using a Thermo Scientific K-Alpha photoelectron spectrometer (Thermo Fisher Scientific Inc., Loughborough, UK), which uses a monochromatic AlK-α source (1487 eV). The vacuum pressure of the analysis chamber was 10 × 10−9 mBar throughout the experiment, and a beam size of 400 microns was used. Overall spectra were obtained using a pass energy of 160 eV. The quantitative analysis was performed using high-resolution spectra averaged from three points located in different areas of the surface of each of the samples. Once the spectra were obtained, the areas of C1s, N1s, and O1s were determined using AVANTAGE V5.937 software from Thermo Scientific, Waltham, MA, USA.

2.3.5. Brunauer–Emmett–Teller (BET) Analysis

The textural properties of the modified fish scales were determined by nitrogen adsorption/desorption experiments at −196 °C using an ASAP 2020 Micrometrics Inc. Before the analysis, samples were degassed at 80 °C for 20 h. The surface area (Sa) was calculated with the Brunauer–Emmett–Teller equation for P/Po values to be between 0.002 and 0.99. The pore size distributions of the samples were determined from the adsorption branch of the isotherms by the non-local density functional theory (NLDFT).

2.4. Preparation of Model Wastewater

For the preparation of model wastewater with 200 mg/L of cadmium iodide and lead nitrate, a pedestal blender (Hamilton Beach, MA, USA) was used with constant stirring at 16,000 rpm for 30 min at room temperature. Subsequently, the sample was allowed to rest for 1 h, and it was treated following a response surface experimental design.

2.5. Adsorption Studies of Pb(II) and Cd(II) Ions

The effectiveness of the FSs was evaluated by exposing aqueous solutions of Cd(II) and Pb(II) ions, each 200 mg/L, to FSs, and their concentrations were determined before and after being treated. The determination of heavy metals was carried out using the Perkin Elmer Atomic Absorption Spectrometer Analyst 700 equipped with a deuterium background corrector and WinLab32 software following the standard method of NOM-127-SSA1-2021 [34]. The removal efficiency (R) was calculated using the following Equation (1):
C o n t a m i n a n t   r e m o v a l % = C i C f 100 C i  
where Ci and Cf are the initial and equilibrium concentrations of the heavy metals.

2.6. Experimental Design

For this work, a response surface methodology (RSM) was used to design experiments for the removal of lead(II) and cadmium(II) ions. For this experiment, an adsorbent dosage range of 0.4 g to 1 g was applied, the pH range was 4 to 7, and the contact time range was 60 to 120 min, considering a 3-factorial experimental design with 3 variables, the flake dose, contact time, and pH, at three levels, as shown in Table 1. The response (Y) represents the percentage removal of Cd(II) and Pd(II), with the influencing factors encoded as X1 (bioadsorbent dose), X2 (pH), and X3 (contact time). The mathematical relationship between the response and these variables is expressed in Equation (2) as a second-order polynomial, following the approach of Chojnacka et al. [35] and Teshale et al. [36].
Y = f(X1, X2, X3, …, Xn)
Here, Y represents the design response, while Xi denotes the action variables, referred to as factors. The independent variables are continuous, controllable through experiments, and assumed to have negligible errors, making this assumption applicable to the equations. The Y (response) values obtained from the adsorption experiment were determined using the design matrix provided in Table 2. The percentage reduction efficiency of the metals was calculated using Equation (1).

2.7. Statistical Data Analysis

All the data of the adsorption processes were statistically analyzed, and the quadratic regression models involving the three operational factors, dose, time, and pH, were estimated via ANOVA using Minitab (v18, State College, PA, USA). The inclusion of data, goodness of fit, and statistical significance were determined using the regression correlation coefficient (R2) and the p value. The data in this study were considered statistically significant when the p values were less than 0.05.

3. Results

3.1. Characterization of the Prepared Bioadsorbent

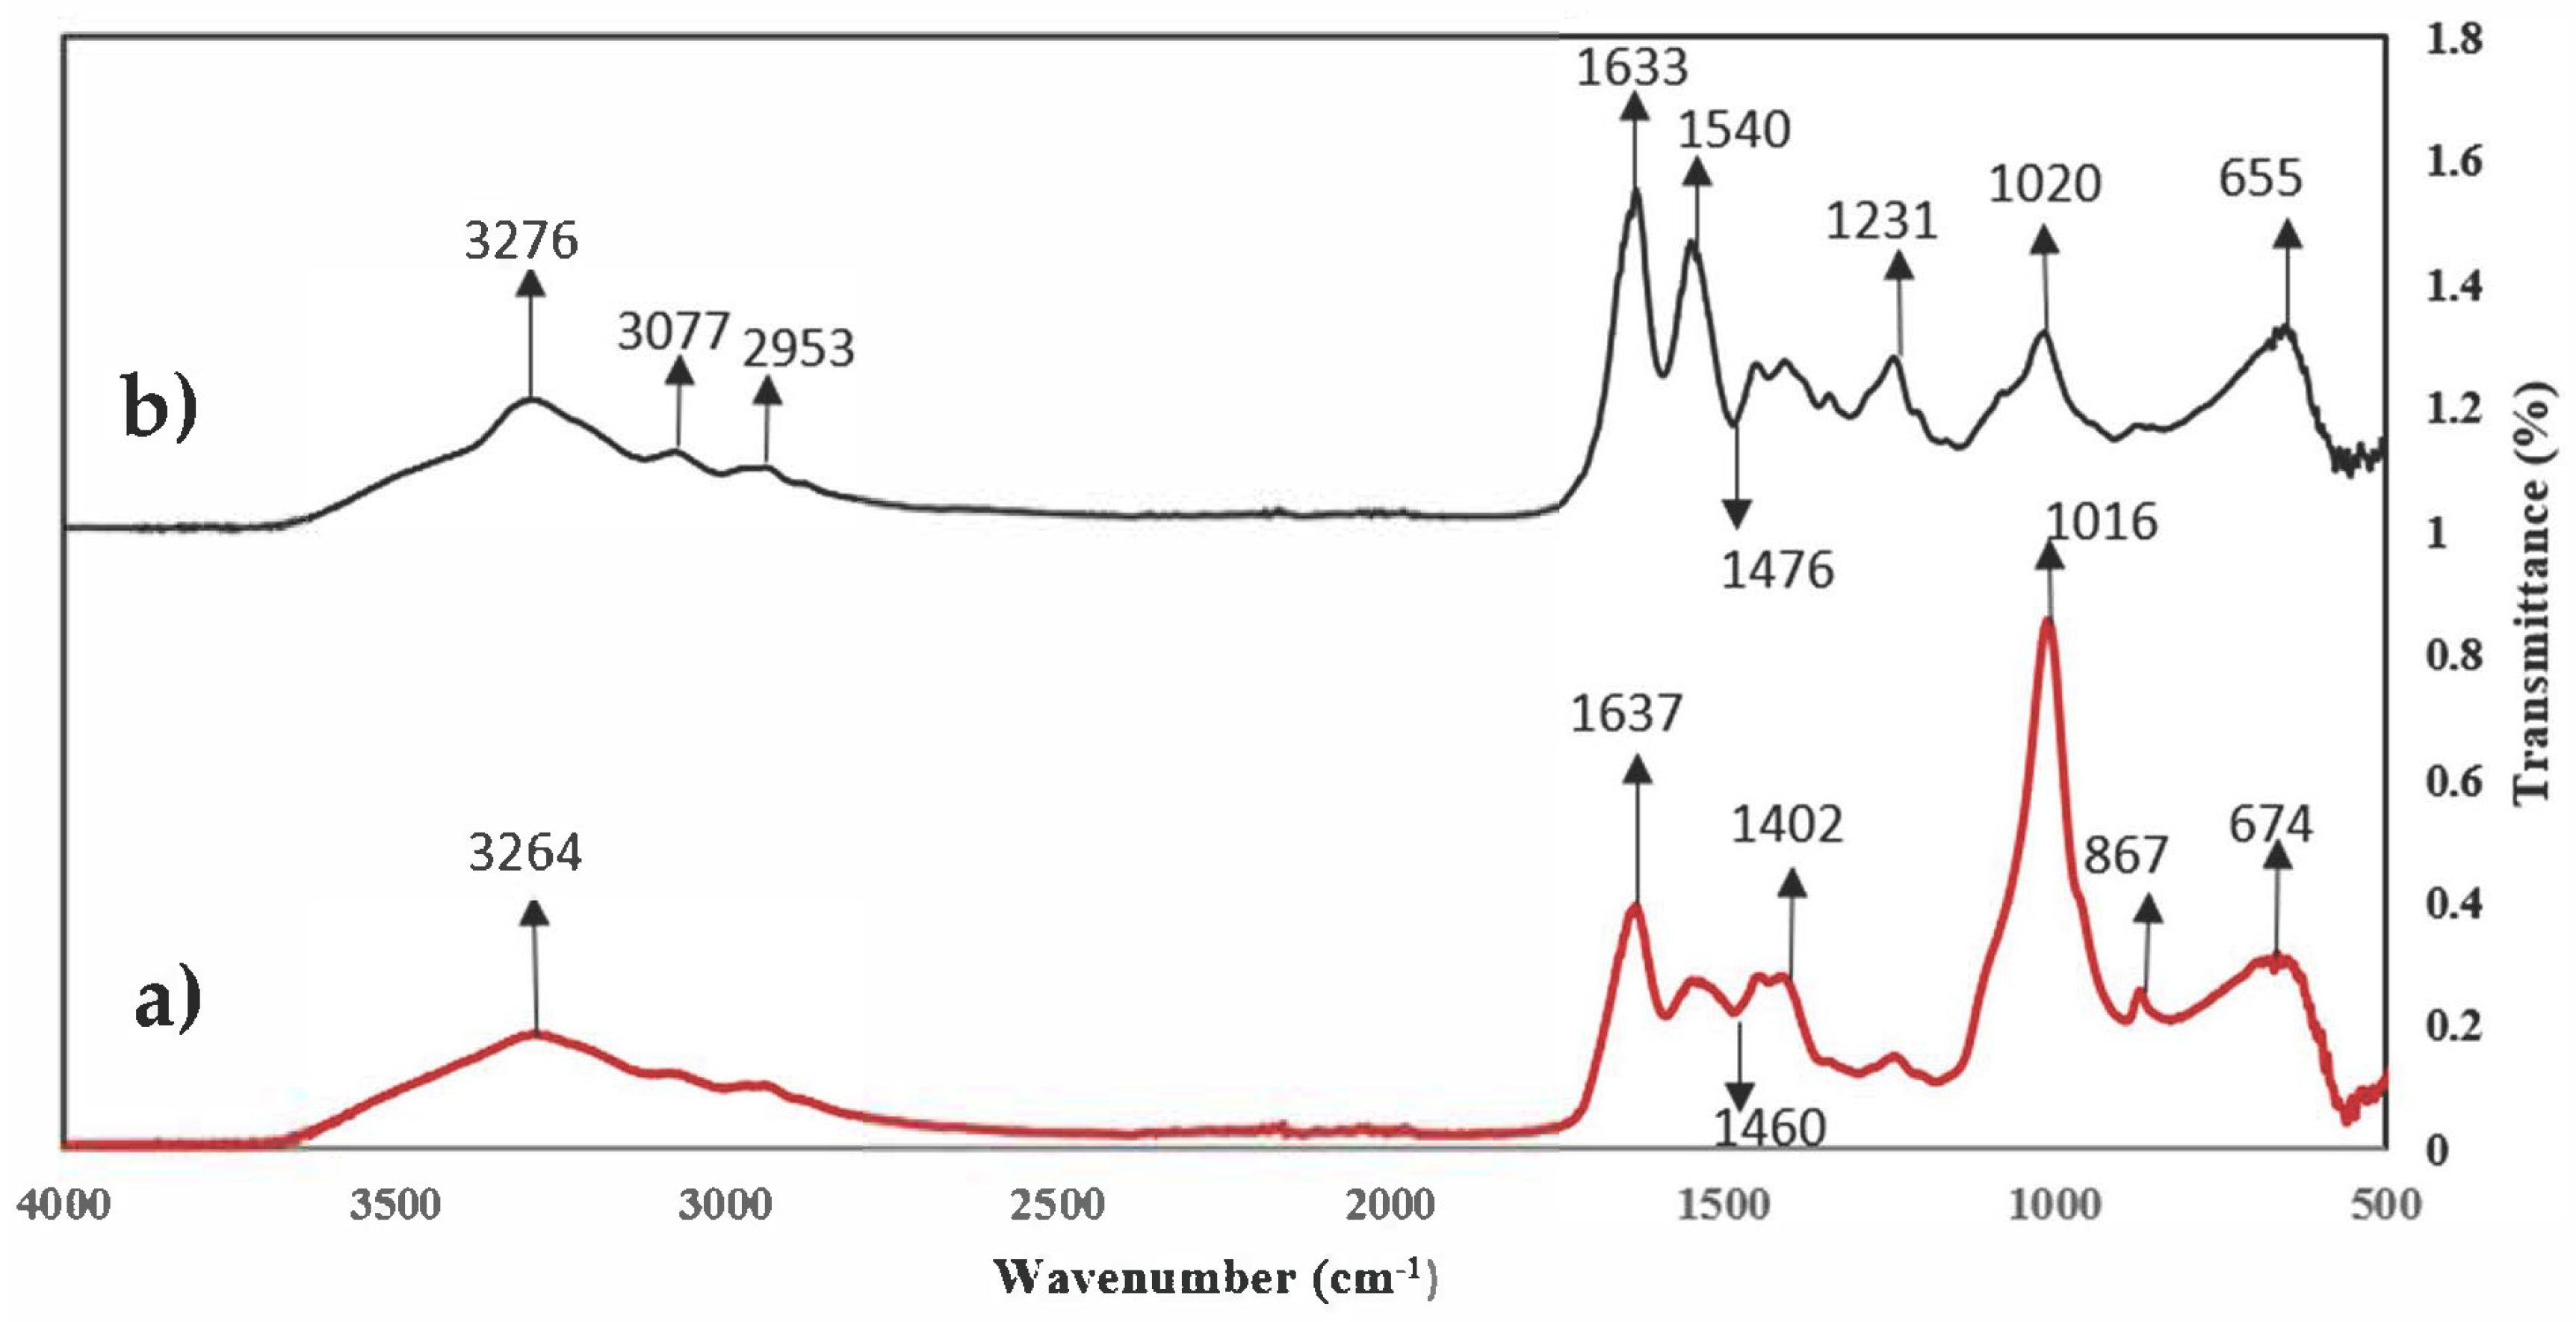
3.1.1. FTIR Analysis

The FTIR spectra for the native fish scales (NFSs) and modified fish scales (MFSs) are shown in Figure 1. Fish waste is composed of a greater proportion of collagen and hydroxyapatite; therefore, the active functional groups present on the surface of the scales could be hydroxyl, amino, nitro, carbonyl, and phosphate [37]. Carbonyl and carboxyl groups are the main functional groups present on the surface of FSs. Changes are observed in the spectrum bands of the MFSs compared to the NFSs. In both spectra, a broad band is observed at 3276 cm1 which corresponds to the -OH groups [38]. Likewise, two signals are observed in the region between 3100 and 2900 cm1 corresponding to the C-H stretching vibrations of the -CH3 and -CH2 functional groups [37,39]. The spectra also show peaks at 1650 and 865 cm1 corresponding to the -NH bending of amines I and II of collagen. In addition, three signals at 1115, 1231, and 1038 cm1 are observed, which are representative of C-O groups (alcohols, carboxylic acids, esters, and ethers). In both spectra, absorption bands at 655 and 1020 cm1 were observed corresponding to the vibrations of the phosphate ion in the hydroxyapatite network, as well as absorbances of 867, 1420, and 1540 cm1 corresponding to the -CO3 bond of the carbonate groups incorporated into the network of the apatite structure [40,41]. On the other hand, the 1540 cm1 signal increased in the MFSs because the esterification caused the exposure of the apatite structure. The same thing happened with the signal at 1633 cm1 corresponding to the amine group. However, the 1020 cm1 signal decreased after chemical treatment, indicating that part of the hydroxyapatite was removed. The signal present at 1231 cm1 corresponding to the C-C bending increased due to the chemical treatment with acetic acid.

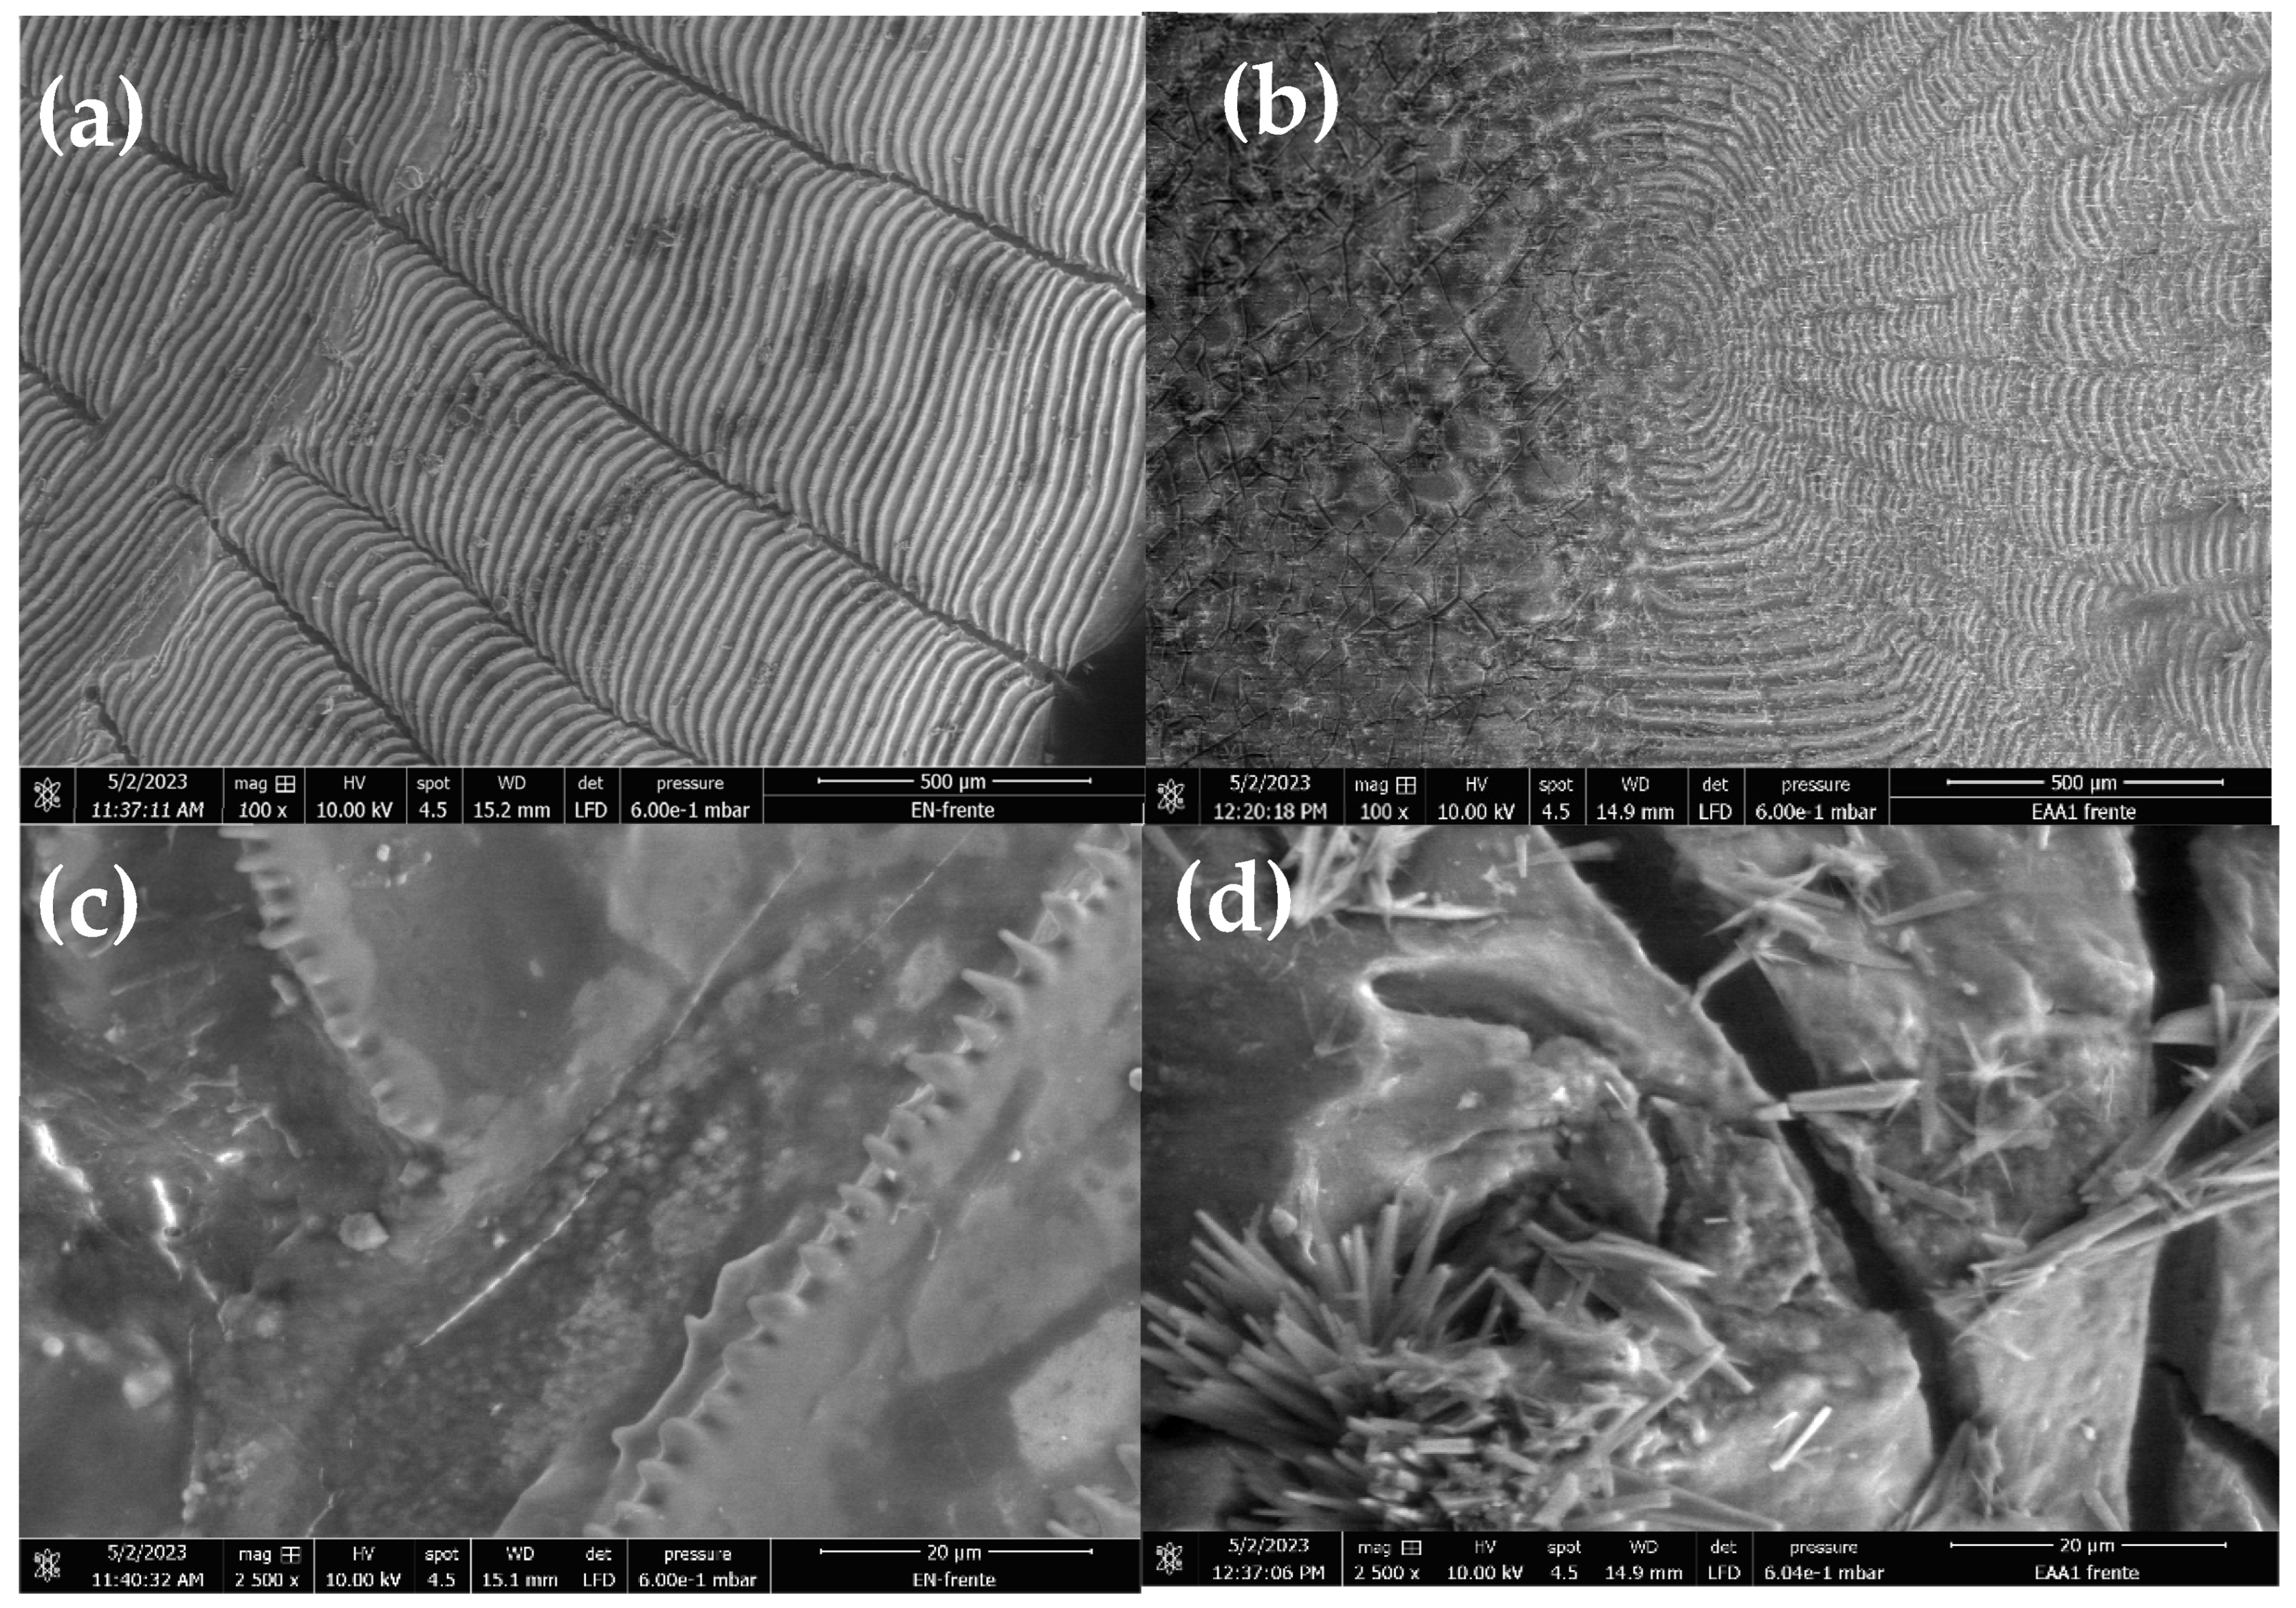
3.1.2. Morphology of Native and Modified Scales

Micrographs of the NFSs and MFSs are shown in Figure 2. Figure 2a,b show the morphology of the surface of the NFSs, which is smooth compared to the surface of the MFSs (Figure 2c,d), where pores generated due to the chemical treatment with acetic acid are observed. Similar results were reported by Fijul Kabir et al. [41], where the authors modified FSs using sulfuric acid to modify the surface and improve the adsorption of textile dyes. It is well known that NFSs are not porous and that the surface may have roughness or relief, but this does not generate good adsorption [39,42]. On the other hand, the porosity is a function of the intensity of the chemical treatment, whether acidic, basic, or both, as carried out by Teshale et al. [36], generating a honeycomb-type porous surface, capable of adsorbing heavy metals such as Cr (III). Some research has even reported good adsorption capacity when FSs are subjected to thermal treatment to generate activated carbon [43]. The most common chemical treatments to modify the surface of FSs are sulfuric acid and sodium hydroxide in addition to hydrochloric acid, so acetic acid is considered to be an acid that can be easily obtained, and due to its use in foods, it is not toxic at low concentrations.

3.1.3. Elemental Analysis Using XPS

Table 3 shows the results obtained in the XPS analysis carried out on the NFSs, MFSs, and modified fish scales after treatment (MFSATs). The chemical composition of fish scales can vary depending on the species and the environment that the fish inhabits; this is because some substances could remain adhered to them. In all the samples analyzed, three obvious signals of great intensity and with greater concentration arose in comparison to the rest of the elements present: C1s, O1s, and N1s (66.2, 20.5, and 8.2%, respectively), while the rest of the elements could be considered to be trace elements [44]. For the MFSs, an increase in N1s is observed, which could have been exposed after the chemical modification. Likewise, O1s increased because CH₃COOH could have remained attached to the surface in its crystalline form, as shown in Figure 2b. On the other hand, in the MFSAT sample, the presence of Pb4f and Cd3d is observed at a percentage of 1.1 and 0.2, respectively, which indicates that these metals were adhered to the surface of the flake and that Pb4f has greater affinity for the surface of the flake compared to Cd3d.

3.1.4. X-Ray Analysis of the Fish Scales Before and After Treatment

The X-ray diffraction pattern of the NFSs and MFSs is shown in Figure 3. The broad peaks corresponding to the apatite structure revealed that the flakes show relatively low levels of crystallinity due to the fact that the hydroxyapatite (HA) crystals could be as small as the HA crystals present in other mineralized collagen structures that are between 1.5 and 4 nm thick [45,46]. The peaks are found at 2θ = 26.2°, 29.4°, 32.7°, 39.5°, 43.2°, 47.8°, 48.6°, 50.36°, and 53.54°. These signals are seen in both diffractograms; however, in the MFS sample, some signals decreased in intensity, such as those located at 2θ = 29.4° and 53.54°; even the signal attributed to collagen in previous studies [47] at 2θ= 23°, observed as a wide band in both diffractograms, is diminished in the MFS sample due to the acid treatment. On the other hand, the signals observed at 2θ = 24.9° and 32.18° in the MFS sample could be attributed to the crystals observed in Figure 2d of the SEM analysis as a result of the applied acid treatment. However, the results obtained are comparable with previous data for fish scales [48] and other biological structures containing apatite [46,47,49].

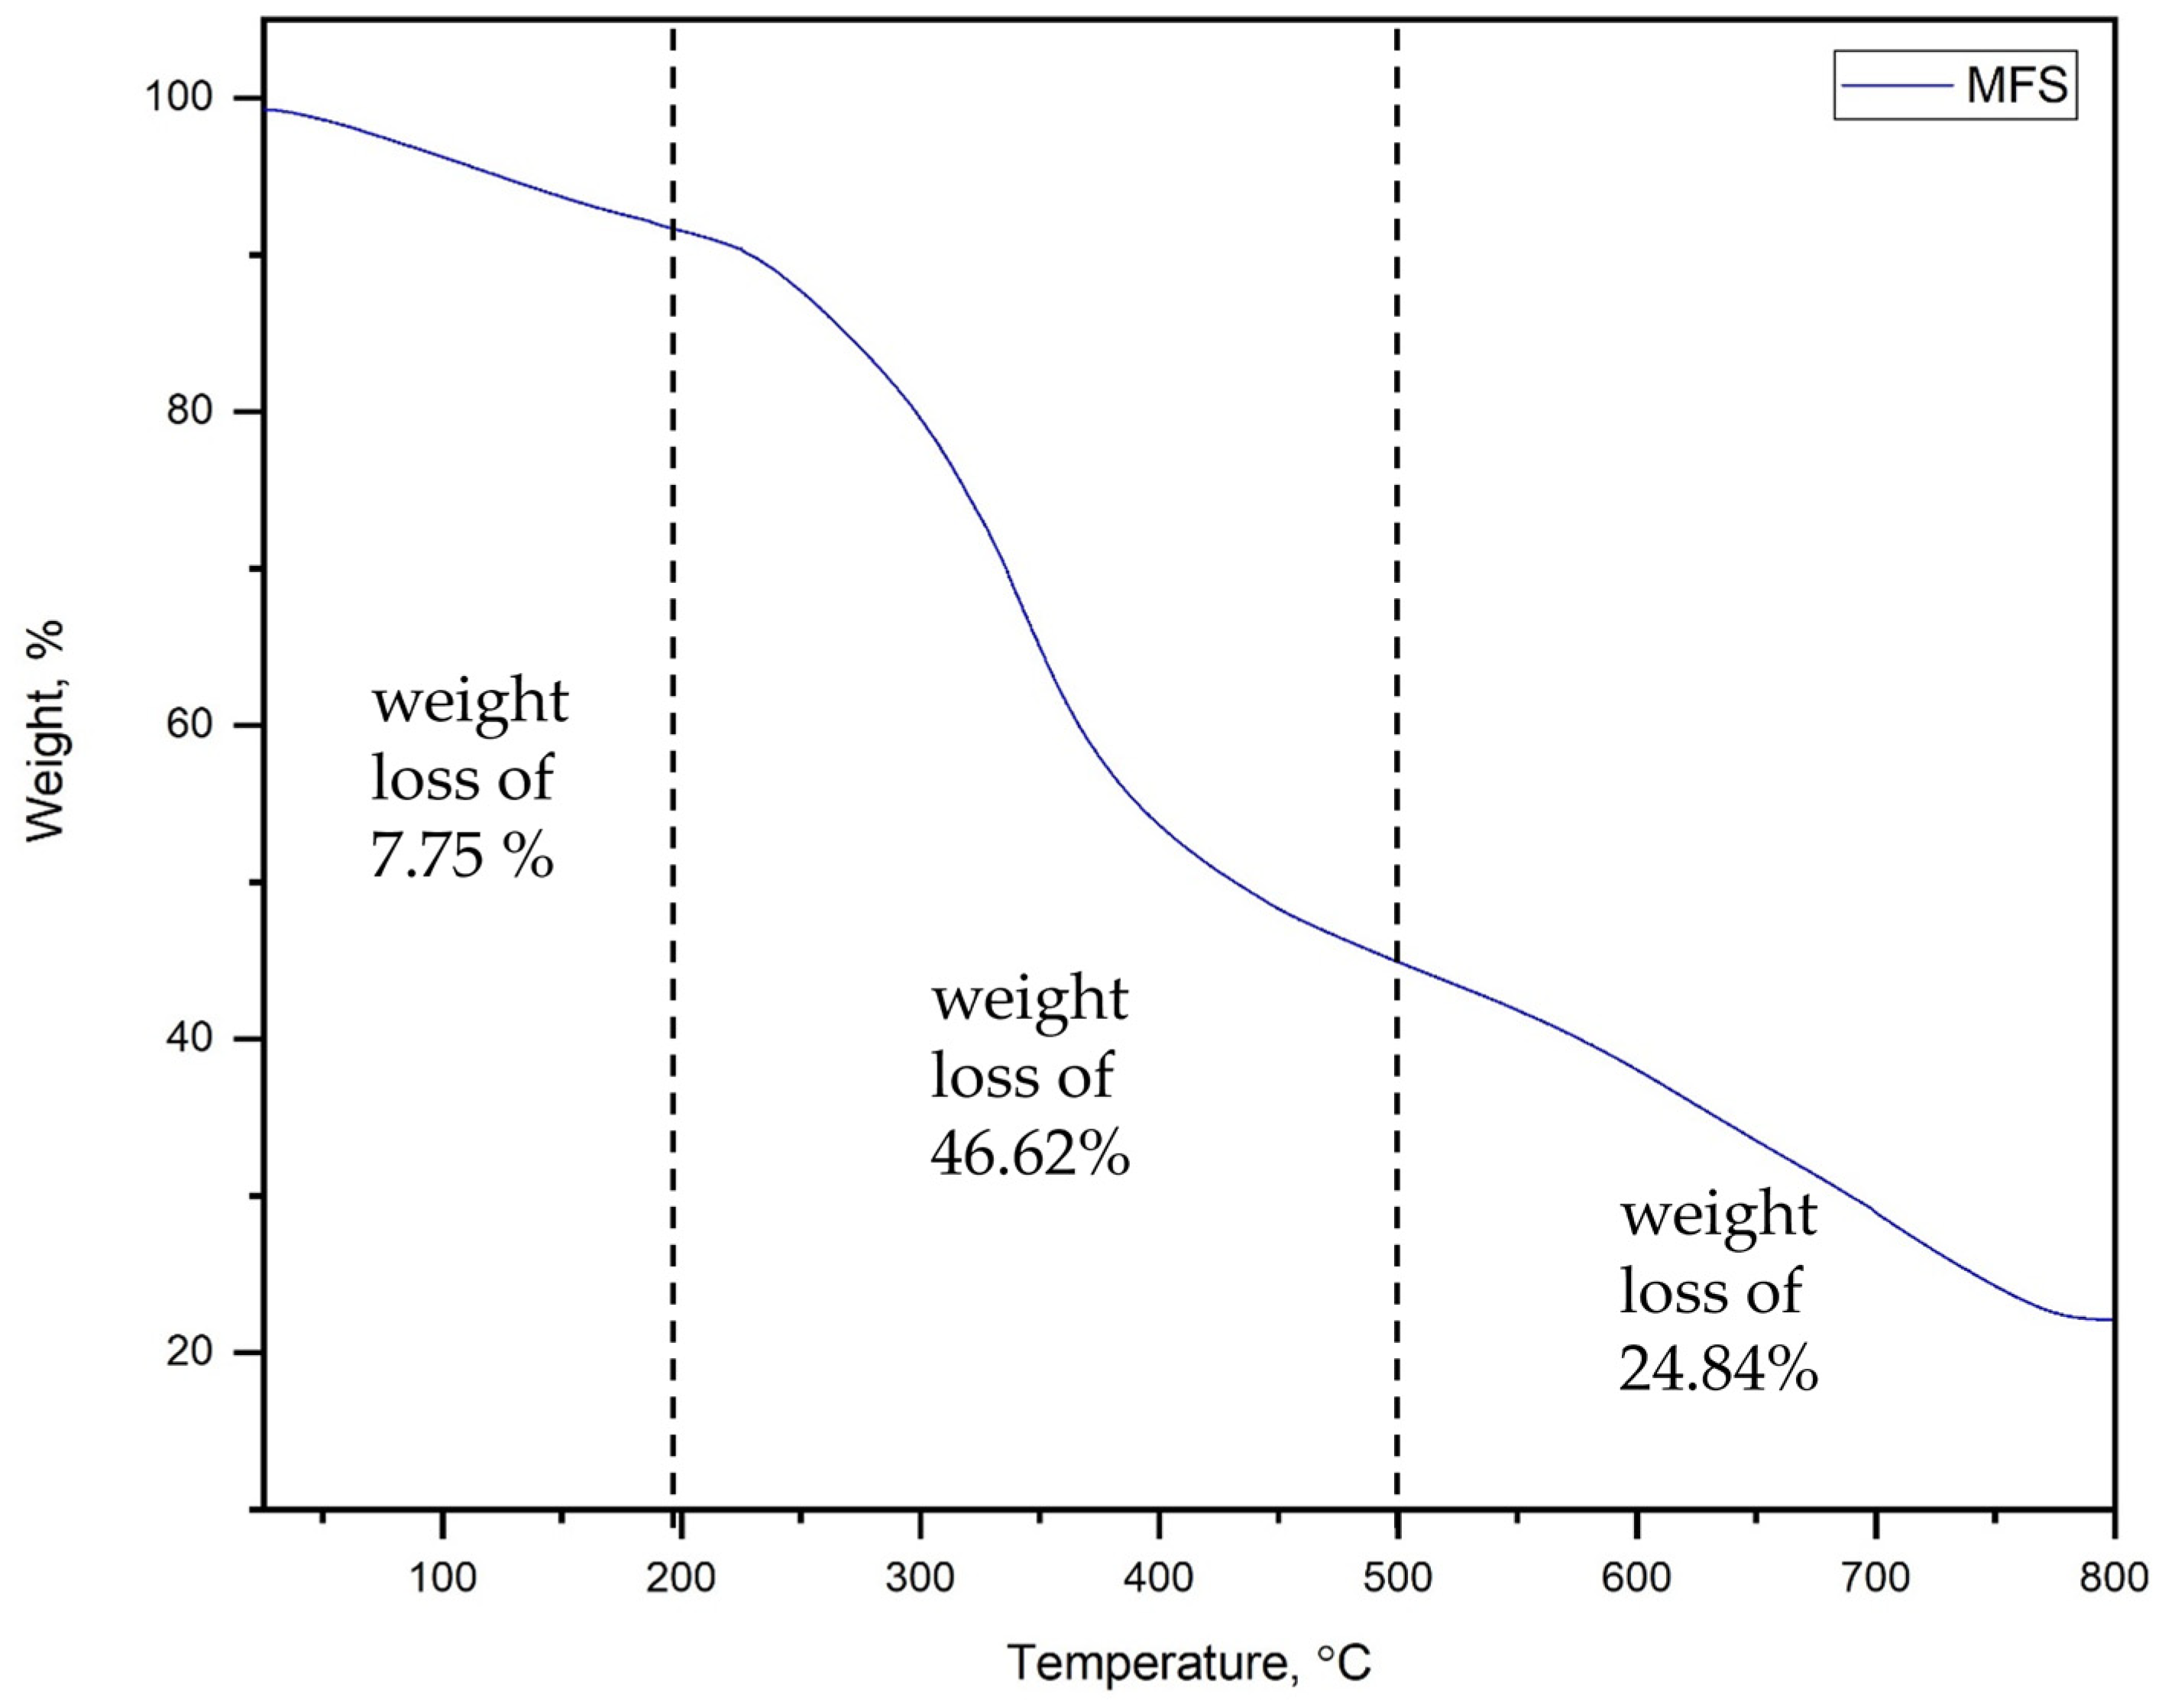
3.1.5. Thermal Gravimetric (TG) Analysis

Figure 4 shows the thermal degradation behavior of the modified fish scales. It is shown that three weight-loss stages were found. The first stage starts at room temperature and reaches 200 °C with a weight loss of 7.75%, which could be attributed to the evaporation of water from the powder of the modified fish scales. The weight loss of the second stage was found to be 46.62% within a temperature range of 200–500 °C. This could be attributed to the decomposition of organic materials, such as proteins. In addition, an extension of the third stage from 500 °C to 800 °C was observed with a weight loss of 22.84%. This could be attributed to the formation of the deoxygenated hydroxyapatite via the dihydroxylation process and the conversion of calcium carbonate to calcium oxide. The obtained results agree with the literature on native fish scales in temperatures of up to 200 °C. However, higher weight loss (46.62%) was observed at temperatures ranging from 200 °C to 500 °C compared to the native fish scales (30%) [31]. Thus, the modified fish scales were stable up to 200 °C in this work, and they could be used in the removal of Pb(II) and Cd(II) from aqueous solutions.

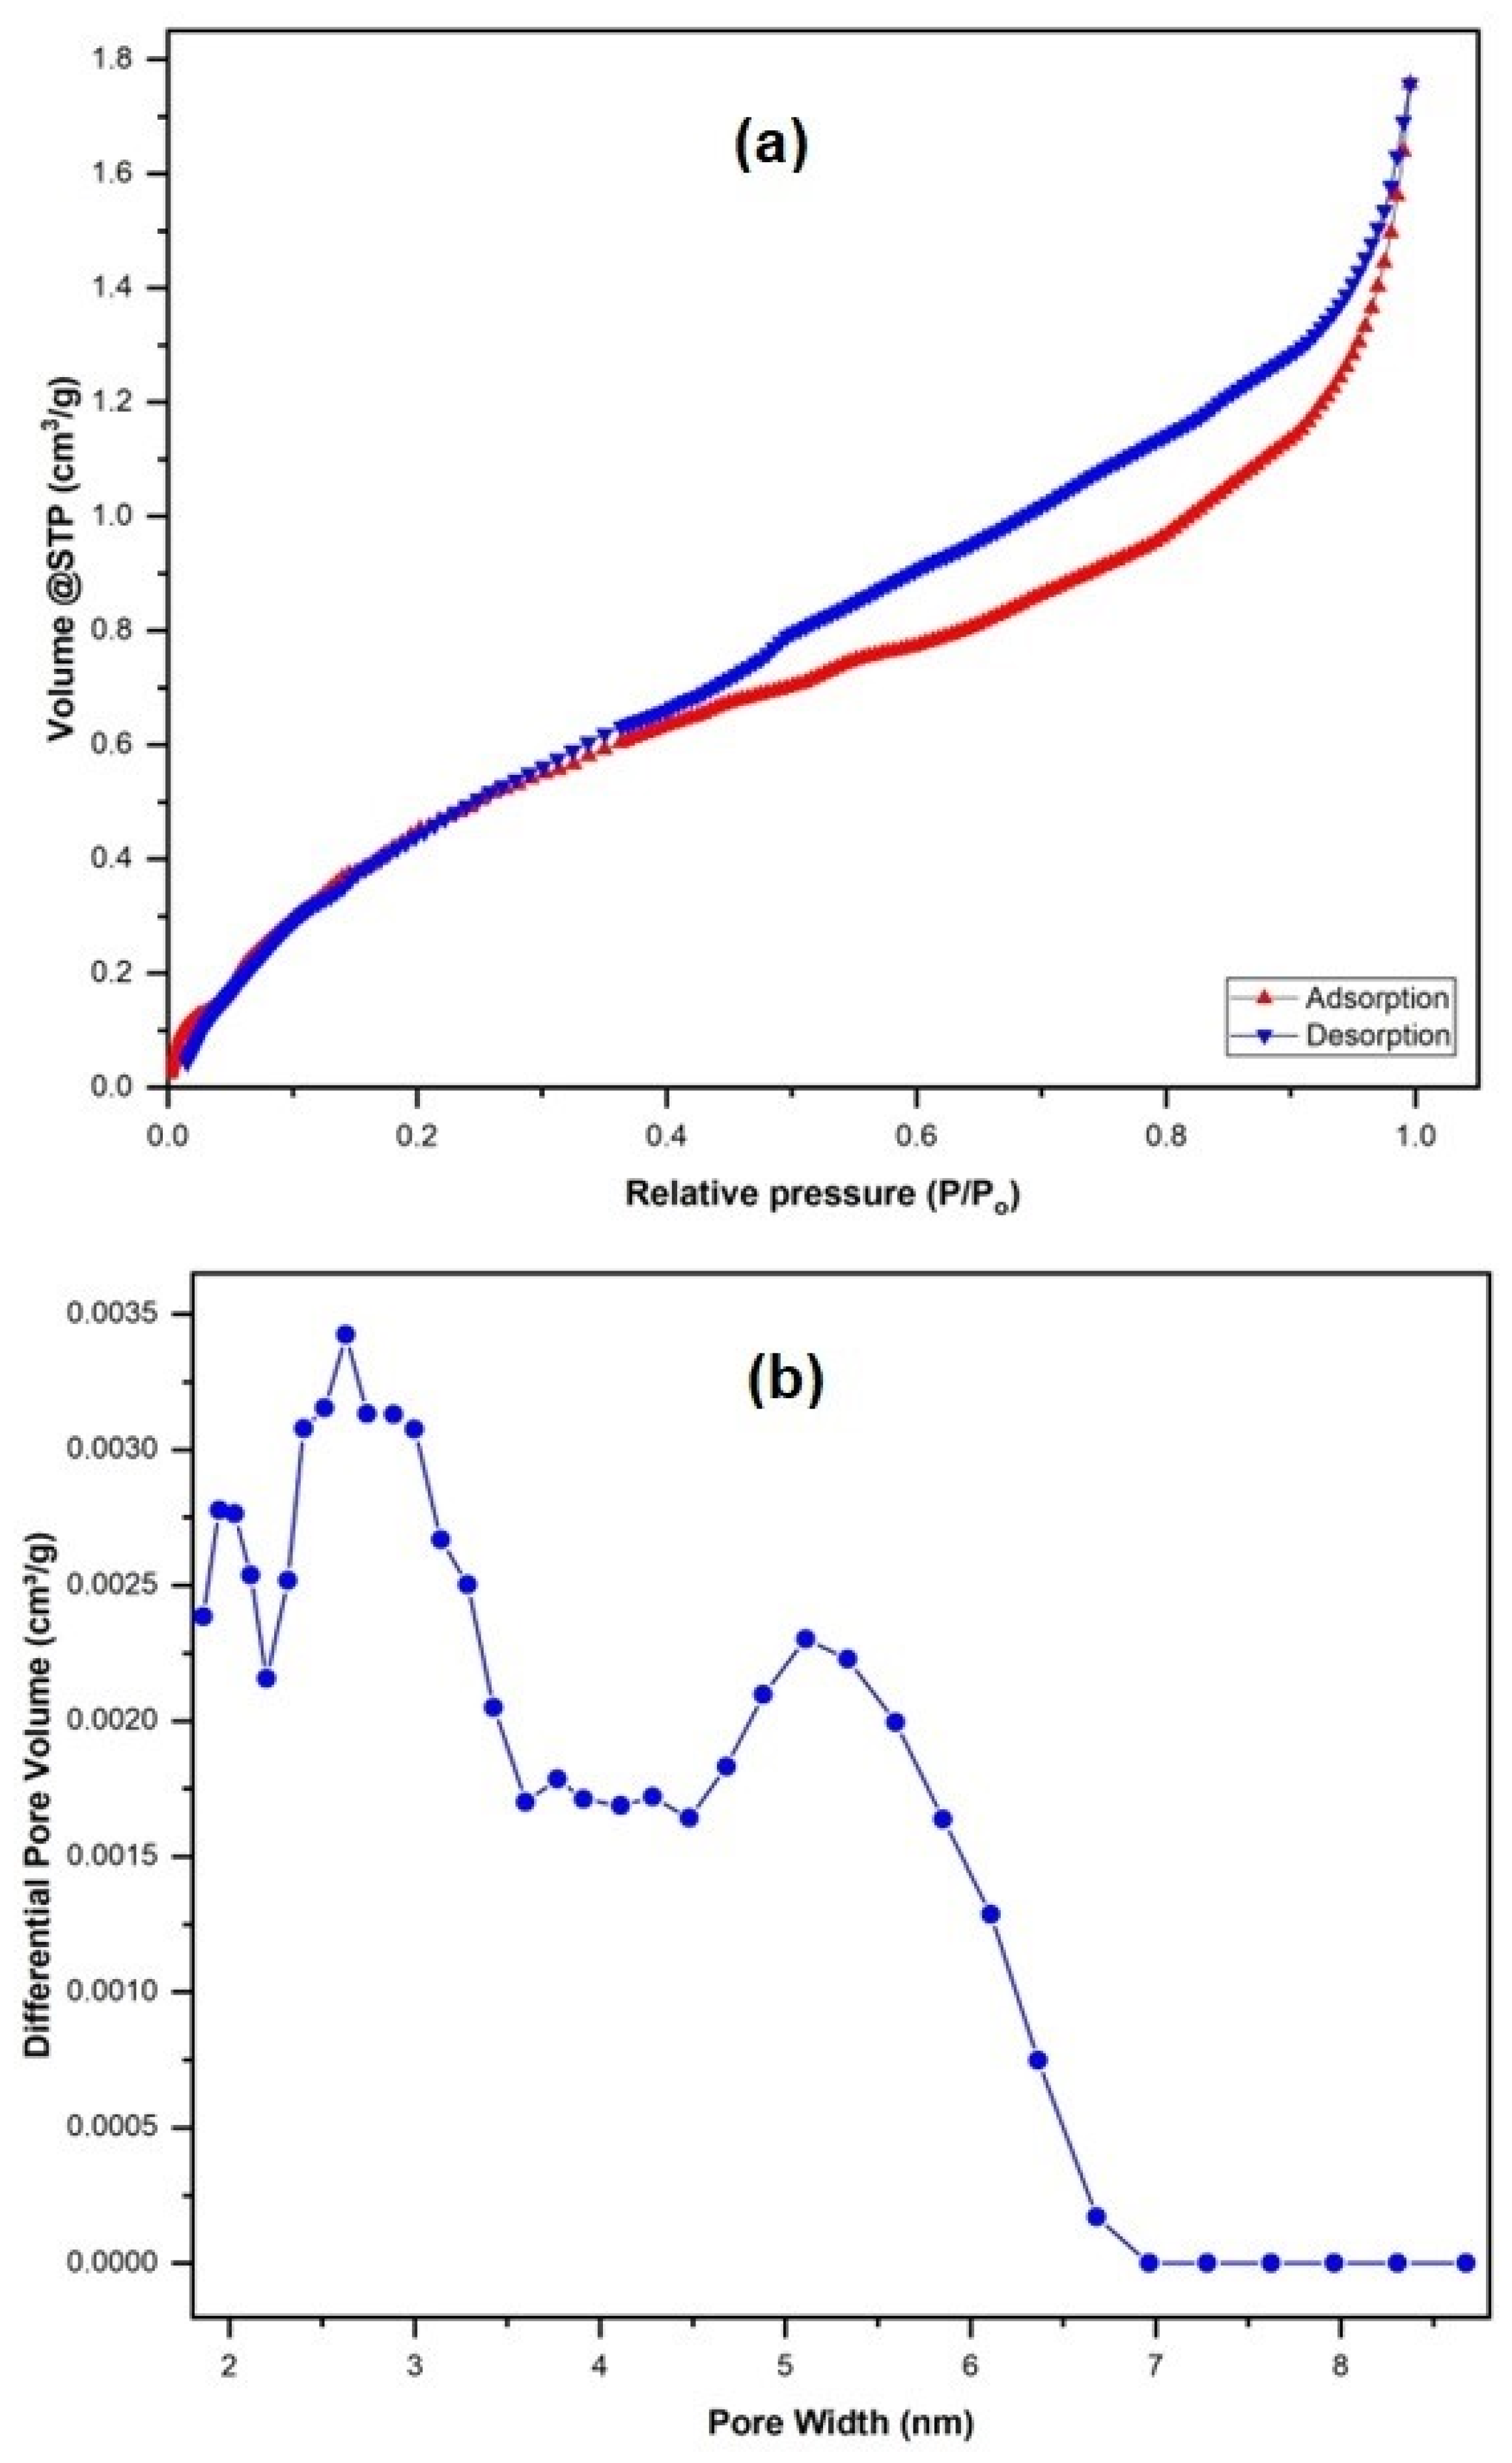
3.1.6. Brunauer–Emmett–Teller (BET) Analysis

Nitrogen sorption analysis (Figure 5a) gave a total pore volume of adsorption of 0.0026 cm3/g, Langmuir surface area of 4.40 m2/g, and BET surface area of 1.91 m2/g, which is quite similar to the native fish scales’ BET surface area of 2.80 m2/g and pore volume of 0.0020 [31]. The non-local density functional theory gave an average pore size of 2.62 nm (Figure 5b) as a well-defined mesopore structure that could be a good framework for the future fabrication of nanocomposites.

3.2. Pb(II) and Cd(II) Removal

In Table 2 and Figure 6, the removal efficiency (RE) of lead (Pb(II)) and cadmium (Cd(II)) is shown as a function of several experimental variables: the pH, adsorbent dose (grams), and contact time (minutes). The effect of pH significantly influences the RE of both metals. For instance, at pH 5, the removal efficiency reaches up to 82.8% for Pb(II) in experiment 4, whereas at pH 7, it tends to decrease (45.6%), as observed in experiment 3. Some researchers state that acidic aqueous solutions favor the removal of certain metallic contaminants, such as As(IV) and As(V), due to their charge [50]. In the case of Cd(II), at pH 7, the removal significantly improves to 77.8% in experiment 4, indicating a higher affinity of the bioadsorbent for Cd(II) at this pH. Furthermore, increasing the dose improves the removal efficiency of both metals, although this trend is not as pronounced for Cd(II) as it is for Pb(II). For instance, in the case of Pb(II), in experiment 5, with 0.4 g of MFSs, the removal efficiency was 60.5%, which is very close to the efficiency (65.9%) observed in experiment 9 with 1 g of MFSs.
For Pb(II), when comparing experiments 1 and 4 with doses of 0.4 g and 1 g, respectively, the RE increases from 77.6% to 82.2%, with both experiments conducted at pH 5 and 60 min of exposure. Regarding the contact time, the RE tends to stabilize or slightly decrease with prolonged times. For example, for Pb(II), in experiment 6 at pH 5 and a dose of 0.8 g, the RE slightly decreases from 77.4% to 75.8%, as shown in experiment 10 at pH 5, a dose of 0.4 g, and 120 min. of contact time. For Cd(II), a similar trend to lead is observed. In experiment 2, with pH 4, a dose of 0.8 g, and 60 min. of contact, the RE decreases from 66.2% to 64.7%, as seen in experiment 11 at pH 4, a dose of 0.8 g, and 120 min. of contact time. These results highlight the importance of optimizing the specific experimental conditions for each heavy metal, since their removal is highly dependent on parameters such as the pH, dose, and contact time. Variable optimization is discussed in the next section.
Table 4 shows that MFSs are effective for the removal of Pb(II) from municipal wastewater with an initial pH of 5 and a Pb(II) and Cd(II) concentration of 200 mg/L, with a progressive increase in the removal efficiency as the contact time increases. It is observed that, after 1 min, 61.52% removal of Pb(II) is achieved, which increases to 84.09% after 60 min. This behavior suggests that the gradual interaction between P(II) and the active sites on the surface of the scales controls the adsorption process. In the case of cadmium, the removal efficiency remains consistently high, staying between 89.65% and 89.85% throughout the contact time (from 1 to 60 min). This stability can be attributed to a particularly high affinity of Cd(II) for the components of the fish scales, allowing for rapid and effective adsorption from the beginning of the process [36]. Moreover, the low variation in the standard deviation over time suggests that fish scales have a uniform capacity to adsorb cadmium, which is a significant advantage in practical applications where consistency in treatment is crucial.
Although both heavy metals are effectively removed, Cd(II) exhibits higher removal efficiency in the initial minutes compared to Pb(II). This could be related to differences in the physicochemical properties of the metals, such as their ionic size, charge, or affinity for the active sites on the scales. Similarly, Pb(II) behavior suggests that it requires more time to reach saturation at the available adsorption sites, similar to what was observed in the model water. Cd (II) appears to saturate these sites rapidly.

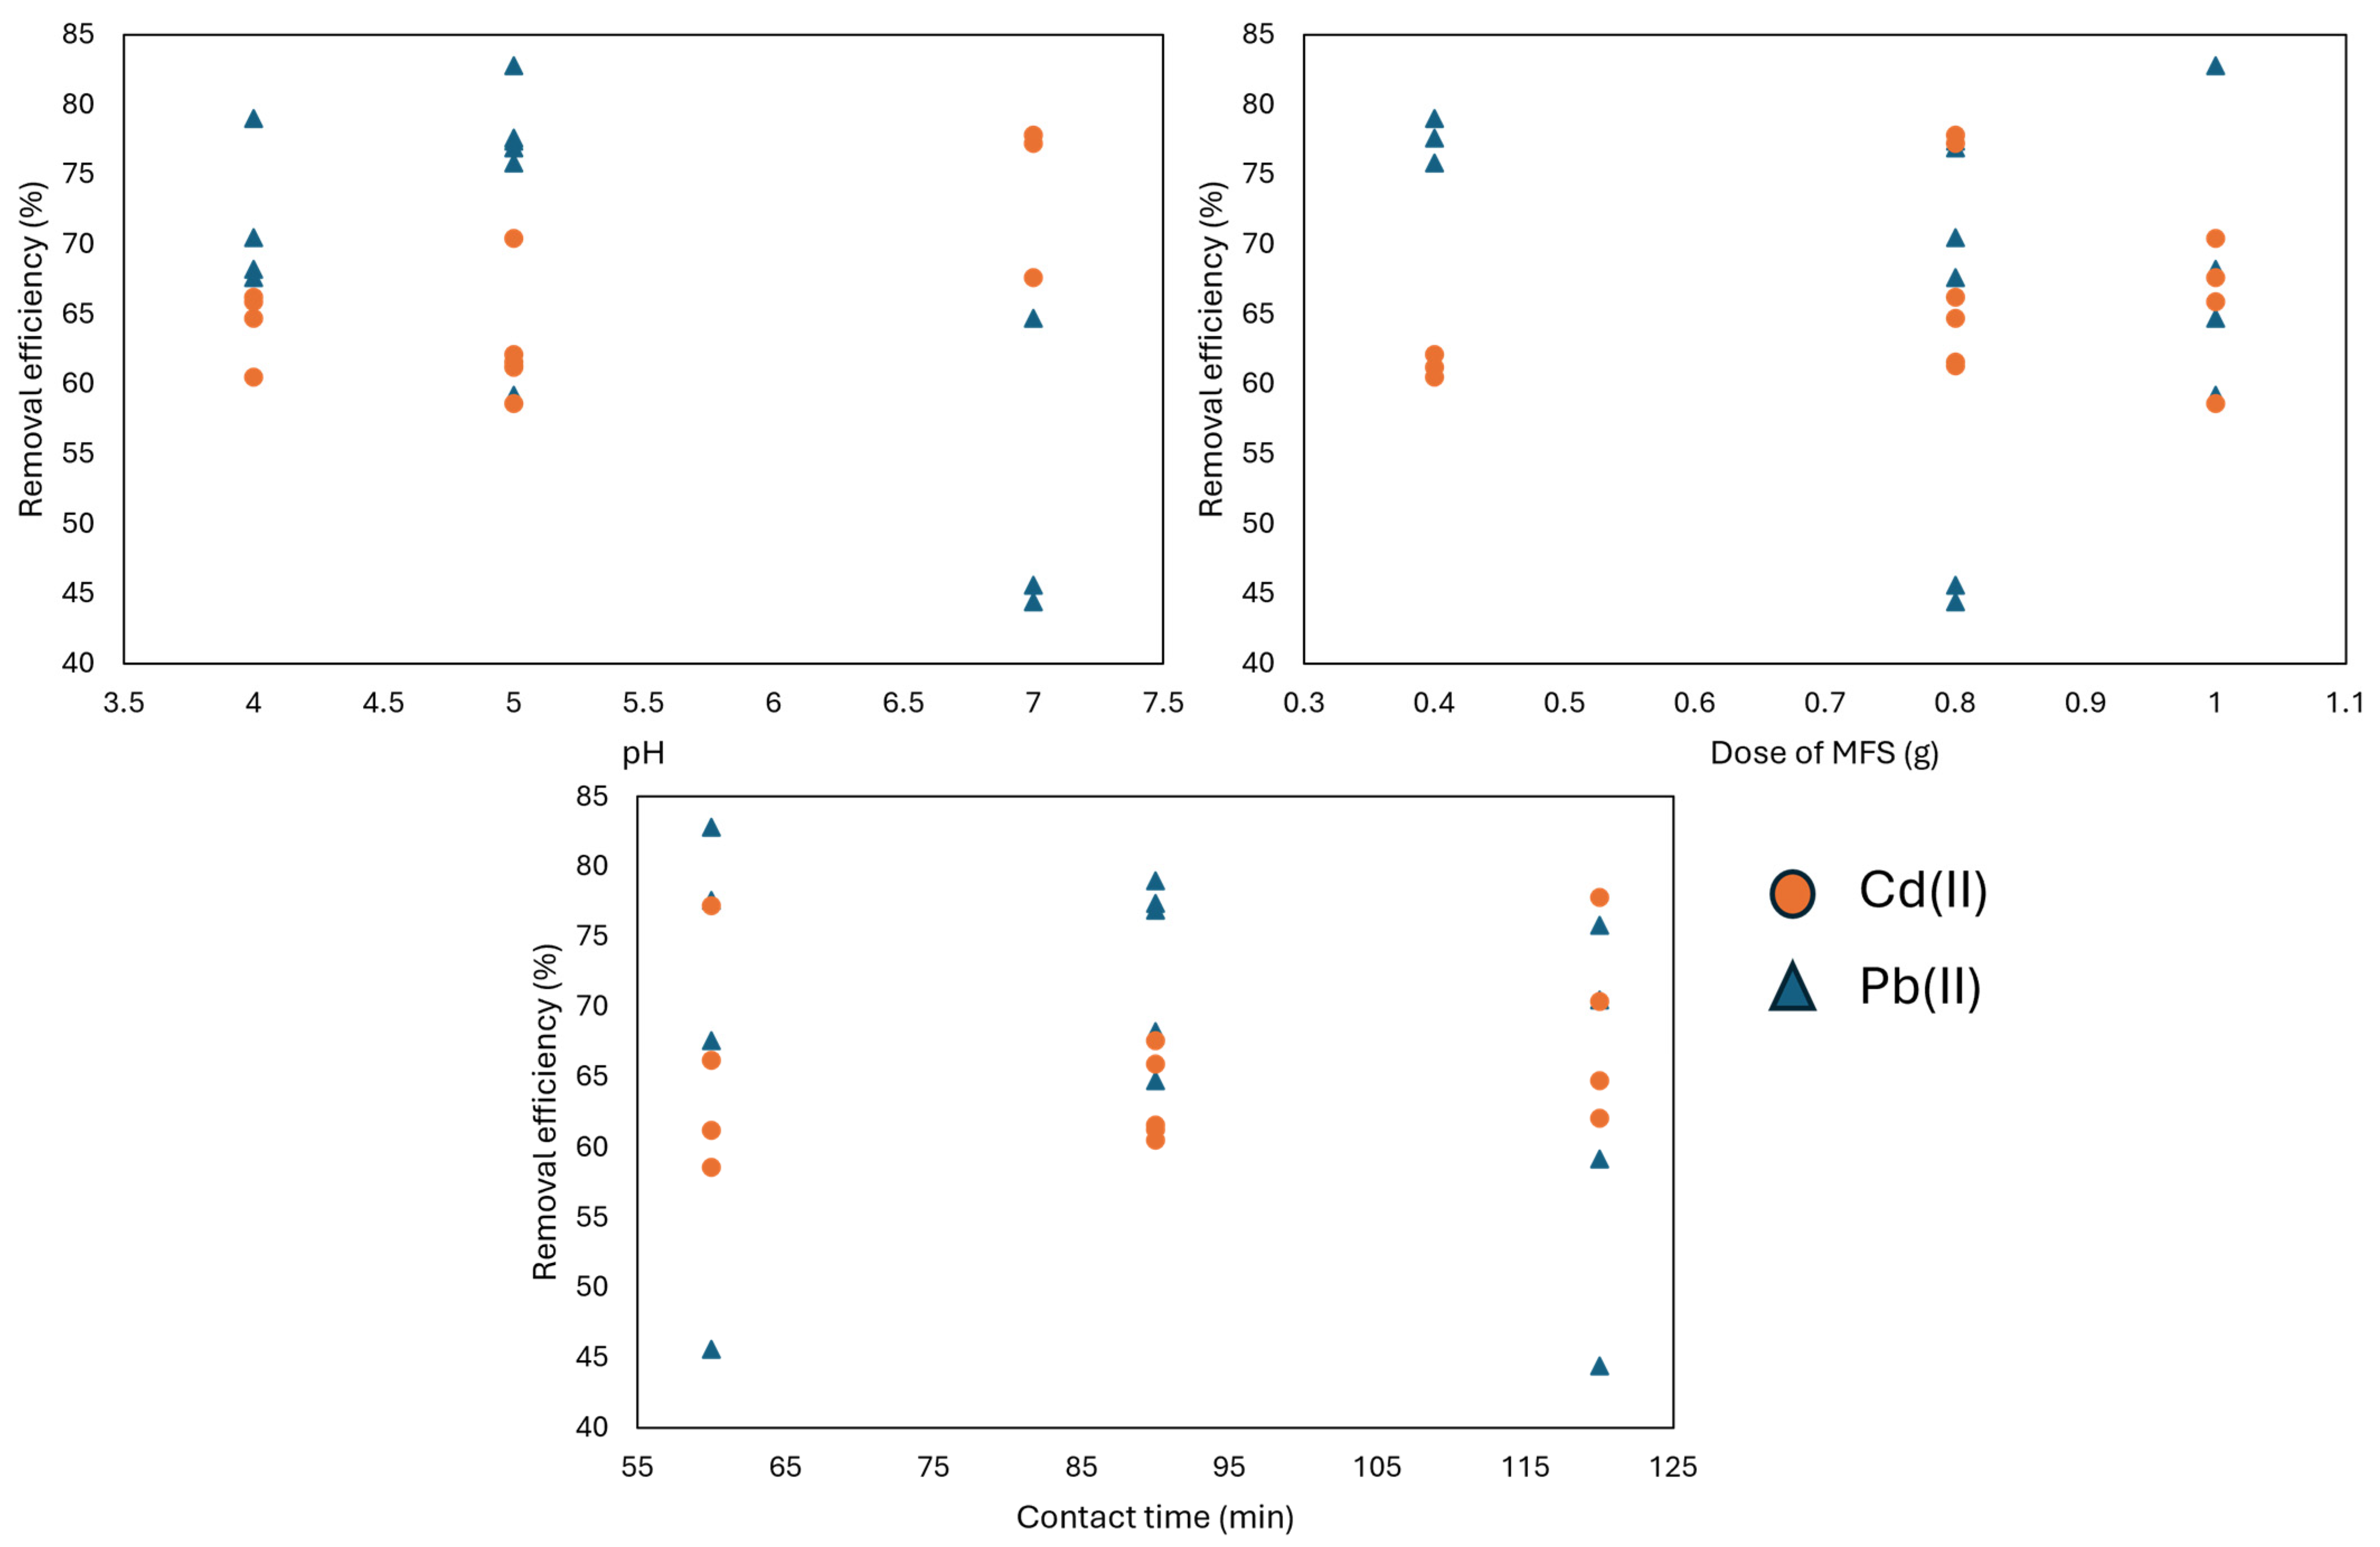
3.3. Optimization of Pb(II) and Cd(II) Ion Removal Using RSM

The experimental design was evaluated to identify the optimal conditions for the adsorption process parameters, the pH (X1), adsorbent dose (X2), and contact time (X3), in the adsorption of lead (Y1) and cadmium (Y2) using Minitab 19. Laboratory experiments were conducted at a constant initial concentration of 200 mg/L for each contaminant, Cd(II) and Pb(II), with a stirring speed of 200 rpm at room temperature. The results were analyzed using analysis of variance (ANOVA) for a quadratic regression model to identify significant model terms [51]. To determine the significance of the quadratic model, ANOVA was performed, and the findings are presented in Table 5. According to the analysis, model terms with probability values (Prob.>F) below 0.05 were considered significant for the removal of Pb(II) and Cd(II) ions. For Pb(II), the terms X1 and X3 were the least significant, while terms with Prob > 0.1000 were deemed non-significant. For Cd(II), only X3, X12, and X22 were significant model terms, whereas the remaining terms were not. The quality of the developed model was assessed using the correlation coefficient (R2) and standard deviation. For Pb(II), the “predicted R2” value of 0.6261 aligns reasonably well with the “adjusted R2” value of 0.7877, with a difference of less than 0.2, likely due to the signal-to-noise relationship [36]. Similarly, for Cd(II), the “predicted R2” and “adjusted R2” were 0.6181 and 0.7367, respectively, indicating the suitability of the generated quadratic model. Hence, this model can effectively guide the design space. Despite certain limitations, the quadratic regression model used in this study provides valuable insights into the adsorption of Pb(II) and Cd(II) ions using MFSs. The applicability of the model is supported by the high correlation between the predicted and fitted R2 values (e.g., 0.6261 and 0.7877 for Pb(II)), indicating a reasonable predictive capability. However, the model has shortcomings. For example, some interaction terms were not significant (e.g., X1X2 for Pb(II), X1X3 for Cd(II)), and the predicted R2 for Cd(II) (0.6181) was somewhat lower than desired, suggesting that there is room for improvement in predicting certain responses. These shortcomings affect the model’s applicability by introducing uncertainty into specific predictions, particularly in scenarios where non-significant interactions might play a role. Despite this, the model remains valuable for understanding the adsorption process and optimizing experimental conditions. The statistical significance of most linear, quadratic, and interaction terms ensures that the model captures critical factors influencing adsorption efficiency, such as the pH, adsorbent dosage, and contact time. Furthermore, the consistency of the experimental results, supported by normal probability plots and other statistical measures, reinforces the robustness of the model in guiding practical adsorption studies. Thus, while limitations are acknowledged, the model serves as an effective tool for optimizing conditions and improving the understanding of adsorption mechanisms. Future improvements could include incorporating additional data points or higher-order interactions to improve accuracy and broaden applicability. Teshale et al. [36] applied a similar model to Cr(III) uptake with a similar r of 0.666, with non-significant dosage*pH and pH*contact time interactions; however, they reported that this model can be used to navigate or steer the design space.
The regression coefficients along with their corresponding high and low 95% confidence intervals (CIs) are provided in Table 6.
From the experimental data of the design, the quadratic polynomial model equation for Pb(II) and Cd(II) adsorption using MFSs is mentioned in the final coded factor of Equations (3) and (4), respectively.
Y1 = 45.44 + 15.14 X1 + 6.84 X2 + 5.93 X3 + 23.64 X12 − 10.03 X22 + 16.83 X32 − 2.75 X1X2 + 2.07 X1X3 +10.87 X2X3
Y2 = 14.42 + 0.39 X1 − 6.76 X2 − 1.39 X3 + 4.57 X12 + 3.94 X22 + 2.13 X32 − 0.18 X1X2 − 1.15 X1X3 − 1.15 X2X3
The scored data were analyzed to assess the normality of the residuals and the correlation between the actual and predicted response values (Y), as illustrated in Figure 7. The normal probability plot reveals that the residuals closely follow a normal distribution. This indicates that the experimental data points align well with the straight line on the graphs, confirming that the quadratic polynomial model meets the assumptions required for analysis of variance [4]. The results for various operating parameters are illustrated in Figure 7a–f. Among these, the initial pH of the solution is identified as the most critical factor influencing the adsorption of metal ions. The effect of pH on Cd(II) and Pb(II) adsorption was studied under constant conditions: an adsorbent dose of 0.70 g, a contact time of 90 min, an initial Cd(II) concentration of 200 mg/L, and a pH range of 4 to 8. Maximum Cd(II) removal occurred at pH 4, as shown in Figure 7a. At pH levels closer to neutral, the removal efficiency decreased due to weaker electrostatic attraction between the adsorbate and the oppositely charged adsorbent [52]. Between pH 6 and 8, Cd(II) adsorption rates remained steady, but further increases in pH reduced efficiency due to the formation of soluble hydroxyl complexes that hinder metal ion adhesion [53,54]. In a separate study, nearly 99.92% of Cr(IV) was removed using Artocarpus heterophyllus husk as a bioadsorbent at pH 2, an initial concentration of 50 mg/L, a biosorbent dose of 0.3 g, a stirring speed of 100 rpm, and a temperature of 35 °C [55]. Similarly, Teshale et al. [36] confirmed that the adsorption of metals such as Cd(II), Pb(II), Cr(III), and Cr(IV) is more efficient under acidic conditions than under alkaline conditions. For instance, the effect of adsorbent dosage on Cr(III) removal at room temperature was investigated by varying the adsorbent dose from 0.4 g to 1 g in a solution with a Cr(III) concentration of 150 mg/L at pH 5.5 over 90 min. An increase in the bioadsorbent dose from 0.4 g to 0.8 g resulted in 99.75% Cr(III) removal, likely due to the greater availability of adsorption sites and surface area [56]. In this study, a bioadsorbent concentration of 1 g/L of MFSs achieved the highest Cd(II) removal efficiency (94%) at 120 min, as shown in Figure 7b,f. This could be attributed to particle interactions, such as agglomeration or equilibrium between chromium ions and the solid phase [57]. The positive correlation between the adsorbent dosage and Cd(II) and Pb(II) removal may be linked to the increased surface area and availability of adsorption sites [58]. Similarly, Prabu et al. [59] reported that a fish scale bioadsorbent dose of 8 mg/L was sufficient to achieve 99.75% Cr removal at an initial Cr concentration of 50 mg/L, pH 5, and a contact time of 5 h. The effect of contact time on Cd(II) and Pb(II) reduction was evaluated at intervals of 60, 90, and 120 min. The removal efficiency increased significantly from 60 to 90 min, reaching equilibrium at 120 min. This is probably due to the availability of a larger surface area generated on the surface of fish scales after chemical treatment due to the removal of gelling substances, chitosan, etc. [29], which prolongs the contact between the adsorbent surface and the adsorbate (metal ions) in solution [32]. At equilibrium, the active sites of the adsorbent became saturated, and the adsorption rate was controlled by the transport of the adsorbate from the outer to the inner sites of the adsorbent particles [60].

4. Conclusions

The removal of Cd(II) and Pb(II) ions from synthetic wastewater solutions was successfully demonstrated using waste fish scales as a bioadsorbent. The findings reveal that activated fish scales have significant potential for removing heavy metals from industrial wastewater. The experimental results showed that 94% of Cd(II) and 83% of Pb(II) ions could be removed using an adsorbent dose of 1 g at a pH of 5, with a contact time of 120 min for Cd(II) and 60 min for Pb(II) and an initial concentration of 200 mg/L for both metals. The removal efficiency was influenced by the pH and contact time, increasing until the saturation point of the adsorbent was reached.
FTIR analysis confirmed the presence of carboxyl, amine, and hydroxyl functional groups in the fish scales, which are involved in the adsorption process. XRD analysis showed that the fish scales exhibit amorphous properties, consistent with observations from scanning electron microscopy. The BET analysis results provide critical insights into the textural properties of modified fish scales. These properties suggest that the modified fish scales may serve as a robust framework for future nanocomposite fabrication.
Future research could explore the application of fish scales to real wastewater treatment and the regeneration of bioadsorbents. Additionally, the adsorption efficiency could be enhanced by incorporating nanoparticles into the flakes. Based on these results, waste fish scales offer a sustainable and effective alternative for removing Cd(II) and Pb(II) ions, contributing to the reduction in environmental pollution.

Author Contributions

Conceptualization, E.J.L.C. and Y.H.P.; methodology, Y.H.P.; software, E.J.L.C.; validation, E.J.L.C., A.A.M. and J.M.E.; formal analysis, Y.H.P., E.J.L.C. and A.A.M.; investigation, Y.H.P.; resources, E.J.L.C. and X.F.; data curation, Y.H.P.; writing—original draft preparation, Y.H.P.; writing—review and editing, E.J.L.C. and A.A.M.; visualization, E.M.-P.; supervision, J.M.E.; project administration, E.J.L.C.; funding acquisition, E.M.-P. All authors have read and agreed to the published version of the manuscript.

Funding

This research received no external funding.

Data Availability Statement

The original contributions presented in this study are included in the article. Further inquiries can be directed to the corresponding authors.

Acknowledgments

Corresponding author Leal-Castañeda acknowledges the financial support of the SIP-20230130 project. Thanks go to the Center of Nano-sciences and Micro- and Nanotechnologies at IPN. Ahmad Abo Markeb is the recipient of a postdoctoral fellowship from the Spanish Ministerio de Universidades, María Zambrano ID 715364.

Conflicts of Interest

The authors declare no conflicts of interest. The funders had no role in the design of this study; in the collection, analyses, or interpretation of data; in the writing of this manuscript; or in the decision to publish the results.

References

  1. Budi, H.; Catalan Opulencia, M.; Afra, A.; Abdelbasset, W.; Abdullaev, D.; Majdi, A.; Taherian, M.; Ekrami, H.; Mohammadi, M. Source, toxicity and carcinogenic health risk assessment of heavy metals. Rev. Environ. Health 2024, 39, 77–90. [Google Scholar] [CrossRef]
  2. Kumari, D.; Goswami, R.; Kumar, M.; Mazumder, P.; Kataki, R.; Shim, J. Removal of Cr (VI) ions from the aqueous solution through nanoscale zero-valent iron (nZVI) Magnetite Corn Cob Silica (MCCS): A bio-waste based water purification perspective. Groundwater Sustain. Dev. 2017, 7, 470–476. [Google Scholar] [CrossRef]
  3. Hozien, Z.A.; El-Mahdy, A.F.; Ali, L.S.; Markeb, A.A.; El-Sherief, H.A. One-pot synthesis of some new s-triazole derivatives and their potential application for water decontamination. ACS Omega 2021, 6, 25574–25584. [Google Scholar] [CrossRef] [PubMed]
  4. Markeb, A.A.; Moral-Vico, J.; Sánchez, A.; Font, X. Optimization of lead (II) removal from water and wastewater using a novel magnetic nanocomposite of aminopropyl triethoxysilane coated with carboxymethyl cellulose cross-linked with chitosan nanoparticles. Arab. J. Chem. 2023, 16, 105022. [Google Scholar] [CrossRef]
  5. Yin, H.; Zhu, J.k. In situ remediation of metal contaminated lake sediment using naturally occurring, calcium-rich clay mineral-based low-cost amendment. Chem. Eng. J. 2016, 285, 112–120. [Google Scholar] [CrossRef]
  6. Pal, D.; Maiti, S.K. An approach to counter sediment toxicity by immobilization of heavy metals using waste fish scale derived biosorbent. Ecotoxicol. Environ. Saf. 2020, 187, 109833. [Google Scholar] [CrossRef]
  7. Yang, Z.; Fang, Z.; Zheng, L.; Cheng, W.; Tsang, P.E.; Fang, J.; Zhao, D. Remediation of lead contaminated soil by biochar-supported nano-hydroxyapatite. Ecotoxicol. Environ. Saf. 2016, 132, 224–230. [Google Scholar] [CrossRef] [PubMed]
  8. Gheju, M.; Balcu, I. Removal of chromium from Cr (VI) polluted wastewaters by reduction with scrap iron and subsequent precipitation of resulted cations. J. Hazard. Mater. 2011, 196, 131–138. [Google Scholar] [CrossRef]
  9. Golbaz, S.; Jafari, A.J.; Rafiee, M.; Kalantary, R.R. Separate and simultaneous removal of phenol, chromium, and cyanide from aqueous solution by coagulation/precipitation: Mechanisms and theory. Chem. Eng. J. 2014, 253, 251–257. [Google Scholar] [CrossRef]
  10. Verma, S.K.; Khandegar, V.; Saroha, A.K. Removal of chromium from electroplating industry effluent using electrocoagulation. J. Hazard. Toxic Radioact. Waste 2013, 17, 146–152. [Google Scholar] [CrossRef]
  11. Vander Hoogerstraete, T.; Wellens, S.; Verachtert, K.; Binnemans, K. Removal of transition metals from rare earths by solvent extraction with an undiluted phosphonium ionic liquid: Separations relevant to rare-earth magnet recycling. Green Chem. 2013, 15, 919–927. [Google Scholar] [CrossRef]
  12. Mohammed, K.; Sahu, O. Bioadsorption and membrane technology for reduction and recovery of chromium from tannery industry wastewater. Environ. Technol. Innov. 2015, 4, 150–158. [Google Scholar] [CrossRef]
  13. Gutiérrez-Corona, J.F.; Romo-Rodríguez, P.; Santos-Escobar, F.; Espino-Saldaña, A.E.; Hernández-Escoto, H. Microbial interactions with chromium: Basic biological processes and applications in environmental biotechnology. World J. Microbiol. Biotechnol. 2016, 32, 191. [Google Scholar] [CrossRef]
  14. Vikrant, K.; Giri, B.S.; Raza, N.; Roy, K.; Kim, K.H.; Rai, B.N.; Singh, R.S. Recent advancements in bioremediation of dye: Current status and challenges. Bioresour. Technol. 2018, 253, 355–367. [Google Scholar] [CrossRef] [PubMed]
  15. Melia, P.M.; Cundy, A.B.; Sohi, S.P.; Hooda, P.S.; Busquets, R. Trends in the recovery of phosphorus in bioavailable forms from wastewater. Chemosphere 2017, 186, 381–395. [Google Scholar] [CrossRef] [PubMed]
  16. Deegan, A.M.; Shaik, B.; Nolan, K.; Urell, K.; Oelgemöller, M.; Tobin, J.; Morrissey, A. Treatment options for wastewater effluents from pharmaceutical companies. Int. J. Environ. Sci. Technol. 2011, 8, 649–666. [Google Scholar] [CrossRef]
  17. Qasim, W.; Mane, A.V. Characterization and treatment of selected food industrial effluents by coagulation and adsorption techniques. Water Resour. Ind. 2013, 4, 1–12. [Google Scholar] [CrossRef]
  18. Visa, M. Synthesis and characterization of new zeolite materials obtained from fly ash for heavy metals removal in advanced wastewater treatment. Powder Technol. 2016, 294, 338–347. [Google Scholar] [CrossRef]
  19. Ojoawo, S.O.; Oyekanmi, S.E.; Naik, P.A. Adsorption and Desorption of Fe2+ Using Sugarcane Bagasse Activated Carbon in Remediating Metal Galvanizing Industrial Wastewater. Think India J. 2019, 22, 15021–15034. [Google Scholar]
  20. Rajapakshe, R.B.S.D.; Gangani, P.W.D.P.; Thennakoon, C.A.; Prabath Nilan Gunasekara, N.S. Preparation of Hematite Nano Particles from Galvanizing Effluents for the Applications in Heavy Metal Removal. J. Mater. Sci. Manuf. Res. 2022, 132, 8–10. [Google Scholar]
  21. Leal-Castañeda, E.J.; Meléndez-Estrada, J.; Toscano-Flores, L.G. Dodecanoyl chloride modified starch particles: A candidate for the removal of hydrocarbons and heavy metals in wastewater. Environ. Adv. 2023, 11, 100333. [Google Scholar]
  22. Chinh, N.T.; Manh, V.Q.; Trung, V.Q.; Lam, T.D.; Huynh, M.D.; Tung, N.Q.; Trinh, N.D.; Hoang, T. Characterization of collagen derived from tropical freshwater Carp fish scale wastes and its amino acid sequence. Nat. Prod. Commun. 2019, 14, 1934578–1986628. [Google Scholar] [CrossRef]
  23. Lopes, C.; Antelo, L.T.; Franco-Uria, A.; Alonso, A.A.; Perez-Martin, R. Valorisation of fish by-products against waste management treatments–Comparison of environmental impacts. Waste Manag. 2015, 46, 103–112. [Google Scholar] [CrossRef] [PubMed]
  24. Marrakchi, F.; Ahmed, M.J.; Khanday, W.A.; Asif, M.; Hameed, B.H. Mesoporous carbonaceous material from fish scales as low-cost adsorbent for reactive orange 16 adsorption. J. Taiwan Inst. Chem. Eng. 2017, 71, 47–54. [Google Scholar] [CrossRef]
  25. Hoyer, B.; Bernhardt, A.; Heinemann, S.; Stachel, I.; Meyer, M.; Gelinsky, M. Biomimetically mineralized salmon collagen scaffolds for application in bone tissue engineering. J. Biol. Macromol. 2012, 13, 1059–1066. [Google Scholar] [CrossRef]
  26. Selimin, M.A.; Latif, A.F.A.; Lee, C.W.; Muhamad, M.S.; Basri, H.; Lee, T.C. Adsorption efficiency of hydroxyapatite synthesised from black tilapia fish scales for chromium (VI) removal. Mater. Today 2022, 57, 1142–1146. [Google Scholar] [CrossRef]
  27. Qin, D.; Bi, S.; You, X.; Wang, M.; Cong, X.; Yuan, C.; Yu, M.; Cheng, X.; Chen, X.G. Development and application of fish scale wastes as versatile natural biomaterials. Chem. Eng. J. 2022, 428, 131102. [Google Scholar] [CrossRef]
  28. García Gómez, A.G.; Conde Quintero, M.; Castro Salazar, H.T. Extraction and characterization of chitin scales from red tilapia (oreochromis sp.) from Huila, Colombia by chemical methods. Rev. Ing. Univ. De Medellín 2019, 18, 71–81. [Google Scholar] [CrossRef]
  29. Chairi, H.; Laglaoui, A.; Arakrak, A.; Zantar, S.; Bakkali, M.; Hassani, M. Optimization and characterization of gelatin and chitosan extracted from fish and shrimp waste. E3S Web Conf. 2018, 37, 02006. [Google Scholar]
  30. Pobletea, R.; Cortesa, E.; Bakitb, J.; Luna-Galianoc, Y. Landfill leachate treatment using combined fish scales based activated carbon and solar advanced oxidation processes. Process Saf. Environ. Prot. 2019, 123, 253–262. [Google Scholar] [CrossRef]
  31. Ojwach, S.O.; Lalah, J.O.; Kowenje, C.O.; Achieng, G.O. Preparation, characterization of fish scales biochar and their applications in the removal of anionic indigo carmine dye from aqueous solutions. Water Sci. Technol. 2019, 80, 2218–2231. [Google Scholar]
  32. Ooi, J.; Lee, L.Y.; Hiew, B.Y.Z.; Thangalazhy-Gopakumar, S.; Lim, S.S.; Gan, S. Assessment of fish scales waste as a low cost and eco-friendly adsorbent for removal of an azo dye: Equilibrium, kinetic and thermodynamic studies. Bioresour. Technol. 2017, 245, 656–664. [Google Scholar] [CrossRef]
  33. Leal-Castañeda, E.J.; García-Tejeda, Y.; Hernández-Sánchez, H.; Alamilla-Beltrán, L.; Téllez-Medina, D.I.; Calderón-Domínguez, G.; Gutiérrez-López, G.F. Pickering emulsions stabilized with native and lauroylated amaranth starch. Food Hydrocoll. 2018, 80, 177–185. [Google Scholar] [CrossRef]
  34. Norma Oficial Mexicana NOM-127-SSA1-2021, Agua Para Uso y Consumo Humano. Límites Permisibles de la Calidad del Agua, Prefacio. Available online: https://www.fao.org/faolex/results/details/es/c/LEX-FAOC215630/ (accessed on 17 February 2025).
  35. Chojnacka, K.; Witek-Krowiak, A.; Moustakas, K.; Skrzypczak, D.; Mikula, K.; Loizidou, M. A transition from conventional irrigation to fertigation with reclaimed wastewater: Prospects and challenges. Renew. Sustain. Energy Rev. 2020, 130, 109959. [Google Scholar] [CrossRef]
  36. Teshale, F.; Karthikeyan, R.; Sahu, O. Synthesized bioadsorbent from fish scale for chromium (III) removal. Micron 2020, 130, 102817. [Google Scholar] [CrossRef] [PubMed]
  37. El Haouti, R.; Anfar, Z.; Chennah, A.; Amaterz, E.; Zbair, M.; El Alem, N.; Benlhachemi, A.; Ezahri, M. Synthesis of sustainable mesoporous treated fish waste as adsorbent for copper removal. Groundwater Sustain. Dev. 2019, 8, 1–9. [Google Scholar] [CrossRef]
  38. Anfar, Z.; El Haouti, R.; Lhanafi, S.; Benafqir, M.; Azougarh, Y.; El Alem, N. Treated digested residue during anaerobic co-digestion of Agri-food organic waste: Methylene blue adsorption, mechanism and CCD-RSM design. J. Environ. Chem. Eng. 2017, 5, 5857–5867. [Google Scholar] [CrossRef]
  39. Ribeiro, C.; Scheufele, F.B.; Espinoza-Quinones, F.R.; Módenes, A.N.; da Silva, M.G.C.; Vieira, M.G.A.; Borba, C.E. Characterization of Oreochromis niloticus fish scales and assessment of their potential on the adsorption of reactive blue 5G dye. Colloids Surf. A Physicochem. Eng. Asp. 2015, 482, 693–701. [Google Scholar] [CrossRef]
  40. Niero, G.; Corrêa, A.X.R.; Trierweiler, G.; Matos, A.J.F.; Corrêa, R.; Bazani, H.A.G.; Radetski, C.M. Using modified fish scale waste from Sardinella brasiliensis as a low-cost adsorbent to remove dyes from textile effluents. J. Environ. Sci. Health A Tox. 2019, 54, 1083–1090. [Google Scholar] [CrossRef] [PubMed]
  41. Kabir, S.F.; Cueto, R.; Balamurugan, S.; Romeo, L.D.; Kuttruff, J.T.; Marx, B.D.; Negulescu, I.I. Removal of acid dyes from textile wastewaters using fish scales by absorption process. Clean Technol. 2019, 1, 21. [Google Scholar] [CrossRef]
  42. Uzunoğlu, D.; Özer, A. Adsorption of Acid Blue 121 dye on fish (Dicentrarchus labrax) scales, the extracted from fish scales and commercial hydroxyapatite: Equilibrium, kinetic, thermodynamic, and characterization studies. Desalin. Water Treat. 2016, 57, 14109–14131. [Google Scholar] [CrossRef]
  43. Islam, M.A.; Hameed, B.H.; Ahmed, M.J.; Khanday, W.A.; Khan, M.A.; Marrakchi, F. Porous carbon–based material from fish scales for the adsorption of tetracycline antibiotics. Biomass Convers. Biorefin. 2023, 13, 13153–13162. [Google Scholar] [CrossRef]
  44. Ji, Q.; Li, H.; Zhang, J. Preparation and characterization of bio-based activated carbon from fish scales. J. Bioresour. 2021, 16, 614. [Google Scholar] [CrossRef]
  45. Fratzl, P.; Groschner, M.; Vogl, G.; Plenk, H., Jr.; Eschberger, J.; Fratzl-Zelman, N.; Koller, K.; Klaushofer, K. Mineral crystals in calcified tissues: A comparative study by SAXS. J. Bone Miner. Res. 1992, 7, 329–334. [Google Scholar] [CrossRef] [PubMed]
  46. Torres, F.G.; Troncoso, O.P.; Nakamatsu, J.; Grande, C.J.; Gómez, C.M. Characterization of the nanocomposite laminate structure occurring in fish scales from Arapaima Gigas. Mater. Sci. Eng. C 2008, 28, 1276–1283. [Google Scholar] [CrossRef]
  47. Ibrahim, F.; Osman, N.A.; Usman, J.; Kadri, N.A. 3rd Kuala Lumpur International Conference on Biomedical Engineering 2006: Biomed 2006, 11–14 December 2006, Kuala Lumpur, Malaysia; Springer Science & Business Media: Berlin, Geramny, 2007; Volume 15. [Google Scholar]
  48. Ikoma, T.; Kobayashi, H.; Tanaka, J.; Walsh, D.; Mann, S. Microstructure, mechanical, and biomimetic properties of fish scales from Pagrus major. Struct. Biol. 2003, 142, 327–333. [Google Scholar] [CrossRef] [PubMed]
  49. Thomas, V.; Dean, D.R.; Jose, M.V.; Mathew, B.; Chowdhury, S.; Vohra, Y.K. Nanostructured biocomposite scaffolds based on collagen coelectrospun with nanohydroxyapatite. J. Biol. Macromol. 2007, 8, 631–637. [Google Scholar] [CrossRef]
  50. Rahaman, M.S.; Basu, A.; Islam, M.R. The removal of As (III) and As (V) from aqueous solutions by waste materials. Bioresour. Technol. 2008, 99, 2815–2823. [Google Scholar] [CrossRef] [PubMed]
  51. Srivastava, V.; Sharma, Y.C.; Sillanpää, M. Response surface methodological ap- proach for the optimization of adsorption process in the removal of Cr (VI) ions by Cu2(OH)2CO3 nanoparticles. Appl. Surf. Sci. 2015, 326, 257–270. [Google Scholar] [CrossRef]
  52. Liang, X.; Fan, X.; Li, R.; Li, S.; Shen, S.; Hu, D. Efficient removal of Cr (VI) from water by quaternized chitin/branched polyethylenimine biosorbent with hierarchical pore structure. Bioresour. Technol. 2018, 250, 178–184. [Google Scholar] [CrossRef]
  53. Nazir, M.S.; Tahir, Z.; Akhtar, M.N.; Abdullah, M.A. Biosorbents and composite cation exchanger for the treatment of heavy metals. Appl. Ion Exch. Mater. Environ. 2019, 135–159. [Google Scholar] [CrossRef]
  54. Xu, Z.; Zhang, Q.; Li, X.; Huang, X. A critical review on chemical analysis of heavy metal complexes in water/wastewater and the mechanism of treatment methods. Chem. Eng. J. 2022, 429, 131688. [Google Scholar] [CrossRef]
  55. Saranya, N.; Ajmani, A.; Sivasubramanian, V.; Selvaraju, N. Hexavalent Chromium removal from simulated and real effluents using Artocarpus heterophyllus peel biosorbent-Batch and continuous studies. J. Mol. Liq. 2018, 265, 779–790. [Google Scholar] [CrossRef]
  56. Aman, A.; Ahmed, D.; Asad, N.; Masih, R.; Abd ur Rahman, H.M. Rose biomass as a potential biosorbent to remove chromium, mercury and zinc from contaminated waters. Int. J. Environ. Sci. 2018, 75, 774–787. [Google Scholar] [CrossRef]
  57. Anastopoulos, I.; Robalds, A.; Tran, H.N.; Mitrogiannis, D.; Giannakoudakis, D.A.; Hosseini-Bandegharaei, A.; Dotto, G.L. Removal of heavy metals by leaves-derived biosorbents. Environ. Chem. Lett. 2019, 17, 755–766. [Google Scholar] [CrossRef]
  58. Wu, Y.; Ming, Z.; Yang, S.; Fan, Y.; Fang, P.; Sha, H.; Cha, L. Adsorption of hexavalent chromium onto Bamboo Charcoal grafted by Cu2+-N-aminopropylsilane complexes: Optimization, kinetic, and isotherm studies. J. Ind. Eng. Chem. 2017, 46, 222–233. [Google Scholar] [CrossRef]
  59. Prabu, K.; Shankarlal, S.; Natarajan, E. A biosorption of heavy metal ions from aqueous solutions using fish scale (Catla catla). World J. Fish Mar. Sci. 2012, 4, 73–77. [Google Scholar]
  60. Gogoi, S.; Chakraborty, S.; Saikia, M.D. Surface modified pineapple crown leaf for adsorption of Cr (VI) and Cr (III) ions from aqueous solution. J. Environ. Chem. Eng. 2018, 6, 2492–2501. [Google Scholar] [CrossRef]
Figure 1. FTIR spectrum analysis of (a) NFSs and (b) MFSs.
Chemengineering 09 00023 g001
Figure 2. Scanning electron microscopy micrographs of (a) NFSs and (b) MFSs at 100×, scale bar 500 μm, and (c) NFSs and (d) MFSs at 2500×, scale bar 20 μm.
Chemengineering 09 00023 g002
Figure 3. XRD pattern of NFSs (black color) and MFSs (red color).
Chemengineering 09 00023 g003
Figure 4. TGA of modified fish scales.
Chemengineering 09 00023 g004
Figure 5. (a) N2 adsorption and desorption isotherm plot and (b) non-local density functional theory (NLDFT) pore size distribution of the modified fish scales.
Chemengineering 09 00023 g005
Figure 6. Removal efficiency of Pb(II) and Cd(II) with variations in pH, MFS dose, and contact time.
Chemengineering 09 00023 g006
Figure 7. Three-dimensional graph of the response surface of (a) Cd(II) (mg/L) vs. dose of scales and pH; (b) Cd(II) (mg/L) vs. dose of scales and time; (c) Cd(II) (mg/L) vs. pH and time; (d) Pb(II) (mg/L) vs. dose of scales and pH; (e) Pb(II) (mg/L) vs. dose of scales and time; and (f) Pb(II) (mg/L) vs. pH and time.
Chemengineering 09 00023 g007
Table 1. Variables designed for the adsorption process.
Independent VariablesRange and Level Variables
−αα
pH (X1)457
Adsorption dose (g) (X2)0.40.81
Contact time (min) (X3)6090120
Table 2. Factorial design used for the removal of lead(II) and cadmium(II) ions by the adsorption process.
No.X1: pHX2: Dose (g)X3: Contact Time (min)Y1:Pb(II) Response Efficiency (%)Y2:Cd(II) Response Efficiency (%)
150.46077.6 ± 0.661.2 ± 0.6
240.86067.6 ± 0.566.2 ± 0.7
370.86045.6 ± 0.777.2 ± 0.4
4516082.8 ± 1.158.6 ± 0.4
540.49079.0 ± 0.760.5 ± 0.4
650.89077.4 ± 0.861.3 ± 0.5
750.89076.9 ± 0.961.6 ± 0.5
8719064.7 ± 0.567.6 ± 0.3
9419068.2 ± 0.765.9 ± 0.6
1050.412075.8 ± 0.962.1 ± 0.7
1140.812070.5 ± 0.764.7 ± 0.4
1270.812044.4 ± 0.377.8 ± 0.7
135112059.2 ± 0.870.4 ± 0.4
The mixtures were made in duplicate. The removal percentages are average ± standard deviation.
Table 3. Elemental analysis of fish scales.
ElementsNFSsMFSsMFSATs
C1s66.2 ± 8.050.7 ± 7.253.3 ± 7.9
O1s20.5 ± 2.527.3 ± 3.124.6 ± 2.9
N1s8.2 ± 1.614.2 ± 1.915.9 ± 2.0
Ca2p1.7 ± 0.41.5 ± 0.20.9 ± 0.2
P2p1.7 ± 0.40.9 ± 0.1---
Si2p1.1 ± 0.20.4 ± 0.00.4 ± 0.0
S2p0.5 ± 0.01.2 ± 0.3---
Na1s0.2 ± 0.03.8 ± 0.91.8 ± 0.3
P2s------1.1 ± 0.2
S2s------0.7 ± 0.1
Pb4f------1.1 ± 0.1
Cd3d------0.2 ± 0.0
Table 4. Cd(II) and Pb(II) removal efficiency in municipal wastewater.
Time (min)Concentration mg/LRemoval %
Pb(II)
176.95 ± 2.361.52 ± 1.3
551.20 ± 1.574.40 ± 0.7
1545.74 ± 0.977.13 ± 1.2
2534.95 ± 0.680.47 ± 2.8
6031.82 ± 1.084.09 ± 2.0
Cd(II)
129.92 ± 0.589.85 ± 1.5
530.21 ± 0.289.65 ± 1.0
1530.02 ± 0.289.81 ± 1.6
2529.89 ± 0.489.68 ± 0.8
6030.11 ± 0.789.69 ± 0.7
The removal percentages are average ± standard deviation.
Table 5. Analysis of variance (ANOVA) for quadratic response surface model.
SourceDegrees of FreedomSum of SquaresMean Square F Valuep ValueProb > F
Pb(II)
Model913,066.21451.8012.960.000Significant
Linear34979.91659.9614.810.000Significant
X113668.43668.4232.740.000Significant
X21749.7749.666.690.018Significant
X31561.8561.815.010.037Significant
Square37046.92348.9720.960.000Significant
X1214125.54125.5136.820.000Significant
X221742.9742.936.630.018Significant
X3212092.62092.5618.680.000Significant
Interaction of 2 factors31039.4346.473.090.050Significant
X1X2160.660.610.540.471Not significant
X1X3134.434.400.310.586Not significant
X2X31944.4944.398.430.009Significant
Error202240.9112.05
Lack of fit32029.3676.4454.340.000Significant
Pure error17211.612.45
Total2915,307.2
Cd(II)
Model91053.91117.1016.220.000Significant
Linear3765.39255.12913.540.000Significant
X112.452.4490.130.722Not significant
X21732.11732.10838.870.000Significant
X3130.8330.8301.640.215Not significant
Square3267.0289.0074.730.012Significant
X121154.13154.1298.180.010Significant
X221114.62114.6246.090.023Significant
X32133.4233.4181.770.198Not significant
Interaction of 2 factors321.507.1680.380.768Not significant
X1X210.270.2740.010.905Not significant
X1X3110.6310.6260.560.461Not significant
X2X3110.6010.6030.560.462Not significant
Error20376.7218.836
Lack of fit373.3424.4481.370.286Not significant
Pure error17303.3717.846
Total291430.63
Table 6. Regression coefficient and its corresponding high and low 95% CIs.
TermsCoefficient
Estimate
Standard Error95% CI
(Low, High)
T Valuep ValueFIV
Pb(II)
Constant45.444.32(36.43, 54.46)10.520.000
X115.142.65(9.62, 20.66)5.720.0001.00
X26.842.65(1.32, 12.37)2.590.0181.00
X35.932.65(0.41, 11.45)2.240.0371.00
X1223.643.90(15.51, 31.76)6.070.0001.01
X22−10.033.90(−18.16, −1.90)−2.570.0181.01
X3216.833.90(8.71, 24.96)4.320.0001.01
X1X2−2.753.74(−10.56, 5.05)−0.740.4711.00
X1X32.073.74(−5.73, 9.88)0.550.5861.00
X2X310.873.74(3.06, 18.67)2.900.0091.00
Cd(II)
Constant14.421.77(10.72, 18.11)8.140.000
X10.391.09(−1.87, 2.65)0.360.7221.00
X2−6.761.09(−9.03, −4.50)−6.230.0001.00
X3−1.391.09(−3.65, 0.88)−1.280.2151.00
X124.571.60(1.24, 7.90)2.860.0101.01
X223.941.60(0.61, 7.27)2.470.0231.01
X322.131.60(−1.20, 5.46)1.330.1981.01
X1X2−0.181.53(−3.39, 3.02)−0.120.9051.00
X1X3−1.151.53(−4.35, 2.05)−0.750.4611.00
X2X3−1.151.53(−4.35, 2.05)−0.750.4621.00
Disclaimer/Publisher’s Note: The statements, opinions and data contained in all publications are solely those of the individual author(s) and contributor(s) and not of MDPI and/or the editor(s). MDPI and/or the editor(s) disclaim responsibility for any injury to people or property resulting from any ideas, methods, instructions or products referred to in the content.

