Abstract
The management of coffee and peapod waste presents significant environmental challenges, with millions of tons generated annually, leading to disposal issues and resource inefficiencies. Hydrothermal processes offer a promising valorization method, though biomass characteristics significantly influence the resulting products. Biomass characterization revealed distinct profiles for coffee cherry waste (moisture: 10.94%, ashes: 7.79%, volatile matter: 79.91%, fixed carbon: 1.36%, cellulose: 27.6%, hemicellulose: 12.5%, and lignin: 13.7%) and peapods (moisture: 7.77%, ashes: 4.22%, volatile matter: 74.18%, fixed carbon: 13.0%, cellulose: 20.2%, hemicellulose: 17.4%, and lignin: 5.0%). Experiments were conducted in 100 mL and 500 mL hydrothermal reactors with varying conditions for temperature (120–260 °C), time (1–4 h), stirring (none and at 5000 and 8000 rpm), biomass/water ratio (1:5, 1:10, 1:20, and 1:40), particle size (0.5–5 mm), and catalysts (acids and bases). The results showed that peapods produced over 30 times more platform chemicals than coffee. High temperatures (over 180 °C) degraded peapods, whereas coffee yields increased. Both biomasses were influenced similarly by reaction conditions: lower biomass/water ratios, smaller particle sizes, acid catalysts, and no stirring increased yields. Peapods consistently had higher yields than coffee in all conditions. Biochar analysis revealed anthracite from coffee and coal from peapods.
1. Introduction
By effectively managing waste materials, waste management plays a critical role in preserving human health and environmental sustainability. Waste management encompasses various tasks, such as collection, transportation, handling, and disposal of waste, to mitigate pollution and promote resource conservation. In the realm of bioenergy and biomaterial production, biomass stands out as a plentiful, carbon-neutral renewable resource with the potential to meet diverse societal needs [1]. The concept of biorefinery, an innovative industrial approach, is evolving to convert renewable biomass into valuable fuels and products, driven by advancements in genetics, biotechnology, process chemistry, and engineering [2].
The importance of efficient waste management in reducing pollution, safeguarding natural resources, and fostering sustainable development underscores its significance. With the escalating global energy demands and mounting concerns over the economic and environmental impacts of fossil fuel usage, lignocellulosic biomass is gaining traction as a promising source of energy and chemicals [3].
Lignocellulosic biomass refers to plant-derived materials rich in cellulose, hemicellulose, and lignin, making it a valuable resource for bioenergy and biochemical production. It is sustainable, renewable, and cost-effective, offering a low-carbon footprint alternative to fossil fuels. Valorization of lignocellulosic biomass involves converting it into high-value bioproducts through various physical, chemical, and biological processes [4]. Techniques like pretreatment, hydrolysis, and fermentation are crucial for breaking down the complex structure of biomass into sugars and other compounds that can be further processed into biofuels and chemicals [5]. The process requires efficient utilization of cellulose, hemicellulose, and lignin components, overcoming the challenges posed by the heterogeneous and recalcitrant nature of lignocellulosic biomass [6].
Lignocellulosic biomass encompasses various types, including virgin biomass, waste biomass, and energy crops. Virgin biomass consists of plants grown specifically for biomass production, while waste biomass comprises byproducts from sectors like agriculture and forestry. Energy crops, such as switchgrass and elephant grass, are cultivated for their high yields of lignocellulosic biomass. Each type of lignocellulosic biomass offers unique characteristics and potential applications [7].
Waste biomass, a significant component of lignocellulosic biomass, offers a plethora of opportunities for valorization into valuable products. Various articles and processes focus on harnessing the potential of waste biomass for sustainable and efficient utilization. For instance, the article “Valorization of Boehmeria nivea stalk towards multipurpose fractionation: furfural, pulp, and phenolic monomers” by Zhen Zhang and colleagues explores the valorization of Boehmeria nivea stalk, a type of waste biomass, into furfural, pulp, and phenolic monomers. This study highlights the potential of waste biomass for producing multiple valuable fractions, contributing to the circular bioeconomy [5]. Additionally, the process of extracting and characterizing lignin from waste invasive weeds using a dioxane-based method, as discussed in the article by Arup Jyoti Borah and colleagues, showcases a sustainable approach to utilizing waste biomass for the production of lignin, a valuable chemical component. This research demonstrates the feasibility of extracting valuable resources from waste biomass, promoting resource efficiency and circular economy principles [8]. Furthermore, the catalytic conversion network for lignocellulosic biomass valorization, as outlined in the article “Catalytic conversion network for lignocellulosic biomass valorization: A panoramic view,” provides insights into the catalytic reaction routes and key steps involved in the selective preparation of various important products from waste biomass [9]. These studies collectively underscore the importance of waste biomass valorization and highlight innovative approaches to extracting valuable compounds from this abundant and underutilized resource.
Several studies have explored the valorization of coffee biomass, particularly spent coffee grounds (SCG), into valuable products. Burniol-Figols et al. (2016) integrated the recovery of chlorogenic acid and bioethanol production from spent coffee grounds, demonstrating the potential for extracting high-value compounds and producing biofuels from this waste biomass [10]. Tzani et al. (2023) developed and optimized a green extraction process for spent coffee grounds using natural deep eutectic solvents, showcasing an efficient and sustainable method for extracting valuable compounds from SCG [11]. Gu et al. (2023) conducted a comparative study of biofuel production based on spent coffee grounds transesterification and pyrolysis, assessing the process simulation, techno-economic, and life cycle aspects, highlighting the feasibility of producing biofuels from SCG through different conversion routes [12]. Colantoni et al. (2021) extensively characterized spent coffee grounds for energy purposes, identifying SCG as an excellent raw material for biomass with a high calorific value and a low ash content, producing 98% coffee pellets suitable for thermal conversion systems and assessing the emissions during combustion [13]. These studies collectively demonstrate the versatility of coffee biomass valorization, with potential applications in biofuel production, extraction of high-value compounds, energy generation through pelletization and combustion, and water treatment through biochar production, contributing to a circular economy by converting waste into valuable products, reducing environmental impacts, and promoting sustainable practices in the coffee industry.
Despite the growing interest in valorizing agricultural waste, peapods remain an underexplored resource, with a limited number of studies dedicated to unlocking their full potential, most of them being focused only on the obtention of biochar [14,15,16]. In contrast, coffee waste has received more attention, but the focus has primarily been on spent coffee grounds (SCG), leaving the waste generated from the coffee cherry itself largely unevaluated [17,18]. The coffee cherry, which accounts for a significant portion of the coffee plant’s biomass, is often discarded during processing, presenting a substantial opportunity for valorization [19]. However, research has yet to fully explore the potential of this waste stream, having neglected the possibility of extracting valuable compounds and bioactive molecules or even using it as a feedstock for bioenergy production. This oversight highlights the need for a more comprehensive approach to coffee waste valorization, one that considers the entire value chain and seeks to maximize the utilization of all available biomass. By expanding our focus beyond SCG, we can uncover new opportunities for sustainable resource recovery and contribute to a more circular economy in the coffee industry. This leads to the goal of the present manuscript, which is to compare and valorize the biomass waste of peapods and coffee cherries in order to evaluate how the structural components of lignocellulosic biomass can influence its prospects regarding valorization.
The aim of this article is to explore and optimize the hydrothermal valorization of coffee and peapod waste by characterizing their distinct biomass properties and understanding and comparing how these characteristics influence the yield and quality of platform chemicals and hydrochar. This research is innovative, as it tackles the significant issue of waste management for coffee and peapod wastes, which are often underutilized and contribute to environmental pollution. By employing hydrothermal processes, the study highlights the potential of transforming these wastes into valuable products, revealing critical insights into the optimal conditions for each type of biomass. This approach not only enhances resource recovery efficiency but also promotes a sustainable circular economy. The findings have the potential to improve industrial waste valorization practices, reduce environmental impacts, and provide economic benefits through the production of high-value chemicals and hydrochar.
2. Materials and Methods
2.1. Biomass Characterization
In the case of the coffee cherry waste used in this study, the biomass (5 kg) was obtained directly form a farm in Santandercito, Cundinamarca, and for the peapods, it was recovered from a local farmer’s market (10 kg). To determine the characteristics of the initial biomasses, a characterization was performed. For the proximate assay, the following methods and technical reports were employed: moisture (NREL/TP-510-42621) [20], ash (NREL/TP-510-42622) [21], volatile matter (ASTM E872-82) [22], and fixed carbon (ASTM D5373-21) [23].
The chemical composition was tested using the “Methods for Dietary Fiber, Neutral Detergent Fiber, and Nonstarch Polysaccharides in Relation to Animal Nutrition” approach published in the Journal of Dairy Science [24]. After the characterization of their natural properties, both of the biomasses were dried to constant humidity for the hydrothermal processes and meshed into different sizes using ASTM calibrated sieves of 4, 10, 18, and 35 mesh for the obtention of samples with particle sizes of 0.5, 1, 2, and 5 mm, which would later be used for different assays.
2.2. Hydrothermal Experiments
In order to evaluate the range of reactions and how different temperatures affect the yield of hydrolysis and the effectiveness of the reactions that take place after the obtention of sugars, hydrothermal reactions of 1 h were performed at temperatures ranging from 120–180 °C (LHW) to 180–260 °C (HTC), with a constant biomass/water ratio (B/W) of 1:9 for each biomass. Liquid hot-water (LHW) experiments were performed in 100 mL batch reactors (Figure 1a) with 27 g water/3 g biomass, and hydrothermal carbonization (HTC) experiments were performed in 500 mL batch reactors (Figure 1b) with 90 g water/10 g biomass.
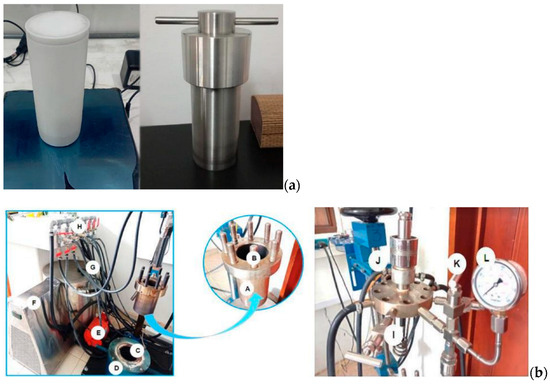
Figure 1.
Reactor used for the hydrothermal valorization processes. (a) Batch reactor of 100 mL (b) Batch reactor of 500 mL.
A 100 mL batch reaction (Figure 1a) was used to analyze the effect of time; the temperature (180 °C) and B/W ratio (1:9) were set, and the reaction was left for 4 h, with samples taken each hour.
Tests were conducted using various ratios of biomass to water (1:5, 1:10, 1:20, and 1:40) in the 500 mL batch reactor. The mixtures were placed into the reactor at three different temperatures: 180 °C, 220 °C, and 260 °C, under autogenous pressure for one hour. In these experiments, a particle size of 2 mm was employed for the coffee waste and a size of 1 mm was employed for the peapod waste.
Later, four different particle sizes—0.5 mm, 1 mm, 2 mm, and 5 mm—were employed in a series of studies to further investigate the impacts of biomass particle size on hydrothermal carbonization. The same temperatures were used in these studies, and an autogenous pressure system was in place for one hour in the 500 mL batch reactor, commencing when the temperature reached the desired point. A biomass-to-water ratio of 5 g/95 g of water, or 1:20, was utilized.
Stirring was the final variable to be assessed. The same temperatures (180 °C, 220 °C, and 260 °C) were used in a series of trials, with stirring at 5000 and 8000 revolutions per minute under autogenous pressure for one hour (measured after attaining the required temperature) in the 500 mL batch reactor. A 1 mm particle size was used for the peapod waste, and a 0.5 mm particle size was used for the coffee waste. A 1:20 biomass-to-water ratio (5 g biomass/95 g of water) was employed in the trials.
2.3. Characterization of Fractions
Vacuum filtration was employed to separate the liquid and solid fractions, and mass balance was maintained through measurement. pH and conductivity were measured in order to monitor the reactions that occurred. Moreover, the platform chemicals (PCs) were quantified by HPLC-RI. The yields were calculated using Equation (1).
The yields of platform chemicals were calculated based on the initial reagents: lignin, hemicellulose, and cellulose. To determine the percentage of these components in the initial biomass, the biomass was characterized (see Section 2.1). After the reaction was carried out, the produced platform chemicals were quantified (see Section 2.4), and the concentration obtained via HPLC-IR was used to calculate the weight of the PCs. This weight was then divided by the initial lignocellulosic components’ weight to determine how much of them reacted to produce the platform chemicals. This value was then taken as the yield of the hydrothermal reaction.
2.4. Fraction Quantification and Characterization
The methodology used in previous articles [25,26,27] was utilized for the platform chemical quantification in the liquid phase. The Hitachi Elite LaChrom (Tokyo, Japan) utilized in the method’s implementation included a Hitachi L-2490 refraction index detector set at 40 °C, a SHODEX Sugar SH1821 column set at 60 °C, 0.005 M H2SO4 for the mobile phase, and a 0.5 mL/min flow rate. (More information is given in the Supplementary Materials, Figure S1 and Table S1.)
The solid fractions were analyzed via elemental analysis with a Thermo Flash 2000 following the NREL/TP-510-42620.
2.5. Homogeneous Catalysts
Firstly, to evaluate the effects of strong acids and bases, experiments were performed for 3 h, with samples taken at each hour using 4 different catalysts that replaced the water in the B/W ratio of 1:10 at 180 °C with the reactor of 100 mL. The catalysts used were as follows: H2SO4 (0.02 M), CH3COOH (0.2 M), NaHCO3 (0.2 M), and KOH (0.02 M), prepared with deionized water.
Then, to evaluate the effects of the catalysts at different temperatures, the water in the biomass/water 1:20 ratio (5 g biomass/95 g catalyst solution) was substituted with solutions of CH3COOH [0.1 M] and NaHCO3 [0.1 M] in the 500 mL reactor. Particle sizes of 1 mm for peapod waste and 0.5 mm for coffee waste were utilized in reactions carried out for one hour at 180, 220, and 260 °C.
2.6. Experimental Design
The experiments are presented in Table 1. All the experiments were performed for each biomass; hence, a total of 110 experiments were carried out (55 for peapod waste and 55 for coffee cherry waste), and they were repeated 3 times to ensure repeatability and exactitude in the results that are reported later in graphs and tables. Microsoft excel was used to calculate the averages, deviations, medians, and modes for the results obtained. The response variable that allowed for optimization was the yield of platform chemicals obtained with each experiment, calculated through the results of the HPLC quantification of the liquid phase. The factors chosen for the optimization were reactor size, time, temperature, B/W ratio, particle size, catalyst usage, and stirring. The factors chosen for optimizing hydrothermal valorization—reactor size, time, temperature, biomass/water ratio, particle size, catalyst usage, and stirring—were selected because they fundamentally influence the efficiency and effectiveness of the process. Reactor size affects the scale and heat distribution, while time and temperature control the reaction kinetics and product formation. The biomass/water ratio impacts the concentration and reactivity of the feedstock, and particle size affects surface area and reaction efficiency. Catalyst usage can enhance reaction rates and product selectivity, and stirring ensures uniform mixing, preventing localized variations in reaction conditions. Optimizing these factors is essential for maximizing yield, improving product quality, and achieving overall process efficiency.

Table 1.
Set of experiments performed for the optimization of conditions.
Experiments 1–7 were performed to optimize the conditions in the LHW range and observe if enough energy was provided for an efficient transformation of biomass into platform chemicals. Afterwards, experiments 7–10 were performed, keeping all the variables constant, expect for time, to observe how the effect of time can influence the transformation of biomass. Experiments 11–14 had 4 levels for the evaluation of HTC influence in the hydrothermal process and biochar production. After experimenting with a range of temperatures, those of 180, 220 and 260 °C were selected for further study and to minimize the set of experiments. At these three temperatures, experiments to optimize the B/W ratio (15–26), particle size (27–35), stirring (36–41), and catalyst usage (36–55) were performed, each one with at least 3 levels for analysis.
3. Results and Discussion
The data provided in Table 2 show the chemical compositions of the coffee cherries and peapods used in this study (Figure 2), highlighting their potential uses and differences in composition.

Table 2.
Characterization of initial biomasses for comparison.
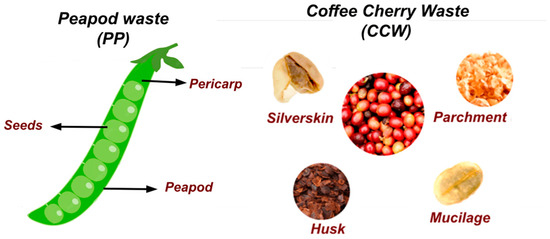
Figure 2.
Parts of the waste used for the hydrothermal valorization.
Moisture content is an important parameter that can impact the storage, processing, and quality of materials. The initial biomass of coffee cherries has a similar moisture content (80.79%) to that of peapods (80.77%). This suggests that both biomasses may require similar drying or dehydration before further processing. The lower moisture content in the BHP (biomass for hydrothermal processes) samples for both materials (10.94% for coffee cherries and 7.77% for peapods) indicates that the drying process can effectively reduce the moisture levels.
The ash contents represent the inorganic mineral matter present in the materials. Coffee cherries have a higher ash content (7.79%) compared to peapods (4.22%). This suggests that coffee cherries may have a higher concentration of minerals, which can be relevant for certain applications, such as in the production of biofuels or in their use as a source of nutrients. In some other cases, where the inorganic matter cannot be valorized, it can harm the reactor.
The volatile matter and fixed carbon contents provide insights into the thermal behavior of the materials. Coffee cherries have a higher volatile matter content (79.91%) compared to peapods (74.18%), indicating that coffee cherries may be more reactive during thermal processing, such as in combustion or pyrolysis applications. However, peapods have a significantly higher fixed carbon content (13.0%) compared to coffee cherries (1.36%), suggesting that peapods may have a higher energy density and be more suitable for certain energy-related applications.
The composition of cellulose, hemicellulose, and lignin can influence the suitability of the materials for various applications, such as the production of biofuels, bioplastics, or other value-added products. Coffee cherries have higher cellulose (27.6%) and lignin (13.7%) contents compared to peapods (20.2% cellulose and 5.0% lignin). However, peapods have a higher hemicellulose content (17.4%) compared to coffee cherries (12.5%). These differences in structural component composition can impact the potential applications of each material. It is worth highlighting that lignin can act as a barrier to hydrothermal processes, decreasing production yields.
The elemental compositions, including carbon, hydrogen, oxygen, nitrogen, and sulfur, can provide insights into the chemical properties and potential uses of the materials. Coffee cherries have a higher carbon content (45.27%) compared to peapods (43.30%), which may indicate a higher energy density. Peapods have a higher hydrogen content (5.95%) compared to coffee cherries (4.86%), which can influence their chemical reactivity and potential for certain applications. Both materials have similar oxygen contents (48.26% for coffee cherries and 49.02% for peapods), while coffee cherries have higher nitrogen (1.471%) and sulfur (0.138%) contents compared to peapods (1.71% nitrogen and no sulfur detected).
3.1. Liquid Hot-Water Valorization (LHW)
In order to observe the tendency of production of platform chemicals along the liquid hot-water temperature range, Figure 3 was obtained. It can be seen that there was a high total production yield for peapod waste (PPW), starting at a 36.902% total yield at the lowest temperature. On the other hand, coffee cherry waste (CCW) had very little total production (0.167%) at 120 °C. This shows that a lower energy is needed for the extraction and hydrolysis of PPW to take place, demonstrating how a higher initial lignin content can allow the acidic water to break through the lignocellulosic structure and achieve hydrolysis into sugars. The overall tendencies of both biomasses were very similar (although with a much higher yield for PPW): there was an initial extraction from 120 to 140 °C, where there was not much difference in the total yield; afterward, there was a marked increase at 150 °C, followed by an almost linear increase up until 180 °C. This shows that for both biomasses, processes over 150 °C have enough energy to favor hydrolysis into sugars and other subproducts. The initial structure and components of PPW waste allow for a higher valorization potential without the need for catalysts or extreme conditions, in contrast to CCW, whose structure is more peel-like and whose components are harder to valorize.
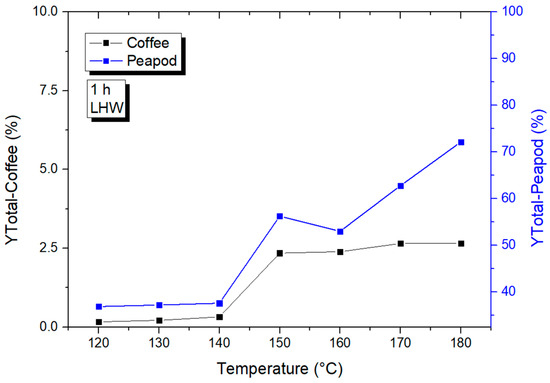
Figure 3.
Production of total platform chemicals via LHW for coffee and peapod wastes.
In Table 3, sugars are produced in the highest quantities, these being the easiest to obtain due to their not needing too much energy to be transformed. On the other hand, due to the physicochemical characteristics and the high production of sugars at low temperatures (170 °C), enough energy is provided to the system to obtain levulinic acid from peapod waste in low quantities. This cannot be achieved with CCW due to its low hydrolysis yield, the presence of lignin, and the high content of ashes, which intervene in the transformation of the biomass into value-added products.

Table 3.
Individual platform chemicals produced from PPW and CCW.
These results allow us to say that peapods are better for valorization into sugars, as low-energetic processes can be used without extra parameters like catalysts, as they already provide a high yield of transformation. On the other hand, using the same range of parameters, LHW valorization processes for CCW are not as successful and produce very little transformation, needing optimization of other parameters and higher energy in order to transform the waste into chemicals.
3.2. Influence of Time
After analyzing the influence of temperatures from 120 to 180 °C, an analysis of the reaction times was performed (Figure 4). Longer reaction times mean more energy being provided to the system and, perhaps, an increase in hydrolysis for those biomasses (like CCW) for which one hour is not enough.
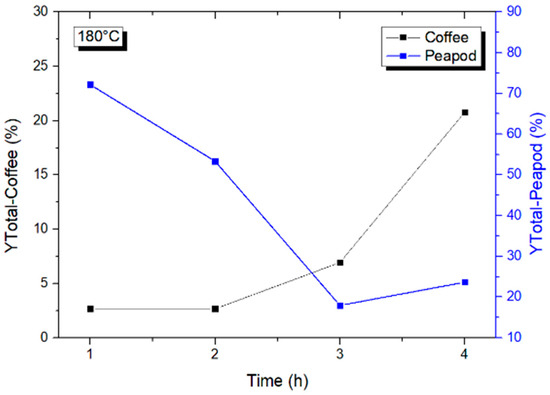
Figure 4.
Total yields of platform chemicals from CCW and PPW at 180 °C from 1 to 4 h.
It can be seen that PPW and CCW have opposite tendencies when it comes to reaction times. PPW has a very high initial yield that starts to drop as the time increases, reaching a minimum at hour 3, after which the yield decreases. This is due to the fact that the energy provided to the system after 4 h is so strong that it allows for a higher percentage of degradation to take place, increasing the yield of formic acid (Table 4) and hence decreasing the overall yield. On the other hand, CCW has a very small yield during the first two hours, after which the yield increases, the best yield of 20.785% being reached at 4 h. This shows that, depending on the biomass selected for hydrothermal valorization, longer times can lead to an increase in the production of platform chemicals, yet they can also lead to degradation and a drop in the amount of transformation. CCW needs a higher energetic process, whilst PPW can be valorized at lower temperatures and in shorter times.

Table 4.
Individual platform chemicals obtained from LHW at 180 °C for 1 to 4 h.
Table 3 shows the production of individual platform chemicals and how it is influenced by time at a set temperature. The most remarkable results can be seen for the PPW samples, where the sugar yields decreased but the production of the other platform chemicals increased, showing that a transformation took place and that even though at 1 h only sugars and levulinic acid were produced, over longer times, formic acid and HMF can be produced by reactions of the sugars previously obtained. It can also be seen that in the most extreme conditions (4 h), the highest yield of production was achieved for formic acid, this being the product of degradation. Opposite to what was previously described, the hydrolysis of lignocellulosic structures into sugars was not completed by CCW; due to this, their production continued to increase up to hour 4. Levulinic and formic acid were only produced after 3 h of reaction, and, finally, HMF and furfural appeared after 4 h. This shows, again, that coffee needs more energy from the medium to transform its initial structure into platform products and that, even at higher energies, the total yields are still lower than those for PPW.
3.3. Hydrothermal Carbonization (HTC)
HTC is a process in which the obtained products are not only aqueous but also include biochar. The energy used in HTC is higher than in LHW, which leads to lower yields of platform chemicals and the degradation of sugars and levulinic acid to compounds such as formic acid. Figure 5 shows the total yields for temperatures from 200 to 260 °C (HTC). The last temperature of LHW (180 °C) produced total yields of 2.655% (CCW) and 72.170% (PPW), and there was an important drop in the yield for peapods, which was 21.043% at 200 °C, and an increase in the yield for CCW, which reached a valorization of 21.593%. This was due to the high lignin content present in coffee, which needs higher energy to be broken down in order to hydrolyze cellulose and hemicellulose. When PPW is subjected to HTC conditions, the heat not only hydrolyzes but also degrades the sugars, levulinic acid, and furfural, leading to an increase in the production of formic acid and volatile small compounds. Hence, in valorization processes involving high temperatures, coffee biomass presents higher interest than peapods.
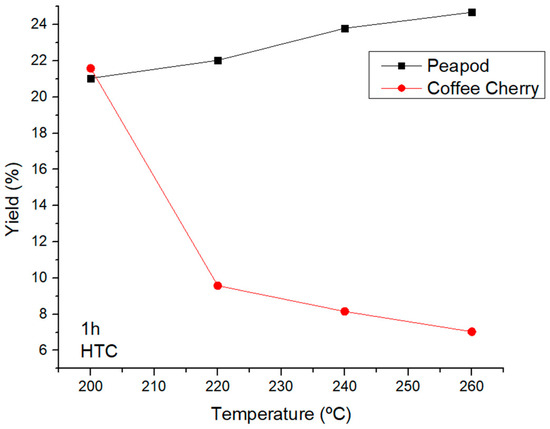
Figure 5.
Total yields of CCW and PPW in experiments lasting one hour in the HTC temperature range.
When increasing the temperature over 220 °C, the behavior of the biomasses differed once again: the peapod waste yield increased slightly after the initial drop at 200 °C, but in the case of the CCW, the highest amount of valorization was achieved at 200 °C, after which the yield dropped consistently as the temperature became higher.
Table 5 shows the individual products obtained at the different temperatures in the HTC range. It can be seen that by increasing the amount of energy provided via temperature, the number of sugars in both coffee and peapods decreases. This is due to the hydrolysis mechanism, whereby at higher temperatures the water becomes more acidic and releases protons into the system, breaking down the lignocellulosic structures and hydrolyzing sugars as well. The reaction did not stop in the production of sugars, as was the case in LHW. Levulinic acid as well as furfural and HMF are very unstable molecules which can undergo degradation when too much energy is provided, which can lead to their transformation into formic acid, CO, and CO2. This can be seen in the case of the peapod waste, where the levulinic acid yield decreased as the total formic acid content increased as the temperature became higher.

Table 5.
Individual platform chemicals obtained at HTC temperatures over 1 h.
HTC processes at low temperatures help with the valorization of coffee, but the overall yield decreases when the energy is increased too much. As for PPW, the amount of platform chemicals obtained through HTC is lower than that obtained through LHW, and if platform chemicals are desired, this range of temperatures may not be the best. On the other hand, in this range of temperatures, biochar is also obtained, so if this is the desired product, then HTC conditions should be used.
4. Biomass/Water Ratio Influence
The experiments were performed with four different mass ratios: 1:05, 1:10, 1:20, and 1:40, at 180 °C, 220 °C, and 260 °C, to compare the yields between the peapod and coffee biomass wastes.
Figure 6 shows the results at 180 °C. The test with the coffee waste showed a clear trend: As the biomass/water ratio decreased, the yields increased. On the other hand, with the peapod biomass, the highest yield was obtained with the 1:20 ratio (44.346%). At the 1:5 ratio, the yields were the lowest in both cases, though they increased at 1:10 and again at 1:20. However, at 1:40, when there was too little biomass compared to water and a small amount of lignin was present (for the PPW), the biomass underwent degradation. Coffee, on the other hand, showed an improvement due to the need for higher energy to break down the lignin barriers and hydrolyze the lignocellulosic structures into platform chemicals.
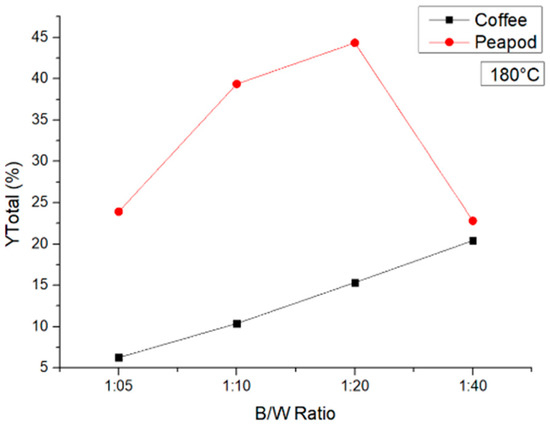
Figure 6.
Total yields of CCW and PPW in experiments at 180 °C lasting one hour, in which the B/W ratio was modified.
At 220 °C, it can be observed that the same trend was obtained with the peapod and coffee biomasses. As the biomass/water ratio decreased, the yields increased, and at the ratios of 1:20 and 1:40, no significant changes were observed. In Figure 7, it is notable that, using peapod biomass, the yields of platform chemicals were higher than when using coffee biomass and that at a higher temperature the differences between the yields using the 1:20 and 1:40 ratios were not meaningful. It was shown that at 220 °C and a ratio of 1:20, contact between the water and the biomass was favored. However, at a ratio of 1:40, the better contact was not enough to elevate the yield because the amount of biomass was not sufficient for the hydrothermal reaction to increase.
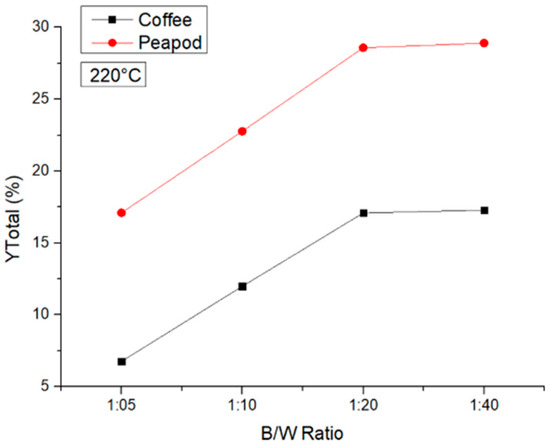
Figure 7.
Total yields of CCW and PPW in experiments at 220 °C lasting one hour, in which the B/W ratio was modified.
Finally, Figure 8 shows the results for the experiment at 260 °C. At this temperature, the obtention of biochar (solid) and formic acid (in the liquid) was favored. That is why the analysis of the total yield of the production of platform chemicals showed practically the production of formic acid alone. In the coffee waste experiments, a peak was observed when a 1:10 biomass/water ratio was used; even so, the yields for ratios of 1:05, 1:20, and 1:40 did not change importantly. In the peapod waste experiments, the same trend was observed as at 220 °C; the total yields increased as the biomass/water ratio decreased, but at a ratio of 1:40, the yield was lower than that achieved with a 1:20 ratio.
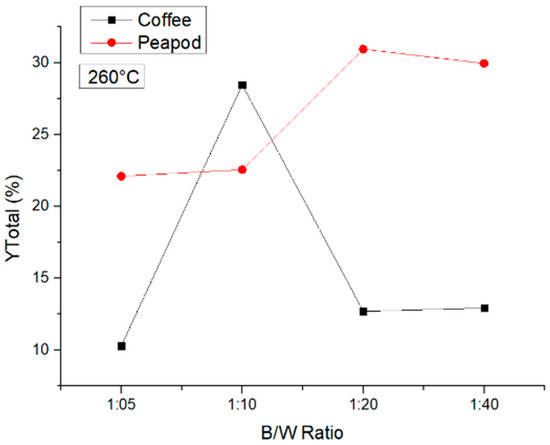
Figure 8.
Total yields of CCW and PPW in experiments at 260 °C lasting one hour, in which the B/W ratio was modified.
In conclusion, at a biomass/water ratio of 1:20, higher yields were obtained using PPW biomass. With CCW biomass, the best yield was obtained at a ratio of 1:40. If the purpose is to obtain formic acid, a ratio of 1:10 at 260 °C can be used. Additionally, it could be concluded that at a 1:20 ratio the contact between the water and the biomass particles was favored, obtaining better results, but with a ratio of 1:40 the quantity of biomass limited the yields of the reaction.
5. Particle Size Influence
Particle size can influence the amount of biomass that is in contact with the water that is being used to hydrolyze the lignocellulosic structures. It has been reported that smaller particles have a larger surface area-to-volume ratio, which enhances their reactivity and interaction with the hydrothermal solution. This can lead to better crystallinity, higher yields, and improved product properties [28]. Smaller particles facilitate mass transfer between the particles and the surrounding solution, allowing for more efficient heat and mass transfer. This can improve the overall efficiency and product quality of hydrothermal processes [29].
Figure 9 shows that at 180 °C there is a similar tendency in both CCW and PPW, but a higher number of products can always be obtained from peapod biomass due to its physicochemical properties previously described. For CCW, the particle size that improved the reaction was 0.5 mm, whilst for peapod waste, both the 0.5 mm and 1 mm samples had similar yields, proving that smaller particle sizes do have an influence on the reaction and hydrolysis of the water, although particle size can definitely be optimized according to the nature of the specific biomass.
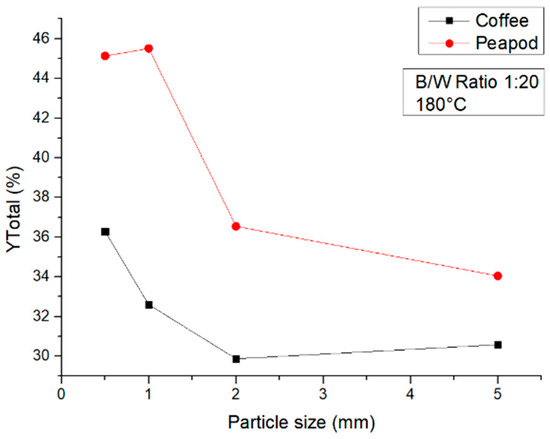
Figure 9.
Total yields of CCW and PPW in experiments at 180 °C lasting one hour, in which the particle size was modified.
Figure 10, again, shows a similar tendency in both biomasses. There is an overall decrease compared to the total yield obtained at 180 °C, decreasing around 20% for CCW and PPW. This shows that if platform chemicals are desired, conditions of 180 °C are best for the overall yield in higher-volume reactors. At this temperature, there is a clear increase when using a particle size of 1 mm, which can be considered the optimum for this variable under these conditions. Smaller particle sizes can lead to too much energy being provided to the particles and hence a degradation of the platform chemicals and the biochar formed [30]. Bigger particle sizes can ensure that there is not too much contact between the water and the biomass and hence not too much breakdown of the lignocellulosic structures.
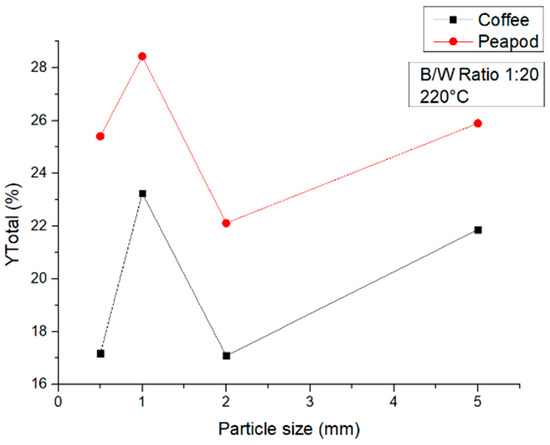
Figure 10.
Total yields of CCW and PPW in experiments at 220 °C lasting one hour, in which the particle size was modified.
Finally, at 260 °C (Figure 11), the tendency of both biomasses was maintained, with the best yields being obtained with the smaller particle sizes of 1 mm for PPW and 0.5 mm for CCW. It is worth noting that the yields again dropped compared to those obtained at 180 °C, since under these conditions, gases, formic acid, and biochar are produced in the highest quantities and the production of platform chemicals decreases.
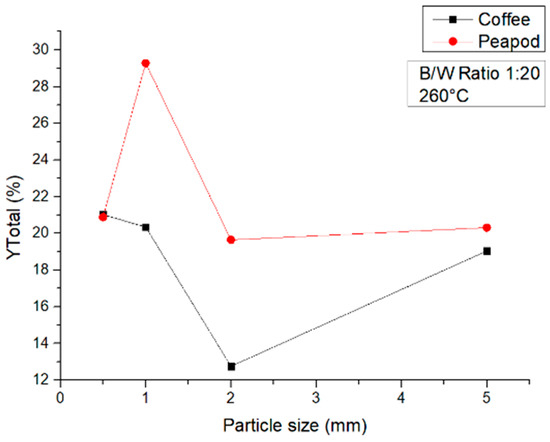
Figure 11.
Total yields of CCW and PPW in experiments at 180 °C lasting one hour, in which the particle size was modified.
These results show that the correct setting of the particle size can lead to an increase of up to 10% in the production of platform chemicals and that, even though the physicochemical structures of both the biomasses are very different and peapod waste is more effective for the production of platform chemicals, the effect of the parameter of particle size affects both biomasses very similarly, improving the overall yield at smaller particle sizes where hydrolysis is optimal.
6. Stirring Effect
The influence of stirring in hydrothermal carbonization (HTC) processes with biomass is a crucial aspect of optimizing the conversion of wet biomass waste into a coal-like material with a higher carbon content. Stirring plays a significant role in enhancing the efficiency and quality of the HTC process. It helps to improve heat transfer and mass transfer within the reactor, which is essential for the breakdown of complex biomass molecules into simpler compounds. This breakdown leads to the formation of a solid fuel with a higher carbon content, which is the primary goal of HTC. Stirring also helps to reduce the formation of unwanted byproducts and improves the overall uniformity of the reaction conditions.
Studies have shown that the stirring rate can significantly impact the properties of HTC products. For example, a study on the HTC of Typha australis found that the stirring rate did not interact with the temperature and the reaction time, indicating that the stirring rate had a consistent effect on the reaction outcomes [31]. Another study investigated the influence of stirring on pre-dried and wet biomass under selected HTC conditions and found that stirring had a significant impact on the solid mass yield and the solid fuel quality [31]. These findings highlight the importance of controlling the stirring rate in HTC processes to achieve optimal results.
Figure 12 shows how for both the coffee and peapod waste samples, the use of stirring decreased the total yields of the reactions. Similar to the other assays performed, in general, the peapod waste produced higher amounts of all the platform chemicals, producing 10% higher yields than the coffee waste biomass. Stirring decreases the amount of platform chemicals produced. This can be because a sample of biomass that is not subject to stirring can receive a lot of energy in its external parts, and by irradiating it with energy, said parts of the sample transform more easily into other platform chemicals. On the other hand, under stirring, the particles become more homogeneous and hence the external parts do not receive all the energy, which is dissipated more through the sample. More particles receive lower amounts of energy, in contrast to conditions without stirring, where fewer particles receive higher amounts of energy.
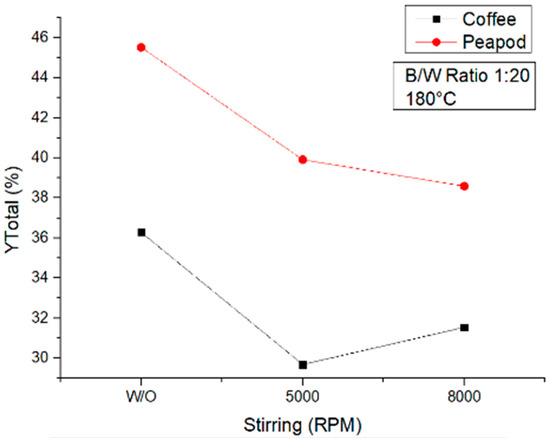
Figure 12.
Total yields of CCW and PPW in experiments at 180 °C lasting one hour, in which the agitation was modified.
Samples taken at 220 °C (Figure 13) exhibited a different behavior. Both biomasses were affected in the same way, the use of stirring increasing the total yield compared to the non-stirred samples. In the case of CCW, the maximal increase was obtained at 5000 rpm, but the sample at 8000 rpm did not change much compared to the other sample; hence, either setting can be considered optimal for coffee samples. On the other hand, for PPW, there was a noticeable increase when a speed of 5000 rpm was used, which then dropped when a speed of 8000 rpm was used. This shows that there is an optimal speed at this temperature which helps hydrolysis take place. Agitation lower than said optimal speed will not facilitate the diffusion of heat through the sample, and higher agitation will probably make the sample go to the walls of the reactor and the molecules will not be able to interact enough with the hot water and hydrolyze efficiently.
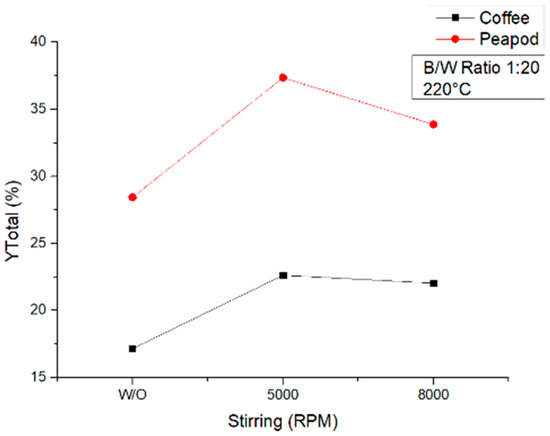
Figure 13.
Total yields of CCW and PPW in experiments at 220 °C lasting one hour, in which the agitation was modified.
Figure 14 presents the influence of stirring on hydrothermal reactions at 260 °C. This shows that, similarly to what happened at 180 °C, for both biomasses, the reactions performed without stirring yielded higher amounts of platform chemicals. This could have been for reasons similar to those noted previously and due to the fact that under these conditions the production of HTC and formic acid is favored; the reactions without stirring led to a higher carbonization of external particles as well as a higher degradation of platform chemicals into formic acid.
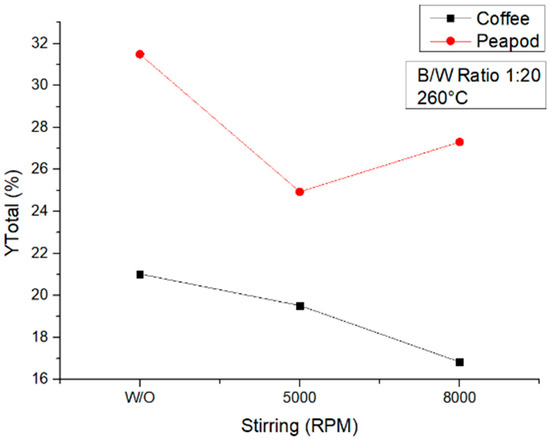
Figure 14.
Total yields of CCW and PPW in experiments at 260 °C lasting one hour, in which the agitation was modified.
These results show that, depending on the range of temperatures, the process can be favored or disfavored by stirring. Both biomasses are influenced similarly by the effect of stirring and temperature, and specific temperature conditions may require stirring assistance.
7. Catalyst Effect
Homogeneous acid catalysts play a crucial role in hydrothermal valorization processes, particularly in the dehydration and hydrolysis reactions of biomass components. Bronsted acids, such as mineral acids (e.g., sulfuric acid and hydrochloric acid) and organic acids (e.g., formic acid and acetic acid), are commonly employed in these processes. The mechanism involves protonation of the oxygen atoms in the biomass molecules, facilitating the cleavage of glycosidic bonds and ether linkages. This leads to the formation of reactive intermediates, which subsequently undergo dehydration or hydrolysis reactions, yielding valuable products like furans, phenolics, and sugars [32].
Homogeneous basic catalysts also play a significant role in hydrothermal valorization processes, particularly in transesterification and hydrolysis reactions. Alkali metal hydroxides (e.g., sodium hydroxide and potassium hydroxide) and alkali metal carbonates (e.g., sodium carbonate and potassium carbonate) are commonly used as homogeneous base catalysts. The mechanism involves the formation of an alkoxide ion from the alcohol, which then attacks the carbonyl carbon of the ester or triglyceride, facilitating the cleavage of the ester bond. This leads to the formation of fatty acid salts, which can be further converted into valuable products like biodiesel and fatty acids [33].
Figure 15 shows how when using catalysts (both acidic and basic) in a reactor of 100 mL, the total yield of coffee waste is increased up to seven times in only one hour. Sulfuric acid is a better catalyst than acetic acid, KOH, and NaHCO3 in hydrothermal processes for biomass conversion, due to its higher acidity and greater ability to facilitate the cleavage of glycosidic bonds and ether linkages. Its higher acidity allows it to more effectively protonate oxygen atoms in biomass molecules, facilitating the cleavage of these bonds and linkages, which is a crucial step in the conversion process. Additionally, sulfuric acid forms stable complexes with glycosidic bonds, enhancing their cleavage, and is more reactive than base catalysts, leading to higher yields of valuable products. Furthermore, sulfuric acid is more compatible with biomass, forming complexes that facilitate conversion, whereas KOH and NaHCO3 can react with biomass components in ways that hinder the conversion process. Overall, sulfuric acid’s unique combination of properties makes it a more effective catalyst for hydrothermal biomass conversion.
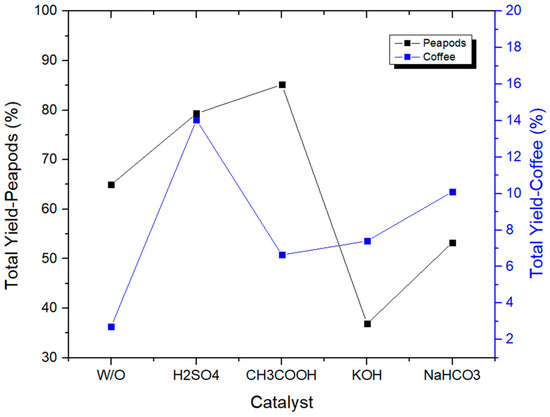
Figure 15.
Total yields of CCW and PPW in experiments at 180 °C lasting one hour, in which the catalysts were modified.
On the other hand, peapod biomass’s reaction with catalysts is not always good for the yield of platform chemicals. The use of acid catalysts increases the total yield, whilst the use of basic catalysts decreases the total yield of the hydrothermal reaction. The use of acid catalysts in hydrothermal processes for biomass conversion, including that of peapods, generally increases the total yield of platform chemicals compared to using basic catalysts. This is because acid catalysts, particularly strong acids like sulfuric acid, are more effective at cleaving the glycosidic bonds and ether linkages in biomass components.
Peapods, which have a low lignin content, are primarily composed of cellulose and hemicellulose. Acid catalysts can effectively protonate the oxygen atoms in these carbohydrate polymers, facilitating the cleavage of the glycosidic bonds that hold the monosaccharide units together [34]. This leads to the formation of reactive intermediates, such as monosaccharides and furan derivatives, which can then be further converted into valuable platform chemicals. In contrast, basic catalysts like KOH and NaHCO3 are less effective in cleaving the glycosidic bonds and ether linkages in peapods. Instead, basic catalysts are more commonly used in transesterification and hydrolysis reactions, which are important for the conversion of lipids and proteins in biomass. However, since peapods have a low lignin content, the presence of lipids and proteins is also limited, reducing the effectiveness of basic catalysts in these processes.
Furthermore, the high acidity of sulfuric acid and other mineral acids can also promote the dehydration of monosaccharides into furans, such as 5-hydroxymethylfurfural (HMF) and furfural [35]. These furan derivatives are important platform chemicals that can be further converted into a wide range of valuable products, including biofuels and biochemicals.
Figure 16 shows the total yields of reactions with catalysts performed for 2 h in a 100 mL reactor. The total yields of the reactions with catalysts for both coffee cherry waste and peapod waste exhibited distinct trends. For coffee cherry waste, the use of strong acids and basic catalysts resulted in a slight decrease in the total yield after two hours. This could be attributed to the fact that strong acids and bases can lead to over-processing of biomass, resulting in the degradation of valuable compounds and a decrease in the overall yield. In contrast, weak acid and base catalysts continued to increase the yield of the reaction, suggesting that these catalysts are more effective in facilitating the conversion of biomass components without causing excessive degradation.
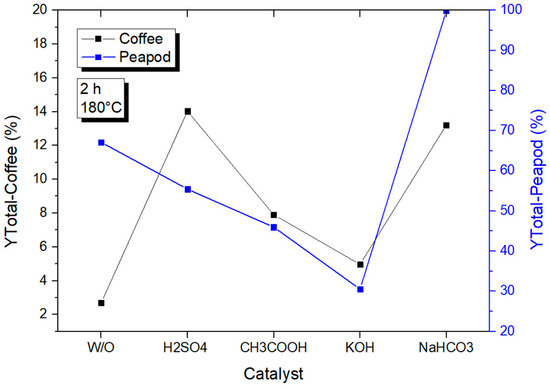
Figure 16.
Total yields of CCW and PPW in experiments at 180 °C lasting one hour, in which the catalysts were modified.
For peapod waste, the use of strong acids and basic catalysts also resulted in a decrease in the total yield after two hours. However, the use of weak bases significantly increased the yield of the reaction. This could be due to the fact that peapods have a lower lignin content compared to coffee cherry waste, making them more susceptible to degradation by strong acids and bases. Weak bases, on the other hand, are more effective in facilitating the conversion of peapods without causing excessive degradation, leading to an increase in the total yield. Overall, the choice of catalyst and its strength plays a crucial role in determining the total yield of the reaction, and the optimal catalyst for a specific biomass feedstock depends on its composition and properties.
In Table 6, each of the individual platform chemicals obtained are presented. It is worth noting that the use of certain catalysts can lead to the production of specific products that otherwise would not be produced. Levulinic acid, for instance, cannot be produced in one hour at 180 °C from CCW, but by using H2SO4, KOH, and CH3COOH, said PC can be obtained. This happens for coffee with formic acid as well, where the use of acetic acid leads to a high production of formic acid, which would not have been possible before. Peapod biomass behaves similarly, and the use of catalysts leads to the production of formic acid, HMF, and furfural, which is not possible with water only.

Table 6.
Platform chemicals obtained at two different hours at 180 °C in a 100 mL reactor.
The aim was to analyze the difference between the catalyst in a reactor of 100 mL and in a reactor of 500 mL. For this reason, a set of experiments was conducted with the catalyst in a reactor of 500 mL, and CH3COOH and NaHCO3 were used at a concentration of 0.1 M each. In Figure 17, the total yields obtained at different temperatures are shown, contrasting the results obtained with peapod and coffee biomasses.
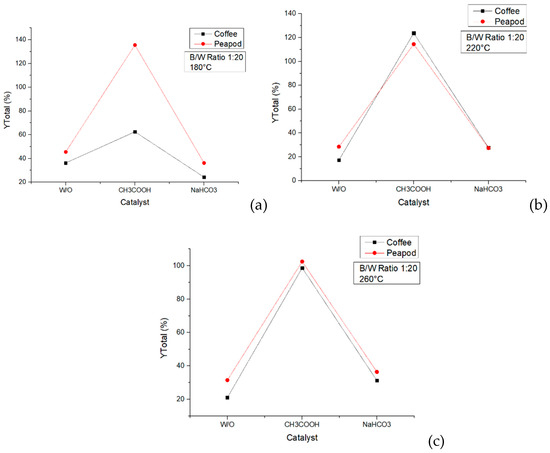
Figure 17.
Total yields of CCW and PPW in experiments lasting one hour in a 500 mL reactor with catalysts: (a) 180 °C, (b) 220 °C, and (c) 260 °C.
The same trend was observed in the coffee and peapod experiments at the three temperatures. The catalyst with CH3COOH obtained better yields than those obtained with sodium bicarbonate and without it. This occurred because using an acid catalyst favored the liquid products, whereas the basic ones favored the solid phase. At 180 °C, it is remarkable that using peapod biomass obtained higher yields than using coffee biomass. When the temperature went up, the difference in the total yields was not notable.
The use of CH3COOH as a catalyst in the hydrothermal valorization of biomass can lead to better yields compared to using NaHCO3 or no catalyst at all. Acetic acid acts as an effective acid catalyst, promoting the hydrolysis of biomass components like cellulose, hemicellulose, and lignin. The acidic conditions facilitate the cleavage of glycosidic bonds and ether linkages, leading to the depolymerization of these biopolymers into smaller, more reactive fragments. Additionally, acetic acid can catalyze dehydration reactions, which are crucial for the formation of furan-based platform chemicals like 5-hydroxymethylfurfural (HMF) and furfural from the dehydration of hexoses and pentoses, respectively.
On the other hand, NaHCO3, being a mild base, may not provide sufficient catalytic activity for the effective depolymerization and dehydration of biomass components. Its role is primarily to neutralize the acidic products formed during the hydrothermal process. In the absence of any catalyst, the hydrothermal valorization process may proceed at a slower rate, leading to lower yields of desired products. Therefore, the use of acetic acid as a catalyst can significantly enhance the hydrothermal valorization of biomass by promoting the depolymerization of biopolymers, catalyzing dehydration reactions, and facilitating the formation of valuable platform chemicals and other products [36].
It is noteworthy that the yields obtained in the new experiments differed significantly from those obtained with the same catalyst in the 100 mL reactor. For example, using NaHCO3 (0.2 M) at 180 °C in the reactor of 100 mL, total yields of 10.108% and 53.286% were obtained using coffee and peapod biomasses, respectively. In contrast, using NaHCO3 (0.1 M) at 180 °C in the 500 mL reactor resulted in total yields of 24.261% (coffee biomass) and 36.210% (peapod biomass). These variations can be attributed to differences in catalyst concentration and mass and heat transfer in the reactors with different volumes. The smaller reactor had more homogeneous temperature control due to it is placement in an oven at the required temperature [37]. The bigger reactor was heated using resistors and sensors to regulate the temperature, with the biomass and water being heated to the desired temperature. The difference in the heating systems produced differences in the results that were obtained. Additionally, the 100 mL reactor was used at 30% of its capacity, whereas the 500 mL reactor was used at 20%. These differences could have changed the mass transfer in the systems.
In Table 7, the differences in the platform chemicals obtained when using NaHCO3 and CH3COOH as catalysts are shown and can be attributed to their distinct catalytic properties and the reaction mechanisms they promote.

Table 7.
Platform chemicals obtained at three different temperatures in a 500 mL reactor.
When NaHCO3 was used as the catalyst, no furfural was obtained, and the amount of 5-hydroxymethylfurfural (HMF) produced was practically zero. This can be explained by the fact that NaHCO3 is a mild base which does not effectively catalyze the dehydration reactions required for the formation of furan-based compounds like furfural and HMF from pentoses and hexoses, respectively [38,39].
In contrast, when CH3COOH was used as the catalyst, no levulinic acid was produced. This was because the formation of levulinic acid typically requires stronger acid catalysts, such as mineral acids (e.g., sulfuric acid and hydrochloric acid), which can effectively catalyze the dehydration and rehydration reactions involved in the conversion of HMF to levulinic acid [40,41].
However, both NaHCO3 and CH3COOH catalysts promoted the production of formic acid in both biomasses, which is a common product in hydrothermal processes involving biomass. The formation of formic acid can occur through various pathways, including the dehydration of carbohydrates, the decarboxylation of lactic acid, and the hydrolysis of formic acid esters [42,43]. The higher yield of formic acid obtained using CH3COOH at 220 °C with peapod biomass can be attributed to the more effective catalytic activity of acetic acid in promoting these reactions.
Regarding sugar yields, the highest yield was obtained using CH3COOH at 220 °C with coffee biomass. This can be explained by the fact that acetic acid can effectively catalyze the hydrolysis of cellulose and hemicellulose present in biomass, leading to the formation of monomeric sugars [44]. The higher lignin content in coffee biomass compared to peapod biomass may also contribute to the higher sugar yields, as lignin can act as a barrier, hindering the accessibility of the catalysts to the carbohydrate fractions [45].
8. Biochar Characterization (Van Krevelen)
Van Krevelen diagrams illustrate the distribution of carbon, oxygen, and hydrogen in biochars [46]. The solid fractions obtained at 260 °C were characterized using elemental analysis and positioned in a Van Krevelen diagram (Figure 18). In general, it can be concluded that the biomass and biochar obtained from peapods have higher H/C ratios than those from coffee. Within the biomass zone, the initial biomass of peapod waste exhibits higher H/C and O/C ratios compared to coffee waste biomass, resulting in peapod biomass being more oxygenated and less like coal than coffee biomass.
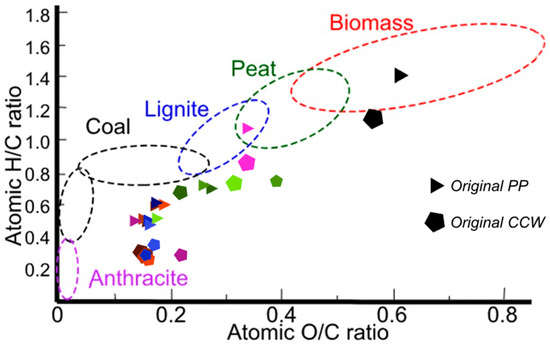
Figure 18.
Characterization of samples obtained from the different hydrothermal reactions with CCW (pentagons) and PPW (triangles). (Nomenclature for the samples is presented in the Supplementary Materials).
Most of the results obtained at 260 °C from peapod and coffee biomasses with modification of the variables are observed near the coal and anthracite zones. This indicates that parameters such as particle size, biomass/water ratio, and stirring do not significantly impact the characteristics of the solid products resulting from the hydrothermal reaction. The starting material in both cases differed a bit: CCW has a higher carbon content than PPW, which can thus be characterized as a typical biomass, whilst coffee is almost outside the range for biomasses.
On the other hand, when catalysts were used, the H/C and O/C ratios of the biochars were higher. For example, the solid obtained from peapod biomass without a catalyst at 260 °C and with a biomass/water ratio of 1:20 had an O/C ratio of 0.16 and an H/C ratio of 0.56. However, when using NaHCO3 as a catalyst, the solid produced had an O/C ratio of 0.25 and an H/C ratio of 0.70. From this, it was concluded that if it is desired to obtain a solid with characteristics similar to anthracite and coal, it is better to use only water as a catalyst, but if it is desired to functionalize a biochar by adding specific elements (Na, S, K, Ca, etc.) to modify its characteristics, it is a good idea to add catalysts to the process.
Figure 17 presents the characterization of a solid sample obtained at 180 °C with a 1:20 water/biomass ratio to make a comparison between solids obtained at 180 and 260 °C. The pink triangle that is in the lignite zone is the peapod biochar obtained at 180 °C (O/C = 0.34, H/C = 1.09). Compared to the set of experiments made at 260 °C, at 180 °C, the O/C ratio was higher, which meant that the biomass was less carbonized in this condition and could not be classified as coal. The same behavior was observed at 180 °C with coffee biomass (pink pentagon next to the lignite zone). The solid obtained via the hydrothermal reaction at 180 °C (O/C = 0.34, H/C = 0.85) with coffee biomass had a similar O/C ratio to the hydrothermal process performed under the same conditions with peapod biomass but a lower H/C ratio. Compared to the 260 °C experiment, the O/C and H/C ratios were remarkably higher and made the product less coal-/anthracite-like. This shows that temperatures of 260 °C actually transform the initial biomass into fossil carbon-like structures that could be used to make energy sources greener.
The difference in the final products obtained from the hydrothermal carbonization (HTC) of peapod waste and coffee cherry waste can be attributed to their varying initial compositions, particularly their lignin contents. Lignin is a complex aromatic polymer present in plant biomass, and it is known to be more resistant to thermal degradation compared to other components like cellulose and hemicellulose. During the HTC process, biomass undergoes a series of reactions, including hydrolysis, dehydration, decarboxylation, and condensation polymerization, leading to the formation of a carbonaceous solid product (biochar) with a higher carbon content and a more aromatic structure [47].
Peapod waste (as shown in Table 1) typically has a lower lignin content compared to coffee cherry waste. The lower lignin content in peapod waste means that there are fewer aromatic structures present initially, and, during the HTC process, the reactions primarily involve the depolymerization and repolymerization of cellulose and hemicellulose components. As a result, the biochar obtained from peapod waste may have a lower degree of aromaticity and a lower carbon content, resembling a coal-like material.
On the other hand, coffee cherry waste is known to have a higher lignin content [26]. The presence of a significant amount of lignin in the initial biomass contributes to the formation of a more aromatic and carbon-rich biochar during the HTC process. The lignin undergoes condensation reactions, leading to the formation of aromatic structures and a higher degree of aromaticity in the final product. Consequently, the biochar obtained from coffee cherry waste may exhibit properties more similar to anthracite, which is a highly aromatic and carbon-rich form of coal [48].
9. Conclusions
The characterization of coffee cherry waste (CCW) and peapod waste through various analytical techniques has highlighted distinct differences in their composition and behavior during hydrothermal conversion. Coffee cherry waste demonstrated higher moisture (10.94%) and ash contents (7.79%) compared to peapod waste, which had lower moisture (7.77%) and ash contents (4.22%) but was higher in fixed carbon (13.0%) and hemicellulose (17.4%). Conversely, CCW had higher volatile matter (79.91%) and cellulose contents (27.6%), indicating its different chemical makeup.
Optimal extraction conditions varied significantly between the two biomasses. Peapod waste achieved its highest yield (70.994%) at 180 °C, beyond which degradation occurred. Coffee cherry waste initially produced minimal platform chemicals at this temperature, but an extended reaction time increased its yield to 20.789%. Within the hydrothermal carbonization (HTC) range, CCW reached its peak yield (21.592%) at 200 °C—a temperature that negatively impacted the peapod waste, reducing its yield to 21.043%.
Process parameters such as biomass-to-water (B/W) ratio, particle size, stirring, and catalyst type affected both biomasses similarly. Lower B/W ratios (1:20 and 1:40) and smaller particle sizes (0.5 and 1 mm) enhanced the yields of platform chemicals. Stirring had a minimal impact, while acid catalysts proved more effective than alkaline ones in facilitating the hydrothermal reactions.
This study emphasizes that the initial physicochemical characteristics of the biomasses, especially their hemicellulose, cellulose, and lignin contents, played a crucial role in determining the optimal conditions for platform chemical production. These findings suggest that a one-size-fits-all approach is ineffective for hydrothermal valorization. Instead, specific optimization tailored to the unique properties of each biomass is necessary to maximize yield and efficiency.
Supplementary Materials
The following supporting information can be downloaded at: https://www.mdpi.com/article/10.3390/chemengineering8050098/s1, Figure S1: Standards used for analytic method development, Table S1: Retention times for standards used, Table S2: Characterization of biochar from coffee cherry waste, Table S3: Characterization of biochar from peapods.
Author Contributions
Conceptualization, A.S.L.P.; methodology, A.S.L.P.; validation, A.S.L.P. and V.R.M.; formal analysis, A.S.L.P. and V.R.M.; investigation, A.S.L.P. and V.R.M.; resources, C.A.G.F.; data curation, A.S.L.P. and V.R.M.; writing—original draft preparation, A.S.L.P. and V.R.M.; writing—review and editing, A.S.L.P. and C.A.G.F.; visualization, A.S.L.P.; supervision, C.A.G.F.; project administration, C.A.G.F.; funding acquisition, A.S.L.P. and C.A.G.F. All authors have read and agreed to the published version of the manuscript.
Funding
This research was funded by COLCIENCIAS, with the financial funds approved for the project titled “Implementation of a hydrothermal biorefinery to produce chemical products with high added value, using residual biomass from agro-industrial processes, in an intersectoral alliance (academy-industry)”, call: 914; contract: 101-2022, code: 1101-914-91642.
Data Availability Statement
All data used in the study are presented in the manuscript.
Conflicts of Interest
The authors declare no conflicts of interest.
References
- Cherubini, F. The biorefinery concept: Using biomass instead of oil for producing energy and chemicals. Energy Convers. Manag. 2010, 51, 1412–1421. [Google Scholar] [CrossRef]
- Ragauskas, A.J.; Williams, C.K.; Davison, B.H.; Britovsek, G.; Cairney, J.; Eckert, C.A.; Frederick, W.J., Jr.; Hallett, J.P.; Leak, D.J.; Liotta, C.L.; et al. The Path Forward for Biofuels and Biomaterials. Science 2006, 311, 484–489. [Google Scholar] [CrossRef] [PubMed]
- Queneau, Y.; Han, B. Biomass: Renewable carbon resource for chemical and energy industry. Innovation 2022, 3, 10018. [Google Scholar] [CrossRef]
- Velvizhi, G.; Goswami, C.; Shetti, N.P.; Ahmad, E.; Pant, K.K.; Aminabhavi, T.M. Valorisation of lignocellulosic biomass to value-added products: Paving the pathway towards low-carbon footprint. Fuel 2022, 313, 122678. [Google Scholar] [CrossRef]
- Ji, H.; Dong, C.; Yang, G.; Pang, Z. Valorization of Lignocellulosic Biomass toward Multipurpose Fractionation: Furfural, Phenolic Compounds, and Ethanol. ACS Sustain. Chem. Eng. 2018, 6, 15306–15315. [Google Scholar] [CrossRef]
- Devi, A.; Bajar, S.; Kour, H.; Kothari, R.; Pant, D.; Singh, A. Lignocellulosic Biomass Valorization for Bioethanol Production: A Circular Bioeconomy Approach. BioEnergy Res. 2022, 15, 1820–1841. [Google Scholar] [CrossRef] [PubMed]
- Buzała, K.P.; Kalinowska, H.; Przybysz, P.; Małachowska, E. Conversion of various types of lignocellulosic biomass to fermentable sugars using kraft pulping and enzymatic hydrolysis. Wood Sci. Technol. 2017, 51, 873–885. [Google Scholar] [CrossRef]
- Borah, A.J.; Dikshit, P.K.; Doloi, M.; Moholkar, V.S.; Poddar, M.K. Extraction and characterization of lignin from waste invasive weeds with dioxane-based process. Biomass Convers. Biorefinery 2023, 13, 11121–11130. [Google Scholar] [CrossRef]
- Wang, S.; Cheng, A.; Liu, F.; Zhang, J.; Xia, T.; Zeng, X.; Fan, W.; Zhang, Y. Catalytic conversion network for lignocellulosic biomass valorization: A panoramic view. Ind. Chem. Mater. 2023, 1, 188–206. [Google Scholar] [CrossRef]
- Burniol-Figols, A.; Cenian, K.; Skiadas, I.V.; Gavala, H.N. Integration of chlorogenic acid recovery and bioethanol production from spent coffee grounds. Biochem. Eng. J. 2016, 116, 54–64. [Google Scholar] [CrossRef]
- Tzani, A.; Lymperopoulou, T.; Pitterou, I.; Karetta, I.; Belfquih, F.; Detsi, A. Development and optimization of green extraction process of spent coffee grounds using natural deep eutectic solvents. Sustain. Chem. Pharm. 2023, 34, 101144. [Google Scholar] [CrossRef]
- Gu, J.; Lee, A.; Choe, C.; Lim, H. Comparative study of biofuel production based on spent coffee grounds transesterification and pyrolysis: Process simulation, techno-economic, and life cycle assessment. J. Clean. Prod. 2023, 428, 139308. [Google Scholar] [CrossRef]
- Colantoni, A.; Paris, E.; Bianchini, L.; Ferri, S.; Marcantonio, V.; Carnevale, M.; Palma, A.; Civitarese, V.; Gallucci, F. Spent coffee ground characterization, pelletization test and emissions assessment in the combustion process. Sci. Rep. 2021, 11, 5119. [Google Scholar] [CrossRef]
- Feng, Y.; Zhang, H.; Zhang, Y.; Bai, Y.; Wang, Y. Novel peapod NiO nanoparticles encapsulated in carbon fibers for high-efficiency supercapacitors and lithium-ion batteries. J. Mater. Chem. A 2016, 4, 3267–3277. [Google Scholar] [CrossRef]
- Guo, J.; Zhang, H.; Geng, H.; Mi, X.; Ding, G.; Jiao, Z. Efficient one-pot synthesis of peapod-like hollow carbon nanomaterials for utrahigh drug loading capacity. J. Colloid Interface Sci. 2015, 437, 90–96. [Google Scholar] [CrossRef]
- Fang, L.; Li, W.; Guan, Y.; Feng, Y.; Zhang, H.; Wang, S.; Wang, Y. Tuning Unique Peapod-Like Co(SxSe1–x)2 Nanoparticles for Efficient Overall Water Splitting. Adv. Funct. Mater. 2017, 27, 1701008. [Google Scholar] [CrossRef]
- Hu, Y.; Gallant, R.; Salaudeen, S.; Farooque, A.A.; He, S. Hydrothermal Carbonization of Spent Coffee Grounds for Producing Solid Fuel. Sustainability 2022, 14, 8818. [Google Scholar] [CrossRef]
- Shao, J.; Yang, X.; Luo, S.; Liu, S.; Sun, X. Innovation and Valorization of Spent Coffee Grounds 2 Treated by Hydrothermal in Cementitious Materials. SSRN 2024. [Google Scholar] [CrossRef]
- Massaya, J.; Pickens, G.; Mills-Lamptey, B.; Chuck, C.J. Enhanced Hydrothermal Carbonization of Spent Coffee Grounds for the Efficient Production of Solid Fuel with Lower Nitrogen Content. Energy Fuels 2021, 35, 9462–9473. [Google Scholar] [CrossRef]
- National Renewable Energy Laboratory. NREL/TP-510-42621 Determination of Total Solids in Biomass and Total Dissolved Solids in Liquid Process Samples. Colorado 2008. [Google Scholar]
- National Renewable Energy Laboratory. NREL/TP-510-42622 Determination of Ash in Biomass. Colorado 2005. [Google Scholar]
- ASTM E872-82; Standard Test Method for Volatile Matter in the Analysis of Particulate Wood Fuels. ASTM: West Conshohocken, PA, USA, 2019.
- ASTM D5373-21; Standard Test Methods for Determination of Carbon, Hydrogen and Nitrogen in Analysis Samples of Coal and Carbon in Analysis Samples of Coal and Coke. ASTM: West Conshohocken, PA, USA, 2021.
- Van Soest, P.J.; Robertson, J.B.; Lewis, B.A. Methods for Dietary Fiber, Neutral Detergent Fiber, and Nonstarch Polysaccharides in Relation to Animal Nutrition. J. Dairy Sci. 1991, 74, 3583–3597. [Google Scholar] [CrossRef] [PubMed]
- Galvis-Sandoval, D.E.; Lozano-Pérez, A.S.; Guerrero-Fajardo, C.A. Hydrothermal Valorization via Liquid Hot Water and Hydrothermal Carbonization of Peapods Waste: Characterization of the Biochar and Quantification of Platform Molecules. Appl. Sci. 2024, 14, 2329. [Google Scholar] [CrossRef]
- Lozano-Pérez, A.S.; Guerrero-Fajardo, C.A. Liquid Hot Water (LHW) and Hydrothermal Carbonization (HTC) of Coffee Berry Waste: Kinetics, Catalysis, and Optimization for the Synthesis of Platform Chemicals. Sustainability 2024, 16, 2854. [Google Scholar] [CrossRef]
- Moreno-Chocontá, L.N.; Lozano-Pérez, A.S.; Guerrero-Fajardo, C.A. Evaluation of the Effect of Particle Size and Biomass-to-Water Ratio on the Hydrothermal Carbonization of Sugarcane Bagasse. Chemengineering 2024, 8, 43. [Google Scholar] [CrossRef]
- Heidari, M.; Salaudeen, S.; Dutta, A.; Acharya, B. Effects of Process Water Recycling and Particle Sizes on Hydrothermal Carbonization of Biomass. Energy Fuels 2018, 32, 11576–11586. [Google Scholar] [CrossRef]
- Li, W.; Shi, E.; Fukuda, T. Particle size of powders under hydrothermal conditions. Cryst. Res. Technol. 2003, 38, 847–858. [Google Scholar] [CrossRef]
- He, P.; Liu, Y.; Shao, L.; Zhang, H.; Lü, F. Particle size dependence of the physicochemical properties of biochar. Chemosphere 2018, 212, 385–392. [Google Scholar] [CrossRef] [PubMed]
- Abdeldayem, O.M.; Al Noman, A.; Dupont, C.; Ferras, D.; Ndiaye, L.G.; Kennedy, M. Hydrothermal carbonization of Typha australis: Influence of stirring rate. Environ. Res. 2023, 236, 116777. [Google Scholar] [CrossRef] [PubMed]
- Eladnani, I.; Bracciale, M.P.; Damizia, M.; Mousavi, S.; De Filippis, P.; Lakhmiri, R.; de Caprariis, B. Catalytic Hydrothermal Liquefaction of Brachychiton populneus Biomass for the Production of High-Value Bio-Crude. Processes 2023, 11, 324. [Google Scholar] [CrossRef]
- Nallasivam, J.; Prashanth, P.F.; Harisankar, S.; Nori, S.; Suryanarayan, S.; Chakravarthy, S.; Vinu, R. Valorization of red macroalgae biomass via hydrothermal liquefaction using homogeneous catalysts. Bioresour. Technol. 2022, 346, 126515. [Google Scholar] [CrossRef] [PubMed]
- Kokel, A.; Schäfer, C.; Török, B. Organic Synthesis Using Environmentally Benign Acid Catalysis. Curr. Org. Synth. 2019, 16, 615–649. [Google Scholar] [CrossRef] [PubMed]
- Pereira, P.; Savage, P.E.; Pester, C.W. Acid catalyst screening for hydrolysis of post-consumer PET waste and exploration of acidolysis. Green Chem. 2024, 26, 1964–1974. [Google Scholar] [CrossRef]
- Zhou, Y.; Remón, J.; Pang, X.; Jiang, Z.; Liu, H.; Ding, W. Hydrothermal conversion of biomass to fuels, chemicals and materials: A review holistically connecting product properties and marketable applications. Sci. Total. Environ. 2023, 886, 163920. [Google Scholar] [CrossRef] [PubMed]
- Haase, S.; Tolvanen, P.; Russo, V. Process Intensification in Chemical Reaction Engineering. Processes 2022, 10, 99. [Google Scholar] [CrossRef]
- Cantero, D.A.; Bermejo, M.D.; Cocero, M.J. Kinetic analysis of cellulose depolymerization reactions in near critical water. J. Supercrit. Fluids 2013, 75, 48–57. [Google Scholar] [CrossRef]
- Savage, P.E. A perspective on catalysis in sub- and supercritical water. J. Supercrit. Fluids 2009, 47, 407–414. [Google Scholar] [CrossRef]
- Rackemann, D.W.; Doherty, W.O. The conversion of lignocellulosics to levulinic acid. Biofuels Bioprod. Biorefining 2011, 5, 198–214. [Google Scholar] [CrossRef]
- Girisuta, B.; Janssen, L.; Heeres, H. Green Chemicals. Chem. Eng. Res. Des. 2006, 84, 339–349. [Google Scholar] [CrossRef]
- Kruse, A.; Dinjus, E. Hot compressed water as reaction medium and reactant. J. Supercrit. Fluids 2006, 39, 362–380. [Google Scholar] [CrossRef]
- Cantero, D.A.; Álvarez, A.; Bermejo, M.D.; Cocero, M.J. Transformation of glucose into added value compounds in a hydrothermal reaction media. J. Supercrit. Fluids 2015, 98, 204–210. [Google Scholar] [CrossRef]
- Toor, S.S.; Rosendahl, L.; Rudolf, A. Hydrothermal liquefaction of biomass: A review of subcritical water technologies. Energy 2011, 36, 2328–2342. [Google Scholar] [CrossRef]
- Hu, F.; Ragauskas, A. Pretreatment and Lignocellulosic Chemistry. BioEnergy Res. 2012, 5, 1043–1066. [Google Scholar] [CrossRef]
- Santín, C.; Doerr, S.H.; Merino, A.; Bucheli, T.D.; Bryant, R.; Ascough, P.; Gao, X.; Masiello, C.A. Carbon sequestration potential and physicochemical properties differ between wildfire charcoals and slow-pyrolysis biochars. Sci. Rep. 2017, 7, 11233. [Google Scholar] [CrossRef] [PubMed]
- Khan, M.A.; Hameed, B.H.; Siddiqui, M.R.; Alothman, Z.A.; Alsohaimi, I.H. Hydrothermal Conversion of Food Waste to Carbonaceous Solid Fuel—A Review of Recent Developments. Foods 2022, 11, 4036. [Google Scholar] [CrossRef] [PubMed]
- Lu, X. Understanding Hydrothermal Carbonization of Mixed Feedstocks for Waste Conversion; University of South Carolina: New York, NY, USA, 2014. [Google Scholar]
Disclaimer/Publisher’s Note: The statements, opinions and data contained in all publications are solely those of the individual author(s) and contributor(s) and not of MDPI and/or the editor(s). MDPI and/or the editor(s) disclaim responsibility for any injury to people or property resulting from any ideas, methods, instructions or products referred to in the content. |
© 2024 by the authors. Licensee MDPI, Basel, Switzerland. This article is an open access article distributed under the terms and conditions of the Creative Commons Attribution (CC BY) license (https://creativecommons.org/licenses/by/4.0/).