Abstract
The effect of sintering temperature on the structural, magnetic, and dielectric properties of NiCr2O4 ceramics was investigated. A powder X-ray analysis indicates that the prepared nanocrystallites effectively inhibit the cooperative Jahn–Teller distortion, thereby stabilizing the high-temperature cubic phase structure with space group Fd-3m. Multiple transitions are confirmed by temperature-dependent magnetization M(T) data. Moreover, the magnetization value decreases and the Curie temperature increases with a decrease in the crystallite size. The low-temperature-dependent real permittivity (ε′-T) for a NiCr2O4 crystallite size of 78 nm exhibits a broad maximum at 40 K that is independent of frequency. This establishes a correlation between electric ordering and the underlying magnetic structure. The temperature dependency of the dielectric constant at fixed frequencies for both NiCr2O4 crystallite sizes rises with temperature for a certain range of frequencies. A significant improvement is evident: the dielectric constant (ε’) at room temperature reaches approximately 5738 for the sample with 28 nm crystallites, while the 78 nm crystallite sample shows a noticeable drop to ε’~174. The frequency-dependent conductivity curves for both types of NiCr2O4 nanocrystallites have different conductivity values. The lower-crystallite-size sample demonstrates higher conductivity values than the 78 nm crystallite size one. This observation is attributed to the decrease in crystallite size, which increases the number of grain boundaries and, consequently, scatters a higher number of charge carriers.
1. Introduction
The multiferroic character of spinel chromites with the general formula ACr2O4 (A = Ni, Co, Zn, Fe, etc.), which crystallize in a cubic phase at high temperatures, has garnered significant attention recently due to its possible applications [1,2,3,4,5]. The face-centered cubic (FCC) lattice in this spinel structure is formed by oxygen ions. Two types of interstitial sites are present in this lattice: the tetrahedral A-site, which occupies the 2+ ion, and the octahedral B-site, which occupies the Cr3+ ion because of its strong crystal field stabilization energy [6]. Cooperative Jahn–Teller distortion induces the reduction of the high-symmetry cubic phase to the tetragonal phase when orbital degeneracy is present on the A-site ions, such as Cu2+, Fe2+, and Ni2+ [7]. Furthermore, a decrease in lattice symmetry combined with magnetic phase transition is further enabled in these compounds by strong interactions between the spin, orbital, and lattice degrees of freedom [4,7].
At 320 K, cooperative Jahn–Teller distortion triggers a structural phase transition in bulk NiCr2O4 from cubic to tetragonal (space group I41/amd) [4,7,8]. The Curie temperature (TC) and the magnetostructural coupling-induced tetragonal-to-orthorhombic phase change occur 65 K below 320 K [4]. Distortion is also observed within the orthorhombic phase at the spin-spiral ordering temperature (TS ~ 31 K). NiCr2O4 exhibits a complex magnetic structure, with Cr3+ ions forming a magnetically frustrated pyrochlore sublattice with antiferromagnetic (AFM) exchange interactions between neighboring Cr3+ ions and A-site magnetic ions forming the diamond sublattice with ferromagnetic (FM) ordering [9,10,11]. However, for reduced crystallite sizes, quite different results have been published by different groups [12,13,14]. Moreover, for most applications in electronic materials, the focus lies on the dielectric properties, including the real (ԑ՛) and imaginary (ԑ″) components of the complex permittivity. The real part (ε’) indicates material polarizability, while the imaginary part (ԑ”) signifies energy loss from polarization and ionic conduction. Material permittivity mirrors molecular relaxation and transport processes, influenced by factors such as the material structure, composition, and synthesis method.
Nowadays, there is a growing interest in materials with high dielectric constants and low dielectric losses, particularly in wireless communication. Giant-dielectric-constant materials, such as metal-doped ceramics, are extensively utilized in various applications including gas sensors, solar cells, field emission devices, catalysis, and biological applications [15,16,17]. The unique properties of nanomaterials stem from their high surface-area-to-volume ratio effects on charge carriers, small size, and enhanced grain and grain boundary contributions. Nanostructured ceramic materials are particularly noteworthy due to their simplicity in synthesis and pure form, along with their high dielectric constants, which make them highly sought after in the electronics industry [15,16,17].
Understanding the impact of microstructure, composition, and intergranular potential barriers on the electrical properties of nanomaterials is crucial. The synthesis of nanomaterials employs diverse methods, including micro-emulsion, hydrothermal, chemical precipitation, co-precipitation, sol–gel, and combustion synthesis, to control the size, morphology, and magnetic properties [18,19,20,21]. Solution combustion synthesis, characterized by self-sustained exothermic reactions in an aqueous or sol–gel medium, offers a green, energy-efficient approach facilitating scalability and continuity [18]. This method enables the synthesis of a range of nanoscale materials, encompassing oxides, nitrides, sulfides, metals, and alloys. In this research, NiCr2O4 nanocrystallites were prepared by the combustion method because of its simplicity, convenience of preparation of high-purity products, and capacity for designing and controlling chemical compositions [22,23,24,25]. Using this technique, it is possible to produce a large amount of NiCr2O4 nanocrystals, even in quantities as small as a fraction of a grain. The annealing temperature is known to have a significant effect on the grain size of nanocrystallites.
As the size is reduced, different results are obtained. The high-temperature cubic phase (space group Fd-3m) is stabilized at room temperature. TC is increased with lattice expansion in spinel oxide nanoparticles. In general, lowering the growth temperature results in a defective structure. These formed defects offer a preferable place to accumulate charge and subsequently increase the dielectric permittivity. Increasing the growth temperature and achieving less defective particles dramatically decreases the dielectric permittivity, which is expected due to the decrease in the number of space charges in the particle. As a result, the effect of defects on the dielectric properties of nanoparticles becomes prominent. This investigation into the influence of sintering temperature on the structural, magnetic, and dielectric properties of NiCr2O4 ceramics unveiled intriguing findings. Through powder X-ray analysis, it was revealed that nanocrystallites play a pivotal role in impeding the cooperative Jahn–Teller distortion, thereby stabilizing the high-temperature cubic phase (Fd-3m). This discovery elucidates a crucial aspect of the material’s behavior. Magnetization M(T) data further corroborate these findings, showcasing multiple transitions and a noteworthy decrease in magnetization value with diminishing crystallite size. The study of the low-temperature-dependent real permittivity (ε’-T) presents a novel insight, demonstrating a broad maximum at 40 K, irrespective of frequency. This observation establishes a compelling correlation between electric ordering and the underlying magnetic structure, shedding light on the intricate interplay of these properties. Additionally, the temperature dependency of the dielectric constant reveals intriguing trends, with significant enhancements observed in samples with smaller crystallite sizes. Remarkably, the frequency-dependent conductivity curves highlight distinct conductivity values for different crystallite sizes, with lower-crystallite-size samples exhibiting higher conductivity attributed to increased grain boundary scattering of charge carriers. These findings contribute significantly to our understanding of the intricate relationship between structural morphology, magnetic behavior, and dielectric properties in NiCr2O4 ceramics, paving the way for innovative applications and further research in this field.
2. Materials and Methods
The combustion method was used to synthesize NiCr2O4 nanocrystallites. Metal nitrates (1 mole of Ni(NO3)2 4H2O (6.47 g) and 2 moles of Cr(NO3)3 6H2O (17.8)) were the ingredients employed in the synthesis, and urea and citric acid were the propellants. Citric acid was used as the fuel agent throughout the combustion process to create the samples. The fuel and mixed metal nitrates were dissolved in distilled water at a weight ratio of 1:2. The mixture was then heated at 80 °C while stirring. A gel was formed. The gel was then heated to 300 °C in an oven. After firing, the gel burned and produced a thick NiCr2O4 ceramic powder. The powder was divided into sections and calcined for 12 h at 600 °C. The calcined powders were finely ground and then cold-pressed under 239 kPa pressure for 5 min into pellets measuring 10 mm in diameter and 1 mm in thickness. These discs were annealed at two different temperatures, namely TA = 800 °C and 1200 °C, each for a duration of 6 h. The heating and cooling rates for both annealing processes were maintained at 5 °C/min. The annealed samples’ structure and phase purity were examined using a Philips PW-1817 with Cu Kα radiation to obtain powder X-ray diffraction patterns; the measurements were performed between 10° and 70°. The temperature-dependent magnetization of field-cooled (FC) and zero-field-cooled (ZFC) conditions was measured in a commercial SQUID magnetometer. Silver paste was applied as an electrode on both sides of the disc samples in order to measure the electrical properties. The silver paste effect was the same for both samples.
The capacitance (C) and dielectric loss tangent (tanδ) were assessed using an HP-4194A impedance analyzer with a computer-controlled program across a wide frequency range of 20 Hz–1 MHz and temperatures ranging from 10 to 320 K.
The real (ε’) and imaginary (ε”) components of the complex dielectric constant were determined based on sample dimensions and raw data.
ε’ = C t/Aε0 and ε” = ε’tanδ
Here, C denotes the capacitance, t represents the sample thickness, A signifies the cross-sectional area (m2), and ε0 represents the permittivity of the free space (ε0 = 8.854 × 10⁻¹² F/m).
3. Results
3.1. Structural Characterization
Figure 1 illustrates the X-ray diffraction patterns of NiCr2O4 nanocrystalline ceramics. The XRD pattern of these two samples can be attributed to a space group Fd-3m simple cubic spinel structure [4,26]. At ~320 K, this compound undergoes a structural phase transition from cubic to tetragonal (space group I41/amd) [4,7,8]. A powder X-ray analysis of the present nanocrystallites showed a cubic phase (Fd-3m), indicating that the nanocrystallites effectively inhibited the cooperative Jahn–Teller distortion, thereby stabilizing the high-temperature cubic phase (Fd-3m). The distinctive XRD peaks with a large full width at half-maximum indicate the formation of nanocrystals. It is well known that size confinement in nanocrystals and the presence of intrinsic strain, which originates as a result of the size confinement, broaden the XRD peaks. Thus, a physical peak broadening primarily consists of two parts: size-dependent broadening and strain-induced broadening. The intensity of the prominent peak formed at ≈36.08° for the 1200 °C NiCr2O4 sample is substantially higher than that for the 800 °C sample because of the high electron density, attributed to the large crystalline size.
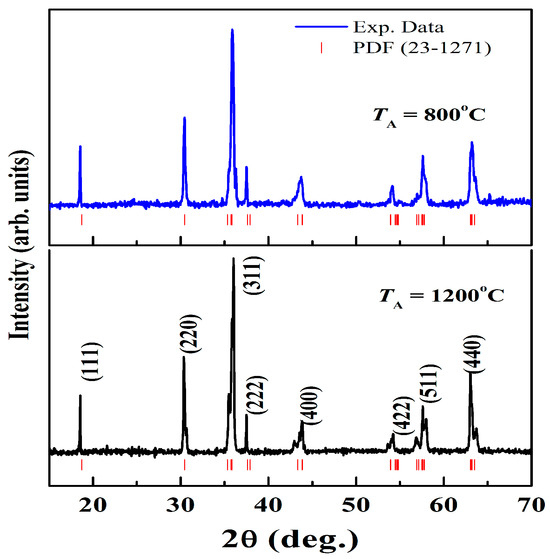
Figure 1.
X-ray diffraction patterns of NiCr2O4 nanocrystalline ceramics; the ticks indicate JCPDF file 23–1271.
The crystallite sizes at different calcination temperatures were calculated for the reflection planes (111), (220), and (311) using the Scherrer formula:
where D is the average crystalline size, K is the shape factor (0.9), λ is the wavelength of X-ray radiation (1.5418 Å), and β is the full width at half-maximum of the peak.
It was observed that the FWHM values decreased and the average crystallite size values increased with increasing calcination temperature. The Debye–Scherrer equation was utilized to determine the average crystallite size (d) of the NiCr2O4 nanocrystallites: d = 0.9λ/(βcos θ), where β is the strong peak’s full width at half-maximum intensity (FWHM), θ is the matching diffraction angle, and λ is the wavelength of Cu Kα radiation (λ = 1.5406 Å). As shown in Figure 1, the average crystallite diameters for the NiCr2O4 crystallites annealed at 800 and 1200 °C were determined to be 28 and 78 nm.
FE-SEM images of the powder samples of NiCr2O4 annealed at 800 and 1200 °C are depicted in Figure 2. These pictures indicate the agglomeration of grains. The porosity and crystallite size were influenced by the annealing temperature, with grain sizes below 100 nm. However, the density variation of the pressed pellets was not significantly affected at higher annealing temperatures. To understand more, we calculated the theoretical (XRD) density, rxrd, using the following equation: ρxrd = M.Z/NA.V, where M is the molecular weight of the material (226.683 g/mol), Z = 8 for a crystalline cell, NA is Avogadro’s number (6.02214 × 10²³ mol−1), and V is the basic cell volume (524.8 × 10⁻²⁴ cm3). Using this equation, the theoretical density ρxrd of NiCr2O4 was found to be 5.74 g/cm3. The sample density ρsam of the materials was determined using the Archimedes method in absolute ethanol (density reth = 0.79 g/cm3), and then the relative density was obtained using the theoretical density of NiCr2O4, ρxrd = 5.74 g/cm3. According to the Archimedes method, the following masses were determined: m1, the mass of the dry pellet; m2, the mass of the pellet immersed in ethanol; and m3, the mass of the pellet impregnated with ethanol. The apparent density and relative density of the studied samples were calculated using the following equations:
ρsam = [m1/(m3 − m2)]/ρeth
ρrel = (ρsam/ρxrd) × 100
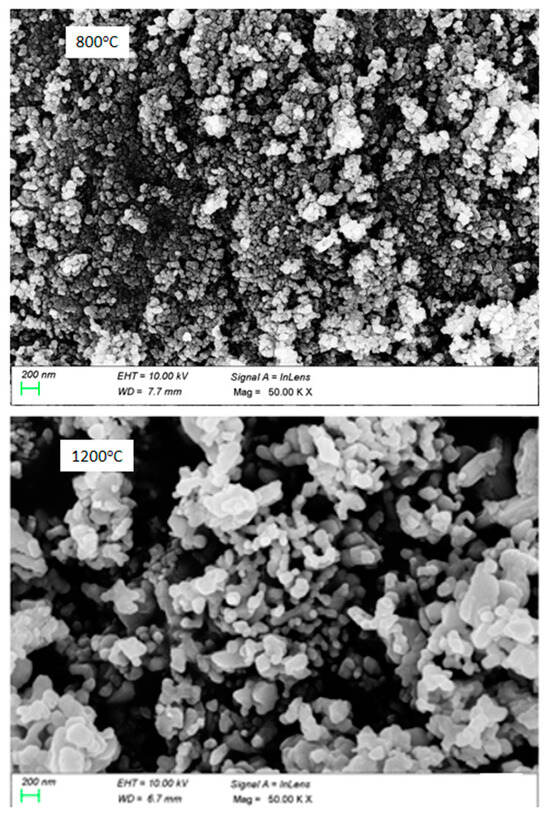
Figure 2.
FE-SEM micrographs of NiCr2O4 nanocrystalline ceramics at 800 °C and 1200 °C.
From these equations, the relative density (ρrel) values of the NiCr2O4 samples at room temperature were found to be 4.94 g/cm3 for 800 °C and 5.17 g/cm3 for 1200 °C samples.
The obtained results indicate that these ceramics are compact with a range of 87–90%.
3.2. Magnetic Characterization
Figure 3 displays the usual change in magnetization (M) as a function of temperature for NiCr2O4 crystallites with a size of 78 nm in a field of H = 1 kOe. The M(T) curves’ almost temperature-independent behavior at low temperatures suggests that all nanocrystallites retain their long-range ferromagnetic (FM) ordering. There is a noticeable shift from a paramagnetic (PM) to an FM state, with Curie temperatures (TC) of about 70 K (78 nm) and 80 K (28 nm), at least 5 K higher than the TC of about 65 K for bulk NiCr2O4 [7] The temperature that corresponds to the M(T) curve’s maximum -dx/dT is known as the TC. The ordering of NiCr2O4’s longitudinal ferrimagnetic component is consistent with this magnetic transition temperature [7]. There is a tetragonal I41/amd to orthorhombic Fddd structural distortion associated with this ferrimagnetic ordering. [4] At 30 K, an anomaly in the temperature-dependent magnetization was found (Figure 3) below this transition. Concurrent with greater structural deformation of NiCr2O4 within the orthorhombic Fddd space group, there is a shift in the magnetic structure [4]. The correlation between electric ordering and the underlying magnetic structure is explained. The observed high dielectric constant and dispersive behavior with frequency are attributed to the presence of conducting or semiconducting grains surrounded by insulating grain boundaries. These dielectric observations are attributable to the Maxwell–Wagner relaxation mechanism.
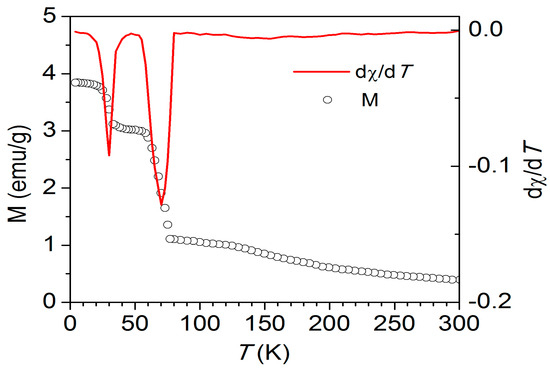
Figure 3.
The typical variation in magnetization (M) as a function of temperature for NiCr2O4 nanocrystallites with a size of 78 nm, measured under a field of 1 kOe. The solid red curve is the dx/dT curve for the 78 nm crystallite size.
3.3. Dielectric Characterization
To provide more insight into the structural transitions, Figure 4 illustrates the typical low-temperature-dependent real permittivity (ε’-T) for NiCr2O4 with a crystallite size of 78 nm at frequencies of f = 0.1 and 1 MHz. According to Figure 4, a broad maximum that is independent of frequency emerges at a temperature of T = 40 K as the temperature rises. Magnetoelectric compounds of the form ACr2O4 have been shown to exhibit this kind of dielectric anomaly around these temperatures [4]. This establishes a correlation between the electric ordering and the underlying magnetic structure.
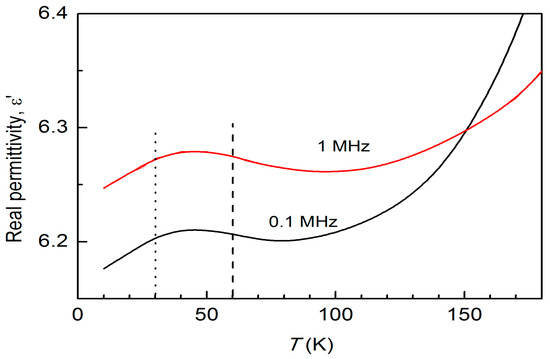
Figure 4.
The typical low-temperature-dependent real permittivity (ε’-T) for NiCr2O4 with a crystallite size of 78 nm at frequencies of f = 0.1 and 1 MHz.
Figure 5 displays the temperature dependency of the dielectric constant at fixed frequencies for both NiCr2O4 crystallite sizes in order to further analyze the dielectric relaxation. The dielectric constant rises with the temperature for a certain range of frequencies. As the temperature increases from 80 to 320 K, it shows a noticeable improvement, with a value of ε’ ~ 5738 for 2 kHz at room temperature for crystallites with a size of 28 nm (Figure 5a). Nevertheless, the outcome is significantly different for 78 nm sized crystallites: the dielectric constant drops to ε’ ~ 174 as the particle size increases (Figure 5b). NiCr2O4, as one type of common magnetic material, is uncommon in having such a high dielectric constant.
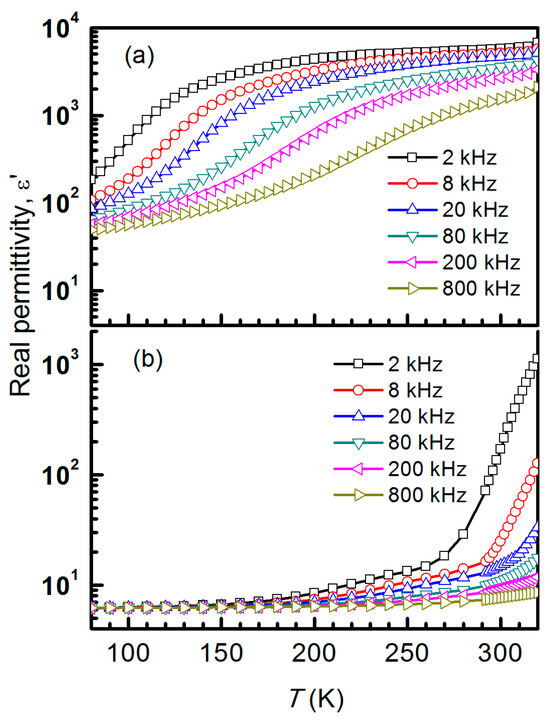
Figure 5.
Temperature-dependent dielectric permittivity measurements of NiCr2O4 collected at different fixed frequencies for both crystallite sizes, (a) 28 nm and (b) 78 nm.
As a result of this high dielectric constant, the high-temperature structural transition remains unknown. These graphs illustrate the dielectric dispersion, where the dielectric constant rises with temperature and falls with frequency. Generally speaking, ε′ rises with temperature, indicating that these microcrystallites are semiconductors. In the low-temperature zone, ε′ and ε” have tiny dielectric dispersions. The dielectric dispersion rises gradually in the high-frequency region and sharply in the low-frequency region as the temperature rises. This can be understood in terms of the charge carriers’ inability to align themselves with the direction of the applied field at very low temperatures, which results in a negligible contribution to the polarization and dielectric behavior. Additionally, dielectric loss (tan δ) display a monotonic decrease with low values below 200 K and loss peaks above 200 K for 78 nm size crystallites, as shown in Figure 6a, whereas dielectric dispersion shifts to a lower temperature below 250 K for the 28 nm crystallite size samples (Figure 6b). Both peaks in the graph shift towards higher temperatures as the frequency increases, indicating a dielectric relaxation process (Figure 6).
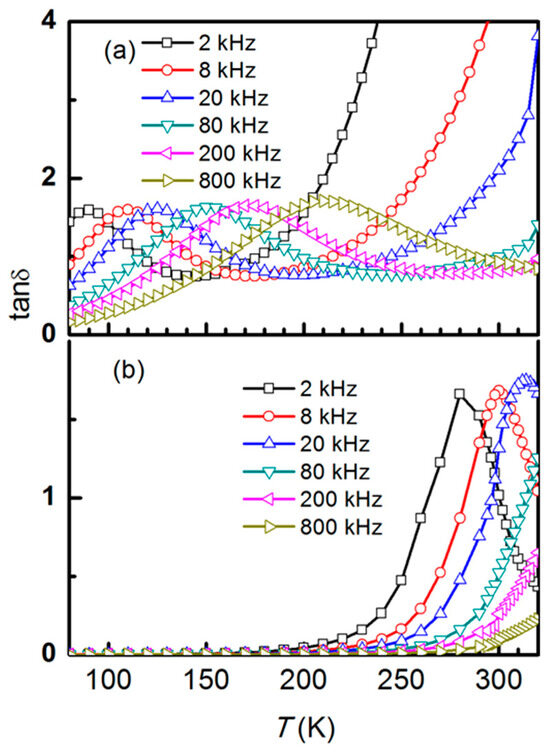
Figure 6.
Temperature-dependent dielectric loss (tan δ) measurements of NiCr2O4 collected at different fixed frequencies for both crystallite sizes, (a) 28 nm and (b) 78 nm.
A temperature-dependent accumulation of charged species at grain borders or dipolar polarizations could be the cause of the current crystallites’ rapid increase in ε′ at low frequencies. Interfacial polarization is another possible explanation. Because of the charge that accumulates at grain boundaries, interfacial polarization may be the cause of the dispersion that occurs in the lower-frequency regime. Space charge polarization, Maxwell–Wagner, long-range structural order, and defect relaxations are possible additional causes of dispersion. The real part of the complex dielectric constant exhibits a shifting of a step-like dispersion to a higher-frequency area, suggesting that the Maxwell–Wagner relaxation mechanism is accountable for the large and dispersive dielectric constant at low frequencies [24,25,27]. Such a material exhibits dielectric behavior due to the presence of a conducting or semiconducting grain divided by a more insulating grain boundary. Because high-frequency permittivity is independent of the observed frequency range and is caused by atomic, electronic, and molecular polarizations, the permittivity dispersion is negligible at higher frequencies. Over the whole frequency range, the increase in ε’ with temperature could be attributable to a thermally activated process such as charge carrier transit.
From Figure 4, the low-temperature-dependent real permittivity (ε’-T) for a NiCr2O4 crystallite size of 78 nm exhibits a broad maximum at 40 K that is independent of frequency. This establishes a correlation between electric ordering and the underlying magnetic structure (Figure 3). The temperature dependency of the dielectric constant behaves differently for the two NiCr2O4 crystallite sizes. The value of ε’ ~ 5738 at room temperature for 28 nm crystallites is very different to the value of ε’ ~ 174 for 78 nm crystallites. The dielectric dispersion rises gradually in the high-frequency region and sharply in the low-frequency region as the temperature rises. This can be understood in terms of the charge carriers’ inability to align themselves with the direction of the applied field.
Figure 7a shows the plots of test frequency (f) against the inverse of the peak temperature (TP), derived from the tanδ curve of both NiCr2O4 nanocrystallites. The Arrhenius relation, f = f0 exp (Ea/kBTP), provides a good fit to the frequency versus 1/TP data, where kB represents the Boltzmann constant, Ea denotes the activation energy, and f0 represents the pre-exponential term. Each and every peak shifts to a higher frequency in response to temperature. The activation energies for the two crystallites were determined to be 0.33 eV (78 nm crystallites) and 0.076 eV (28 nm crystallites). When compared to that for the 78 nm crystallites, the obtained value for the 28 nm crystallites is more conductive.
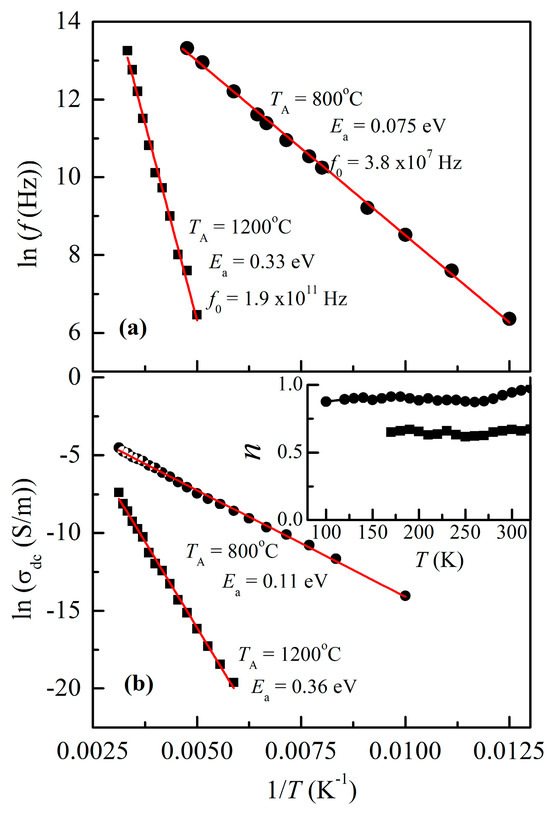
Figure 7.
(a) Arrhenius plots of (a) dielectric loss relaxation frequency and (b) DC conductivity against temperature for both crystallite sizes. In the inset, n is plotted against the temperature.
3.4. AC Conductivity
Frequency-dependent conductivity curves for both the NiCr2O4 nanocrystallites are displayed in Figure 8. The figure clearly shows that the samples that were annealed at 800 °C (28 nm crystallite size) had higher conductivity values (>102 times) than the samples that were annealed at 1200 °C (78 nm crystallite size). At lower frequencies, the AC conductivity is frequency-independent, indicating the DC component of conductivity. The transition of AC conductivity from frequency-independent to frequency-dependent, known as the hopping frequency, is reflected in the change in the slope as the frequency increases. This implies that phenomena of conductivity relaxation have been established [27]. As the temperature rises, the hopping frequencies move upward because higher frequencies allow charge carriers to move more widely.
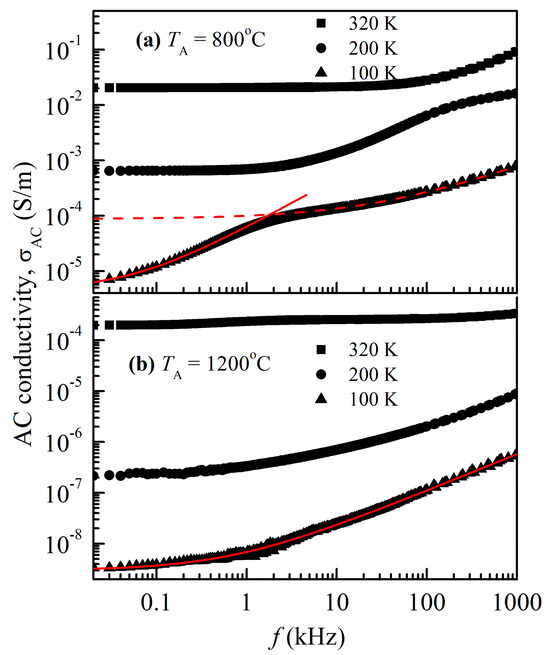
Figure 8.
Frequency-dependent AC conductivity of NiCr2O4 for both crystallite sizes, (a) 28 nm and (b) 78 nm, collected at various fixed temperatures. The dashed and solid red lines are fitted curves.
The solid lines in a conductivity spectrum indicate the fitted results, whereas the symbols in the spectrum indicate the experimental data. Furthermore, it appears that the AC conductivity follows Jonscher’s power law [28], which is represented by the equation σac = σdc + A fn, where n (0 < n < 1) is a temperature- and frequency-dependent exponent, f is the frequency, and A is the material-specific temperature-dependent constant. This information is displayed in the inset of Figure 7b.
Figure 7b shows σdc vs. 1/T for both the NiCr2O4 nanocrystallites. Arrhenius plots are used to determine the activation energy of conduction, as indicated by the solid red line in this figure. The Arrhenius equation can be expressed as follows: σdc = σ0 exp (-Ea/kBT), where kB is Boltzmann’s constant, Ea is the activation energy, and σ0 is a pre-exponential factor.
It was discovered that the activation energies for the conduction of these two crystallites were 0.11 eV (800 °C) and 0.36 eV (1200 °C). The measured dielectric relaxation activation energy Ea(tand) is similar to the DC conduction activation energy (Ea), indicating that the electrical conduction process and dielectric polarization ar the same in these nanocrystallites.
The frequency-dependent conductivity curves for the NiCr2O4 nanocrystallites display different conductivity values. The lower-particle-size crystallites have higher conductivity values than the 78 nm crystallites. At lower frequencies, the AC conductivity is frequency-independent, indicating the DC component of conductivity. The hopping frequency is the term for the change in slope that occurs as frequency rises and represents the transition of AC conductivity from being frequency-independent to being frequency-dependent. As the temperature rises, the hopping frequencies move upward because higher frequencies allow charge carriers to move more widely.
3.5. Electric Modulus
The inverse of the complex permittivity (ε*) is the complex electric modulus (M*):
where the real and imaginary components of the electric modulus are denoted by M′ and M″. The complex electric modulus, which minimizes the electrode polarization effect, can be used to explore the electrical properties of materials. Figure 9 displays the Cole–Cole plot (M″ vs. M′) for both crystallite sizes at various temperatures. While the dispersion in the high-frequency zone correlates with the processes within the grain, the dispersion in the low-frequency zone correlates with the presence of the grain boundary. The conduction method within the grains and the borders between the grains causes the arcs to not resolve well. The grain interior can be responsible for the higher-frequency semi-circle, and the grain border influence for the lower-frequency semi-circle. Further investigation of the Maxwell–Wagner model is suggested by the identification of two semi-circles in the dielectric spectrum [29].
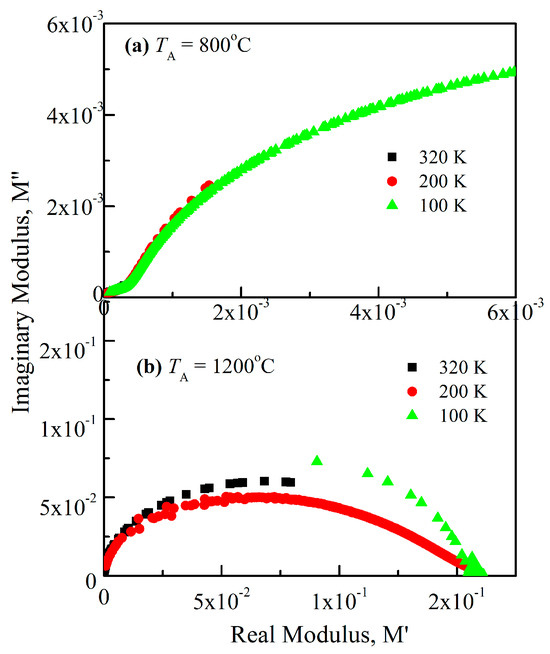
Figure 9.
Cole–Cole plots of complex modulus at 100, 200, and 320 K for both NiCr2O4 crystallite sizes, (a) 28 nm and (b) 78 nm.
4. Conclusions
We looked into how crystallite size affects the structure, dielectric characteristics, and magnetic properties of NiCr2O4 nanocrystallites. The temperature-dependent magnetization M(T) data show that as the crystallite size decreases, there are multiple transitions and a drop in magnetism. The low-temperature-dependent real permittivity (ε’-T) for NiCr2O4 with a crystallite size of 78 nm exhibits a broad maximum at 40 K that is independent of frequency. This establishes a correlation between electric ordering and the underlying magnetic structure. A noticeable improvement was noted for crystallites with a size of 28 nm, with a dielectric constant of ε’ ~ 5738 at room temperature, whereas 78 nm crystallite samples showed a significantly different result, dropping to ε’ ~ 174. The frequency-dependent conductivity curves for the NiCr2O4 nanocrystallites display different conductivity values. Lower-particle-size crystallites have higher conductivity values than the 78 nm crystallites. At lower frequencies, the AC conductivity is frequency-independent, indicating the DC component of conductivity. The measured dielectric relaxation activation energy Ea(tand) is similar to the DC conduction activation energy (Ea), indicating that the electrical conduction process and dielectric polarization are the same in these nanocrystallites. The Cole–Cole plots suggest that the grain interior may be responsible for the higher-frequency semi-circle, and the grain boundary influence for the lower-frequency semi-circle. All these results are attributed to a decrease in crystallite size and an increase in grain boundaries, which leads to a greater number of charge carriers being scattered.
Author Contributions
Conceptualization, N.R.M. and S.B.K.; Formal analysis, R.P.; Funding acquisition, N.A.-Q.; Methodology, N.R.M. and S.B.K.; Software, R.P.; Supervision, S.B.K. and N.A.-Q.; Validation, S.P.R.; Writing—original draft, S.B.K. and R.B.; Writing—review and editing, P.T. and R.B. All authors have read and agreed to the published version of the manuscript.
Funding
This work was supported by Qatar University through a National Capacity Building Program grant (NCBP) [QUCP-CAM-22/24-463]. Statements made herein are solely the responsibility of the authors.
Data Availability Statement
The data that support the findings of this study are available from the Corresponding author upon reasonable request.
Conflicts of Interest
The authors declare no conflicts of interest.
References
- Kim, D.C.; Ihm, S.K. Application of spinel-type cobalt chromite as a novel catalyst for combustion of chlorinated organic pollutants. Environ. Sci. Technol. 2001, 35, 222–226. [Google Scholar] [CrossRef]
- Yamasaki, Y.; Miyasaka, S.; Kaneko, Y.; He, J.P.; Arima, T.; Tokura, Y. Magnetic reversal of the ferroelectric polarization in a multiferroic spinel oxide. Phys. Rev. Lett. 2006, 96, 207204. [Google Scholar] [CrossRef] [PubMed]
- Mufti, N.; Nugroho, A.A.; Blake, G.R.; Palstra, T.T.M. Magnetodielectric coupling in frustrated spin systems: The spinels MCr2O4 (M = Mn, Co and Ni). J. Phys. Condens. Matter. 2010, 22, 075902. [Google Scholar] [CrossRef]
- Suchomel, M.R.; Shoemaker, D.P.; Ribaud, L.; Kemei, M.C.; Seshadri, R. Spin-induced symmetry breaking in orbitally ordered NiCr2O4 and CuCr2O4. Phys. Rev. B 2012, 86, 054406. [Google Scholar] [CrossRef]
- Hu, W.; Qin, N.; Wu, G.; Li, S.; Bao, D. Opportunity of spinel ferrite materials in nonvolatile memory device applications based on their resistive switching performances. J. Am. Chem. Soc. 2012, 134, 14658. [Google Scholar] [CrossRef] [PubMed]
- O’Neill, H.S.C.; Dollase, W.A. Crystal structures and cation distributions in simple spinels from powder XRD structural refinements: MgCr2O4, ZnCr2O4, Fe3O4 and the temperature dependence of the cation distribution in ZnAl2O4. Phys. Chem. Miner. 1994, 20, 541–555. [Google Scholar] [CrossRef]
- Kocsis, V.; Bordács, S.; Varjas, D.; Penc, K.; Abouelsayed, A.; Kuntscher, C.A.; Ohgushi, K.; Tokura, Y.; Kézsmárki, I. Magnetoelasticity in ACr2O4 spinel oxides (A= Mn, Fe, Co, Ni, and Cu). Phys. Rev. B 2013, 87, 064416. [Google Scholar] [CrossRef]
- Sparks, T.D.; Kemei, M.C.; Barton, P.T.; Seshadri, R.; Mun, E.D.; Zapf, V.S. Magnetocapacitance as a sensitive probe of magnetostructural changes in NiCr2O4. Phys. Rev. B 2014, 89, 024405. [Google Scholar] [CrossRef]
- Klemme, S.; van Miltenbur, J.C. Thermodynamic properties of nickel chromite (NiCr2O4) based on adiabatic calorimetry at low temperatures. Phys. Chem. Miner. 2002, 29, 663–667. [Google Scholar] [CrossRef]
- Ishibashi, H.; Yasumi, T. Structural transition of spinel compound NiCr2O4 at ferrimagnetic transition temperature. J. Magn. Magn. Mater. 2007, 310, e610. [Google Scholar] [CrossRef]
- Tomiyasu, K.; Kagomiya, I. Magnetic structure of NiCr2O4 studied by neutron scattering and magnetization measurements. J. Phys. Soc. Japan. 2004, 73, 2539–2542. [Google Scholar] [CrossRef]
- Rathi, A.; Babu, P.D.; Rout, P.K.; Awana, V.P.S.; Tripathi, V.K.; Nagarajan, R.; Sivaiah, B.; Pant, R.P.; Basheed, G.A. Anomalous nano-magnetic effects in non-collinear spinel chromite NiCr2O4. J. Magn. Magn. Mater. 2019, 474, 585–590. [Google Scholar] [CrossRef]
- Bhowmik, R.N.; Ranganathan, R.; Nagarajan, R. Magnetic enhancement in antiferromagnetic nanoparticle of CoRh2O4. Phys. Rev. B 2004, 69, 054430. [Google Scholar] [CrossRef]
- Pandey, G.C.; Nemkovski, K.; Su, Y.; Rath, C. Evidence of anomalous conventional and spontaneous exchange bias, high coercivity in Fe doped NiCr2O4 spinel. Dalton Trans. 2020, 49, 4502–4517. [Google Scholar] [CrossRef]
- Orlandi, M.O.; Ramirez, M.A.; Foschini, C.R.; Felix, A.A.; Varela, J.A. Giant dielectric constant materials and their applications. In Sol-Gel Processing for Conventional and Alternative Energy. Advances in Sol-Gel Derived Materials and Technologies; Aparicio, M., Jitianu, A., Klein, L., Eds.; Springer: Boston, MA, USA, 2012; pp. 123–146. [Google Scholar] [CrossRef]
- Sadashivappa, P.K.; Venkatachalam, R.; Pothu, R.; Boddula, R.; Banerjee, P.; Naik, R.; Radwan, A.B.; Al-Qahtani, N. Progressive review of functional nanomaterials-based polymer nanocomposites for efficient EMI shielding. J. Compos. Sci. 2023, 7, 77. [Google Scholar] [CrossRef]
- Banerjee, P.; Franco, A., Jr. Rare earth and transition metal doped BiFeO3 ceramics: Structural, magnetic and dielectric characterization. J. Mater. Sci. Mater. Electron. 2016, 27, 6053–6059. [Google Scholar] [CrossRef]
- Aruna, S.T.; Mukasyan, A.S. Combustion Synthesis and Nanomaterials. Curr. Opin. Solid State Mater. Sci. 2008, 12, 44–50. [Google Scholar] [CrossRef]
- Hussein, S.S.; Al-Shakarchi, E.K. Sol gel auto combustion method to prepare nanostructures LiZnCu ferrite. Ceram. Int. 2024, 50, 17913. [Google Scholar] [CrossRef]
- Gyulasaryan, H.; Kuzanyan, A.; Manukyan, A.; Mukasyan, A.S. Combustion synthesis of magnetic nanomaterials for biomedical applications. Nanomaterials 2023, 13, 1902. [Google Scholar] [CrossRef] [PubMed]
- Banerjee, P.; Franco, A. Role of higher valent substituent on the dielectric and optical properties of Sr0.8Bi2.2Nb2O9 ceramics. Mater. Chem. Phys. 2019, 225, 213–218. [Google Scholar] [CrossRef]
- Bokov, D.; Jalil, A.T.; Chupradit, S.; Suksatan, W.; Ansari, M.J.; Shewael, I.H.; Gabdrakhman, V.H.; Kainfar, E. Nanomaterial by sol-gel method: Synthesis and Application. Adv. Mat. Sci. Eng. 2021, 2021, 21. [Google Scholar] [CrossRef]
- Bitra, H.C.R.; Rao, A.V.; Babu, K.S.; Rao, G.N. Synthesis and enhanced dielectric properties of copper oxide nanoparticles. Mater. Chem. Phys. 2020, 254, 123379. [Google Scholar] [CrossRef]
- Ahmad, M.P.; Rao, A.V.; Babu, K.S.; Rao, G.N. Effect of carbon doping on structural and dielectric properties of zinc oxide. J. Adv. Dielectr. 2020, 10, 2050017. [Google Scholar] [CrossRef]
- Shanker, J.; Rao, G.N.; Venkataramana, K.; Babu, D.S. Investigation of structural and electrical properties of NdFeO3 perovskite nanocrystalline. Phys. Lett. A 2018, 382, 2974–2977. [Google Scholar] [CrossRef]
- Ptak, M.; Maczka, M.; Hermanowicz, K.; Pikul, A.; Hanuza, J. Particle size effects on the magnetic and phonon properties of multiferroic CoCr2O4. J. Sol. Stat. Chem. 2013, 199, 295–304. [Google Scholar] [CrossRef]
- Ali, A.A.; Shaaban, M.H. Electrical properties of LiBBaTe glass doped with Nd2O3. Solid State Sci. 2010, 12, 2148–2154. [Google Scholar] [CrossRef]
- Jonscher, A.K. On the origin of the universal dielectric response in condensed matter. Nature 1977, 267, 673–679. [Google Scholar] [CrossRef]
- Abdullah, M.H.; Yusoff, A.N. Complex impedance and dielectric properties of an MgZn ferrite. J. Alloy. Comp. 1996, 233, 129–135. [Google Scholar] [CrossRef]
Disclaimer/Publisher’s Note: The statements, opinions and data contained in all publications are solely those of the individual author(s) and contributor(s) and not of MDPI and/or the editor(s). MDPI and/or the editor(s) disclaim responsibility for any injury to people or property resulting from any ideas, methods, instructions or products referred to in the content. |
© 2024 by the authors. Licensee MDPI, Basel, Switzerland. This article is an open access article distributed under the terms and conditions of the Creative Commons Attribution (CC BY) license (https://creativecommons.org/licenses/by/4.0/).