Abstract
This study presents the numerical simulation, optimization, preparation, and characterization of Cu(In, Ga)Se2 (CIGS) thin-film solar cells (TFSCs). Different cell parameters were investigated, including Ga/(Ga+In) (GGI) ratios, the thicknesses of CIGS absorption layers, the fill factor (FF), the open-circuit voltage (Voc), and the short-circuit current (Isc). The effects of the simulated parameters on the power conversion efficiency (η) of each prototype CIGS cells were investigated. The optimal GGI ratio was approximately 0.6. Using COMSOL Multiphysics software, a CIGS layer thickness of 2 μm and an η of 17% was calculated, assuming constant operating temperatures. Moreover, prototype CIGS solar cells with various compositions were prepared via a simple and cost-effective method based on sol–gel, sonication, and spin-coating techniques. The microstructures and electrical and optical properties of the CIGS-based solar cells were evaluated using current–voltage (I-V) characteristics, scanning electron microscopy (SEM), X-ray diffraction, atomic force microscopy (AFM), and UV-vis spectroscopy. The elemental compositions of the solar cell layers were evaluated via energy-dispersive X-ray fluorescence (EDXRF). The obtained results were compared with the experimental results. For example, in a prototype cell with a CIGS absorption layer thickness of 2 μm and a GGI ratio of 0.6, the experimental value of η was about 15%. Our results revealed that the agreement between the simulation results and the experimental findings for most of the simulated parameters is quite good. These findings indicate that a non-destructive analysis based on EDXRF is a versatile tool for evaluating CIGS solar cells in a very short time with excellent repeatability for both layer composition and thickness.
1. Introduction
The microstructure and electrical and optical properties of solar cells have been extensively investigated, simulated, and optimized in order to prepare solar cells with fairly high efficiencies. Among the materials used to manufacture absorbers for thin-film solar cells (TFSCs), copper indium gallium selenide, Cu(In, Ga)Se2 (CIGS), is known as one of the most promising candidates. It exhibits high levels of performance due to its chemical stability, high absorption, non-toxicity, carrier concentration, and good transport properties. CIGS thin films have been extensively studied over the past five decades. Therefore, recent findings in solar cell efficiency research have led to the conclusion that the further development of CIGS solar cell technology is still possible. In this regard, many research teams worldwide are still closely examining various types of preparation techniques in CIGS thin-film technology [1,2,3,4]. It has been established that the power conversion efficiencies (PCE) of CIGS-based solar cells are more than 11% at the module scale and 20% at the lab scale. Limitations in this regard may be due to the abundance of indium (In), gallium (Ga), and tellurium (Te), as well as the environmental issues associated with the toxicity of its elemental components such as cadmium (Cd) and selenium (Se). Most recently, it was reported that InxGa1−xN-based solar cells have significantly low levels of photovoltaic efficiency. However, their superior resistance to irradiation damage makes them suitable for applications in optoelectronic devices [5]. To improve the performance of these solar cells, it is necessary to search for nontoxic and elementally abundant light-absorbing materials. Moreover, solar cells based on quaternary compounds, such as Cu2ZnSnS4 (CZTS) and Cu2ZnSnSe4 (CZTSe), are considered to be some of the most promising “next generation” photovoltaic materials due to their near-optimum direct bandgap energy of 1.4∼1.6 eV, large absorption coefficient (>104 cm−1), non-toxic Zn and Sn, and theoretical power conversion efficiency limit of 32.2%. Thus, in aiming to develop solar cells that are free from environmental contaminants, CZTS is viewed as a potential candidate as an absorber for the next generation of thin-film solar cells [6].
In recent years, among third-generation solar cells, perovskite solar cells are considered the most promising. They exhibit a drastic jump in the PCE from 3.5% to 25.8%. CIGS solar cells have a significant absorption coefficient and require a thickness of only a few microns to absorb incident light sufficiently at a minimum cost. For example, CIGS has a relatively high absorption coefficient (~105 cm−1 at 1.4 eV and higher), which can allow the thickness (ranging from 0.5 μm to 2.0 μm) of the CIGS absorber layer to absorb more than 90% of the total incident solar spectrum [7].
Based on its high degree of photo-absorption and Ga-content-based bandgap variation, CIGS provides a high-performance absorber layer for TFSCs. In order to enhance the potential applications of these cells on the industrial scale, cells with larger sizes and better throughput have been produced to reduce cell-to-module losses. Additionally, the thickness of a cell has been considered a key parameter in reducing material consumption to develop cost-effective devices. For example, for CIGS cells, the thickness of the absorber layer should be reduced from a few micrometers to less than one [8,9]. However, reducing the thickness of the absorber layer results in less light absorption, more charge carrier recombination at the back contact, and shunting problems [10,11,12,13].
Many studies (theoretical and experimental) have been conducted to obtain CIGS solar cells with relatively high efficiencies. Structurally modifying crystalline and electronic structures to tune their functionalities is considered an effective route for enhancing solar cell performance [14,15,16]. Nevertheless, optimizing the material parameters and ratios of CIGS cells is still a challenging task that can only be achieved via intensive systematical and independent studies using various approaches.
Moreover, detailed experiments have been performed on evaluating the thickness and elemental composition of TFSCs via EDXRF spectroscopy, which is a versatile, non-destructive, non-vacuum, and fairly simple technique [17]. Recently, CIGS solar cells were prepared using various deposition techniques, as reported by many researchers [1,18,19,20].
Among TFSCs, CIGS absorbers have received a significant amount of research interest due to their direct bandgap, high absorption coefficient, and relatively high solar cell efficiency. The CIGS layer is composed of chalcopyrite compounds from the group(I-III-VI)with a bandgap energy between 1.04 and 1.68 eV [21]. The CIGS layer can be deposited via vacuum and non-vacuum methods [22,23,24,25].
In this work, COMSOL simulation and modeling were used to investigate the optimum GGI ratio of 0.6 based on the simulation results of CIGS solar cells. Additionally, an optimized thickness of 2 μm was chosen from three different CIGS film thicknesses (0.5 μm, 1 μm, and 2 μm). A simulation and an experimental study were also conducted to show the impacts of the thickness and (Ga/Ga+In) GGI ratio of absorbent layers on the photovoltaic cell parameters of CIGS solar cells. Furthermore, the microstructures and elemental compositions of CIGS solar cells at all stages of the fabrication process were validated using the non-destructive EDXRF testing technique. The results were compared using various characterization techniques (such as SEM, AFM, and XRD), and the cells’ performance parameters were examined using the I-V characteristics.
2. Simulation and Modeling:
2.1. Design Parameters, Structure, and COMSOL Simulation of a Typical CGIS Solar Cell Structure
Presented below in Figure 1 is a flow chart showcasing the major simulation stages, which are as follows: the creation of cell design schematics and the setting of parameters, mesh generation, the numerical simulation analysis of the carrier transport, and the optical generation of a distribution map of the CIGS thin-film solar cells (made using COMSOL multiphysics software, version 5.5.0.359). The optical generation rate across the cell structure, electric field profile, recombination rate, and their impact on device performance were also simulated for this paper. To the best of our knowledge, for the first time, a 3D analysis that involved solving the corresponding equations related to optical–electrical coupling profiles for CIGS solar cells was introduced. Moreover, various cell structures with different absorption layer thicknesses and GGI ratios were investigated and compared. The optimum parameters were calculated, and their effect on the CIGS cell performance was discussed.
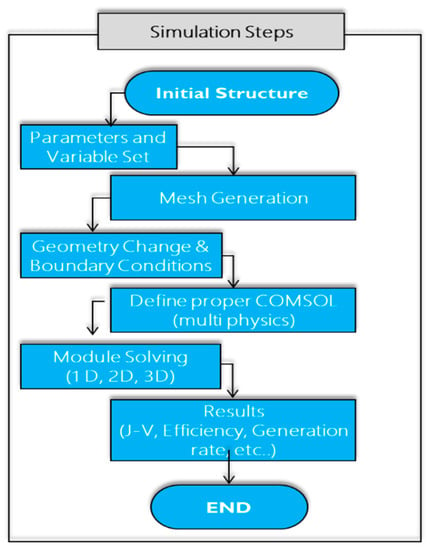
Figure 1.
Flow chart representing the major simulation steps of evaluating CIGS performance.
2.2. Simulated CIGS Solar Cells Layers’ Description
Figure 2 represents a schematic diagram of the prototype CIGS solar cell structure.
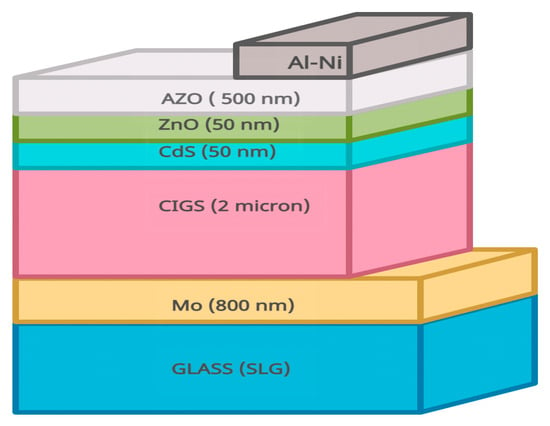
Figure 2.
Schematic of the typical CGIS solar cell structure.
The CGIS thin film used is a p-type semiconductor material that serves as an excellent light absorber. In order to use CIGS for solar cells, it needs to be combined with other materials to fabricate a p-n junction for contacting and passivation. On the top of a substrate, a back contact is deposited. Molybdenum (Mo) is used as the back contact in the majority of the CIGS solar cells. The CIGS absorber layer is deposited on the back contact using co-evaporation, chemical deposition, spin-coating, and sputtering. CdS is the most widely used as a buffer layer to facilitate the formation a good p-n junction. Furthermore, a transparent conducting window layer composed of undoped ZnO is deposited on top of the buffer layer. Finally, an aluminum (Al)-doped ZnO (AZO) layer, prepared via a solvothermal method, is spin-coated on the undoped ZnO layer. The doping of ZnO with Al offers several advantages, such as high transparency, excellent conductivity, non-toxicity, and high mechanical/chemical stability. The AZO layer with high conductivity will be used as the front contact for a CIGS solar cell module.
2.3. Multiphysics Simulation (Main Modeling Equations)
COMSOL Multiphysics Modules
The following modules were considered in the simulation:
- (1)
- Electrical-coupled Poisson and current continuity equations added through a semiconductor module [26]:where ϵr is the relative permittivity, ϵ0 is the vacuum permittivity, is the charge density, and is the electric potential.
- (2)
- The optical module in which the photogeneration rate Gtot (obtained from the optical module) is inserted into the semiconductor module as the generation rate.
The following photogeneration equation will be used to solve photo generation rate at each wavelength (λ):
where ε″ and E are the imaginary part of the dielectric and the electric field distribution, respectively, and ℏ is reduced Planck constant. The photogeneration rate Gphoto is the photogeneration for every wavelength under 100 mW/cm2 sun irradiation. The photogeneration rates were assumed to be equal for both holes and electrons (i.e., Gn = Gp = Gtot). A summary of the main parameters used in the simulation process is shown in Table 1.

Table 1.
Main parameters for various layers used in the simulation process [27].
2.4. Meshing the CIGS Solar Cell
There are many meshing options, settings, tools, and generators that can be used to create an optimal mesh for cell geometry and analysis. For this work, a physics-controlled mesh was chosen for the model cell. The mesh size used was fine enough to have no influence on the derived parameters. A finer mesh was considered for the p-n junction and at the interface of the metallic contacts.
3. Materials and Methods
3.1. Materials
Copper (II) nitrate trihydrate (Sigma-Aldrich, Burlington, MA, USA, p.a. 99–104%) indium nitrate hydrate (Sigma-Aldrich, 99.9%), gallium nitrate hydrate (Sigma-Aldrich, 99.9%), NaBH4/C2H5OH, Se powder, Zinc nitrate hexahydrate, HMT, CdCl2, NH4Cl, SC (NH2)2, Zinc acetate dihydrate (Zn(CH3COO)2·2H2O), Aluminum nitrate nonahydrate (Al(NO3)3·9H2O), monoethanolamine (MEA).
3.2. Fabrication of the CIGS-Based Solar Cells
The fabrication of the CIGS-based thin-film solar cells includes the following main steps (all steps were conducted in a controlled environment under a nitrogen atmosphere using a glove box):
Se powder was dissolved in two beakers containing a NaBH4/C2H5OH solution to form a Se precursor solution. Then, the two colloidal solutions of gallium nitrate hydrate and indium nitrate hydrate were mixed, followed by the addition of copper (II) nitrate trihydrate. The resulting colloidal solution was sonicated for 2 h at room temperature. The black precipitate of the Cu-In-Ga-Se was dissolved in 1 mL of methanol and toluene. Then, the mixture was centrifuged at 300 rpm for 10 min and dried at 70 °C for 5 h in a drying oven.
The absorber layer of the solar cell was prepared using the spin coating method. The advantage of this cost-effective method is its ability to quickly and easily produce uniform films that range from a few nanometers to a few microns in thickness. The coating procedure includes deposition, spin-up, spin-off, and evaporation. The substrate is coated by depositing a solution that is rotated at high speeds using centrifugal force. The volatile solvent easily evaporates, meaning that the thickness of the desired film depends on the concentration of the solution, the solvent, and the spin speeds.
Furthermore, the formed ink-like Cu–In–Ga-Se suspension was rinsed with distilled water and ethanol and spin-coated several times at 4000 rpm for 30 s onto a clean molybdenum (Mo)-coated soda lime glass (SLG) substrate to produce a thin film. The resulting film was dried at 150 °C for 30 min and annealed at 350 °C for 2 h. A very thin CdS buffer layer was deposited on the CIGS film via chemical bath deposition (CBD). To form an insulating layer (i-ZnO), the prepared ZnO NPs were deposited by spin coating on top of the CdS buffer layer to form the (SLG/Mo/GIGS/CdS/i-ZnO) structure. To test the efficiency of the assembled solar cells, an Al-doped ZnO (AZO) oxide layer was deployed on the top of the cell using spin coating. Finally, a grid pattern (Al/Ni) was designed by a mask aligner and coated as the top layer of the cell. The dimensions of the prototype solar cells were measured to be 100 × 100 mm2. A schematic diagram illustrating the major cell fabrication steps is illustrated in Figure 3.
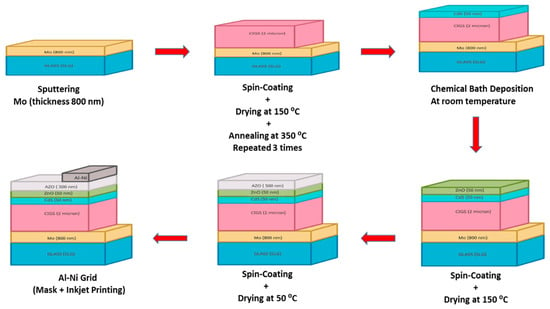
Figure 3.
A schematic diagram of the major steps of the CIGS solar cell fabrication processes.
4. Results and Discussions
4.1. Simulated Prototype CIGS Cell (Structure, Electric Field, Electric Potential, Hole and Electron Concentration)
The CIGS thin-film solar cell was modeled using COMSOL Multiphysics. Figure 4a shows the cell structure. Coupled optical and electrical simulations were conducted to assess the photo absorption, carrier photo generation, carrier collection, and efficiency calculations of this prototype cell. For this purpose, two multi-physics modules were coupled: the electromagnetic waves (frequency domain) and the semiconductor modules.
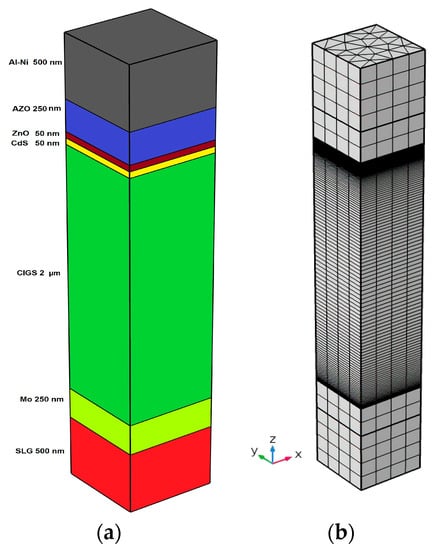
Figure 4.
(a) Schematic of the geometry for the simulated CIGS solar cell in 3D; (b) meshed structure.
The electromagnetic waves and semiconductor modules were coupled in the simulations. These modules were used to calculate the total photo generation (Gtot) in order to solve the current continuity. The proposed dimensions of the cell were 250 nm × 250 nm × 3600 nm, and it was assumed that the cell is operating at room temperature with no thermal fluctuations. The cell layer properties were obtained from the COMSOL Multiphysics libraries and other available literature databases (summarized in Table 1 and Table 2).
The quality of the mesh can be interpreted based on different parameters, such as skewness, angle, and volume. In this work, the skewness quality metric was taken into account, and its values ranged between 0 and 1.
Figure 5a,b illustrates the simulation results for the distribution of the electric field and the electric potential through the cell at a VOC voltage of 0.6 V. As can be seen in the figure, the electric field distribution gradually varies from a less intensive density at the bottom to a higher intensity at the top layer.
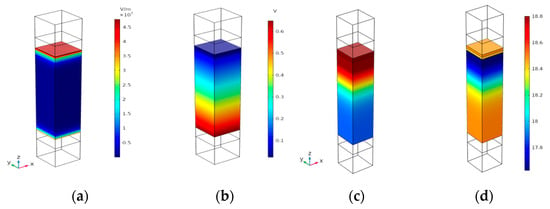
Figure 5.
(a) Electric Field distribution across the device structure; (b) electric potential distribution across the device at 0.6 V; (c) electron concentration; (d) hole concentration across the cell structure. The density bar is a Log scale.
The electron and hole concentrations across the cell structure are represented in Figure 5c,d. As expected, the calculated electron concentration (Figure 5c) is highest through the Mo-coated conducting layer and lowest at the top layer. On the contrary, the hole profile exhibits a higher concentration in the top layer (Figure 5d) and a lower concentration in the Mo-coated layer.
4.2. Simulated I-V and P-V Characteristics for Prototype CIGS Solar Cell
Figure 6 shows simulated and typical I-V and P-V curves while indicating solar cell output parameters. The short-circuit current, Isc, is the maximum current at zero voltage. Open-circuit voltage, Voc, is the maximum voltage at zero current. The fill factor (FF) is defined as FF = VMPIMP/VocIsc = (PMP/VocIsc), where PMP is the maximum power output at the optimal operating condition and is defined as PMP = VMPIMP. However, the energy-converging efficiency η is given by η = PMP/Pin = (Voc, Isc, FF)/Pin, where Pin represents the power of the incident light. The I-V measurement is conducted at an irradiance of 100 mW/cm2 and a temperature of 25 °C and by using the standard global AM 1.5 spectrum.
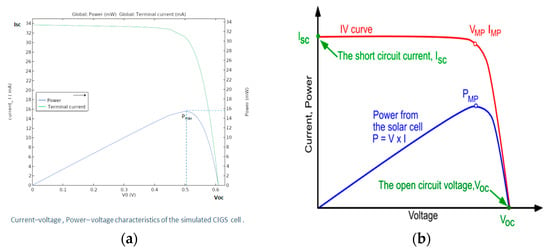
Figure 6.
(a) Simulated current–voltage and power–voltage characteristics of the simulated CIGS cell; (b) typical I-V and P-V characteristics for a solar cell. The main output parameters are also indicated.
The external quantum efficiency (EQE) is defined as the number of electron–hole pairs generated per incident photon in the solar cell when tested with an external circuit. The short-circuit current density can be calculated from the EQE measurement as , where Φ is the photon flux at the AM 1.5 spectrum.
A comparison of the J-V characteristic and external quantum efficiency (QE) curves of solar cells with absorber layers of various thicknesses is shown in Figure 7. Cell parameters Voc, Isc, FF, and η were measured and compared to the simulated parameters (Figure 7a). This was carried out for prototype cells with varying thicknesses. Cells with a CIGS absorption layer thickness of 2 μm and a GGI ratio of 0.6 exhibit the highest JSC value (31.69 mA/cm2). Moreover, it was found that the performance of the CIGS solar cells is thickness-dependent and has a considerable change in both η and EQE. The enhancement in current density J is attributed to the increase in the absorption of photons in the wavelength region above 600 nm, as evidenced by the EQE curve in Figure 7b. A reasonable explanation for the increase in photon absorption is the lower values of the energy gap Eg of 1.18 eV in the CIGS absorber layer of thickness of 2µm in comparison to the cell with a uniform absorber energy gap of 1.12 eV and a thickness of 0.5 µm. These observations are in quite good agreement with the fact that the thickness of the absorber layer is considered a crucial parameter for the bandgap grading of the absorber layer.
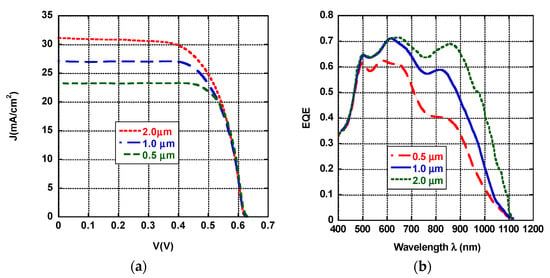
Figure 7.
Simulated J-V characteristics (a) and external quantum efficiency (EQE) spectra (b) of the CIGS solar cells with thicknesses of 0.5, 1.0, and 2.0 µm and a GGI ratio of 0.6.
Figure 7b shows the EQE curves of CIGS solar cells with typical absorber thicknesses of 2.0 µm), 1.0 µm, and 0.5 µm. The EQE measurement area was a spot with a surface area of 100 mm2.
It can be seen that, while the bandgaps of all absorber layers are almost identical in the wavelength region from 400 to 475 nm, the cell with a 0.5 µm absorber have considerable losses compared to the 2.0 µm cell. Figure 7b also revealed a shift in the EQE in the wavelength ranges from 475 to 1100 nm. However, no considerable shift was observed in the low wavelength range between 400 and 540 nm, which may be related to the presence of the CdS buffer layer and indicate that the simulation parameters of the CdS buffer layer play a crucial role in optimizing the cell parameters. Moreover, the clear change in the optoelectronic properties between 540 and 1100 nm should be related to the characteristics of the CIGS absorption layer. The maximum EQE of the CIGS solar cells (CIGS-0.5, CIGS-1.0, and CIGS-2.0) at GGI ratios of 0.6 were about 62%, 70%, and 72%, respectively. The CIGS-2.0 has the highest EQE (about 72%), indicating reasonably good carrier generation and collection in the p-n junction. However, it is worth noting that the EQE simulated spectra also display other peaks with high EQE for the CIGS-2.0 cell in the 700–1100 nm wavelength region, suggesting its superior charge carrier separation ability compared to solar cells with smaller GIGS layer thicknesses. This reveals that the EQE is dependent on the optical bandgap of the absorber layer in the long-wavelength region.
Table 2 below displays the performance parameters of all the cells investigated in the simulation. The optimal thickness values, Jsc, Voc, FF (%), Eg, and ɳ (with an optimal GGI ratio of 0.6) of the CIGS layers were determined through solar cell simulation, which, in turn, provides the highest performance. Our simulation results are shown in Table 2.

Table 2.
Calculated parameters for the CIGS-based solar cells.
Table 2.
Calculated parameters for the CIGS-based solar cells.
| Sample | Thick (μm) | JSC (mA/cm2) | VOC (mV) | FF (%) | η (%) | Eg (eV) |
|---|---|---|---|---|---|---|
| CIGS-0.5 | 0.5 | 23.28 | 0.63 | 77.50 | 15.0 | 1.12 |
| CIGS-1.0 | 1.0 | 27.11 | 0.62 | 78.43 | 17.0 | 1.13 |
| CIGS-2.0 | 2.0 | 31.69 | 0.61 | 79.46 | 17.4 | 1.18 |
Based on the simulated parameters listed in Table 2 and Table 3 and plotted in Figure 8, we predicted the optimal main cell parameters of the CIGS solar cells. The obtained results show that our optimization allowed us to obtain an efficiency of 17.4% (for cells with a thickness of 2.0 µm), a 2.4% improvement compared to the reference one with a thickness of 0.5 µm. In this regard, the first lab performance tests conducted with this prototype cell showed reasonable level of agreement with the simulations. However, it should be noted that the tested cells did not match exactly with the simulated efficiencies. More details about the experimental tests will be provided in the next section.
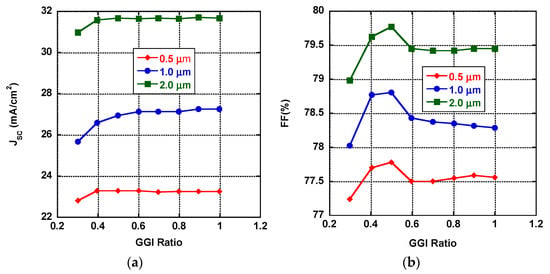
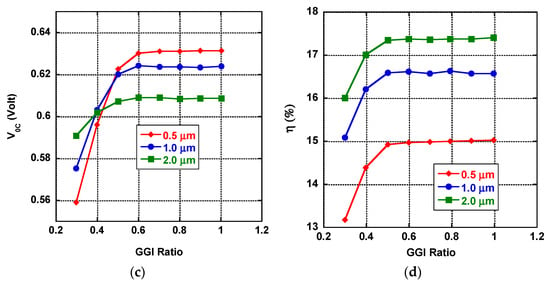
Figure 8.
Simulated CIGS solar cell performance parameters—(a) Jsc, (b) FF (%), (c) Voc, and (d) ɳ (%)—versus GGI ratios for cells with different CIGS layer thicknesses.
4.3. Optical Properties of the CIGS Absorption Layer
The optical bandgap (Eg) is calculated from the UV-vis absorption spectrum for the cells of various thicknesses in the CIGS absorption layers. In order to calculate the optical bandgap energy (Eg) of each, the following equation can be used: αhυ = Aα(hυ − Eg)1/2. Here, Aα is a constant that depends on the transition nature, the effective mass, and the reflective index, while hυ is the incident photon energy. The Eg is determined by extrapolating the slope of the (αhν)2 versus the photon energy curve, as shown in Figure 9a. The bandgaps for the best sample, CIGS-2.0 (with a thickness of 2 µm), were calculated and found to be about 1.18 eV. It is believed that the bandgap energies of the CIGS absorption layers increase with an increase in layer thickness and GGI ratio. Our experimental results revealed that the variation in bandgap energies can be attributed to the variation in GGI ratios. In this study, the optimum GGI ratio obtained from the simulation was 0.6, which was used for all tested cells.
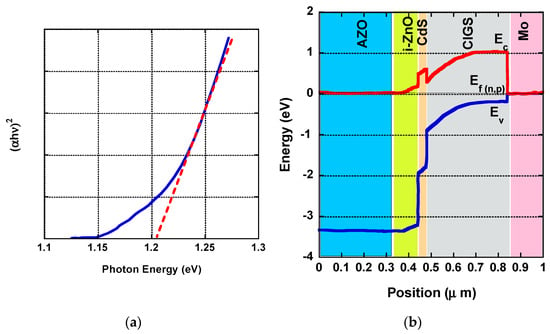
Figure 9.
(a) Optical bandgap; (b)typical energy band diagram of CIGS-2.0 absorption layers.
The typical structure and a typical energy band diagram of a CIGS solar cell are shown in Figure 9b. In our case, the bandgap was studied only for one value of the GGI ratio, 0.6, which corresponds to an energy gap of about 1.18 eV. However, for a better understanding of the gap grading behavior, one should take into account the consequences of an additional electric field originating from bandgap grading. For example, a numerical investigation was carried out by Belghachi et al. [8] on the variation in the absorber bandgap of a CIGS solar cell using a one-dimensional simulator called SCAPS. From their simulation results, it was found that the efficiency can be considerably enhanced if the absorber bandgap is around 1.48 eV, which perfectly matches the solar spectrum and yields an efficiency of about 22.95%. Moreover, they reported a simulation of the linear variation in Ga content with the absorber thickness for both front and back contact. In our results, we did not consider the effect of bandgap grading and thermal fluctuations in the simulation of the absorber layer. Our calculations are based on the optimal GGI ratio only and are not based on the optimal ban gap calculations, even though we believe that these parameters have a non-negligible effect on cell efficiency. Additionally, the highly resistive i-ZnO film also plays an important role in achieving high-efficiency CIGS solar cells while working as a shield to protect the CdS/CIGS junction from damage during the spin-coating process of the highly conductive AZO layer. Moreover, the optimal i-ZnO thickness plays a vital role in determining the open-circuit voltage (Voc) and fill factor (FF) as it directly affects the reduction in the shunt paths. Furthermore, an i-ZnO layer facilitates the passage of the electron generated from the CIGS absorber layer to the Mo-coated front contact.
4.4. Microstructure of CIGS Solar Cell Structure
4.4.1. X-Ray-Diffraction (XRD)
The crystal structure of the CIGS layer was characterized via X-ray diffraction (XRD) using a powder diffractometer. The wavelength of the incident radiation was λ = 1.5406 Å (Cu Kα).
Figure 10 depicts the representative X-ray diffraction pattern of the CIGS thin film coated on the Mo substrate. Based on the simulation results, the GGI ratio of the CIGS absorption layer was 0.6, with a thickness of 2 μm. All of the CIGS films have chalcopyrite phases with the following major diffraction peaks: (112), (220)/(204), and (312)/(116). The sharp diffraction peak (112) at 2θ = 26.95° is the strongest. This shows that the CIGS films are polycrystalline and oriented along the (112) direction, which is parallel to the substrate. The major sharp peak can be observed, which corresponds to the diffraction of the (112) plane of the chalcopyrite structure CIGS (JCPDS NO.: 35-1102). The other diffraction angles located at 44.8° and 53.3° correspond to the (220)/(204) plane and the (312)/(116) plane, respectively. The intensities of these two peaks are relatively low compared to the (112) plane, indicating the preferential orientation of the (112) plane. However, these orientations enable the formation of higher-quality p-n junctions due to the higher diffusivity of the Cd atoms in the (220)/(204)-oriented layers. The grain size was calculated using the Debye–Scherrer equation based on the full width at half maximum (FWHM) obtained from the highest intensity peak (112), and it was found to be about 65 nm. The XRD patterns do not show any complex peaks, indicating that the single-stage annealing process may result in acceptable chalcopyrite structures in CIGS thin films. In addition, a sharp peak (110) and a small peak (100) were observed for the Mo layer and the MoSe2 phase, respectively. This indicates that there are no secondary or impurity phases with different lattice parameters in the CIGS films, and this was subsequently further confirmed by EDXRF measurements.
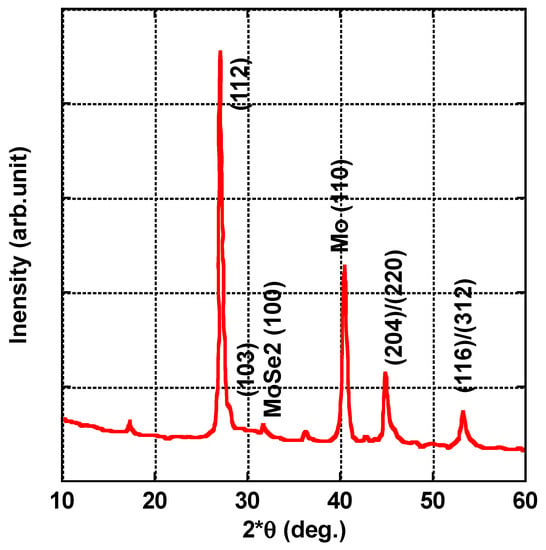
Figure 10.
XRD pattern of the CIGS layer on the Mo substrate XRD pattern of the CIGS film from the precursor with a Ga/(In+Ga) ratio of 0.6 deposited on a Mo-coated SLG substrate. Mo and MoSe2 peaks were also indexed.
4.4.2. Scanning Electron Microscopy (SEM)
Figure 11 shows the microstructure of the prototype CIGS-2.0 sample with a GGI ratio of 0.6.
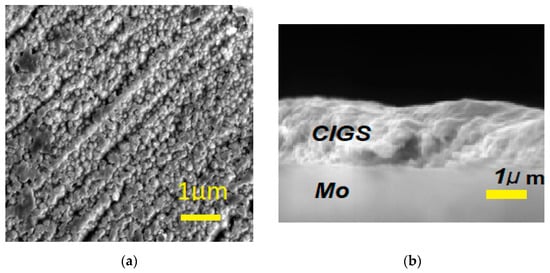
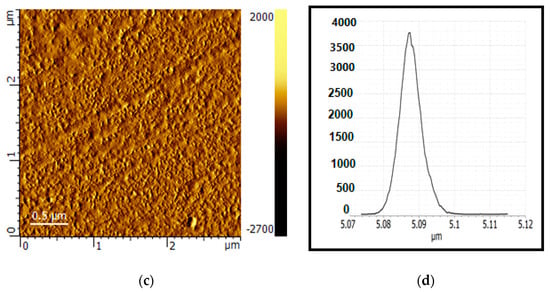
Figure 11.
(a) SEM image showing the microstructure of the top surface of the cell; (b) cross-sectional SEM image of a CIGS solar cell; (c) 2D AFM image on top of the surface; (d) the roughness curve of the top (Ni-Al) contact.
The thickness of the whole cell is about 4 μm (Figure 11a), while the thickness of the CIGS absorption layer is about 2 μm (Figure 11b). The top surface of the cell is the AZO layer showing the grain homogeneous distribution through the whole surface. The trenches of the deposited (Ni-Al) grids can be easily seen on top of the AZO layer (Figure 11a).
4.4.3. Atomic Force Microscopy (AFM)
As can be seen from the SEM images (Figure 11a,b), randomly oriented semi-spherical particles were observed with a tendency for texturing in various places in the surface of the top layer. This texturing will help increase light absorption and thus minimize light reflection, which is a critical parameter for cell power conversion efficiency. A cross-sectional image of the cell without the top contact is shown in Figure 11b. AFM images and the surface roughness curve of the prototype CIGS-2.0 sample structures are shown in Figure 3c,d. The CIGS granular structures consist of spherical or semi-spherical-shaped grains. The roughness curve shown was taken across the Ni-Al top contact, which has a roughness of about 5 μm. The grains on the top AZO surface have a homogenous and well-distributed morphology and an estimated root mean square roughness (RMS) of about 100 nm, while the estimated values of the average particle size were about 54 nm. The results obtained via SEM that pertain to the average grain size, texturing, and roughness are in good agreement with those estimated from XRD and AFM tests.
4.4.4. EDXRF Spectrum of a Complete CIGS Solar Cell Structure
To evaluate the elemental composition and thickness of the tested prototype solar cells, three different thicknesses of the CIGS absorber layer were used for this study. The exact thicknesses may vary from the targeted simulated values of 2 µm, 1.1 µm, and 0.6 nm, which were measured using EDXRF.
The EDXRF parameters are tabulated in Table 3. Since the glass substrate does not contain any elements that enhance the effects on the CIGS elements and Mo, its effect can be discarded. The stack to model essentially consists of a Mo layer with a normalized major Mo-ka1 peak with 100% intensity, as well as other indexed (In, Ga, Cu, and Se) ka1 peaks with varying relative intensities (see Figure 12). The repeatability of the instrument/method was tested by analyzing all cells three times. At a relative error of less than 0.5%, the repeatability of the layer thickness determination was quite good. Relative errors in the concentrations were below 1% for all elements in the cells. We noticed that increasing the measurement time of the 30 kV excitation condition up to 3 min decreased the relative standard deviation values to below 1%. These findings can prove that a non-destructive analysis based on EDXRF is a versatile tool for evaluating the microstructure of CIGS solar cells. Total measurement times of less than 3 min of live time allowed for excellent repeatability values, both for the layer composition and thickness. It is worth noting that the GGI values were almost the same for all of the tested samples, i.e., very close to the optimum ratio of about 0.6 obtained in the simulation.
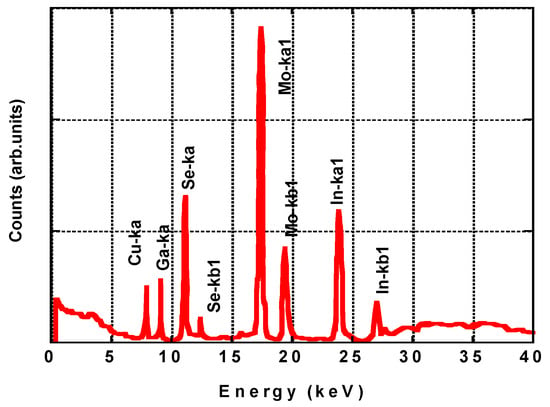
Figure 12.
EDXRF pattern for CIGS-2.0 solar cell absorption layer on Mo substrate.

Table 3.
The operation parameters of the CIGS absorption layer based on EDXRF.
Table 3.
The operation parameters of the CIGS absorption layer based on EDXRF.
| Sample | Thickness (μm) | Cu (%) | In (%) | Ga (%) | Se (%) | Mo (%) | GGI Ratio |
|---|---|---|---|---|---|---|---|
| CIGS-0.5 | 0.595 | 21.94 | 13.35 | 17.67 | 47.03 | 100 | 0.570 |
| CIGS-1.0 | 1.015 | 22.56 | 13.43 | 16.99 | 47.01 | 100 | 0.559 |
| CIGS-2.0 | 2.035 | 21.87 | 13.40 | 17.62 | 47.10 | 100 | 0.568 |
4.5. I-V Measurements of the CIGS Solar Cell Output Parameters
The electrical modeling of photovoltaic solar cells is important for calculating the electrical performance of devices. Solar cell output parameters, such as I-V measurements, were performed to characterize solar cells.
Figure 13 depicts a comparison of the experimental and simulated J-V curves for the prototype cell (CIGS-2.0) at room temperature and a sun simulator power (Pin of 1000 W/m2). Detailed experimental parameters for other cells with different thicknesses are not shown here since our study focused on prototype cells with optimum simulated parameters, specifically with a thickness of 2 µm. However, one can compare the simulated parameters for this prototype cell using the experimental results, and Table 4 summarizes these results for the CIGS-2.0 solar cell.
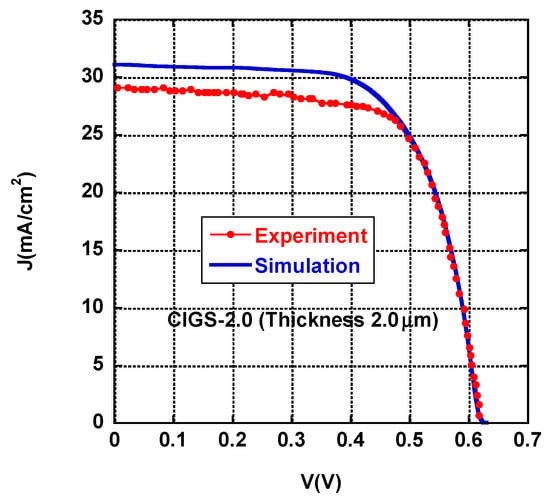
Figure 13.
Comparison between simulated and experimental results for a CIGS solar cell with a thickness of 2 µm and a GIG ratio of 0.6.

Table 4.
Summary of the simulated and experimental results for CIGS-2.0 solar cell (at room temperature).
Figure 13 illustrates the experimental J-V curves of the best-performing CIGS solar cell (CIGS-2.0), the one with a thickness of 2 µm and a GIG ratio of 0.6, compared with the simulation results (dotted line). Both the experimental and simulation measurements were performed under AM 1.5 G illumination (1000 W/m2). The open-circuit voltage (Voc) is almost invariant, whereas both the Jsc and ɳ of the CIGS-2.0 solar cell are suppressed by 6% and 0.5%, respectively, compared to those of the simulated CIGS-2.0 solar cell. Moreover, the simulated and experimental results (at room temperature) shown in Table 4 reveal that there is little change in the shunt resistance (RSH) and the series resistance (RS) for the same studied cells. The value of the ideality parameter, n, which gives an indication of how closely the solar cell follows ideal p-n junction behavior and provides information regarding the charge transport and recombination process, was also calculated [28]. In our case, the n value was about 2, meaning that the cell currents were probably dominated by the charge generation and recombination process.
Shamim et al. [29] reported that the efficiency increases with the thickness of the absorber layer. They also report a reduction in the recombination probability of the photon-generated carriers at the back contact with an increase in thickness. An efficiency of 19.75% for the ZnO: Al/i-ZnO/CdS/CIGS system was reached. In one study [30], a CIGS solar cell was prepared using a vacuum deposition technique. A power conversion efficiency of 4.3% was obtained when cupric selenide nanoparticles were present, while a significantly lower efficiency was observed in the absence of these nanoparticles. In another study [31], a power conversion efficiency of 15.82% was obtained, while Jiang et al. [32] reported a maximum power conversion efficiency of 15.2% for CIGS solar cells. These reported efficiency results are quite comparable to the results reported in Figure 13 for a CIGS solar cell with an optimum thickness of about 2µm. The small deviation in efficiency may be related to the calculation of the effective cell area and the thermal fluctuations in the operating temperature.
Moreover, Li et al. [33] recorded a champion efficiency of 17.5% for CdTe TFSCs, and I. E. Tinedert et al. [34] obtained an efficiency of 24.35% for a numerically modeled CdTe solar cell. In a specific study, S. M. Youn et al. [35] utilized a p-NiO layer in a CIGS solar cell and revealed a conversion efficiency of 16.35%. Whereas Ziabari et al. [36] used spherical Au nanoparticles in a CIGS solar cell and recorded a conversion efficiency of 19.01%. However, M. Boubakeur et al. [37] theoretically demonstrated a CIGS solar cell and obtained an efficiency of 21.08%. In a recent detailed study, A. Duchatele et al. [38] investigated CIGS absorbers with three thicknesses (2 µm, 0.7 µm, and 0.37 µm). In this study, it was shown that, despite the decreasing thickness, the performance of the CIGS electrodeposited solar cells was improved due to an increase in the Ga content of the absorber. In fact, optimizing the GGI ratio through the film thickness (bandgap grading) has long been a topic discussed in relation to improving high-efficiency CIGS solar cells [39,40,41,42,43,44]. These reported theoretical results are higher than the simulation and experimental results summarized in Table 2 and Table 3, even though the thickness and GGI values are in the same range. This suggests that conducting a much more detailed study on the effect of the Ga content in the CIGS layer and its homogeneous distribution through the whole layer thickness may be worthwhile. It is worth noting that one of the major efficiency losses in CIGS cells is the inhomogeneities, defects, and texturing of the various cell layers of the microstructures, as reported in the SEM, XRD, EDXRF, and AFM results. For example, EDXRF has proved to be a good tool for obtaining the optimum thickness of the absorber layer thickness and In and Ga content (see Table 3 and Figure 12). It has been well established that energy gap change due to inhomogeneous (In and Ga) concentrations at grain boundaries has a direct effect on the voltage difference across these grains and, consequently, a direct effect on the efficiency, especially for cells at the industrial scale.
5. Conclusions
In summary, in the present study, we described the simulation, preparation, and characterization of CIGS-based thin-film solar cells. The main cell’s parameters were calculated using COMSOL Multiphysics software through a 3D analysis by implementing the corresponding equations related to optical–electrical coupling profiles. The effect of the GGI ratio and absorber layer thickness on the fill factor, Voc, JSC, and the power conversion efficiency of the solar cells was investigated both experimentally and theoretically. According to our simulation results, the optimal GGI ratio was 0.6, while the optimal absorber layer thickness was 2 µm, and the optimal power conversion efficiency (ɳ) was found to be about 17%. However, our experimental results for cells fabricated with the same set of simulation parameters revealed an efficiency of about 15%. Based on the EDXRF results and the good agreement between our experimental and simulation results, we suggest that these versatile tools can be used to measure the thickness and GGI ratio in a simple, non-destructive, and precise manner. Moreover, the valuation method can provide insights into and a better understanding of the working mechanism and design of solar devices with similar properties and larger scales.
Author Contributions
Conceptualization, B.A. and M.A.-W.; methodology, B.A. and M.A.-W.; software, B.A.; validation, B.A. and M.A.-W.; data curation, B.A. and M.A.-W.; writing—original draft preparation, B.A. and M.A.-W.; writing—review and editing, B.A. and M.A.-W.; project administration, B.A. All authors have read and agreed to the published version of the manuscript.
Funding
This work was supported by the Jordan Scientific Research Support Fund SRSF under grant number BAS/1/19/2018, and the Deanship of Research at Jordan University of Science and Technology under grant number 2021/088.
Data Availability Statement
All data are available upon request.
Acknowledgments
Special thanks to the research assistants Ibrahim Al-Khaldi, Rama Alabed, Isra Rawashdeh, Hazem Rashaideh, and Saja Al-Rousan for their valuable help in sample preparation and experimental set-up.
Conflicts of Interest
The authors declare no conflict of interest. The funders had no role in the design of the study; in the collection, analyses, or interpretation of data; in the writing of the manuscript; or in the decision to publish the results.
References
- Nakamura, K.M.; Yamaguchi, Y.; Kimoto, Y.; Yasaki, T.; Kato, H. Sugimoto Cd-Free Cu(In, Ga)(Se, S)2 thin-film solar cell with record efficiency of 23.35%. IEEE J. Photovolt. 2019, 9, 1863–1867. [Google Scholar] [CrossRef]
- Azimi, H.; Hou, Y.; Brabec, C.J. Towards low-cost, environmentally friendly printed chalcopyrite and kesterite solar cells. Energy Environ. Sci. 2014, 7, 1829–1849. [Google Scholar] [CrossRef]
- Ramanujam, J.; Singh, U.P. Copper indium gallium selenide based solar cells—A review. Energy Environ. Sci. 2017, 10, 1306–1319. [Google Scholar] [CrossRef]
- Reinhard, P.; Chirilă, A.; Blösch, P.; Pianezzi, F.; Nishiwaki, S.; Buechelers, S.; Tiwari, A.N. Review of progress toward 20% efficiency flexible CIGS solar cells and manufacturing issues of solar modules. In Proceedings of the IEEE 38th Photovoltaic Specialists Conference (PVSC) PART 2 (1–9), Austin, TX, USA, 3–8 June 2012. [Google Scholar]
- Hernández-Gutiérrez, C.A.; Morales-Acevedo, A.; Cardona, D.; Contreras-Puente, G.; López-López, M. Analysis of the performance of InxGa1−xN based solar cells. SN Appl. Sci. 2019, 1, 628. [Google Scholar] [CrossRef]
- Nakamura, M.; Lin, C.; Nishiyama, C.; Tada, K.; Bessho, T.; Segawa, H. Semi-transparent Perovskite Solar Cells for Four-Terminal Perovskite/CIGS Tandem Solar Cells. ACS Appl. Energy Mater. 1993, 5, 8103–8111. [Google Scholar] [CrossRef]
- Saji, V.S.; Choi, I.H.; Lee, C.W. Progress in electrodeposited absorber layer for CuIn(1−x)GaxSe2 (CIGS) solar cell. Sol. Energy 2011, 85, 2666–2678. [Google Scholar] [CrossRef]
- Belghachi, A.; Limam, N. Effect of the absorber layer band-gap on CIGS solar cell. Chin. J. Phys. 2017, 55, 1127–1134. [Google Scholar] [CrossRef]
- Dullweber, T.; Rau, U.; Schock, H.W. A new approach to high-efficiency solar cells by band gap grading in Cu(In, Ga)Se2 chalcopyrite semiconductors. Sol. Energy Mater. Sol. Cells 2001, 67, 145–150. [Google Scholar] [CrossRef]
- Gloeckler, M.; Sites, J.R. Band-gap grading in Cu(In, Ga)Se2 solar cells. J. Phys. Chem. Solids 2005, 66, 1891–1894. [Google Scholar] [CrossRef]
- Contreras, M.A.; Tuttle, J.; Gabor, A.; Tennant, A.; Ramanathan, K.; Asher, S.; Franz, A.; Keane, J.; Wang, L.; Noufi, R. High efficiency graded bandgap thin-film polycrystalline Cu(In, Ga)Se2-based solar cells. Sol. Energy Mater. Sol. Cells 1996, 41, 231–246. [Google Scholar] [CrossRef]
- Achard, V.; Balestrieri, M.; Bechu, S.; Jubault, M.; Bouttemy, M.; Lombez, L.; Hildebrandt, T.; Naghavi, N.; Etcheberry, A.; Lincot, D.; et al. Effect of Ga introduction during the second stage of a coevaporation process of Cu(In, Ga)Se2 layers at low temperature on polyimide substrates. Thin Solid Film 2019, 669, 494–499. [Google Scholar] [CrossRef]
- Li, W.; Yan, X.; Aberle, A.G.; Venkataraj, S. Analysis of microstructure and surface morphology of sputter deposited molybdenum back contacts for CIGS solar cells. Procedia Eng. 2016, 139, 1–6. [Google Scholar] [CrossRef][Green Version]
- Mufti, N.; Amrillah, T.; Taufiq, A.; Diantoro, M.; Nur, H. Review of CIGS-based solar cells manufacturing by structural engineering. Sol. Energy 2020, 207, 1146–1157. [Google Scholar] [CrossRef]
- Baik, J.; Park, J.; Lee, G.; Kim, S.; Kim, J. Effects of incoherent front cover glass on current-voltage characteristics of Cu(In, Ga)Se2 solar cells: Investigation into calculation accuracy for cover glass modeled as optically coherent or incoherent. Appl. Sci. 2020, 10, 3312. [Google Scholar] [CrossRef]
- Elbar, M.; Tobbeche, S.; Merazga, A. Effect of top-cell CGS thickness on the performance of CGS/CIGS tandem solar cell. Sol. Energy 2015, 122, 104–112. [Google Scholar] [CrossRef]
- Gelb, J.; Stripe, B.; Yang, X.; Lewis, S.; Lau, S.H.; Yun, W. Mapping Subsurface Composition with Attogram Sensitivity using Micro-XRF. Microsc. Microanal. 2018, 24 (Suppl. S1), 1058–1059. [Google Scholar] [CrossRef]
- Lee, S.; Gonzalez, J.J.; Yoo, J.H.; Chirinos, J.R.; Russo, R.E.; Jeong, S. Application of femtosecond laser ablation inductively coupled plasma mass spectrometry for quantitative analysis of thin Cu(In, Ga)Se2 solar cell films. Thin Solid Film 2015, 577, 82–87. [Google Scholar] [CrossRef]
- Kato, T.; Wu, J.L.; Hirai, Y.; Sugimoto, H.; Bermudez, V. Record efficiency for thin-film polycrystalline solar cells up to 22.9% achieved by Cs-treated Cu(In, Ga)(Se, S)2. IEEE J. Photovolt. 2018, 9, 325–330. [Google Scholar] [CrossRef]
- Friedlmeier, T.M.; Jackson, P.; Bauer, A.; Hariskos, D.; Kiowski, O.; Wuerz, R.; Powalla, M. Improved photocurrent in Cu(In, Ga)Se 2 solar cells: From 20.8% to 21.7% efficiency with CdS buffer and 21.0% Cd-free. IEEE J. Photovolt. 2015, 5, 1487–1491. [Google Scholar] [CrossRef]
- Mansfield, L.M.; Garris, R.L.; Counts, K.D.; Sites, J.R.; Thompson, C.P.; Shafarman, W.N.; Ramanathan, K. Comparison of CIGS solar cells made with different structures and fabrication techniques. IEEE J. Photovolt. 2016, 7, 286–293. [Google Scholar] [CrossRef]
- Chen, S.C.; Wang, S.W.; Kuo, S.Y.; Juang, J.Y.; Lee, P.T.; Luo, C.W.; Wu, K.H.; Kuo, H.C. A Comprehensive Study of One-Step Selenization Process for Cu (In1−x Ga x)Se2 Thin Film Solar Cells. Nanoscale Res. Lett. 2017, 12, 208. [Google Scholar] [CrossRef] [PubMed]
- He, X.; Ercius, P.; Varley, J.; Bailey, J.; Zapalac, G.; Nagle, T.; Poplavskyy, D.; Mackie, N.; Bayman, A.; Lordi, V.; et al. The role of oxygen doping on elemental intermixing at the PVD-CdS/Cu(InGa)Se2 heterojunction. Prog. Photovolt. Res. Appl. 2019, 27, 255–263. [Google Scholar] [CrossRef]
- Li, W.; Yan, X.; Aberle, A.G.; Venkataraj, S. Effect of sodium diffusion on the properties of CIGS solar absorbers prepared using elemental Se in a two-step process. Sci. Rep. 2019, 9, 2637. [Google Scholar] [CrossRef] [PubMed]
- Shirakata, S. Site selective doping of Zn for the p-type Cu(In, Ga)Se2 thin film for solar cell application. Phys. Status Solidi C 2017, 14, 1600170. [Google Scholar] [CrossRef]
- Saxena, P.; Gorji, N.E. COMSOL Simulation of Heat Distribution in Perovskite Solar Cells: Coupled Optical-Electrical-Thermal 3-D Analysis. IEEE J. Photovolt. 2019, 9, 1693–1698. [Google Scholar] [CrossRef]
- Malm, U.; Edoff, M. Simulating Material Inhomogeneities and Defects in CIGS thin-film solar cells. Prog. Photovolt. Res. Appl. 2009, 17, 306–314. [Google Scholar] [CrossRef]
- Muhammad, F.; Yahya, M.; Hameed, S.; Aziz, F.; Sulaiman, K.; Rasheed, M.; Ahmad, Z. Employment of single-diode model to elucidate the variations in photovoltaic parameters under different electrical and thermal conditions. PLoS ONE 2017, 12, e0182925. [Google Scholar] [CrossRef] [PubMed]
- Shamim, S.M.; Islam, S.; Huq, M.F.; Al Jobair, M. Design, performance analysis and efficiency optimization of copper indium gallium selenide (CIGS) solar cell. Eur. Sci. J. 2015, 11, 156–163. [Google Scholar]
- Farooq, W.; Alshahrani, T.; Asfandyar, S.; Kazmi, A.; Iqbal, J.; Khan, H.; Mahmood Khan, R.A.; Rehman, A. Materials Optimization for thin-film copper indium gallium selenide (CIGS) solar cell based on distributed braggs reflector. Optik 2021, 227, 165987. [Google Scholar] [CrossRef]
- Zhao, Y.; Yuan, S.; Chang, Q.; Zhou, Z.; Kou, D.; Zhou, W.; Qi, Y.; Wu, S. Controllable formation of ordered vacancy compound for high efficiency solution processed Cu(In, Ga)Se2 solar cells. Adv. Funct. Mater. 2021, 31, 2007928. [Google Scholar] [CrossRef]
- Jiang, J.; Giridharagopal, R.; Jedlicka, E.; Sun, K.; Yu, S.; Wu, S.; Gong, Y.; Yan, W.; Ginger, D.S.; Green, M.A.; et al. Highly efficient copper-rich chalcopyrite solar cells from DMF molecular solution. Nano Energy 2020, 69, 104438. [Google Scholar] [CrossRef]
- Li, D.B.; Song, Z.; Awni, R.A.; Bista, S.S.; Shrestha, N.; Grice, C.R.; Chen, L.; Liyanage, G.K.; Razooqi, M.A.; Phillips, A.B.; et al. Eliminating s-kink to maximize the performance of MgZnO/CdTe solar cells. ACS Appl. Energy Mater. 2019, 2, 2896–2903. [Google Scholar] [CrossRef]
- Tinedert, I.E.; Pezzimenti, F.; Megherbi, M.L.; Saadoune, A. Design and simulation of a high efficiency CdS/CdTe solar cell. Optik 2020, 208, 164112. [Google Scholar] [CrossRef]
- Youn, S.M.; Park, M.J.; Kim, J.H.; Jeong, C. Performance enhancement of CIGS thin-film solar cells with a functional-window NiO thin layer. J. Alloys Compd. 2020, 836, 154803. [Google Scholar] [CrossRef]
- Abdolahzadeh Ziabari, A.; Royanian, S.; Yousefi, R.; Ghoreishi, S. Performance improvement of ultrathin CIGS solar cells using Al plasmonic nanoparticles: The effect of the position of nanoparticles. J. Optoelectron. Nanostruct. 2020, 5, 17–32. [Google Scholar]
- Boubakeur, M.; Aissat, A.; Arbia, M.B.; Maaref, H.; Vilcot, J.P. Enhancement of the efficiency of ultra-thin CIGS/Si structure for solar cell applications. Superlattices Microstruct. 2020, 138, 106377. [Google Scholar] [CrossRef]
- Duchatelet, A.; Letty, E.; Jaime-Ferrer, S.; Grand, P.P.; Mollica, F.; Naghavi, N. The impact of reducing the thickness of electrodeposited stacked Cu/In/Ga layers on the performance of CIGS solar cells. Sol. Energy Mater. Sol. Cells 2017, 162, 114–119. [Google Scholar] [CrossRef]
- Mainz, R.; Weber, A.; Rodriguez-Alvarez, H.; Levcenko, S.; Klaus, M.; Pistor, P.; Klenk, R.; Schock, H.W. Time-resolved investigation of Cu(In, Ga)Se2 growth and Ga gradient formation during fast selenisation of metallic precursors. Prog. Photovolt. Res. Appl. 2015, 23, 1131–1143. [Google Scholar] [CrossRef]
- Lafuente-Sampietro, A.; Yoshida, K.; Wang, S.; Ishizuka, S.; Shibata, H.; Sano, N.; Akimoto, K.; Sakurai, T. Effect of the double grading on the internal electric field and on the carrier collection in CIGS solar cells. Sol. Energy Mater. Sol. Cells 2021, 223, 110948. [Google Scholar] [CrossRef]
- Koida, T.; Nishinaga, J.; Ueno, Y.; Higuchi, H.; Takahashi, H.; Iioka, M.; Shibata, H.; Niki, S. Impact of front contact layers on performance of Cu(In, Ga)Se2 solar cells in relaxed and metastable states. Prog. Photovolt. Res. Appl. 2018, 26, 789–799. [Google Scholar] [CrossRef]
- Rezaei, N.; Isabella, O.; Vroon, Z.; Zeman, M. Quenching Mo optical losses in CIGS solar cells by a point contacted dual-layer dielectric spacer: A 3-D optical study. Opt. Express 2018, 26, A39–A53. [Google Scholar] [CrossRef] [PubMed]
- Dhingra, A.; Rothwarf, A. Computer simulation and modeling of the graded bandgap CuInSe/sub 2CdS solar cell. In Proceedings of the Conference Record of the Twenty Third IEEE Photovoltaic Specialists Conference—1993 (Cat. No.93CH3283-9), Louisville, KY, USA, 10–14 May 1993; pp. 475–480. [Google Scholar]
- Jackson, P.; Wuerz, R.; Hariskos, D.; Lotter, E.; Witte, W.; Powalla, M. Effects of heavy alkali elements in Cu(In, Ga)Se2 solar cells with efficiencies up to 22.6%. Phys. Status Solidi (RRL) Rapid Res. Lett. 2016, 10, 583–586. [Google Scholar] [CrossRef]
Disclaimer/Publisher’s Note: The statements, opinions and data contained in all publications are solely those of the individual author(s) and contributor(s) and not of MDPI and/or the editor(s). MDPI and/or the editor(s) disclaim responsibility for any injury to people or property resulting from any ideas, methods, instructions or products referred to in the content. |
© 2023 by the authors. Licensee MDPI, Basel, Switzerland. This article is an open access article distributed under the terms and conditions of the Creative Commons Attribution (CC BY) license (https://creativecommons.org/licenses/by/4.0/).