Abstract
The availability of fossil energy is dwindling, so renewable fuels are the alternative choices, one of which is bioethanol. To increase the purity of the ethanol produced via the fermentation process, activated carbon (AC) was made from durian (Durio zibethinus) peel. The steps for making AC consist of carbonization (300 °C and 400 °C), chemical activation using phosphoric acid (10–40%), pyrolysis (700 °C and 800 °C), and neutralization. The results showed that the maximum surface area (326.72 m2/g) was obtained from 400 °C carbonization, 800 °C pyrolysis, and activation using a 40% phosphoric acid solution. Other characteristics are the surface area of 326.72 m2/g, pore radius of 1.04 nm, and total pore volume of 0.17 cc/g with phosphate residue in the form a P2O5 molecule of 3.47% by weight, with COOH, OH, CO, C=C, C=O, P-OC, and Fe-O groups with wavenumbers (cm−1), respectively, of 3836, 3225, 2103, 1555, 1143, and 494. The AC also demonstrated the highest number of carbon (86.41%) upon detection using EDX, while XRF analysis verified an average carbon content of 94.45 wt%. The highest ethanol adsorption efficiency (%) and the lowest yield (%) of AC (%) were 90.01 ± 0.00 and 23.26 ± 0.01. This study shows that durian peel has great potential as the raw material for the activated carbon manufacture of ethanol adsorbents.
1. Introduction
Significant global climate change due to greenhouse gasses generated via fossil fuel combustion has led to much research on alternative fuels that are efficient and environmentally friendly, including microbial bioethanol [1,2]. Unfortunately, the ethanol content in the broth obtained from the fermentation process is very low [3]. Meanwhile, the purity of ethanol as a biofuel is very high, which is about 99 wt% [4]. Therefore, an appropriate and energy-efficient purification technology is required, and the adsorption process using activated carbon (AC) can be a good option [5]. The research results of Downarowicz and Aleksandrzak (2017) [5] show that AC has a strong affinity for organic polar compounds, including bioethanol. Functionally, AC can also be used as a catalyst carrier [6], drinking water disinfection, energy storage, and gas storage [7].
Durian (Durio zibethinus) peel is a fruit waste that is known as an attractive AC precursor for its high carbon (C) content and affinity to polar compounds [8]. It is the fifth largest fruit commodity in Indonesia with around 60–75% waste of its peel [9]. The presence of lignocellulosic content in biomass requires a heating process at low and controlled temperatures in order to develop porosity in the charcoal, which is called pyrolysis/hydrothermal carbonization [10]. The hydrothermal carbonization temperature for cellulose is in the range of 300–400 °C [11] to allow complete removal of moisture and volatile compounds [10].
The production of AC via carbonization and then activation (chemical and physical) produces large amounts of carbon and expels most of the non-carbon element in gas form, which is mainly oxygen. The use of chemical activation has the advantage of transforming the pore structure, high conversion of raw materials to carbon, and resisting the formation of tar [12]. Meanwhile, physical activation by heating at high temperatures will open carbon pores [13]. Phosphoric acid is a chemical activation agent that is widely used for large-scale synthesis of activated carbon from lignocellulosic materials because it produces high pore diameter and total volume and is relatively environmentally friendly [7].
Several studies on the carbonization temperature and activators for the manufacture of AC as adsorbents from durian peel at 400 °C with KOH and H2SO4 [12] and at 500 °C with KOH [14]. Unfortunately, both of them used KOH activation, which is hygroscopic [15] and leads to increased hydrophilicity of the resulting AC [16]. In addition, durian peel AC has also been studied using 10% v/v H3PO4 without going through carbonization, and the activation temperatures are 400 and 500 °C [17]. We know that ethanol production is still a mixture of ethanol–water, and the hydrophobicity of AC aims to allow ethanol to be adsorbed while water is retained outside of it. AC characteristics strongly depend on its pore structure which can be analyzed via surface area, volume, and pore size evaluation [18]. Other analyzes include the presence of functional groups with FTIR instruments, morphology and atomic content in AC with SEM-EDX, and chemical constituents with XRF.
In this study, AC from durian peel was manufactured via carbonization and chemical activation with phosphoric acid. The AC was characterized, its yield was optimized, and adsorption efficiency was investigated for its ability to adsorb ethanol.
2. Materials and Methods
2.1. Material Pretreatment
Durian peel was collected in Gunungpati area (Semarang City) in Central Java Province, Indonesia, and then they were cut into 6 to 8 cm. Furthermore, the raw material was dried at 70 °C until a constant weight was reached. Dried durian peel were stored in an airtight container filled with silica gel to prevent fungal growth until they were ready to be processed when needed. Commercial activated carbon (CAC) (local market) was made from coconut shells in Indonesia.
2.2. AC Synthesis
The AC was produced via carbonization (CN) process at 300 °C and 400 °C by carbonizing the durian peel in the furnace for 1 h accompanied by flowing N2 gas at a rate of 1 L/min. Next, chemical activation was performed by soaking the carbon in various concentrations of H3PO4, the activator, namely 10%, 20%, 30%, and 40 wt.%, at room temperature with constant stirring at 100 rpm for 24 h. Then, the carbon was physically activated by heating it in the furnace at 700 °C and 800 °C for 1 h, accompanied by flowing N2 gas at a rate of 1 L/min.
2.3. AC Neutralization
The AC produced was then neutralized with distilled water for 30 min at 85 °C until no longer detectable phosphor ions or other contaminants were found in the wash water, then filtered, and the filtrate was tested for its pH using a pH meter (Mettler Toledo). Washing using distilled water and 0.5 N KOH was repeated until a pH of 7 was reached. After the neutralization stage was completed, the AC was heated in an oven at 110 °C until the achievement of constant weight. Then, the AC was sieved at 8–10 mesh.
2.4. Ethanol Adsorption Test
One gram of AC was introduced into an Erlenmeyer flask containing 20 mL of 9.91% ethanol. The adsorption was carried out at room temperature with the shaker speed was 100 rpm. Ethanol samples were drawn using the same technique at 15, 30, 45, 60, and 75 min.
2.5. Determination of Ethanol Concentration
The Conway method [19] was used to determine the remaining ethanol content after being adsorbed with AC. The Conway cup containing 3 mL of dichromic acid, 0.5 mL of ethanol after adsorption, and 1 mL of 20% Na2CO3 was placed in the oven at 90 °C for 20 min before cooling back to room temperature. The dichromic acid in the Conway cup was diluted to 25 mL, and the absorbance was measured using a UV Vis Spectrophotometer (Genesys 10) with a maximum wavelength of 444 nm. Then, the absorbance value obtained was substituted for the linear equation resulting from the ethanol calibration curve to determine the ethanol concentration resulting from adsorption. AC adsorption of durian peel compared to CAC.
2.6. Determination of Ethanol Adsorption Efficiency via AC
The adsorption efficiency via AC in this study was calculated using Equation (1) [20].
where and refer to concentration of ethanol solution (%) before and after the adsorption process
2.7. Determination of Yield of AC
The yield of AC in this study was calculated using Equation (2) [21].
where AC and C refer to total mass (g) of activated carbon and carbon
2.8. Characterizations of AC and CAC before and after Activation
The surface area, pore volume, and pore diameter were quantified using nitrogen adsorption–desorption (Brunauer–Emmett–Teller, BET) model Nova 1200 e, Quantachrome). The pore size distribution is obtained from the desorption branch of the hysteretic adsorption isotherm. Functional groups were analyzed using Fourier Transform Infrared Spectroscopy (FTIR) model Perkin Elmer Spectrum IR 10.6.1. (PerkinElmer, Waltham, MA, USA) Scanning Electron Microscope–Energy Dispersive X-ray (SEM-EDX) model SEM-EDX JEOL JSM-6510LA (JEOL, Showima City, Tokyo, Japan) was used to study surface chemistry and pore structure (SEM) and atomic content (EDX, Thermo Fisher Scientific, Waltham, MA, USA). Prior to SEM analysis, the sample was coated with thin layer of gold and then mounted to a puncture made of copper with the help of carbon double-sided tape. Meanwhile, the elemental composition of the AC was analyzed via EDX. Determination of the chemical constituents of AC was evaluated using X-ray Fluorescence (XRF) Spectrometry (Wavelength Dispersive X-ray Fluorescence (WDXRF) model Rigaku Supermini200, Quantachrome TouchWin ver. 1.11, Rigaku, The Woodlands, TX, USA).
3. Results and Discussion
3.1. Surface Area of AC of Durian Peel
The results of BET analysis with thermal CN 300 and 400 °C at various concentrations of phosphoric acid at pyrolysis temperatures of 700 °C and 800 °C are presented in Table 1 and Table 2. Accordingly, the surface area comparison of the ACs obtained from this study and CAC is shown in Table 3.

Table 1.
BET result of AC pyrolized at 700 °C.

Table 2.
BET result of AC pyrolized at 800 °C.

Table 3.
Surface area comparison of this study and CAC.
Table 1 shows that the CA samples activated with 40% H3PO4 exhibit a larger surface area and is most compared to other concentrations in the same CN and pyrolysis temperature group. The results of the BET analysis in this study agreed well with those reported by [22,23], where CAs activated with H3PO4 possessed a surface area of 16, 56.78, and 257.50 m2/g, respectively.
Table 2 shows that the CN temperature of 400 °C produces a higher surface area (326.72 m2/g) than 300 °C (291.64 m2/g). Indeed, raising the activator concentration while also raising the surface area and pore volume can be seen in Table 1 and Table 2. It is due to the intensive interaction between the phosphoric acid molecules and the carbon structure. So, the carbon decomposes into cellulose to form phosphates oxide (P2O5), which forms pores [24]. The pore size decreased sharply as the activator concentration increased from 10% to 20%. However, the reduction in pore size was not significant at activator concentrations exceeding 20%. It is due to the lower the volatile matter content, the smaller the pore diameter [25]. The increase in pore volume is to have a good effect on adsorption because it can provide optimal adsorption space in AC [26].
The increase in surface area (Table 3) occurs as activation temperature, pyrolysis temperature, and H3PO4 concentration increase. The best results were when the pyrolysis, activation, and H3PO4 concentration conditions were AC800-400-40%, which reached about 6.6 times the increase in surface area after activation. It is also the same as the results of the SEM-EDX test, where AC 800-400-40% has the most wrinkles, so it has a large surface area.
In contrast, the AC obtained from AC700-400-10% has a small surface area, consists of fragments, and is less porous. It is presumably due to variations in temperature conditions during pyrolysis that aims for thermal decomposition [27]. So, the higher the pyrolysis temperature, the more open pores there are, but the yield will decrease [28]. Several studies on the effect of using phosphoric acid activation on yield and surface area in the manufacture of AC with biomass precursors are presented in Table 4.

Table 4.
Several studies on the effects of using phosphoric acid activation on yield and surface area in the manufacture of AC with biomass precursors.
3.2. FTIR Analysis
The results of the FTIR analysis of the AC’s surface with concentrations of 10%, 20%, 30%, and 40% are shown in Figure 1.
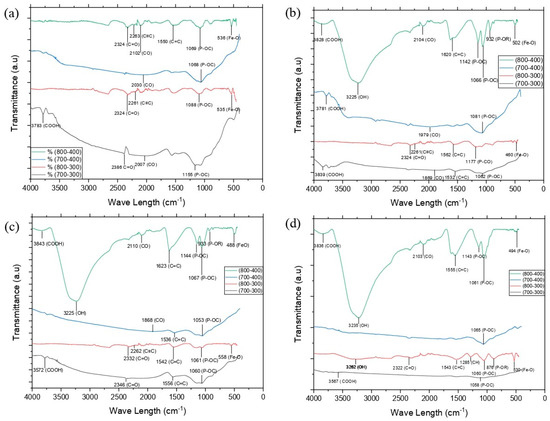
Figure 1.
Comparison of FTIR AC at concentration H3PO4 of (a) 10%, (b) 20%, (c) 30%, and (d) 40%.
The wavenumber of 2500–3500 cm−1 characterizes the steepest and dominant number of −OH compared to other functional groups in both the same and different treatments (Figure 1) so that the AC has a hydrophilic site [38].
The detected vibrations 3839–3567 cm−1 were obtained from the -COOH functional group in the variables AC 800-400-20%, AC 800-400-30%, AC 800-400-40%, AC 700–300, and AC 700-400-20% (Figure 1). Meanwhile, the wavenumber of 3262–3225 cm−1 indicates the presence of the −OH functional group of the hydroxyl group [39]. The wavenumber 2263–2261 cm−1 is the C≡C vibration of the alkyne group [40] and was only found in the variables AC 800-300-10%, AC 800-400-10%, AC 800-300-20%, and AC 800-300-30%. Conversely, the C=C stretching disappeared at a concentrated activator concentration of 40%, indicating that many weak bonds disappeared in the activation process [41]. Based on Thue et al. 2017 [42], the discovery of carbonyl (C=O) and hydroxyl (−OH) on AC will reduce hydrophobicity because these functional groups easily bind water.
An aromatic bond C=C is found at a peak between 1532 and 1623 cm−1, which is more stable at a higher pyrolysis temperature [40]. The stretching vibrations of the P-OR functional group of esters with the weak band had been found at peaks of 876 cm−1 at AC 800-300-40%, 932 cm−1 at AC 800-400-30%, and 933 cm−1 at AC 800-400-20% [43]. The accumulation of Fe atoms on activated carbon was indicated by the Fe-O stretching vibrations found in all variables AC800-400-(10–40%) between 488 and 536 cm−1 [44]. A strong band at approximately 1058–1177 cm−1 as a result of the activation process with H3PO4 produces char oxidation, introducing oxygenated functionalities in the AC, was probably the stretching of the O–C bond in the P–O–C linkage (aromatic bond) or hydrogen-bonded P=O in a phosphate ester [37].
3.3. XRF Analysis
The chemical compositions of CN and AC were analyzed using XRF [41], with the results presented in Table 5, Table 6, Table 7, Table 8 and Table 9. Several inorganic species, such as K2O, P2O5, SiO2, CaO, and Fe2O3, are present in durian peel and can be considered impurities. The concentration of these impurities increased with the CN temperature [45].

Table 5.
Chemical components of CN temperature.

Table 6.
Chemical components of AC 700–300.

Table 7.
Chemical components of AC 700–400.

Table 8.
Chemical components of AC 800–300.

Table 9.
Chemical components of AC 800–400.
The mass percentage of component C in CN300 (97.5) is more than in CN400 (96.2) (Table 5) because the CN temperature of 400 C is higher than 300 C, so the release of volatile compounds is complete [45].
Table 6, Table 7, Table 8 and Table 9 have in common the components of AC from largest to smallest, namely C (more than 91%), P2O5, and K2O. The carbon content after pyrolysis is lower than after CN. It may be due to the many carbon bonds removed at an average of 3–4 wt.%. However, the content of compound C in the variables AC800-400-10% and AC800-400-20% (Table 9) is higher than CN400 (Table 5). Increasing the pyrolysis temperature enriches the carbon content in the AC by removing non-carbon species. However, an increase in the concentration of H3PO4, especially 30 and 40%, reduced the carbon content, presumably due to the partial gasification of the carbon via P2O5 and volatilization of phosphorus compounds. Meanwhile, thermal pyrolysis ≥400 °C produces P2O5 due to the decomposition of H3PO4, and inorganic substances have active components despite low chemical reaction ability, such as silica (SiO2), Fe2O3, K2O, and CaO. The following is a sequence of amorphous SiO2 (crystalline silica): AC700–400 (Table 7) > AC700–300 (Table 6) > AC800–400 (Table 9) > AC800–300 (Table 8). In contrast, as the phosphoric acid concentration increases, the SiO2 content tends to decrease [46].
On the other hand, the chemical composition of AC carbonized at 400 °C is higher than at 300 °C because the deformation of complex chemical compounds becomes simpler than at pyrolysis temperatures of 700 °C and 800 °C, so many compounds with new bonds form [47].
3.4. SEM-EDX Analysis
The surface morphologies of C (Figure 2), AC (Figure 3) and CAC (Figure 4) were observed using SEM. Meanwhile, the atomic content of carbon, AC, and CAC are presented in Figure 5, Figure 6 and Figure 7, respectively.
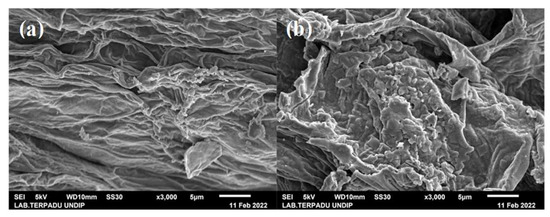
Figure 2.
Surface morphology of C on CN variable (magnification ×3000) (a) 300 °C and (b) 400 °C.
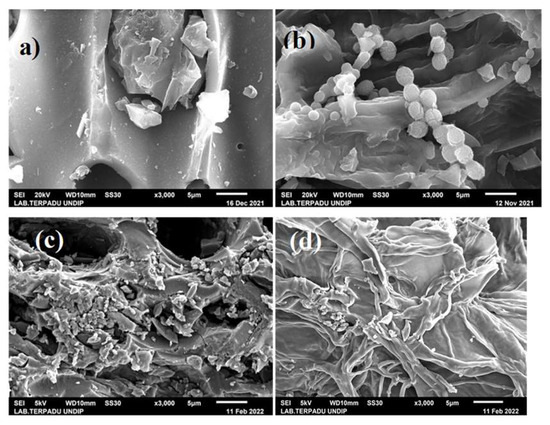
Figure 3.
Surface morphology of AC (×3000) with 40% phosphoric acid concentration: (a) AC700-300, (b) AC700-400, (c) AC800-300, and (d) AC800-400.
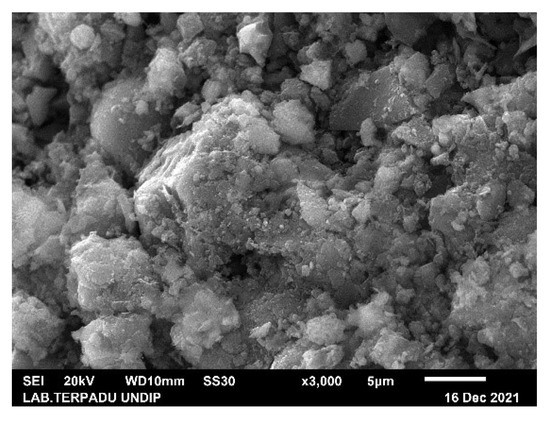
Figure 4.
Morphology of CAC.
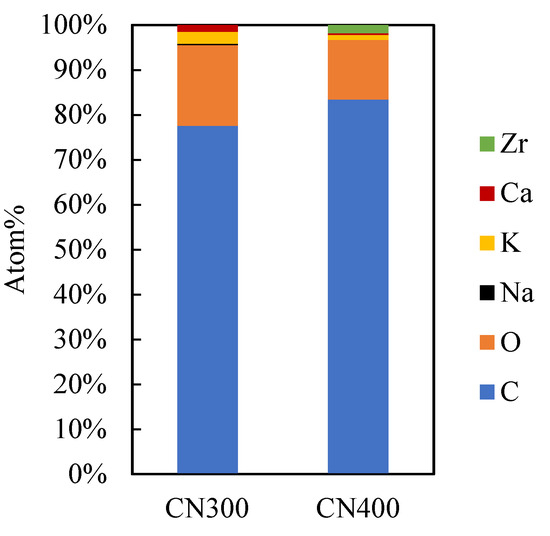
Figure 5.
Atomic content in carbonization variables.
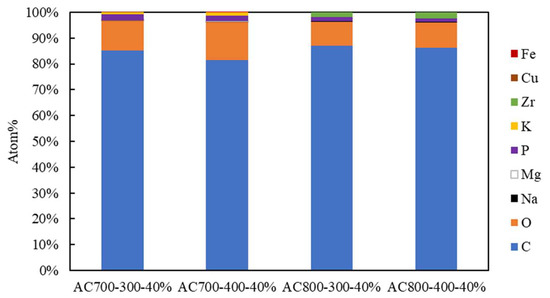
Figure 6.
Atomic content (%) of AC using 40% phosphoric acid in CN and pyrolysis variables.
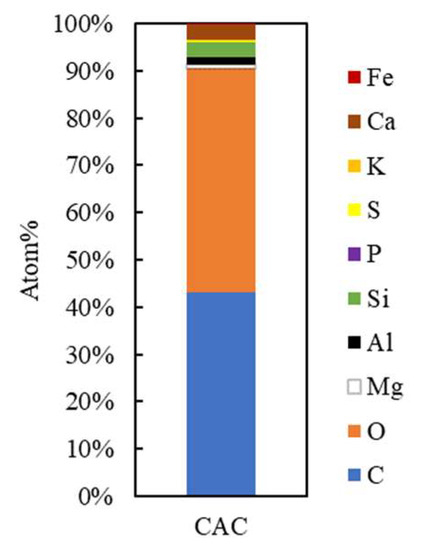
Figure 7.
Atomic content of CAC.
The morphology of the durian peel carbonized at 300 °C showed a wrinkled carbon surface without the pores because the durian peel carbon has not been able to decompose the volatile content [48,49]. On the other hand, the durian peel C at 400 °C (Figure 2b) showed pores starting to form but not evenly distributed over the entire C surface due to good pore structure as temperature increases [48,50].
All the variables shown in Figure 3 have a morphology in which many tunnel-like pores are formed on the surface of the AC. However, AC pyrolysis at 700 °C and 800 °C tends to produce the morphology of fragments and wrinkles. Figure 3 shows the pore volume of the SEM images, which is wider with higher CN and pyrolysis temperatures. Figure 3a shows a blockage in the pores in the form of C loss, which is thought to be due to the activation process. The appearance of a small spherical shape that sticks around the pores (Figure 3b) is thought to be residual KOH when the AC was neutralized.
The significant difference between the morphology of AC (Figure 3) and C (Figure 2) is the formation of porosity as a result of the activation of phosphoric acid on carbon to produce new products in the form of phosphate esters and polyphosphates [24].
Figure 4 shows forming many narrow fissure structures [35].
Figure 5 shows that the carbon content increases with increasing temperature. On the other hand, oxygen is decreasing. In addition, increasing the temperature also produces Zr.
After C was activated (Figure 6), new atoms appeared, namely Fe, P, Cu, and Mg. Figure 6 showed that C, O, and phosphorus (P) were the dominant compounds in the AC produced. The number of C atoms (%) produced from AC700-300-40%, AC700-400-40%, AC800-300-40%, and AC800-400-40%, respectively, are 85.14, 81.55, 86.88, and 86.14. The presence of P in AC is due to the availability of the phosphoric acid activator [51]. that helps the adsorbent to increase the hydrophobic properties of C [52]. AC. with a pyrolysis temperature of 800 °C, has a higher C content and a lower O content than 700 °C due to the organic matter’s contaminants, which prevented the N2 from removing them during the carbon synthesis process and resulted in poor product qualities [48].
The low C content (~42%) in CAC (Figure 7). In addition, the levels of O, P, K, and Mg in CAC are similar to the results of previous studies [53]. The Mg, aluminum (Al), and ferrum (Fe) atoms in Figure 6 are due to be ashes in the activated carbon, which are considered impurities and unnecessary trace amounts of elements like Fe, Si, Mn, and Ca that are frequently found in coconut shells. Chemicals like P and K are also available for activation procedures [54].
3.5. Effect of Temperature on Various Pyrolysis, CN, and H3PO4 Concentrations on Adsorption Efficiency via AC
The relevant adsorption efficiency measurements taken at various pyrolysis and CN temperature ranges are shown in Table 10. The concentration of phosphoric acid caused noticeable changes to be found.

Table 10.
Effect of temperature on various pyrolysis, CN, and H3PO4 concentrations on AC adsorption efficiency.
Table 10 shows the adsorption efficiency calculated using Equation (3) that the highest efficiencies have AC800-400-40% (90.01%). It is suspected that nearly all of the ethanol can be adsorbed via the activated carbon. The AC adsorption efficiency increases with the pyrolysis temperature. It has proven that the adsorption efficiency of AC at AC800-300 and AC800-400 is higher than pyrolysis at 700 °C. On the other hand, the decrease in its efficiency is due to the adsorption sites on AC being covered by adsorbate particles, causing a reduction in the total surface area and inhibiting the adsorption process [55].
Table 10 shows the fluctuating adsorption efficiency at AC700-300°C, namely 86.17%, 50.36%, 53.61%, and 79.66% for H3PO4 concentrations of 10%, 20%, 30%, and 40%, respectively. It is due to the excessive cross-linking reaction between C-O-P during the impregnation process [52]. A similar phenomenon also occurs at AC700-400 °C, where the adsorption efficiency was the highest for 10% H3PO4, but a fluctuating adsorption efficiency is obtained for 20–40% H3PO4. It is due to the cross-linking of biopolymers from phosphate esters, and polyphosphates are a new product resulting from the activation of phosphoric acid, which expands porosity. Nevertheless, the excessive concentrations of phosphoric acid form an insulating layer on the surface of the AC, thereby inhibiting ethanol adsorption [24]. On the other hand, the higher the CN temperature treatment and activation, the more the insulating layer on the AC surface disappears, so the ethanol adsorption is also higher.
3.6. Effect of Temperature on Various Pyrolysis, CN, and H3PO4 Concentrations on Yield of AC
The effect of pyrolysis temperature, CN temperature, and H3PO4 concentrations on the yield of AC is shown in Table 11.

Table 11.
Effect of pyrolysis temperature, CN temperature, and H3PO4 concentrations on the yield of AC.
Table 11 shows that as the concentration of H3PO4 increases, the yield of AC decreases. The mechanism of pore formation begins with a reaction in the form of dehydration, degradation, and coagulation changes between phosphoric acid and hemicellulose and lignin contained in carbon which causes the formation of aliphatic structures. The process is continued by heating the AC to high temperatures to form phosphate ester bonds and polyphosphate ester bonds. Then, when the temperature is above 600 °C, the compounds H3PO4, H2PO4−1, and H2P2O7−2 can evaporate, causing the phosphate ester and polyphosphate bonds to break in the precursor matrix. As a result, many new pores are formed [56,57]. The results of this study are similar to previous studies [56,57,58].
A comparison of adsorption efficiency and yield of AC from biomass is presented in Table 12.

Table 12.
Comparison of adsorption efficiency and yield of AC from biomass precursors using phosphoric acid activation.
4. Conclusions
The sequence of AC manufacturing stages from durian peel for bioethanol purification consists of CN (300–400 °C), the activation of H3PO4 (10–40%), pyrolysis (700–800 °C), and neutralization. The best results were characterized via carbonization at 400 °C, activator concentration at 40% H3PO4, and pyrolysis at 800 °C as follows: surface area of 326.72 m2/g, pore radius of 1.04 nm, and total pore volume of 0.17 cc/g with phosphate residue in the form a P2O5 molecule of 3.47% by weight, with COOH, OH, CO, C=C, C=O, P-OC, and Fe-O groups with a wavenumber (cm−1), respectively, are 3836, 3225, 2103, 1555, 1143, and 494 as well as XRF with phosphate residue (P2O5), which is 3.47% by weight. The AC also demonstrated the highest amount of carbon (86.41% by mass), while the adsorption efficiency (%) of bioethanol and yield (%) of AC were 90.01 ± 0.00 and 23.26 ± 0.01. The surface area of AC from durian peel was 6.5 times larger than CAC derived from coconut shells.
Author Contributions
Writing—original draft, A.D. and S.; data curation, formal analysis, M.R., M.W.N.M.B., B.N. and A.L.A.; supervision, resources, methodology, Z.A.S.B.; project administration, supervision, investigation, R.W.; writing—review and editing, A.D. All authors have read and agreed to the published version of the manuscript.
Funding
This research was funded by Universitas Negeri Semarang through a research grant under a contract of DIPA UNNES No. 57.8.4/UN37/PPK.3.1/2022.
Data Availability Statement
Data available on request.
Acknowledgments
The authors gratefully acknowledge the financial support from Universitas Negeri Semarang through a research grant under a contract of DIPA UNNES No. 57.8.4/UN37/PPK.3.1/2022. The authors also thank A. C. Kumoro from Universitas Diponegoro for the discussion of the experimental results.
Conflicts of Interest
The authors declare no conflict of interest.
References
- Rastogi, M.; Shrivastava, S. Recent Advances in Second Generation Bioethanol Production: An Insight to Pretreatment, Saccharification and Fermentation Processes. Renew. Sustain. Energy Rev. 2017, 80, 330–340. [Google Scholar] [CrossRef]
- Kumoro, A.C.; Damayanti, A.; Bahlawan, Z.A.S.; Melina, M.; Puspawati, H. Bioethanol Production from Oil Palm Empty Fruit Bunches Using Saccharomyces Cerevisiae Immobilized on Sodium Alginate Beads. Period. Polytech. Chem. Eng. 2021, 65, 493–504. [Google Scholar] [CrossRef]
- Achinas, S.; Euverink, G.J.W. Consolidated Briefing of Biochemical Ethanol Production from Lignocellulosic Biomass. Electron. J. Biotechnol. 2016, 23, 44–53. [Google Scholar] [CrossRef]
- Karimi, S.; Karri, R.R.; Tavakkoli Yaraki, M.; Koduru, J.R. Processes and Separation Technologies for the Production of Fuel-Grade Bioethanol: A Review. Environ. Chem. Lett. 2021, 19, 2873–2890. [Google Scholar] [CrossRef]
- Downarowicz, D.; Aleksandrzak, T. Isobutanol Vapor Adsorption on Activated Carbons: Equilibrium and Kinetic Studies. J. Chem. Eng. Data 2017, 62, 3518–3524. [Google Scholar] [CrossRef]
- Sharma, G.; Sharma, S.; Kumar, A.; Lai, C.W.; Naushad, M.; Shehnaz; Iqbal, J.; Stadler, F.J. Activated Carbon as Superadsorbent and Sustainable Material for Diverse Applications. Adsorpt. Sci. Technol. 2022, 2022, 4184809. [Google Scholar] [CrossRef]
- Neme, I.; Gonfa, G.; Masi, C. Activated Carbon from Biomass Precursors Using Phosphoric Acid: A Review. Heliyon 2022, 8, e11940. [Google Scholar] [CrossRef]
- Miskah, S.; Aprianti, T.; Agustien, M.; Utama, Y.; Said, M. Purification of Used Cooking Oil Using Activated Carbon Adsorbent from Durian Peel. IOP Conf. Ser. Earth Environ. Sci. 2019, 396, 012003. [Google Scholar] [CrossRef]
- Kumoro, A.C.; Alhanif, M.; Wardhani, D.H. A Critical Review on Tropical Fruits Seeds as Prospective Sources of Nutritional and Bioactive Compounds for Functional Foods Development: A Case of Indonesian Exotic Fruits. Int. J. Food Sci. 2020, 2020, 4051475. [Google Scholar] [CrossRef]
- MacDermid-Watts, K.; Pradhan, R.; Dutta, A. Catalytic Hydrothermal Carbonization Treatment of Biomass for Enhanced Activated Carbon: A Review. Waste Biomass Valorization 2021, 12, 2171–2186. [Google Scholar] [CrossRef]
- Li, J.; Zhao, P.; Li, T.; Lei, M.; Yan, W.; Ge, S. Pyrolysis Behavior of Hydrochar from Hydrothermal Carbonization of Pinewood Sawdust. J. Anal. Appl. Pyrolysis 2020, 146, 104771. [Google Scholar] [CrossRef]
- Sriprom, P.; Krusong, W.; Assawasaengrat, P. Preparation of Activated Carbon from Durian Rind with Difference Activations and Its Optimization. J. Renew. Mater. 2020, 9, 311–324. [Google Scholar] [CrossRef]
- Hassan, M.F.; Sabri, M.A.; Fazal, H.; Hafeez, A.; Shezad, N.; Hussain, M. Recent Trends in Activated Carbon Fibers Production from Various Precursors and Applications—A Comparative Review. J. Anal. Appl. Pyrolysis 2020, 145, 104715. [Google Scholar] [CrossRef]
- Legiso, L.; Susanto, T.; Roni, K.A.; Ramadhan, M.B.; Lestari, D.W.; Farida, F. Activation of Activated Carbon from Durian Peel as A Waste Adsorbent from Laundry Activities. Maj. BIAM 2020, 16, 58–63. [Google Scholar] [CrossRef]
- Chen, W.; Wang, X.; Hashisho, Z.; Feizbakhshan, M.; Shariaty, P.; Niknaddaf, S.; Zhou, X. Template-Free and Fast One-Step Synthesis from Enzymatic Hydrolysis Lignin to Hierarchical Porous Carbon for CO2 Capture. Microporous Mesoporous Mater. 2019, 280, 57–65. [Google Scholar] [CrossRef]
- Li, K.; Zhou, M.; Liang, L.; Jiang, L.; Wang, W. Ultrahigh-Surface-Area Activated Carbon Aerogels Derived from Glucose for High-Performance Organic Pollutants Adsorption. J. Colloid. Interface Sci. 2019, 546, 333–343. [Google Scholar] [CrossRef] [PubMed]
- ThamYee, J.; Arumugam, S.D.; Nur Hidayah, A.L.; Abdullah, A.M.; Latif, P.A. Effect of Activation Temperature and Heating Duration on Physical Characteristics of Activated Carbon Prepared from Agriculture Waste. Environ. Asia 2010, 3, 143–148. [Google Scholar]
- Lillo-Ródenas, M.A.; Cazorla-Amorós, D.; Linares-Solano, A. Behaviour of Activated Carbons with Different Pore Size Distributions and Surface Oxygen Groups for Benzene and Toluene Adsorption at Low Concentrations. Carbon. N. Y. 2005, 43, 1758–1767. [Google Scholar] [CrossRef]
- Sriariyanun, M.; Mutrakulcharoen, P.; Tepaamorndech, S.; Cheenkachorn, K.; Rattanaporn, K. A Rapid Spectrophotometric Method for Quantitative Determination of Ethanol in Fermentation Products. Orient. J. Chem. 2019, 35, 744–750. [Google Scholar] [CrossRef]
- Alghamdi, A.A.; Al-Odayni, A.-B.; Saeed, W.S.; Al-Kahtani, A.; Alharthi, F.A.; Aouak, T. Efficient Adsorption of Lead (II) from Aqueous Phase Solutions Using Polypyrrole-Based Activated Carbon. Materials 2019, 12, 2020. [Google Scholar] [CrossRef]
- Sriatun, S.; Herawati, S.; Aisyah, I. Effect of Activator Type on Activated Carbon Characters from Teak Wood and The Bleaching Test for Waste Cooking Oil. J. Rekayasa Kim. Lingkung. 2020, 15, 79–89. [Google Scholar] [CrossRef]
- Kumari, G.; Soni, B.; Karmee, S.K. Synthesis of Activated Carbon from Groundnut Shell Via Chemical Activation. JIEIE 2022, 103, 15–22. [Google Scholar] [CrossRef]
- Wan Mahmood, W.N.; Samsuddin, R.; Deris, R.R.R. Chemical Activation of Durian Shell Activated Carbon: Effects of Activation Agents. Adv. Mat. Res. 2015, 1113, 242–247. [Google Scholar] [CrossRef]
- Liu, Y.; Yao, X.; Wang, Z.; Li, H.; Shen, X.; Yao, Z.; Qian, F. Synthesis of Activated Carbon from Citric Acid Residue by Phosphoric Acid Activation for the Removal of Chemical Oxygen Demand from Sugar-Containing Wastewater. Environ. Eng. Sci. 2019, 36, 656–666. [Google Scholar] [CrossRef]
- Wu, H.; Zhang, T.; Pan, R.; Chun, Y.; Zhou, H.; Zhu, W.; Peng, H.; Zhang, Q. Sintering-Free Preparation of Porous Ceramsite Using Low-Temperature Decomposing Pore Former and Its Sound-Absorbing Performance. Constr. Build. Mater. 2018, 171, 367–376. [Google Scholar] [CrossRef]
- Shahrashoub, M.; Bakhtiari, S. The Efficiency of Activated Carbon/Magnetite Nanoparticles Composites in Copper Removal: Industrial Waste Recovery, Green Synthesis, Characterization, and Adsorption-Desorption Studies. Microporous Mesoporous Mater. 2021, 311, 110692. [Google Scholar] [CrossRef]
- Lam, S.S.; Liew, R.K.; Cheng, C.K.; Rasit, N.; Ooi, C.K.; Ma, N.L.; Ng, J.H.; Lam, W.H.; Chong, C.T.; Chase, H.A. Pyrolysis Production of Fruit Peel Biochar for Potential Use in Treatment of Palm Oil Mill Effluent. J. Environ. Manag. 2018, 213, 400–408. [Google Scholar] [CrossRef]
- Ramirez, A.P.; Giraldo, S.; Ulloa, M.; Flórez, E.; Acelas, N.Y. Production and Characterization of Activated Carbon from Wood Wastes. J. Phys. Conf. Ser. 2017, 935, 012012. [Google Scholar] [CrossRef]
- Kamaruddin, M.; Mohd Suffian, Y.; Azmier, M. Optimization of Durian Peel Based Activated Carbon Preparation Conditions for Ammoniacal Nitrogen Removal from Semi-Aerobic Landfill Leachate. J. Sci. Ind. Res. 2011, 70, 554–560. [Google Scholar]
- Kamaruddin, M.A.; Yusoff, M.S.; Ahmad, M.A. Optimization of Preparation Conditions for Durian Peel-Based Activated Carbon for the Removal of COD and Ammoniacal Nitrogen (NH3-N) Using Response-Surface Methodology. Kuwait J. Sci. Eng. 2012, 39, 37–58. [Google Scholar]
- Tey, J.P.; Careem, M.A.; Yarmo, M.A.; Arof, A.K. Durian Shell-Based Activated Carbon Electrode for EDLCs. Ionics 2016, 22, 1209–1216. [Google Scholar] [CrossRef]
- Tham, Y.J.; Latif, P.A.; Abdullah, A.M.; Shamala-Devi, A.; Taufiq-Yap, Y.H. Performances of Toluene Removal by Activated Carbon Derived from Durian Shell. Bioresour. Technol. 2011, 102, 724–728. [Google Scholar] [CrossRef] [PubMed]
- Ismail, A.; Sudrajat, H.; Jumbianti, D. Activated Carbon from Durian Seed by H3PO4 Activation: Preparation and Pore Structure Characterization. Indo. J. Chem. 2010, 10, 36–40. [Google Scholar] [CrossRef]
- Tamjid Farki, N.N.A.N.L.; Abdulhameed, A.S.; Surip, S.N.; ALOthman, Z.A.; Jawad, A.H. Tropical Fruit Wastes Including Durian Seeds and Rambutan Peels as a Precursor for Producing Activated Carbon Using H3PO4-Assisted Microwave Method: RSM-BBD Optimization and Mechanism for Methylene Blue Dye Adsorption. Int. J. Phytoremediat. 2023, 25, 1–12. [Google Scholar] [CrossRef] [PubMed]
- Wang, X.; Li, D.; Li, W.; Peng, J.; Xia, H.; Zhang, L.; Guo, S.; Chen, G. Optimization of Mesoporous Activated Carbon from Coconut Shells by Chemical Activation with Phosphoric Acid. Bioresources 2013, 8, 6184–6195. [Google Scholar] [CrossRef]
- Li, Y.; Ding, X.; Guo, Y.; Wang, L.; Rong, C.; Qu, Y.; Ma, X.; Wang, Z. A Simple and Highly Effective Process for the Preparation of Activated Carbons with High Surface Area. Mater. Chem. Phys. 2011, 127, 495–500. [Google Scholar] [CrossRef]
- Lim, W.C.; Srinivasakannan, C.; al Shoaibi, A. Cleaner Production of Porous Carbon from Palm Shells through Recovery and Reuse of Phosphoric Acid. J. Clean. Prod. 2015, 102, 501–511. [Google Scholar] [CrossRef]
- Arshadi, M.; Shakeri, H.; Salvacion, J.W.L. A Green Adsorbent for the Removal of BTEX from Aqueous Media. RSC Adv. 2016, 6, 14290–14305. [Google Scholar] [CrossRef]
- Ahmad, M.A.; Ahmad Puad, N.A.; Bello, O.S. Kinetic, Equilibrium and Thermodynamic Studies of Synthetic Dye Removal Using Pomegranate Peel Activated Carbon Prepared by Microwave-Induced KOH Activation. Water Resour. Ind. 2014, 6, 18–35. [Google Scholar] [CrossRef]
- Demiral, H.; Güngör, C. Adsorption of Copper(II) from Aqueous Solutions on Activated Carbon Prepared from Grape Bagasse. J. Clean. Prod. 2016, 124, 103–113. [Google Scholar] [CrossRef]
- Rattanapan, S.; Srikram, J.; Kongsune, P. Adsorption of Methyl Orange on Coffee Grounds Activated Carbon. Energy Procedia 2017, 138, 949–954. [Google Scholar] [CrossRef]
- Thue, P.S.; Lima, E.C.; Sieliechi, J.M.; Saucier, C.; Dias, S.L.P.; Vaghetti, J.C.P.; Rodembusch, F.S.; Pavan, F.A. Effects of First-Row Transition Metals and Impregnation Ratios on the Physicochemical Properties of Microwave-Assisted Activated Carbons from Wood Biomass. J. Colloid. Interface Sci. 2017, 486, 163–175. [Google Scholar] [CrossRef] [PubMed]
- Belhamdi, B.; Merzougui, Z.; Laksaci, H.; Trari, M. The Removal and Adsorption Mechanisms of Free Amino Acid L-Tryptophan from Aqueous Solution by Biomass-Based Activated Carbon by H3PO4 Activation: Regeneration Study. Phys. Chem. Earth Parts A/B/C 2019, 114, 102791. [Google Scholar] [CrossRef]
- Wang, J.; Tang, J. Fe-Based Fenton-like Catalysts for Water Treatment: Preparation, Characterization and Modification. Chemosphere 2021, 276, 130177. [Google Scholar] [CrossRef]
- Aliakbari, Z.; Younesi, H.; Ghoreyshi, A.A.; Bahramifar, N.; Heidari, A. Production and Characterization of Sewage-Sludge Based Activated Carbons Under Different Post-Activation Conditions. Waste Biomass Valorization 2018, 9, 451–463. [Google Scholar] [CrossRef]
- Alam, M.M.; Hossain, M.A.; Hossain, M.D.; Johir, M.A.H.; Hossen, J.; Rahman, M.S.; Zhou, J.L.; Hasan, A.T.M.K.; Karmakar, A.K.; Ahmed, M.B. The Potentiality of Rice Husk-Derived Activated Carbon: From Synthesis to Application. Processes 2020, 8, 203. [Google Scholar] [CrossRef]
- Bakar, N.A.; Othman, N.; Yunus, Z.M.; Altowayti, W.A.H.; Al-Gheethi, A.; Asharuddin, S.M.; Tahir, M.; Fitriani, N.; Mohd-Salleh, S.N.A. Nipah (Musa Acuminata Balbisiana) Banana Peel as a Lignocellulosic Precursor for Activated Carbon: Characterization Study after Carbonization Process with Phosphoric Acid Impregnated Activated Carbon. Biomass Convers. Biorefin 2021, 13, 11085–11098. [Google Scholar] [CrossRef]
- Owkusumsirisakul, J.; Keeriang, T.; Laosiripojana, N.; Issro, C. Investigation on the Effects of Carbonization Parameters on Carbon Material Produced from Durian Shell. Biomass Convers. Biorefin 2022, 12, 4719–4727. [Google Scholar] [CrossRef]
- Saad, M.J.; Chia, C.H.; Zakaria, S.; Sajab, M.S.; Misran, S.; Abdul Rahman, M.H.; Chin, S.X. Physical and Chemical Properties of the Rice Straw Activated Carbon Produced from Carbonization and KOH Activation Processes. Sains Malays. 2019, 48, 385–391. [Google Scholar] [CrossRef]
- Babinszki, B.; Jakab, E.; Sebestyén, Z.; Blazsó, M.; Berényi, B.; Kumar, J.; Krishna, B.B.; Bhaskar, T.; Czégény, Z. Comparison of Hydrothermal Carbonization and Torrefaction of Azolla Biomass: Analysis of the Solid Products. J. Anal. Appl. Pyrolysis 2020, 149, 104844. [Google Scholar] [CrossRef]
- Yuliusman; Ayu, M.P.; Hanafi, A.; Nafisah, A.R. Activated Carbon Preparation from Durian Peel Wastes Using Chemical and Physical Activation. AIP Conf. Proc. 2020, 2230, 030020. [Google Scholar]
- Han, Q.; Wang, J.; Goodman, B.A.; Xie, J.; Liu, Z. High Adsorption of Methylene Blue by Activated Carbon Prepared from Phosphoric Acid Treated Eucalyptus Residue. Powder Technol. 2020, 366, 239–248. [Google Scholar] [CrossRef]
- Sujiono, E.H.; Zabrian, D.; Zurnansyah; Mulyati; Zharvan, V.; Samnur; Humairah, N.A. Fabrication and Characterization of Coconut Shell Activated Carbon Using Variation Chemical Activation for Wastewater Treatment Application. Results Chem. 2022, 4, 100291. [Google Scholar] [CrossRef]
- Singh, C.K.; Sahu, J.N.; Mahalik, K.K.; Mohanty, C.R.; Mohan, B.R.; Meikap, B.C. Studies on the Removal of Pb(II) from Wastewater by Activated Carbon Developed from Tamarind Wood Activated with Sulphuric Acid. J. Hazard. Mater. 2008, 153, 221–228. [Google Scholar] [CrossRef] [PubMed]
- Gupta, H.; Gogate, P.R. Intensified Removal of Copper from Waste Water Using Activated Watermelon Based Biosorbent in the Presence of Ultrasound. Ultrason. Sonochem. 2016, 30, 113–122. [Google Scholar] [CrossRef] [PubMed]
- Yakout, S.M.; Sharaf El-Deen, G. Characterization of Activated Carbon Prepared by Phosphoric Acid Activation of Olive Stones. Arab. J. Chem. 2016, 9, S1155–S1162. [Google Scholar] [CrossRef]
- İzgi, M.S.; Saka, C.; Baytar, O.; Saraçoğlu, G.; Şahin, Ö. Preparation and Characterization of Activated Carbon from Microwave and Conventional Heated Almond Shells Using Phosphoric Acid Activation. Anal. Lett. 2019, 52, 772–789. [Google Scholar] [CrossRef]
- Feng, P.; Li, J.; Wang, H.; Xu, Z. Biomass-Based Activated Carbon and Activators: Preparation of Activated Carbon from Corncob by Chemical Activation with Biomass Pyrolysis Liquids. ACS Omega 2020, 5, 24064–24072. [Google Scholar] [CrossRef]
- Musthapa, S.M.B.H.; Shams, S.; Reddy Prasad, D.M. Removal of Pollutants from Wastewater Using Activated Carbon from Durian Peel. IOP Conf. Ser. Earth Environ. Sci. 2023, 1135, 012001. [Google Scholar] [CrossRef]
- Zakaria, R.; Jamalluddin, N.A.; Abu Bakar, M.Z. Effect of Impregnation Ratio and Activation Temperature on the Yield and Adsorption Performance of Mangrove Based Activated Carbon for Methylene Blue Removal. Results Mater. 2021, 10, 100183. [Google Scholar] [CrossRef]
- Eke-emezie, N.; Etuk, B.R.; Akpan, O.P.; Chinweoke, O.C. Cyanide Removal from Cassava Wastewater onto H3PO4 Activated Periwinkle Shell Carbon. Appl. Water Sci. 2022, 12, 157. [Google Scholar] [CrossRef]
Disclaimer/Publisher’s Note: The statements, opinions and data contained in all publications are solely those of the individual author(s) and contributor(s) and not of MDPI and/or the editor(s). MDPI and/or the editor(s) disclaim responsibility for any injury to people or property resulting from any ideas, methods, instructions or products referred to in the content. |
© 2023 by the authors. Licensee MDPI, Basel, Switzerland. This article is an open access article distributed under the terms and conditions of the Creative Commons Attribution (CC BY) license (https://creativecommons.org/licenses/by/4.0/).