Article

Photocatalytic and Glucose Sensing Properties of ZnO-Based Nanocoating

1
Faculty of General Education, Kazakh-British Technical University, Almaty 050000, Kazakhstan
2
Department of Physics, Khoja Akhmet Yassawi International Kazakh-Turkish University, Turkestan 161200, Kazakhstan
3
Research Group altAir Nanolab, Almaty 050000, Kazakhstan
*
Author to whom correspondence should be addressed.
ChemEngineering 2023, 7(2), 22; https://doi.org/10.3390/chemengineering7020022
Submission received: 25 October 2022 / Revised: 18 November 2022 / Accepted: 22 November 2022 / Published: 9 March 2023

Abstract

:
Here, we report a simple and versatile synthesis of low-dimensional ZnO nanosheet (NS) arrays modified with Fe2O3 (hematite) to assemble photocatalytic coatings and non-enzymatic glucose sensors. Photocatalytic coatings made of widespread elements (zinc and iron) were tested for methylene blue (MB) dye decolorization under ultraviolet and visible (UV-vis) irradiation. A comparative study of unmodified and modified ZnO NS photocatalysts revealed a significant decrease in the dye concentration in 180 min when ZnO/Fe2O3 arrays were used. Size dependence efficiency of the hematite layer deposited onto ZnO is presented. A study of the sensitivity of biosensors made of ZnO nanostructures and ZnO/Fe2O3 nanocomposites for glucose detection showed an improvement in sensitivity with increased Fe2O3 thickness. The structure and morphology of low-dimensional coatings were studied by X-ray diffraction (XRD), scanning electron microscopy (SEM), and energy dispersive X-ray analysis (EDX). The optical properties of nanoarrays showed a red shift of absorption after modifying ZnO with hematite layers, which holds good promise for expanding photocatalytic activity in the visible region.

1. Introduction

Nanomaterials and technologies for their production have been developed in recent decades and are the subject of wide attention. The large surface area of nano-objects compared to bulk materials, electronic and quantum effects, altered mechanical properties, etc., led to a scientific boom in nanotechnology. Many spheres of life, from architecture and cosmetology to medicine, involve nanomaterials [1]. The remarkable achievements in the catalysis field are worth noting since nanomaterials have many catalytic sites that facilitate catalytic reactions [2].
Modern industrial technologies use huge volumes of chemical industry products. Today, chemical processing is implemented in textile production, pharmaceuticals, paint, varnish production, furniture and household appliances, the automotive and petroleum industry, and more [3]. The above is an integral part of society but causes great harm to the planet’s ecology. Moreover, since many chemical industries dispose of waste into the water, the issue of water purification from organic pollutants is acute. The scientific community is of great interest in developing water purification systems based on photocatalysts [4,5,6,7]. Photocatalytic reaction in an aqueous solution can occur on the surface of a water-dispersed powder, coatings, and thin films [8,9,10]. Among several semiconductor materials that exhibit photocatalytic properties, ZnO remains one of the most interesting [11,12,13,14]. Such interest is justified by excellent electrical properties, high electron mobility, high thermal conductivity, and high exciton binding energy. The listed properties allow the broad application of ZnO in optoelectronics, transparent electronics, laser, cosmetics, thermal and mechanical resistance [15], antibacterial coatings, and sensor equipment [16,17,18,19]. The exploitation of semiconductors in sensor devices is relevant. The use of ZnO in glucose level sensors is promising due to its electrochemical activity, and high isoelectric points which promote enzyme adsorption [20]. Improving the sensitivity of blood glucose sensors will help with diseases such as diabetes [21].
Iron is an abundant and essential element in the Earth’s crust [22], thus its use is economically practical. The oxidation of iron to the α-Fe2O3 (hematite) phase is formed with the acquisition of semiconductor properties. Hematite is an n-type semiconductor material, which is widespread, for example, as a material for magnetism, lithium-ion batteries, and gas sensors [23]. Hematite crystallizes in a trigonal system with space group R-3c; oxygen atoms in the α-Fe2O3 structure are arranged similarly in the form of corundum [24]. The packing of O2- anions in the structure of hematite occurs in a hexagonal closed lattice along [001]. Semiconductor α-Fe2O3 is stable in most electrolytes at pH > 3 and has a relatively narrow band gap of 2–2.2 eV, sufficient to use approximately 40% of the sunlight on the Earth’s surface. In addition, the material is widespread, inexpensive, and environmentally friendly [25]. In addition to good chemical stability, hematite has a valence band edge level (+1.6 V/SCE at pH 14) suitable for photoinduced oxygen evolution from water [26]. Although hematite thin films and powders are widely studied as photocatalysts, the photoactivity of α-Fe2O3 is limited by some factors, including poor electrical conductivity and slow kinetics of the oxygen evolution reaction [27], and the high recombination rate of electron-hole pairs [28]. Therefore, the strategy of coupling hematite with other materials is promising. Semiconductor mixing (i.e., composite formation) has several advantages, such as developing photocatalysts that respond to visible light. An additional benefit of composites is reducing the probability of carrier recombination through interparticle electron transfer [29,30,31].
This paper studies the photocatalytic and non-enzymatic glucose sensing properties of synthesized ZnO/Fe2O3 nanocomposites. Versatile synthesis procedure along with material characterization reported.

2. Materials and Methods

Synthesizing ZnO NS via electrochemical deposition includes the exploitation of indium tin oxide (ITO) coated glass with a resistance of 8 Ω/cm2, KCl, and Zn(NO3)2 × 6H2O. Modifying the ZnO NS array with hematite via spin-coating includes the operation of FeCl3 and ethylene. All chemicals were purchased from Sigma Aldrich and used without purification.
Electrochemical deposition of ZnO NS consists of forming thin coatings on the surface of ITO glass. The ITO glass acts as the working electrode in a three-electrode chemical cell. Ag/AgCl and platinum foil act as the reference and countercurrent electrodes, respectively. The capacity of the electrochemical cell was 50 mL. The electrolyte consisted of 0.5 M Zn(NO3)2 × 6H2O and 0.5 M KCl. The temperature of the working solution was 80 °C. The working potential was set to negative 0.8 V. The duration was 30 min. Afterwards, deposition samples were thoroughly washed and annealed in a muffle furnace at 500 °C for 2 h.
Hematite layers were deposited on the surface of the ZnO NS array by a spin-coating method explained elsewhere [32]. Briefly, one layer formation includes: dosed portions of 0.02 M FeCl3 dissolved in 96% ethanol were deposited on a rotating ZnO NS matrix. The angular velocity was 1500 rpm. After deposition of each single layer, samples were calcinated at 300 °C for 10 min. Calcination is needed to remove chlorine from the resulting film and oxidize iron residues. Annealing the samples at 450 °C for 1 h results in good contact of the heterogeneous interface of ZnO/Fe2O3. A schematic representation of hematite deposition is depicted in Figure 1.
Using the described method, four samples were obtained for testing in photocatalysis and glucose concentration sensors. One, two, and three layers of deposited Fe2O3 formed nanocomposites ZnO/Fe2O3 which were marked in this work as ZnO NS/Hematite1, ZnO NS/Hematite, and ZnO NS/Hematite3, respectively.
Photocatalytic dye decolorization was investigated in MB solution with concentration of 10 mg/L. A UV-vis light source was used as illuminator. The electrolyte for glucose sensing consisted of 0.1 M phosphate-buffered saline with different amounts of glucose (1–5 mM).
The optical transmission spectra were measured on a two-beam Specord plus UV/Vis spectrophotometer (Analytik). The current-voltage characteristics of the samples were measured by the potentiostatic method on an Ellins P-2X potentiostat/galvanostat. The phase composition and crystal structure were studied with an X’pert PRO X-ray diffractometer (PANalitical). The morphology and elemental composition were studied using JSM-6490 LA (JEOL) and MIRA 3LMU (Tescan) scanning electron microscopes with a directly heated tungsten cathode.

3. Results and Discussion

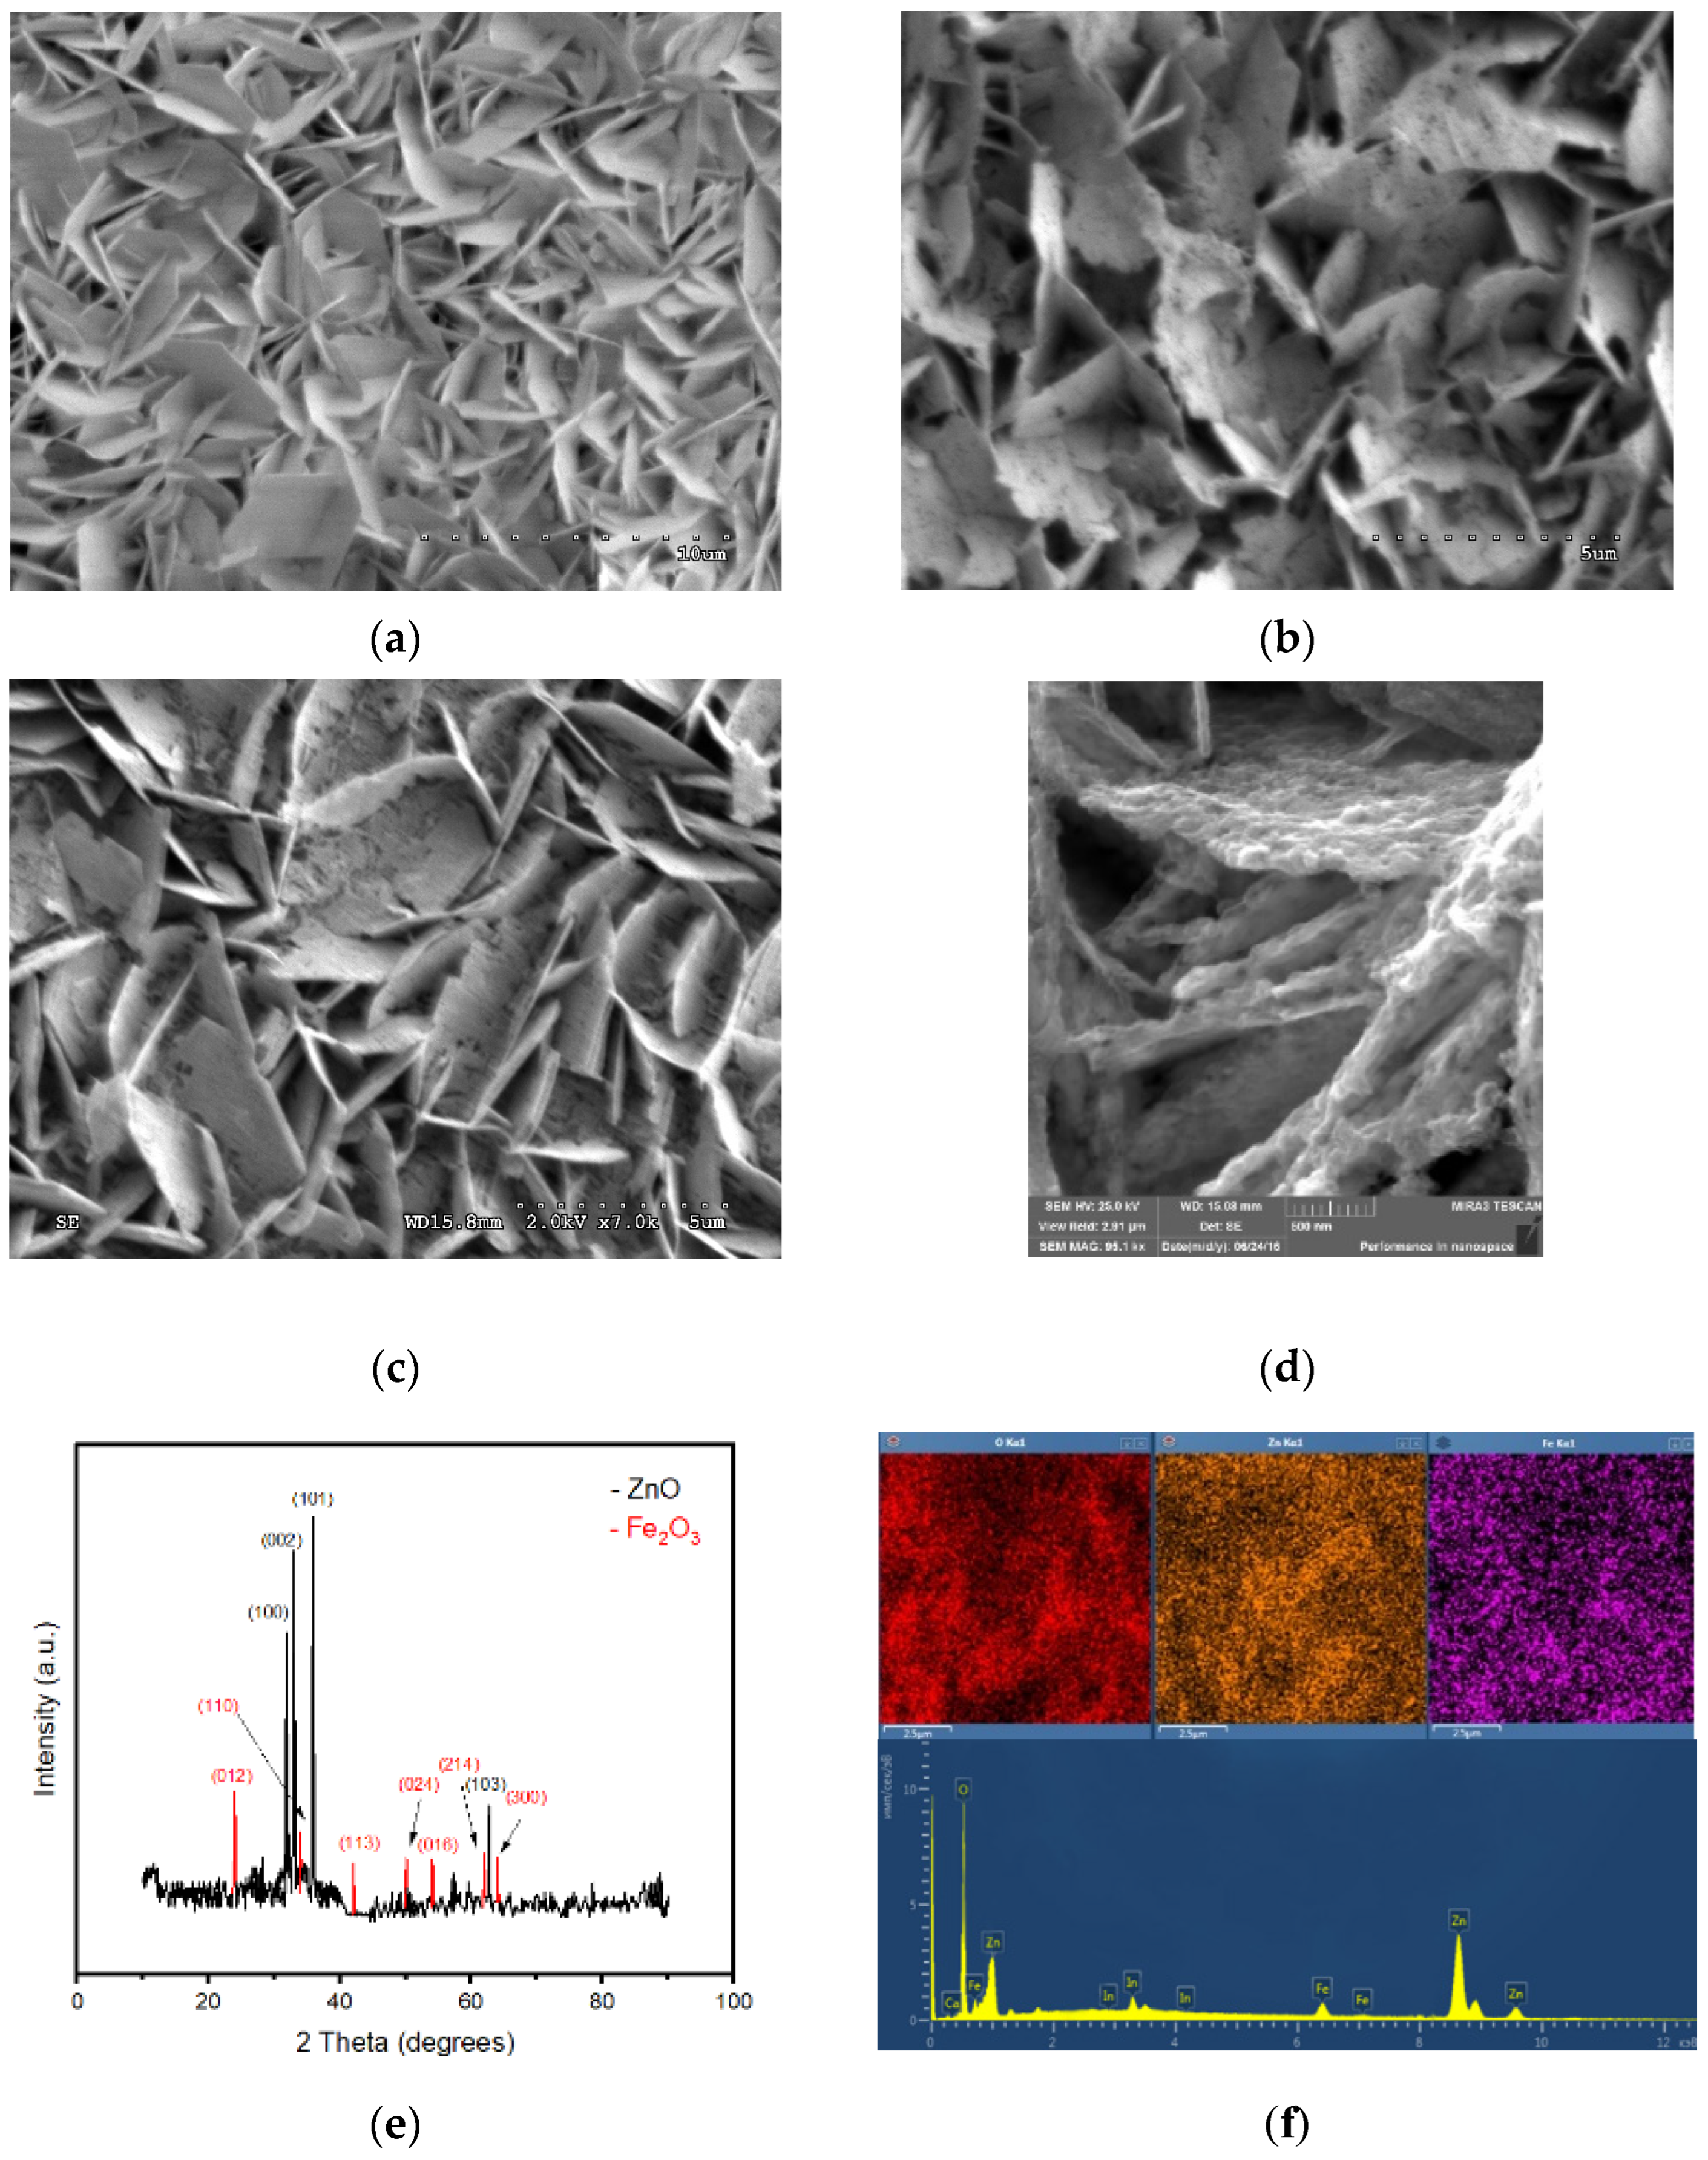
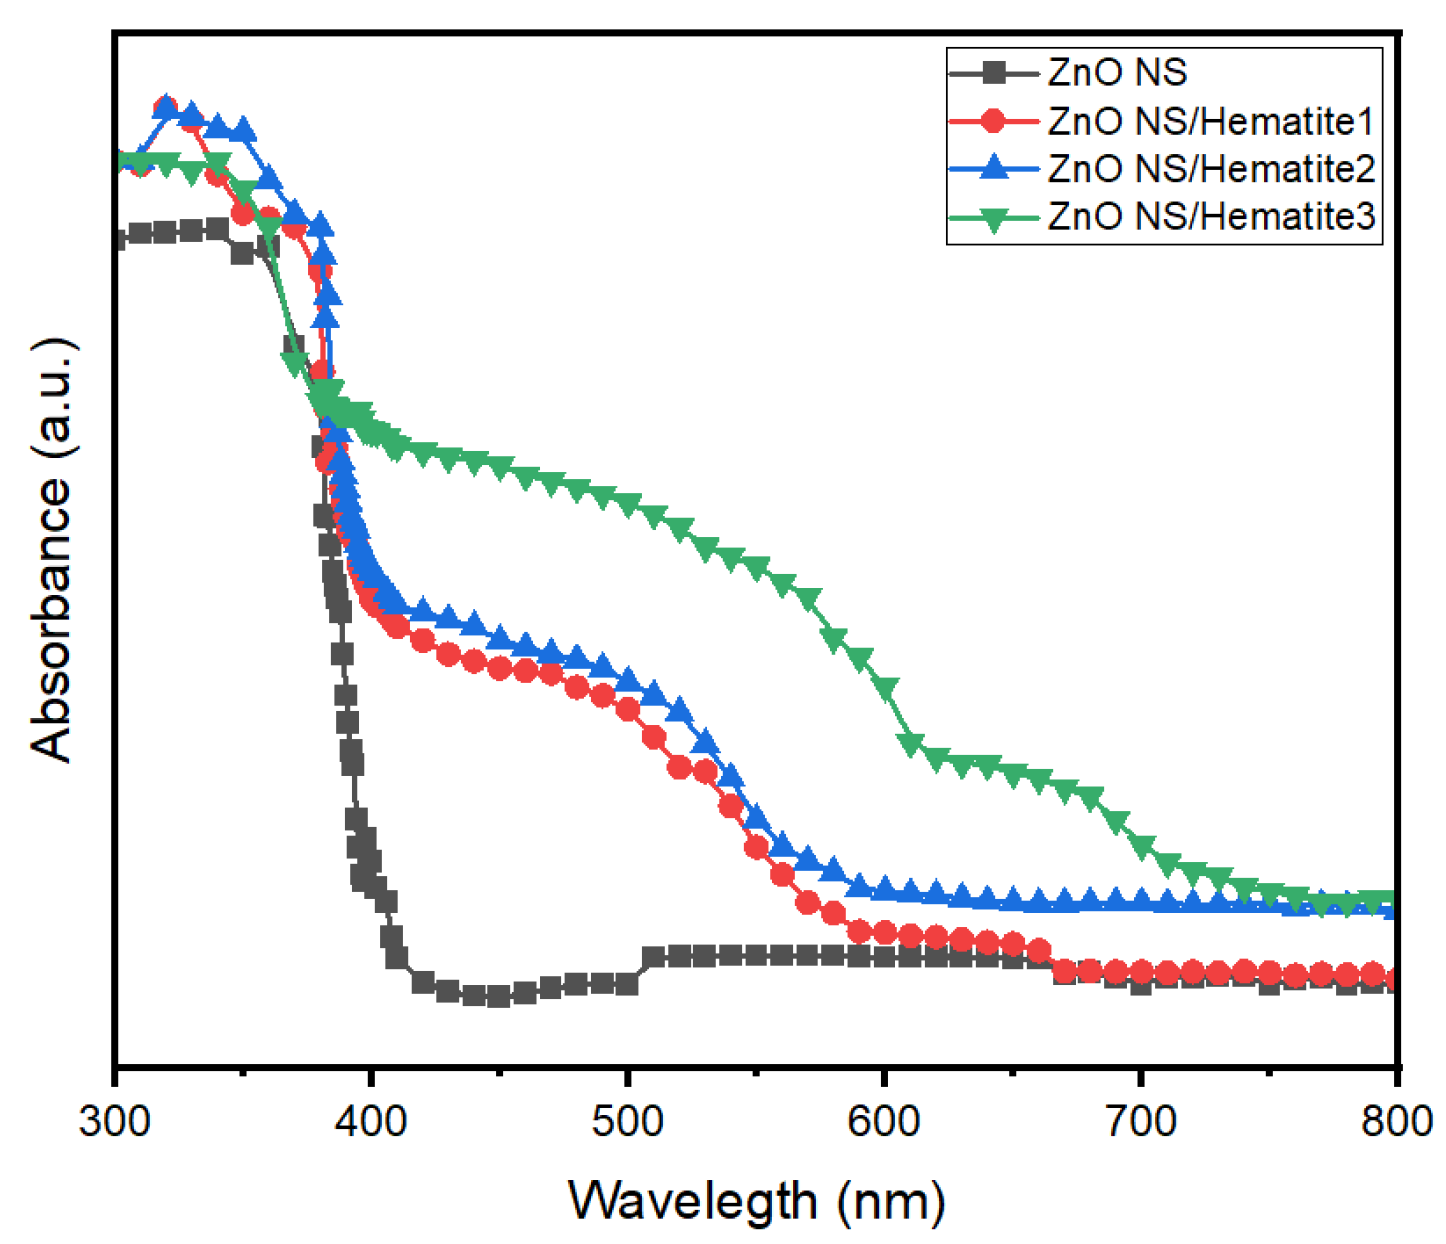
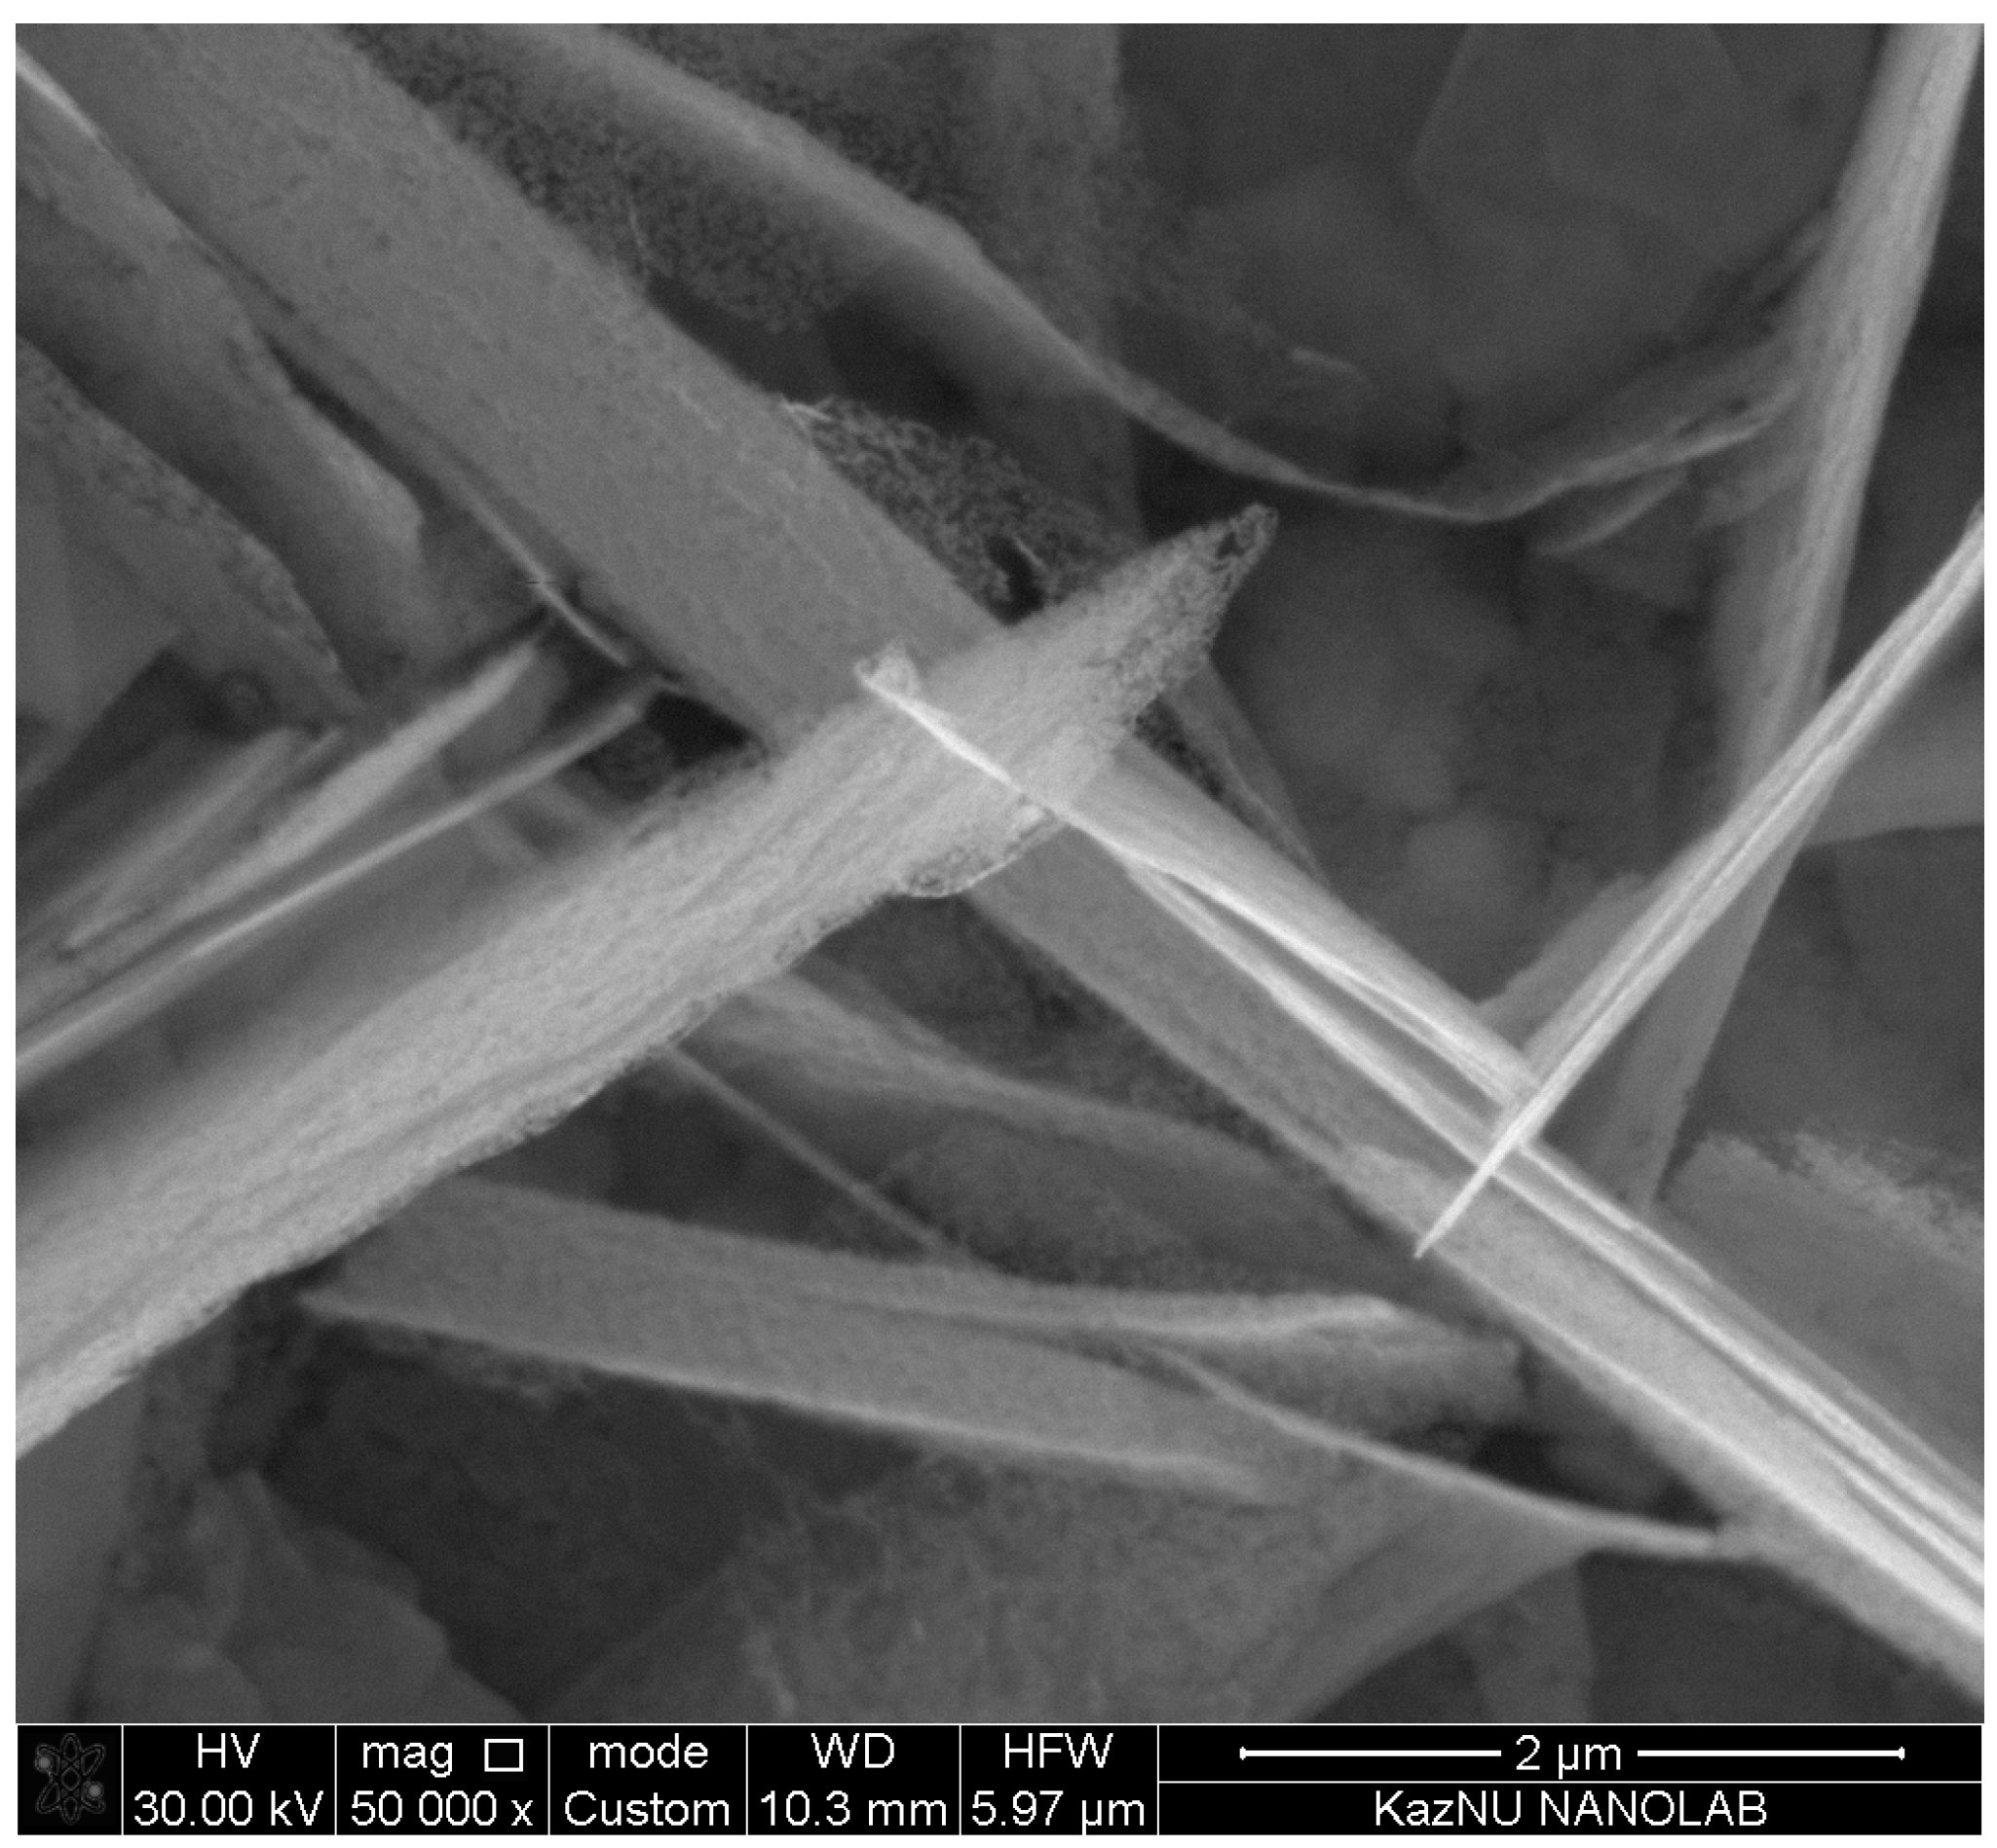
3.1. Sample Characterization

A typical SEM image in Figure 2a demonstrates that the unmodified film consists of uniform sheet-like nanostructures. The surfaces of these sheets are smooth, with a thickness of up to 10 nm. Figure 2b shows a micrograph of a ZnO NS modified with a single layer of hematite (ZnO NS/Hematite1). After modification, the side faces of the sheet-like structures of ZnO plaque formed as small objects, the distribution of which is heterogeneous and rare. Repeated modification led to the formation of a rich deposit both on the side surfaces and between the nanosheets (Figure 2c). The formation of the core-shell structure began to appear after the third spin-coating cycle of Fe2O3 deposition (Figure 2d). Figure 2d clearly shows that the hematite layer exactly repeats the shape of the matrix ZnO NS, and forms ZnO NS/Hematite3 heterostructure. Lastly, it was decided to study the structure of obtained samples. XRD analysis, shown in Figure 2e, showed that the ZnO NS grown exhibited a hexagonal wurtzite crystalline structure. The most intense peaks are (100), (002), and (101), which demonstrate that the growth pattern is perpendicular to the ITO glass surface and oriented along the c-axis. The non-ZnO peaks are identified as Fe2O3 and assigned to the single-phase α-Fe2O3. The XRD pattern of ZnO/Fe2O3 is well-defined and confirms the good crystallinity of the nanocomposite.
Figure 2f illustrates EDX analysis of ZnO NS/Hematite3. Map distribution of elements shows that only iron, oxygen, and zinc were identified on the surface of the samples. EDX spectra show that the most intense peaks belong to oxygen and zinc. Iron peaks show less intensity, which explains the low thickness of the F2O3 shell layer. Other peaks correspond to the ITO substrate.
Figure 3 shows UV-visible absorption spectra for ZnO NS coatings and ZnO/Fe2O3 arrays. The black curve describes the absorption pattern of UV light by the ZnO NS arrays. The material exhibits sensitivity only in the UV range with the absorption of electromagnetic waves up to 383 nm. A slight increase in absorption is observed in the length range of 500–670 nm, which can be explained by light scattering on a rough surface of the NS. Judging from the mutual arrangement of the black and red curves, one can see the absorption edge shifts for ZnO/Fe2O3. After modification with hematite layers, arrays of nanostructures acquired sensitivity to visible light up to 600 nm. The deposition of the second and third layers of hematite improved the visible light absorption ability of the ZnO NS coatings (Figure 3, blue and green curves, respectively). Since optical studies have shown the sensitivity of the ZnO/Fe2O3 nanocomposite to UV and visible light, the use of the material is promising in photocatalysis. Therefore, their photocatalytic activity was evaluated by the decomposition of MC under the action of light.

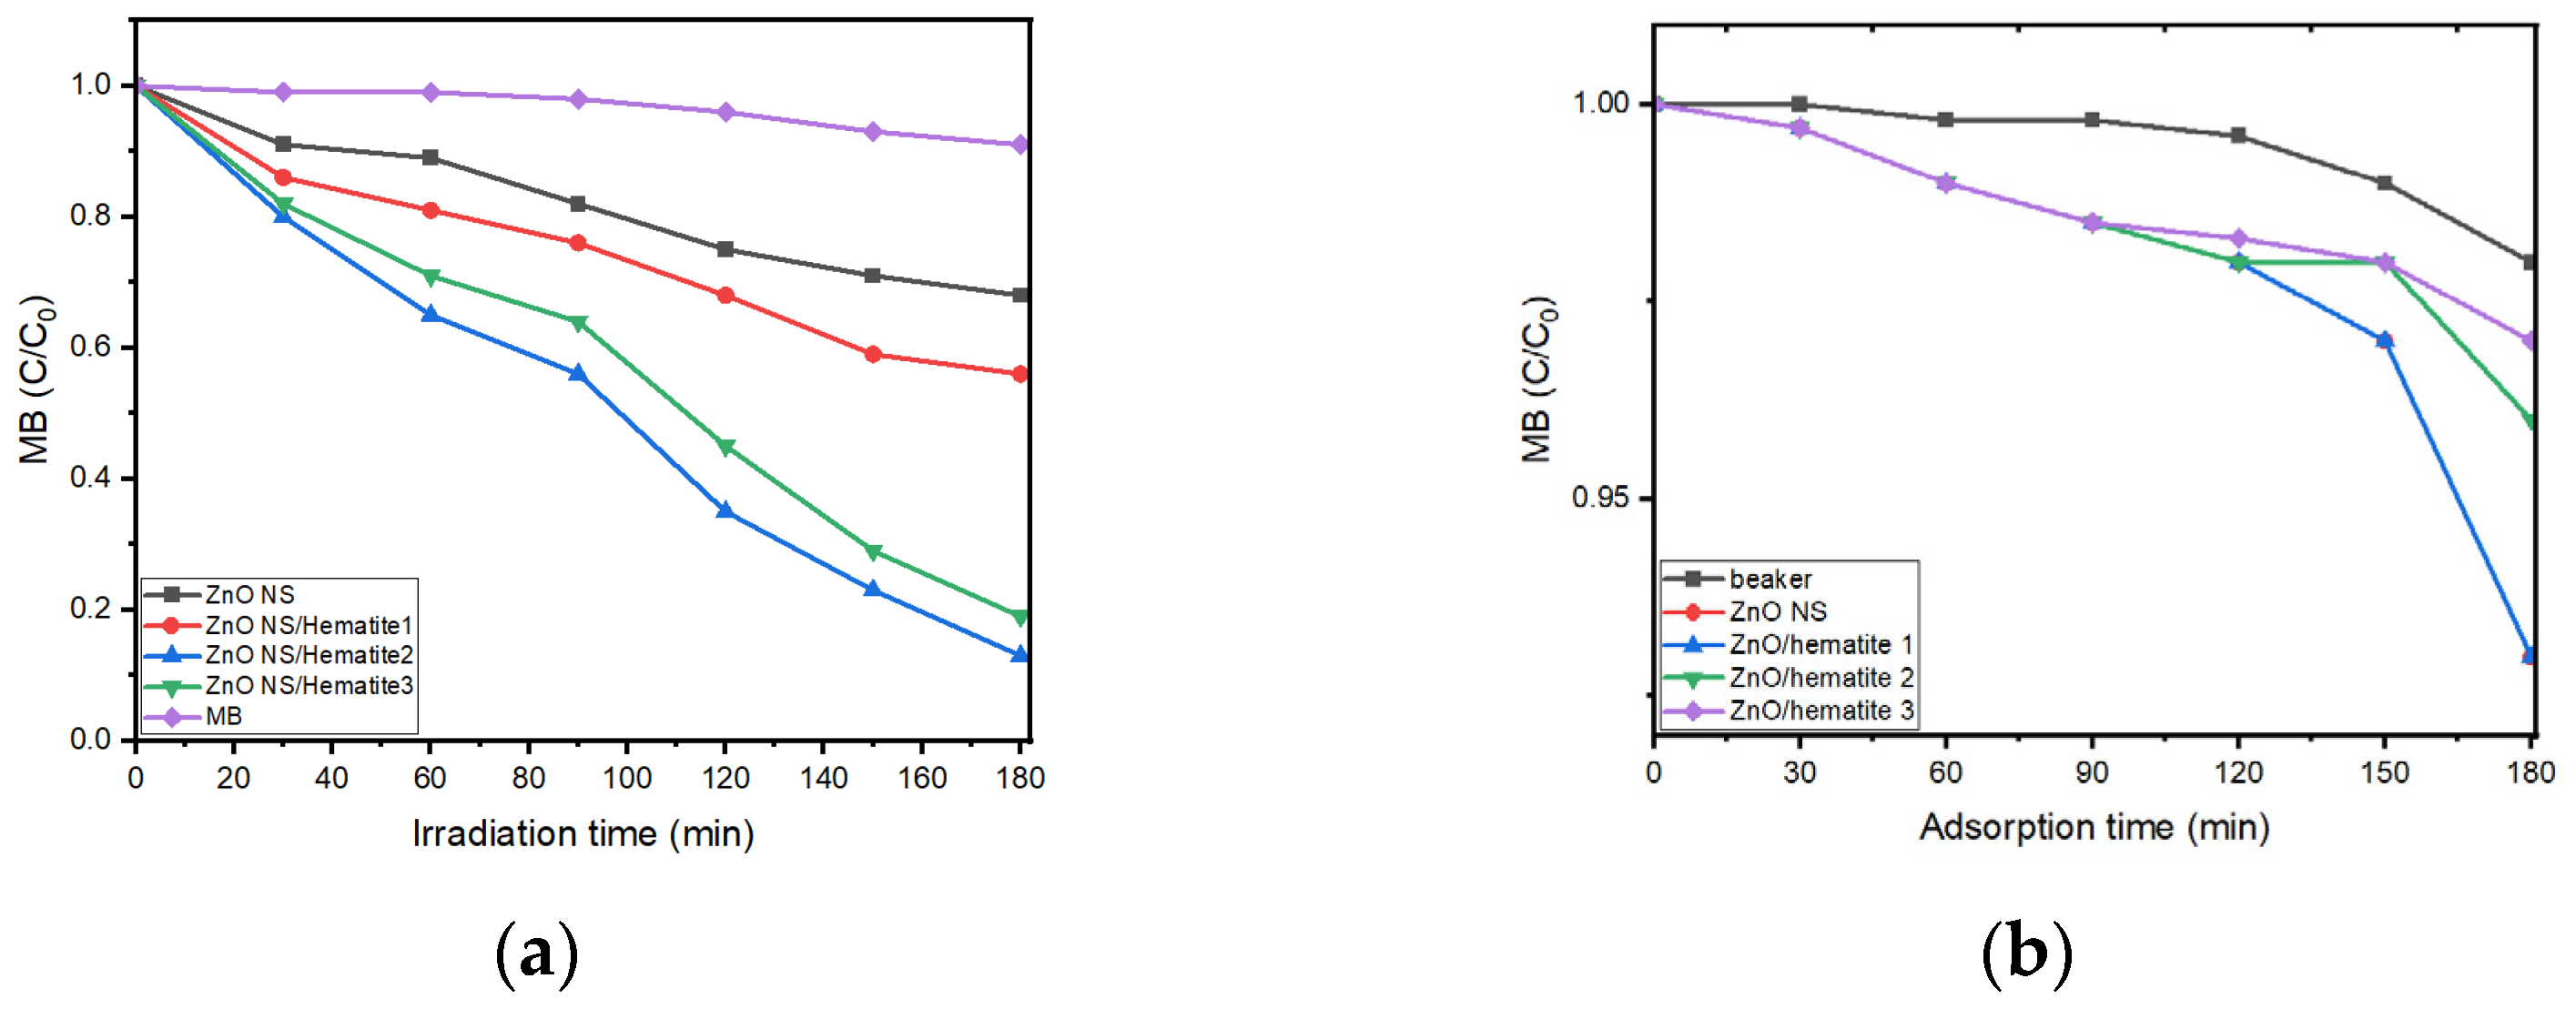
3.2. Photocatalytic Activity

The photocatalytic reaction of dye decomposition begins after the absorption of light by the semiconducting material (1):
Z n O @ F e 2 2 O 3 + h ν Z n O @ F e 2 2 O 3 ( h v b + + e c b )
A photon ( h ν ) with an energy equal to or greater than the band gap excites electrons ( e ) in the valence band ( v b ) of semiconductors. Such an excited state allows the energy transition of electrons from the valence band to the conduction band ( c b ). Thus, the valence band is saturated with holes ( h v b + ), and the conduction band is saturated with electrons ( e c b ). In aqueous solutions containing dyes or other polluting organic molecules, the main function of their decomposition is performed by h v b + . At the semiconductor-solution interface, h v b +   draw electrons from the molecules or ions of the liquid, thus forming hydroxyls. These radicals react with pollutants and decompose organic molecules as follows (2):
Z n O @ F e 2 2 O 3 ( h v b + + e c b ) + H 2 O a q Z n O @ F e 2 2 O 3 ( e c b ) + H ( a q ) + + O H ( a q )
Figure 4a shows the time dependence of the change in the relative concentration of C/C0 (where C is the initial concentration of the dye, and C0 is the real concentration at different times) for MB under UV-vis irradiation. The change in C/C0 for the dye was studied by irradiating a photocatalyst as substrate coating. The photocatalyst was placed in a beaker with dye solution at 45° to the bottom plane. The UV-vis irradiation source was located 10 cm from the side wall of the glass. Since there was glass in the path of the light, the UV part of the incident light was no shorter than 300 nm. The contact surface area of the photoactive material and electrolyte surface for all samples is 1 cm2. A comparison of the black and red curves (ZnO NS and ZnO/Hematite1, respectively) shows a slight change in the concentration of the dye solution over 180 min. The contribution of the ZnO/Hematite1 is insignificant for photocatalysis but indicates the activation of the material. It is noteworthy that samples with a two-layer modification of ZnO NS with hematite exhibit better photocatalytic abilities than ZnO/Hematite3 (Figure 4a, blue and green curves, respectively). Optimizing the thickness and roughness of the active layer leads to an increase in light absorption by the semiconductor material. The particle’s size and crystallinity affect photogenerated charge carriers’ rates of separation and migration. The higher the crystallinity, the lower the defects; therefore, the higher the probability of charge carrier migration to the centers of redox reactions. Defects act as carrier trapping and recombination centers for photogenerated electrons and holes. Exciton recombination processes lead to a decrease in photocatalytic activity. With a reduction of particle size, the migration distances of photogenerated electrons and holes decrease, which leads to the suppression of the recombination probabilities [33]. In other words, the likelihood of charge transport during the exciton lifetime increases with decreasing transport distances [34]. Figure 4b shows graphs of the time dependence of MB adsorption on the walls of beaker and onto the photocatalyst surface for 180 min without illumination. It should be noted that without the presence of a photocatalyst, the dye concentration changes slightly over time, within 1%, which can be assumed as an error (Figure 4b, black curve).

3.3. Bio-Sensing of Glucose Concentration

Figure 5a shows the current density versus voltage for ZnO (black curve), ZnO NS/Hematite1 (red curve), ZnO NS/Hematite2 (blue curve), and ZnO NS/Hematite3 (green curve). Graphs were recorded in the presence of 1 mM glucose in the electrolyte. The behavior of ZnO NS and ZnO NS/Hematite1 curves is very close. This is explained by the functional similarity of the samples since a single modification does not significantly contribute to forming a good layer of hematite on the ZnO NS matrix. A comparison of the obtained results with the results of [35] shows that the morphology of pure ZnO does not affect the photocurrent density.
The blue curve has a significant increase in current density, which confirms the qualitative contribution of iron oxide to the electrochemistry of the ZnO/Fe2O3 nanocomposite. The increased thickness of hematite layer onto ZnO NS increases response in current density. The assembled coatings’ sensitivity to glucose concentration in solution was studied for ZnO/Hematite3 samples since they showed the highest current density. Figure 5b shows the I-V characteristics of the sample recorded at different glucose concentrations from 1 to 5 mM. The two boundary curves, black (lower current density) and purple (higher current density), correspond to 1 mM and 5 mM glucose concentrations, respectively. The assembled coatings have a particular sensitivity to glucose concentration in solution and potential applicability. At the same time, the relevance of pure ZnO remains questionable due to the degradation and corrosion of the material in electrolytes. A micrographic image of pure ZnO analyzed after four cycles of measurements is shown in Figure 6. Comparison of Figure 2a and Figure 6 reveals that pores appeared on the side surfaces of the nanoplates, which may indicate corrosion or degradation of the material, which reduces the life of the sensors. SEM analysis of ZnO/Hematite3 revealed no changes in morphology before and after I-V measurements of glucose sensing, which indirectly indicates the durability potential of the nanocomposite. Figure 5c shows the time response curve of the sensor coating as a function of glucose concentration. Current density at 2.5 V was recorded for different glucose concentrations, which was sequentially increased after adding 1 mM of glucose. The current did not grow immediately after increasing the concentration but noticeably quickly, within 10–13 s. This behavior of the current density is typical for electrodes with a significant charge transfer rate at the phase boundary. It means that ZnO/Hematite3 sensors show sufficiently good sensitivity to the level of glucose concentration, while they have good durability. Moreover, the calibrated plot represented in Figure 5d shows linearity of glucose concentration sensing between 1 and 5 mM.

4. Conclusions

In summary, we fabricated active coatings of ZnO NS and ZnO/Fe2O3 and showed their photocatalytic and a non-enzymatic sensing properties for detecting glucose in liquid phase. Vertically oriented ZnO NS poses low photocatalytic and sensing properties in comparison with core-shell nanocomposites of ZnO/Fe2O3. As a result, photocatalytic behavior of ZnO/Hematite2 revealed better properties regarding thin layers of Fe2O3. In conditions of applied voltage, electron transportation was better in ZnO/Hematite3 with a thick layer of Fe2O3, which poses better glucose sensing abilities.

Author Contributions

Conceptualization, N.B.; methodology, D.B.; formal analysis, N.B.; investigation, B.S.; resources, N.B.; data curation, B.S.; writing—original draft preparation, D.B.; writing—review and editing, N.B.; visualization, B.S. All authors have read and agreed to the published version of the manuscript.

Funding

This research was funded by the Ministry of Science and Higher Education and of the Republic of Kazakhstan, grant number AP08052381.

Institutional Review Board Statement

Not applicable.

Informed Consent Statement

Not applicable.

Data Availability Statement

Not applicable.

Acknowledgments

The authors would like to acknowledge Research David J. Nagel, School of Engineering and Applied Science, Department of Electrical Engineering, George Washington University, Washington, D.C., USA, for providing the laboratory space, consultation, and discussion of the results.

Conflicts of Interest

The authors declare no conflict of interest. The funders had no role in the design of the study; in the collection, analyses, or interpretation of data; in the writing of the manuscript, or in the decision to publish the results.

References

  1. Yanez-Sedeno, P.; Gonzalez-Cortes, A.; Campuzano, S.; Pingarron, J.M. Multimodal/Multifunctional Nanomaterials in (Bio)electrochemistry: Now and in the Coming Decade. Nanomaterials 2020, 10, 2556. [Google Scholar] [CrossRef] [PubMed]
  2. Weon, S.; Huang, D.H.; Rigby, K.; Chu, C.H.; Wu, X.H.; Kim, J.H. Environmental Materials beyond and below the Nanoscale: Single-Atom Catalysts. ACS EsT Eng. 2021, 1, 157–172. [Google Scholar] [CrossRef]
  3. Varjani, S.; Joshi, R.; Srivastava, V.K.; Ngo, H.H.; Guo, W.S. Treatment of wastewater from petroleum industry: Current practices and perspectives. Environ. Sci. Pollut. Res. 2020, 27, 27172–27180. [Google Scholar] [CrossRef] [PubMed]
  4. Hamdy, M.S. Effect of humidity on the photocatalytic degradation of gaseous hydrocarbons mixture. Mater. Chem. Phys. 2017, 197, 1–9. [Google Scholar] [CrossRef]
  5. Tian, L.; Yang, X.F.; Cui, X.K.; Liu, Q.Q.; Tang, H. Fabrication of dual direct Z-scheme g-C3N4/MoS2/Ag3PO4 photocatalyst and its oxygen evolution performance. Appl. Surf. Sci. 2019, 463, 9–17. [Google Scholar] [CrossRef]
  6. Maeda, K.; Takata, T.; Hara, M.; Saito, N.; Inoue, Y.; Kobayashi, H.; Domen, K. GaN: ZnO solid solution as a photocatalyst for visible-light-driven overall water splitting. J. Am. Chem. Soc. 2005, 127, 8286–8287. [Google Scholar] [CrossRef]
  7. Zhang, J.Y.; Pan, F.; Hao, W.; Ge, Q.; Wang, T.M. Light-storing photocatalyst. Appl. Phys. Lett. 2004, 85, 5778–5780. [Google Scholar] [CrossRef]
  8. Ahmad, H.; Kamarudin, S.K.; Minggu, L.J.; Kassim, M. Hydrogen from photo-catalytic water splitting process: A review. Renew. Sustain. Energy Rev. 2015, 43, 599–610. [Google Scholar] [CrossRef]
  9. Sun, S.D.; Yu, X.J.; Yang, Q.; Yang, Z.M.; Liang, S.H. Mesocrystals for photocatalysis: A comprehensive review on synthesis engineering and functional modifications. Nanoscale Adv. 2019, 1, 34–63. [Google Scholar] [CrossRef]
  10. Nagajyothi, P.C.; Vattikuti, S.V.P.; Devarayapalli, K.C.; Yoo, K.; Shim, J.; Sreekanth, T.V.M. Green synthesis: Photocatalytic degradation of textile dyes using metal and metal oxide nanoparticles-latest trends and advancements. Crit. Rev. Environ. Sci. Technol. 2020, 50, 2617–2723. [Google Scholar] [CrossRef]
  11. Han, Z.Z.; Ren, L.L.; Cui, Z.H.; Chen, C.Q.; Pan, H.B.; Chen, J.Z. Ag/ZnO flower heterostructures as a visible-light driven photocatalyst via surface plasmon resonance. Appl. Catal. B Environ. 2012, 126, 298–305. [Google Scholar] [CrossRef]
  12. Daneshvar, N.; Salari, D.; Khataee, A.R. Photocatalytic degradation of azo dye acid red 14 in water on ZnO as an alternative catalyst to TiO2. J. Photochem. Photobiol. a-Chem. 2004, 162, 317–322. [Google Scholar] [CrossRef]
  13. Samadi, M.; Zirak, M.; Naseri, A.; Khorashadizade, E.; Moshfegh, A.Z. Recent progress on doped ZnO nanostructures for visible-light photocatalysis. Thin Solid Film. 2016, 605, 2–19. [Google Scholar] [CrossRef] [Green Version]
  14. Xia, Y.; Wang, J.; Chen, R.; Zhou, D.; Xiang, L. A Review on the Fabrication of Hierarchical ZnO Nanostructures for Photocatalysis Application. Crystals 2016, 6, 148. [Google Scholar] [CrossRef] [Green Version]
  15. Becheri, A.; Durr, M.; Lo Nostro, P.; Baglioni, P. Synthesis and characterization of zinc oxide nanoparticles: Application to textiles as UV-absorbers. J. Nanoparticle Res. 2008, 10, 679–689. [Google Scholar] [CrossRef]
  16. Janotti, A.; Van de Walle, C.G. Fundamentals of zinc oxide as a semiconductor. Rep. Prog. Phys. 2009, 72, 126501. [Google Scholar] [CrossRef] [Green Version]
  17. Sharma, V.; Shukla, R.K.; Saxena, N.; Parmar, D.; Das, M.; Dhawan, A. DNA damaging potential of zinc oxide nanoparticles in human epidermal cells. Toxicol. Lett. 2009, 185, 211–218. [Google Scholar] [CrossRef]
  18. Gupta, T.K. Application of Zinc-Oxide varistors. J. Am. Ceram. Soc. 1990, 73, 1817–1840. [Google Scholar] [CrossRef]
  19. Nanto, H.; Minami, T.; Takata, S. Zinc-Oxide thin-film ammonia gas sensors with high-sensitivity and excellent selectivity. J. Appl. Phys. 1986, 60, 482–484. [Google Scholar] [CrossRef]
  20. Zhang, Y.; Kang, Z.; Yan, X.Q.; Liao, Q.L. ZnO nanostructures in enzyme biosensors. Sci. China Mater. 2015, 58, 60–76. [Google Scholar] [CrossRef] [Green Version]
  21. Yuan, M.; Li, J.; Yu, Y.; Fu, Y.; Fong, A.; Hu, J. Fabrication of a Fe2O3 Nanoparticles Implantation-modified Electrode and its Applications in Electrochemical Sensing. Electroanalysis 2016, 28, 954–961. [Google Scholar] [CrossRef]
  22. Riha, S.C.; Vermeer, M.J.D.; Pellin, M.J.; Hupp, J.T.; Martinson, A.B.F. Hematite-based Photo-oxidation of Water Using Transparent Distributed Current Collectors. Acs Appl. Mater. Interfaces 2013, 5, 360–367. [Google Scholar] [CrossRef] [PubMed] [Green Version]
  23. Wu, C.Z.; Yin, P.; Zhu, X.; OuYang, C.Z.; Xie, Y. Synthesis of hematite (alpha-Fe2O3) nanorods: Diameter-size and shape effects on their applications in magnetism, lithium ion battery, and gas sensors. J. Phys. Chem. B 2006, 110, 17806–17812. [Google Scholar] [CrossRef] [PubMed]
  24. Glasscock, J.A.; Barnes, P.R.F.; Plumb, I.C.; Bendavid, A.; Martin, P.J. Structural, optical and electrical properties of undoped polycrystalline hematite thin films produced using filtered arc deposition. Thin Solid Films 2008, 516, 1716–1724. [Google Scholar] [CrossRef]
  25. Hu, Y.S.; Kleiman-Shwarsctein, A.; Forman, A.J.; Hazen, D.; Park, J.N.; McFarland, E.W. Pt-doped alpha-Fe2O3 thin films active for photoelectrochemical water splitting. Chem. Mater. 2008, 20, 3803–3805. [Google Scholar] [CrossRef]
  26. Bjorksten, U.; Moser, J.; Gratzel, M. Photoelectrochemical Studies on Nanocrystalline Hematite Films. Chem. Mater. 1994, 6, 858–863. [Google Scholar] [CrossRef]
  27. Sadtler, B.; Demchenko, D.O.; Zheng, H.; Hughes, S.M.; Merkle, M.G.; Dahmen, U.; Wang, L.W.; Alivisatos, A.P. Selective Facet Reactivity during Cation Exchange in Cadmium Sulfide Nanorods. J. Am. Chem. Soc. 2009, 131, 5285–5293. [Google Scholar] [CrossRef] [Green Version]
  28. Cesar, I.; Sivula, K.; Kay, A.; Zboril, R.; Graetzel, M. Influence of Feature Size, Film Thickness, and Silicon Doping on the Performance of Nanostructured Hematite Photoanodes for Solar Water Splitting. J. Phys. Chem. C 2009, 113, 772–782. [Google Scholar] [CrossRef]
  29. Zhang, F.J.; Song, N.N.; Zhang, S.Y.; Zou, S.; Zhong, S. Synthesis of sponge-loaded Bi2WO6/ZnFe2O4 magnetic photocatalyst and application in continuous flow photocatalytic reactor. J. Mater. Sci. Mater. Electron. 2017, 28, 8197–8205. [Google Scholar] [CrossRef]
  30. Lai, Y.J.; Chang, J.S.; Lee, D.J. Synthesis of a novel solid mediator Z-scheme heterojunction photocatalysis CuFe2O4/Cu/UiO-66-NH2 for oxidation of dye in water. Chemosphere 2022, 296, 134080. [Google Scholar] [CrossRef]
  31. Hafeez, H.Y.; Lakhera, S.K.; Narayanan, N.; Harish, S.K.; Hayakawa, Y.; Lee, B.K.; Neppolian, B. Environmentally Sustainable Synthesis of CoFe2O4-TiO2/rGO Ternary Photocatalyst: A Highly Efficient and Stable Photocatalyst for High Production of Hydrogen (Solar Fuel) (vol 4, pg 880, 2019). Acs Omega 2019, 4, 2980. [Google Scholar] [CrossRef]
  32. Hsu, Y.K.; Chen, Y.C.; Lin, Y.G. Novel ZnO/Fe2O3 Core-Shell Nanowires for Photoelectrochemical Water Splitting. Acs Appl. Mater. Interfaces 2015, 7, 14157–14162. [Google Scholar] [CrossRef]
  33. Kudo, A.; Miseki, Y. Heterogeneous photocatalyst materials for water splitting. Chem. Soc. Rev. 2009, 38, 253–278. [Google Scholar] [CrossRef]
  34. Chen, H.M.; Chen, C.K.; Liu, R.S.; Zhang, L.; Zhang, J.J.; Wilkinson, D.P. Nano-architecture and material designs for water splitting photoelectrodes. Chem. Soc. Rev. 2012, 41, 5654–5671. [Google Scholar] [CrossRef]
  35. Lee, C.-T.; Chiu, Y.-S.; Ho, S.-C.; Lee, Y.-J. Investigation of a Photoelectrochemical Passivated ZnO-Based Glucose Biosensor. Sensors 2011, 11, 4648–4655. [Google Scholar] [CrossRef]
Figure 1. Schematic representation of Fe2O3 spin-coating deposition.
Chemengineering 07 00022 g001
Figure 2. Characterization of obtained ZnO NS and ZnO NS/Hematite: (a) SEM ZnO NS; (b) ZnO NS/Hematite1; (c) ZnO NS/Hematite2; (d) ZnO NS/Hematite3; (e) XRD pattern of ZnO NS/Hematite3; (f) EDX analysis of ZnO NS/Hematite3.
Chemengineering 07 00022 g002
Figure 3. UV-visible absorbance of prepared nanostructures and heterostructures.
Chemengineering 07 00022 g003
Figure 4. Decolorization of MB under in 180 min: (a) under irradiation, (b) in dark.
Chemengineering 07 00022 g004
Figure 5. Testing coatings based on ZnO NS and ZnO NS/Hematite as non-enzymatic glucose sensors: (a) I-V curves of sensing properties for 1 mM glucose; (b) I-V curves of sensing properties of ZnO NS/Hematite3 nanocomposites for different concentrations of glucose; (c) amperometry of ZnO NS/Hematite3 to successive additions of increased concentrations of glucose solutions up to 5 mM; (d) calibrated plot recorded at 2.5 V.
Chemengineering 07 00022 g005
Figure 6. SEM image of ZnO NS coatings served four cycles as glucose concentration sensor.
Chemengineering 07 00022 g006
Disclaimer/Publisher’s Note: The statements, opinions and data contained in all publications are solely those of the individual author(s) and contributor(s) and not of MDPI and/or the editor(s). MDPI and/or the editor(s) disclaim responsibility for any injury to people or property resulting from any ideas, methods, instructions or products referred to in the content.

