1. Introduction
Inorganic ion exchangers such as zeolites have higher thermal and radiation stability, compared to their organic counterparts [
1]. However, one of the disadvantages of using zeolites for the remediation of nuclear waste is the acidic pH environment found in legacy waste pools which cause dealumination and a loss of crystallinity [
2,
3,
4].
In 1964, Clearfield and Stynes synthesised crystalline α-zirconium phosphate (α-ZrP) and subsequently determined the structure and investigated the ion-exchange mechanism with sodium and caesium ions [
5]. It was reported by Clearfield et al., in later studies, that the crystallinity of the product changed with a slight variation in acidity of the phosphoric acid during synthesis [
6]. Hodson and Whittaker reported that zirconium phosphates also had differing surface areas, even with identical chemical formulae, due to variations in their synthesis methods, which in turn affected their catalytic properties [
7]. In addition, similarly layered materials such as the largely hydrated ү-ZrP with formula Zr(PO
4)(H
2PO
4)·2H
2O and the anhydrous β-ZrP with formula Zr(PO
4)(H
2PO
4) were first reported by Clearfield et al., in 1968 [
8]. Later in 1987, Clayden et al. [
9] performed a study on both α-zirconium phosphate and γ-zirconium phosphate using solid-state NMR. It was shown that two different 31P resonances were observed for γ-ZrP at −9.4 ppm and −27.4 ppm, respectively, in contrast to the single resonance at −18.7 ppm observed for α-ZrP. This made it evident that there were two different phosphate environments in γ-ZrP, corresponding to the presence of two distinct phosphate groups, with PO
43- groups giving a peak at −27.4 ppm, and H
2PO
4− groups giving a peak at −9.4 ppm.
The initial results of Clearfield and Smith [
10] were confirmed by further single-crystal X-ray diffraction studies. It was reported that “α-ZrP crystallised in the monoclinic space group P2
1/c and an interlayer spacing of 7.56 Å or 7.6 Å that could increase as the water content increased or in the presence of counter ions”. The Zr–O bond distance was calculated approximately to be 2.064(5) Å, while the O–Zr–O bond angle was measured to be 90°. It was then concluded by Troup and Clearfield [
11] that the negative charge-bearing fourth oxygen on the phosphate group was indeed bonded to an H
+ ion forming a P–OH group. These groups represented the hydrogen that bonded to the water molecules that were comfortably sitting between the layers. Furthermore, the P–OH groups lay above and below the zirconium atoms that packed the layers together and formed water-filled hexagonal-shaped zeolitic-type cavities. Interconnecting openings of approximately 2.64 Å in size connected the cavities together. This size limited the diffusion of counter ions with a larger diameter, unless sufficient energy was supplied to spread the layers by either altering the pH or increasing the reaction temperature [
10].
Several mixed-metal phosphates have been synthesised over the last few decades, especially towards various applications such as ion exchange and catalysis. Mixed-metal compounds are increasingly being studied, especially those consisting of a tetravalent metal cation and two or more anions, such as [C
3H
12N
2]
2[Fe
5(C
2O
4)
2(H
xPO
4)
8] [
12]. However, the synthesis of a layered mixed-metal compound having two or more cations and one anion in its lattice structure is rarely pursued. One prime example of this configuration is that of titanium doped into the zirconium positions in α-zirconium phosphate. Zirconium titanium phosphates (ZTP) can thus be synthesised as both crystalline and amorphous compounds, with a solid-state solubility limit of 20% to attain a single phase. This means that any higher percentage of metal substitution (such as 33%) of either zirconium for titanium atoms or vice versa results in a two-phase product [
13]. It was shown by a detailed ion exchange study [
14] that a higher ion-exchange capacity (3.36 meq/g) is achieved for amorphous ZTP, as compared to its single-metal analogues α-TiP (3.09 meq/g) and α-ZrP (2.77 meq/g). It was found that the less ordered structure of ZTP (with vacancies) was the key reason for enhanced capacity, as opposed to the regular lattice of the single-metal phosphates. It was due to the substitution of the metal ions with differing ionic radii (Zr
4+ = 0.79 Å and Ti
4+ = 0.68 Å) [
15]. This led to the deformation of the P–O bonds in the phosphate group, leading to an expansion of the layers, which enhanced the proton exchange for a cation of interest from the solution.
The main aim of this study was to synthesise α-zirconium phosphate (α-ZrP) doped with a metal of different oxidation state that could have the potential to be used as an inorganic ion exchanger without significant change to the framework. It is believed that the charge imbalance created in the structure of α-ZrP could lead to a fine tuning of the ion-exchange properties. Hence, yttrium-substituted metal (IV) phosphates were synthesised from the α-ZrP structure with the general formula (M1)x(M2)1−x(HPO4)2·H2O, where M1 and M2 include yttrium and zirconium atoms, respectively, and x = 0.05, 0.10, 0.15 and 0.2.
2. Experimental Methodology
All the chemicals used in this work were of reagent grade and purchased from the Alfa Aesar and Sigma Aldrich, with at least 99.9% purity.
2.1. Synthesis of Y-ZrP
Yttrium–zirconium phosphate (Y-ZrP) was synthesised using the sol–gel method as reported by Clearfield and Frianeza [
14] for the synthesis of α-zirconium phosphate. The method involves preparing 1M metal salt solutions using varying Y/Zr molar ratios (5%, 10%, 15% and 20%) of ZrOCl
2·8H
2O powder and YCl
3·6H
2O powder in 1 M HCl/de-ionised water to make 25 mL of an oily solution. The dropwise addition of this solution to 50 mL of 4 M phosphoric acid solution resulted in the formation of a white crude gel that was stirred continuously overnight using a magnetic stirrer at room temperature. Following this, the product was recovered using vacuum filtration and washed with copious amounts of deionised water to remove excess chloride ions. A white powder was finally obtained by drying the filtered product at 50 °C for 24 h. X-ray powder diffraction revealed this product to be poorly crystalline. Therefore, two methods of crystallisation were used: a conventional reflux and a hydrothermal method.
For conventional reflux, the crude zirconium phosphate gel was placed in a round-bottom Pyrex flask, and 50 mL of H3PO4 (12 M) was added. The reaction was refluxed for 7 days, and the obtained product was subsequently vacuum-filtered and washed with 0.1 M H3PO4 and copious de-ionised water to remove the excess acid present. It was then dried at 50 °C for 24 h in a hot-air oven and grounded finely.
For the hydrothermal method, approximately 5 g of the crude zirconium phosphate or fresh gel was placed in a Teflon liner together with 10 mL of the 12 M H3PO4. The pressure vessel was placed in an oven at 200 °C for 7 days. The resulting product was washed, dried, vacuum-filtered and grounded finely using a mortar and pestle.
2.2. Characterisation Methods
The synthesised products were characterised routinely using X-ray powder diffraction (XRD) on a Bruker® D2 Phaser diffractometer (Cu Kα
1 = 1.54060 Å and Kα
2 = 1.54439 Å). A rotation of 30 rpm with a 2θ range between 5° to 80° was used. The diffractometer was equipped with an Si PSD detector, and an Ni filter removed the Cu-Kβ radiation. The diffraction patterns were analysed by Rietveld refinement using the EXPGUI/GSAS suite of programs [
16,
17]. Values for the molar compositions and fractional occupancies were set based on the theoretical composition. The temperature factors for each atom type were constrained to the same value during the initial stages of the refinement.
Compositional analysis of the products was performed using the X-ray fluorescence (XRF) technique on a Bruker® TRACER IV-SD (city and country) (25.00 kV, 35 μA and 10 s acquisition time). The samples were in powdered form and were placed in a sample holder with a Mylar film TF-125 with gauge thickness of 2.5 µm (0.10 mil) and dimensions of 3″ × 300′ (76 mm × 91.4 m). A best fit linear regression graph with R2 = 0.9814 was obtained for calibration purposes using a mean of 3 readings.
Sample morphology of the synthesised products was studied on FEI Quanta™ 200 SEM-coupled EDX, with a sample size of approximately 80 mm in depth and 200 mm in diameter and a scanning area of 10 mm × 10 mm to 1 μm × 1 μm. An accelerating voltage of 20 kV was used at a vacuum pressure of ~10−6 torr.
The surface area measurements were performed on a Micrometrics® ASAP 2010 using approximately 0.1 g of the degassed samples at 150 °C for 4 h. Finally, phosphorus MAS-NMR experiments were carried out on a Bruker® Advance II+ 400 MHz spectrometer with ammonium phosphate and 85% phosphoric acid that provided the shift reference of 7.4 ppm upfield. All 31P experiments were performed using a 4 mm Zirconia rotor in which the samples were packed. A single-pulse excitation with a spinning speed of 6 kHz and 7 kHz and a recycle delay of 0.3 s was used. All spectra were recorded at room temperature. A 31P 90° pulse of 6.0 ms was used with total number of scans of 512.
2.3. Ion Exchange Experiments
About 125 mL of each of 0.1 M metal nitrate solutions (strontium, cobalt and caesium) was mixed together as a stock to represent a multi-ion effluent nuclear waste stream. To 125 mL of this stock solution, 0.5 g of the as-synthesised phosphate was added to the flask. The mixture was stirred for 72 h to maximise the degree of ion exchange and reach an extended-equilibrium time phase. The samples were then washed thrice with de-ionised water so as to remove the excess ions, dried at 50 °C for 24 h in an oven, ground and characterised using the methods described previously.
3. Results and Discussions
3.1. XRD of Y–ZrP
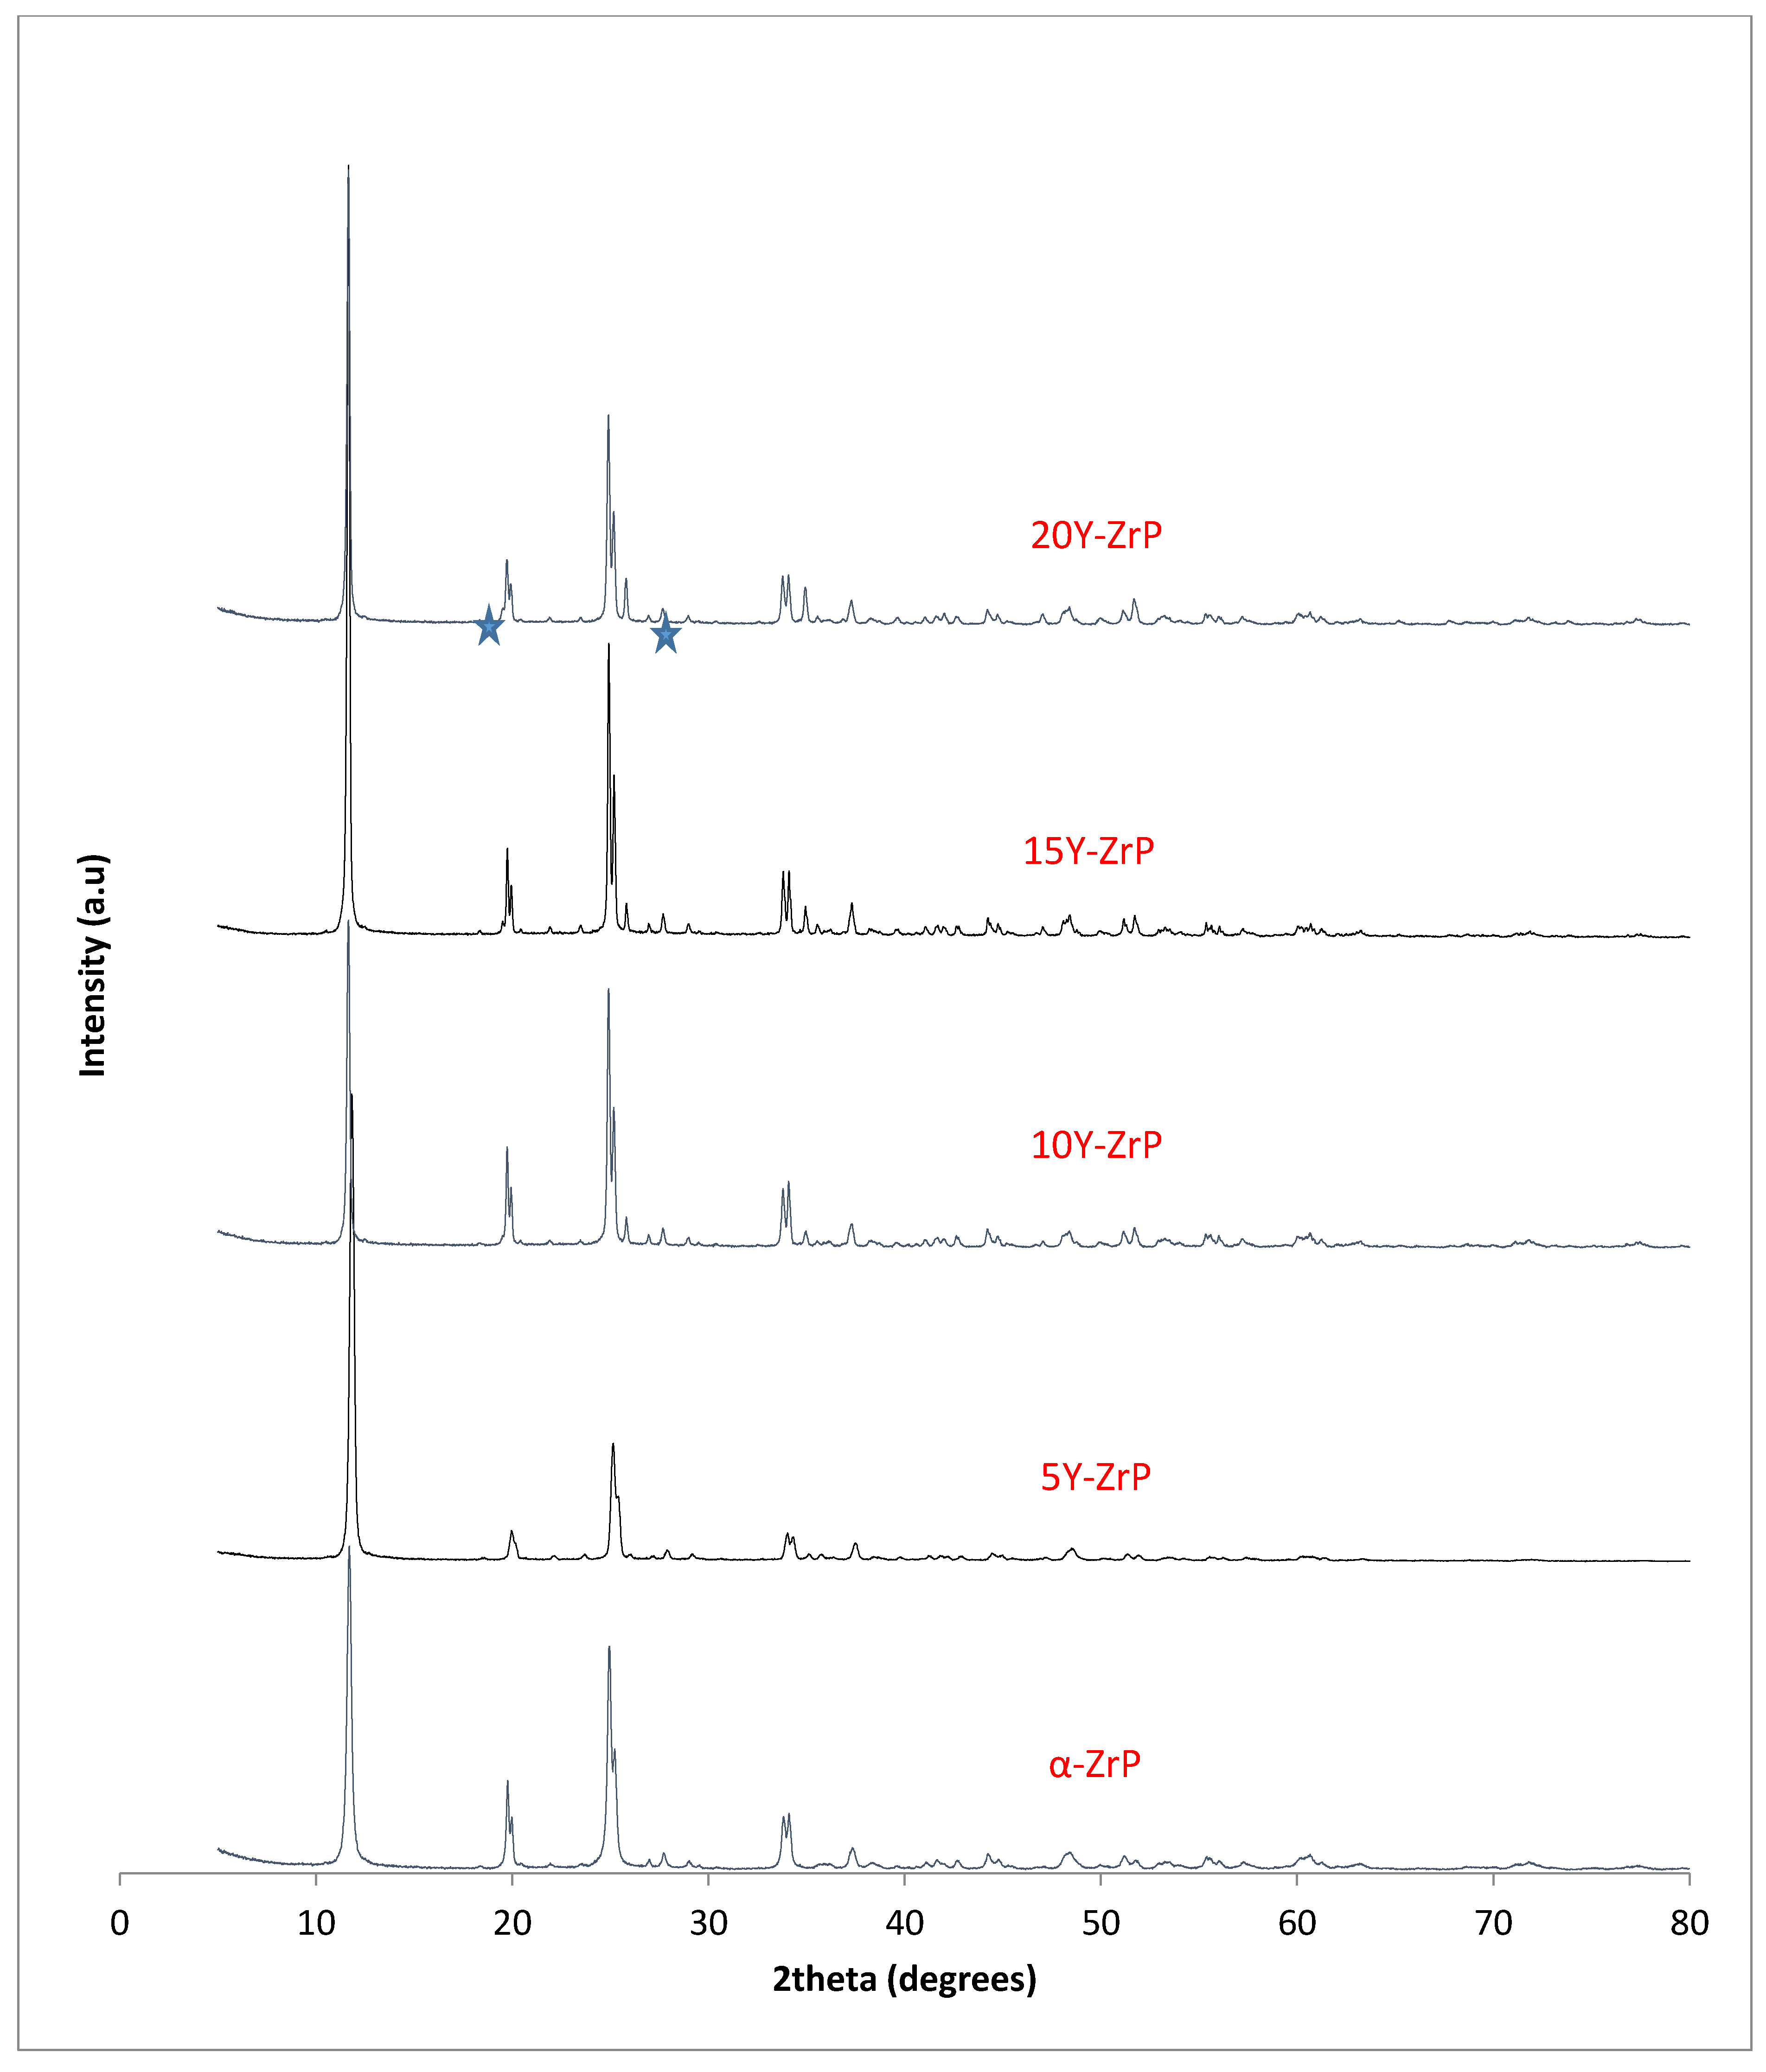
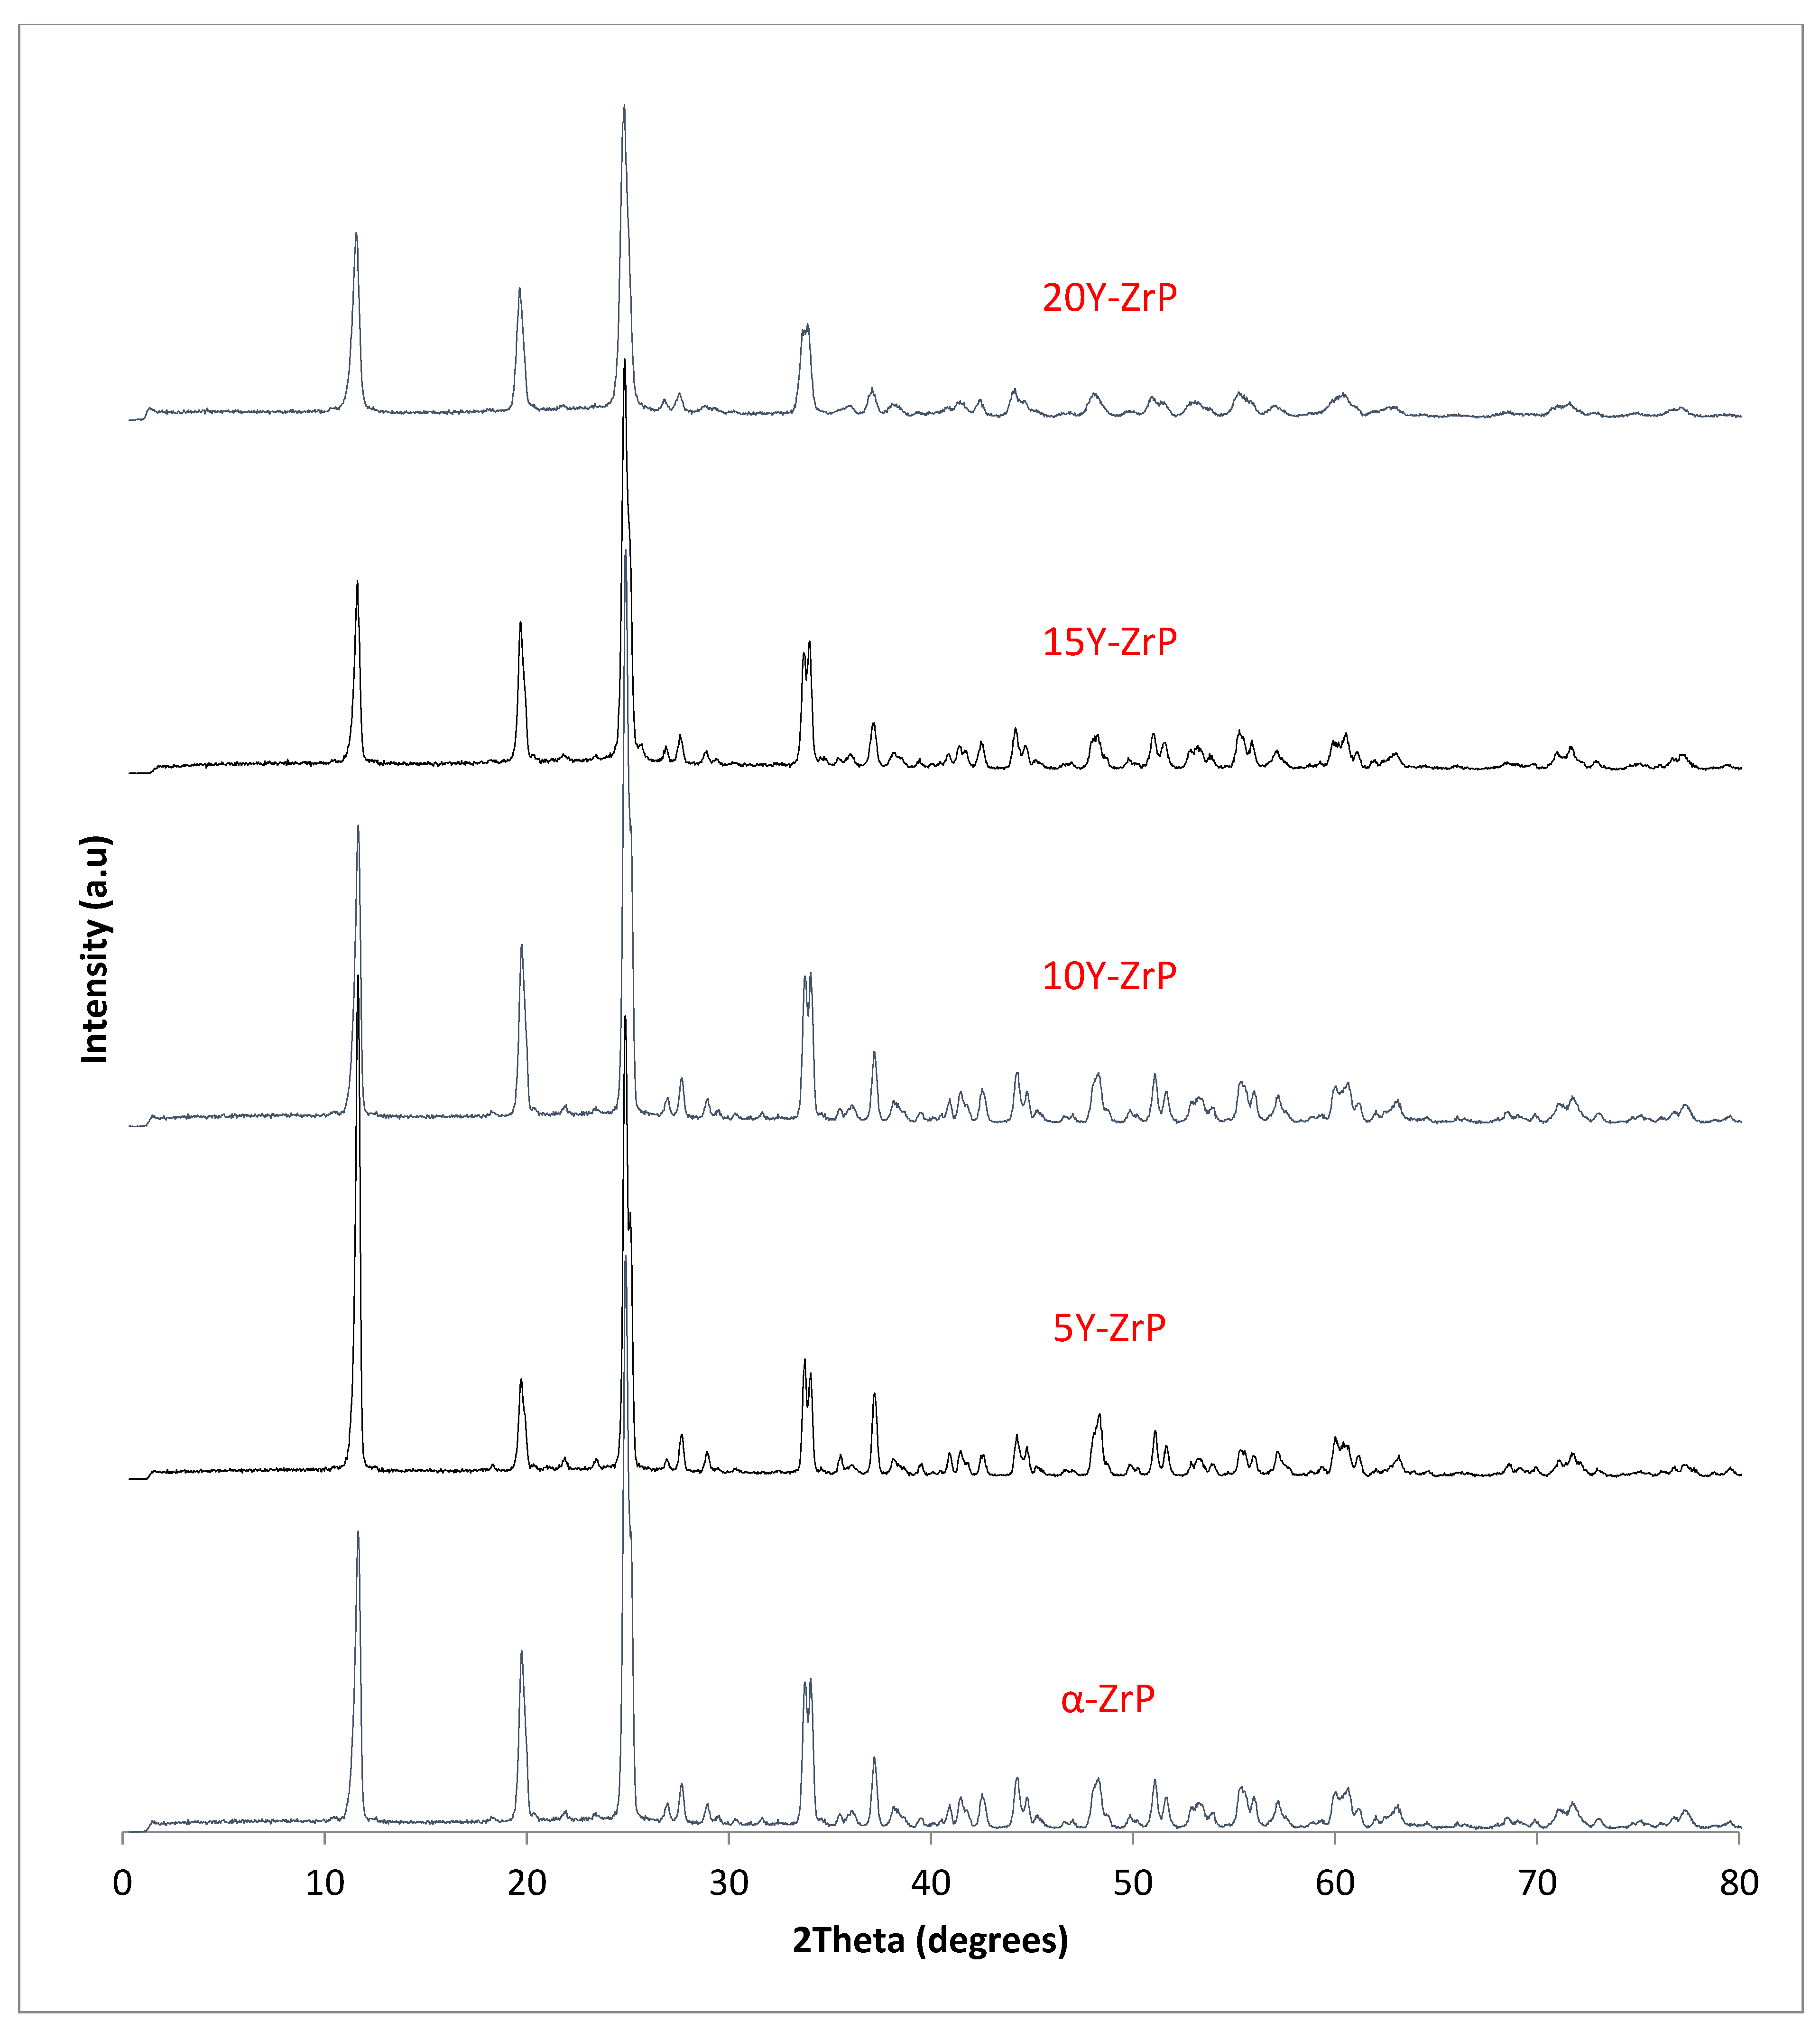
The synthesised Y–ZrP samples from both synthetic methods were compared with α-ZrP samples synthesised using both methods. The XRD results from both methods, as shown in
Figure 1 and
Figure 2 below, indicated highly crystalline and isostructural products for both α-ZrP and Y–ZrP samples. However, it was observed that the first characteristic peak (002 reflection) at 11.65° 2θ was more intense for the hydrothermally synthesised samples. Two additional peaks can be observed for products with yttrium substitution of 10% and above (for the hydrothermal method) and 15% and above (for the conventional method), which were not attributed to the α-zirconium phosphate. The first peak occurred at 25.9° 2θ, and the second peak occurred at 35° 2θ (as shown by a blue star in (
Figure 1 and
Figure 2), with a peak intensity ratio of approximately 0.95.
Initially, these peaks were believed to arise due to the possibility of a two-phase system where the formation of tetragonal yttrium phosphate or Xenotime (YPO
4) had occurred, as the peaks’ positions were close to those published for yttrium phosphate [
18]. However, there was no peak at 19.5° 2θ, which was present in the XRD pattern of YPO
4, and the relative intensities of the other two peaks did not match those of the synthesised Y–ZrP samples. However, these three characteristic peaks of Xenotime were evident when a doping level of 20% and above was attempted, implying multiphase systems were forming and the doping limit was reached.
Therefore, it can be concluded that single-phase Y–ZrP systems can be synthesised with up to 15% of yttrium substitution into α-ZrP, but any further substitution of the smaller Zr
4+ ion (ionic radius = 0.86 Å) with the larger Y
3+ ion (ionic radius = 1.04 Å) [
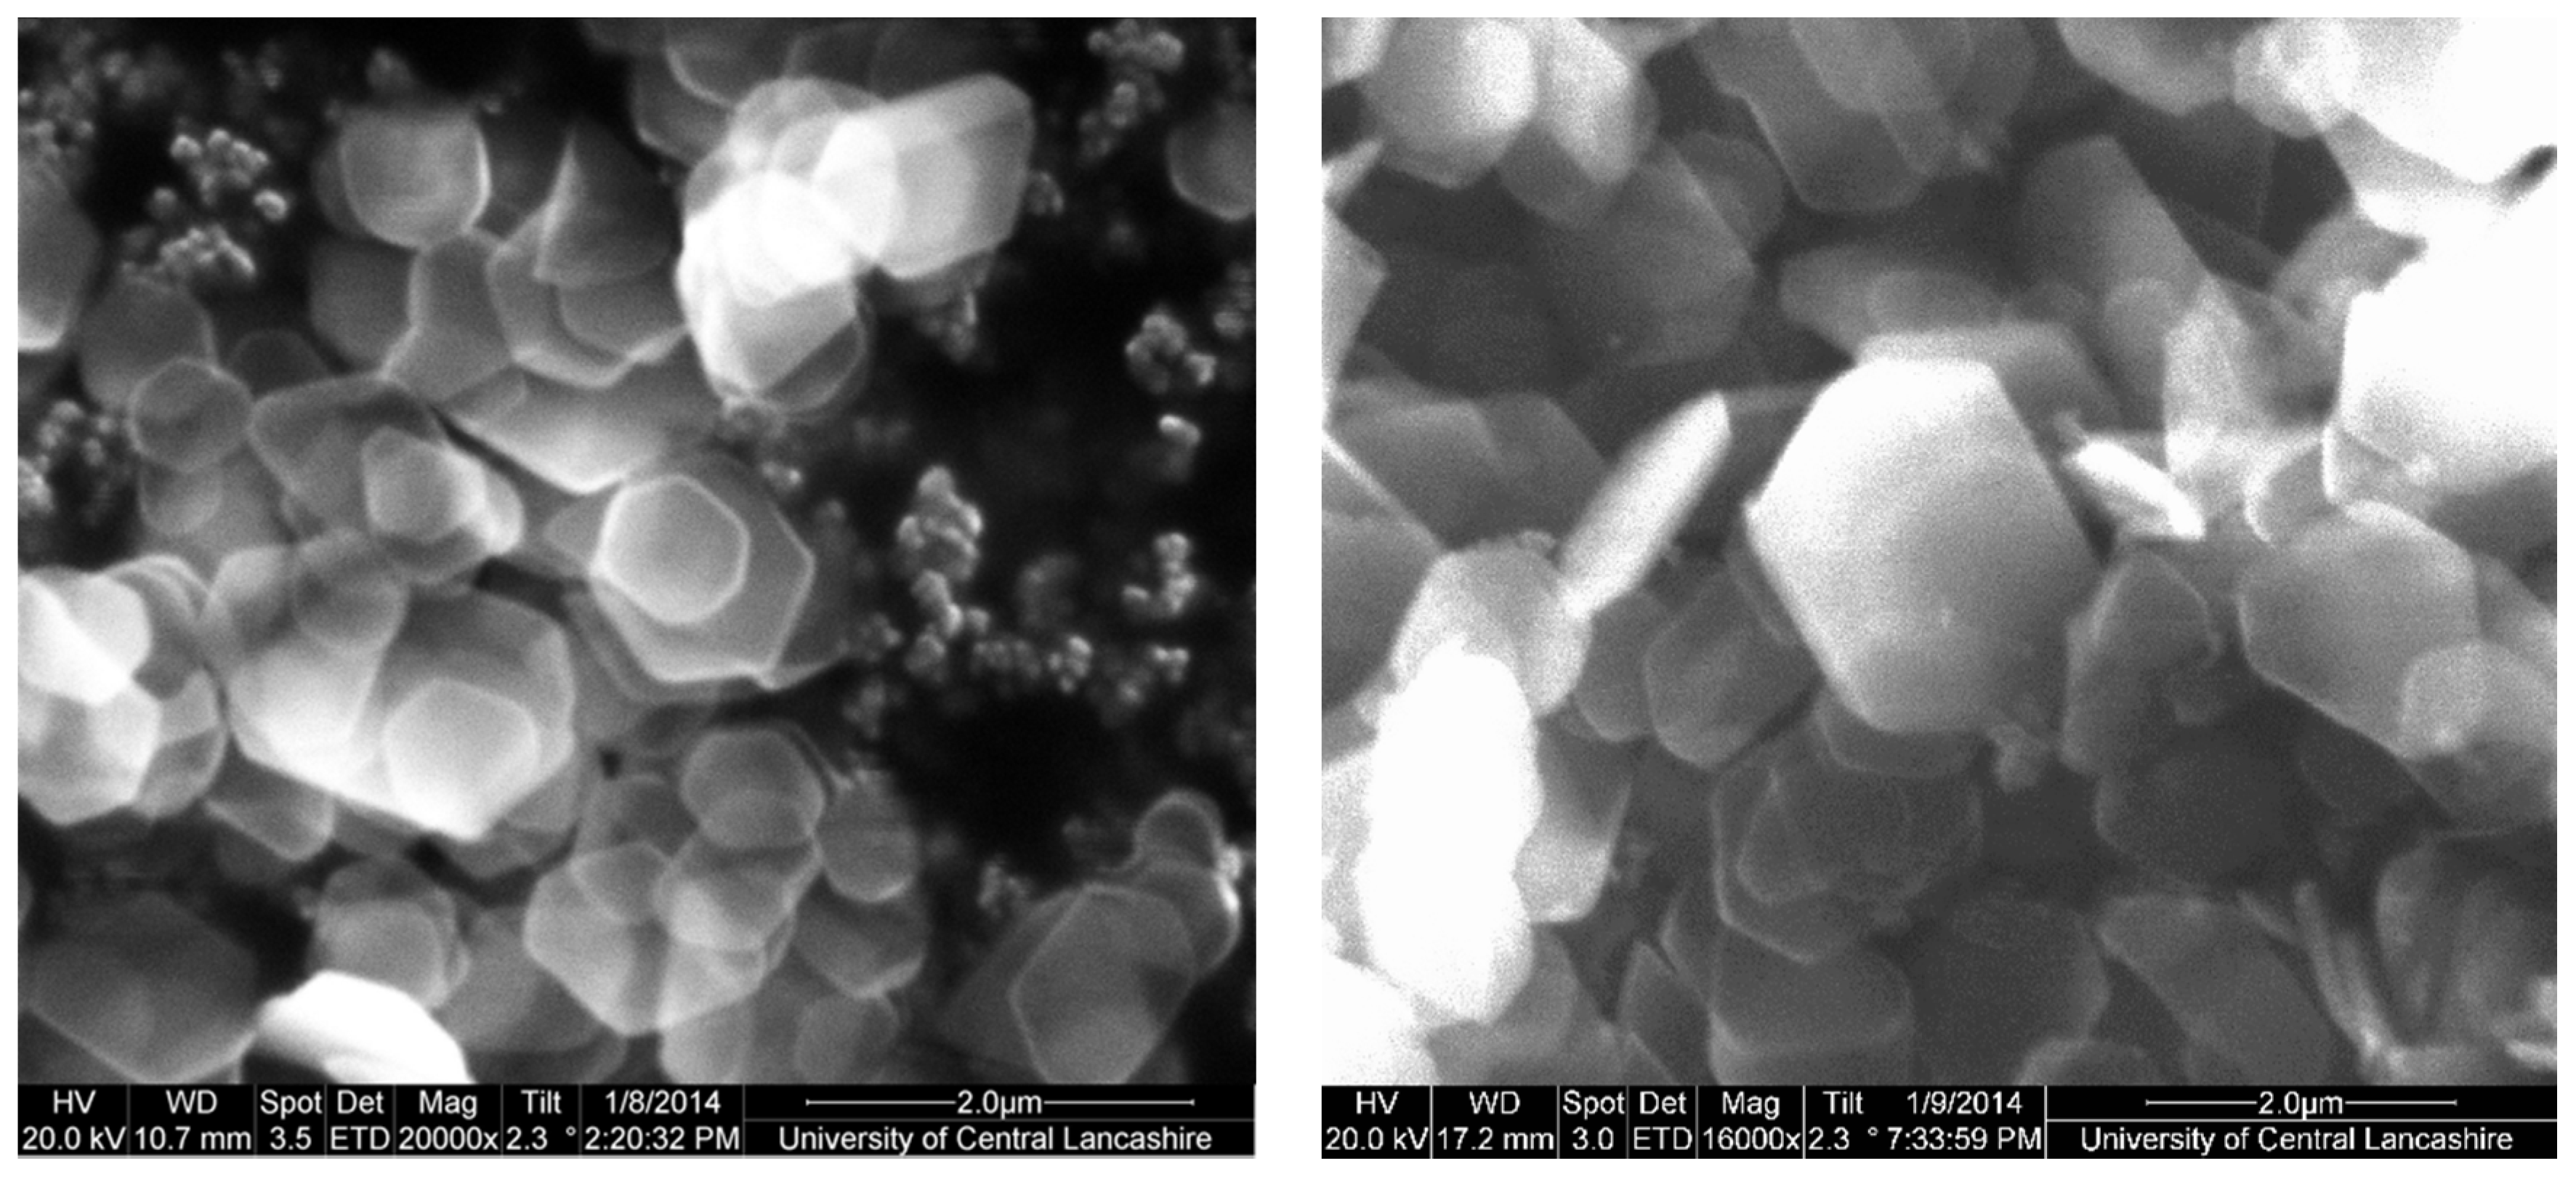
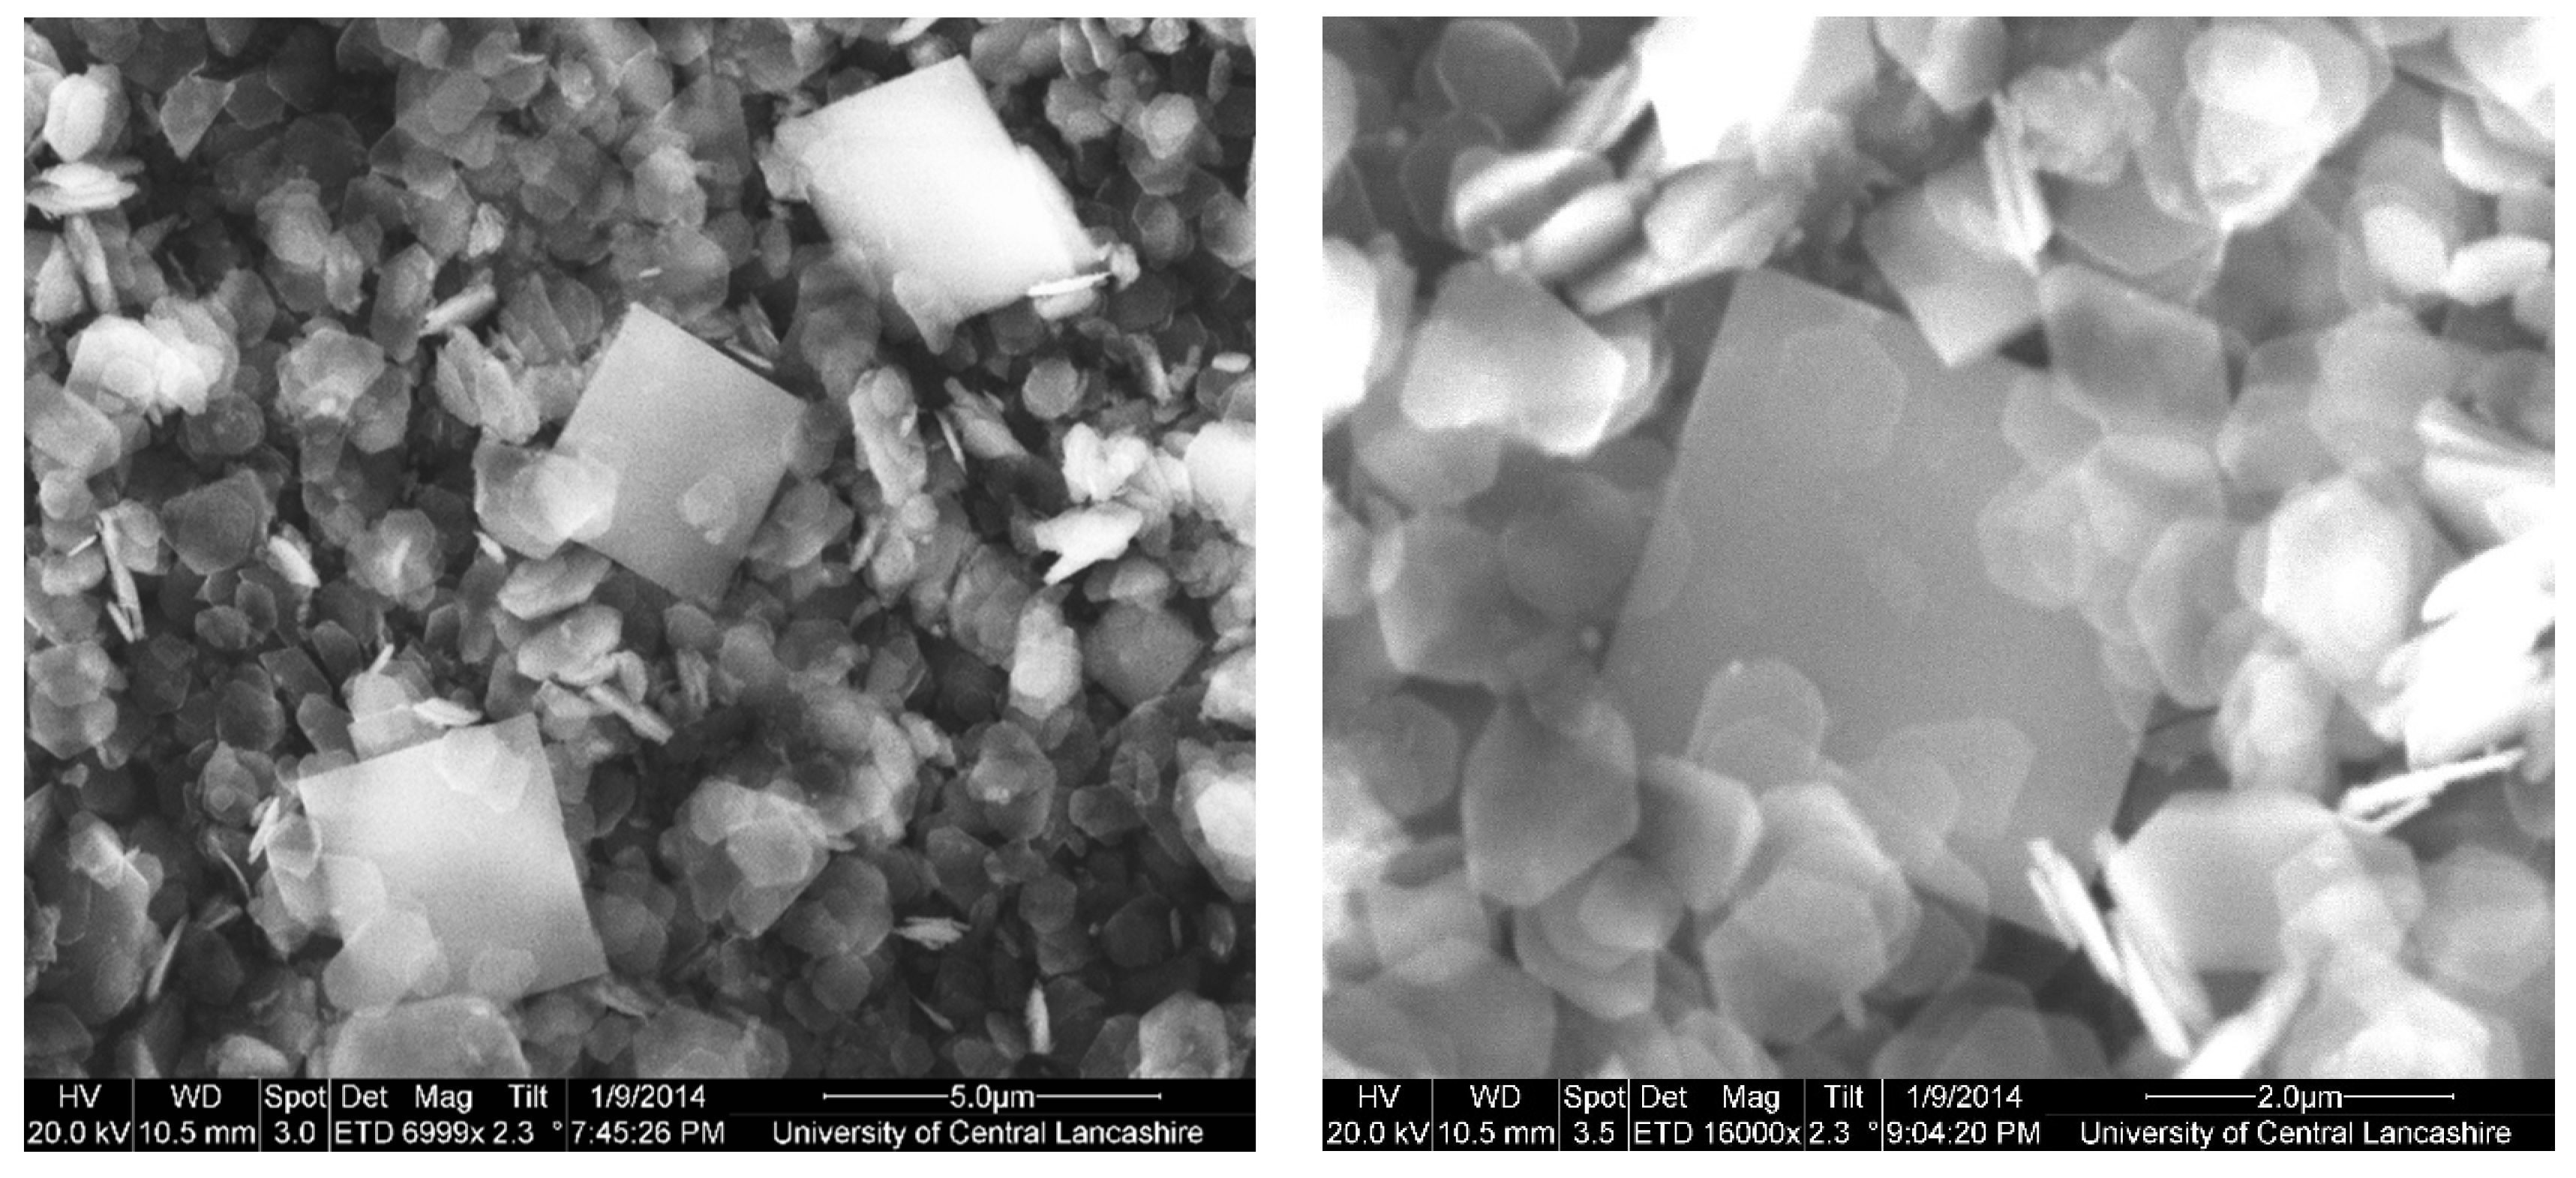
15] leads to the formation of a two-phase system consisting of Xenotime. Tetragonal crystallites were observed in SEM images for highly substituted samples such as 30% Y–ZrP (
Figure 3), in addition to hexagonal crystallites typical of α-ZrP. In fact, there were no visible differences between the morphologies of α-ZrP and Y–ZrP (up to 15% of yttrium substitution), apart from the size distribution of the hexagonal crystals shown in
Figure 4. This was found to be true for both synthesis methods (conventional reflux and hydrothermal), as shown in
Supplementary Figures S1 and S2.
3.2. XRF of Y–ZrP
Table 1 indicates that the synthesised samples showed higher deviation from the theoretical yttrium content when produced with the reflux method as compared to the hydrothermal method. This can be explained based on the reactions conditions of higher temperature and pressure, which are more favourable for reaching higher doping levels.
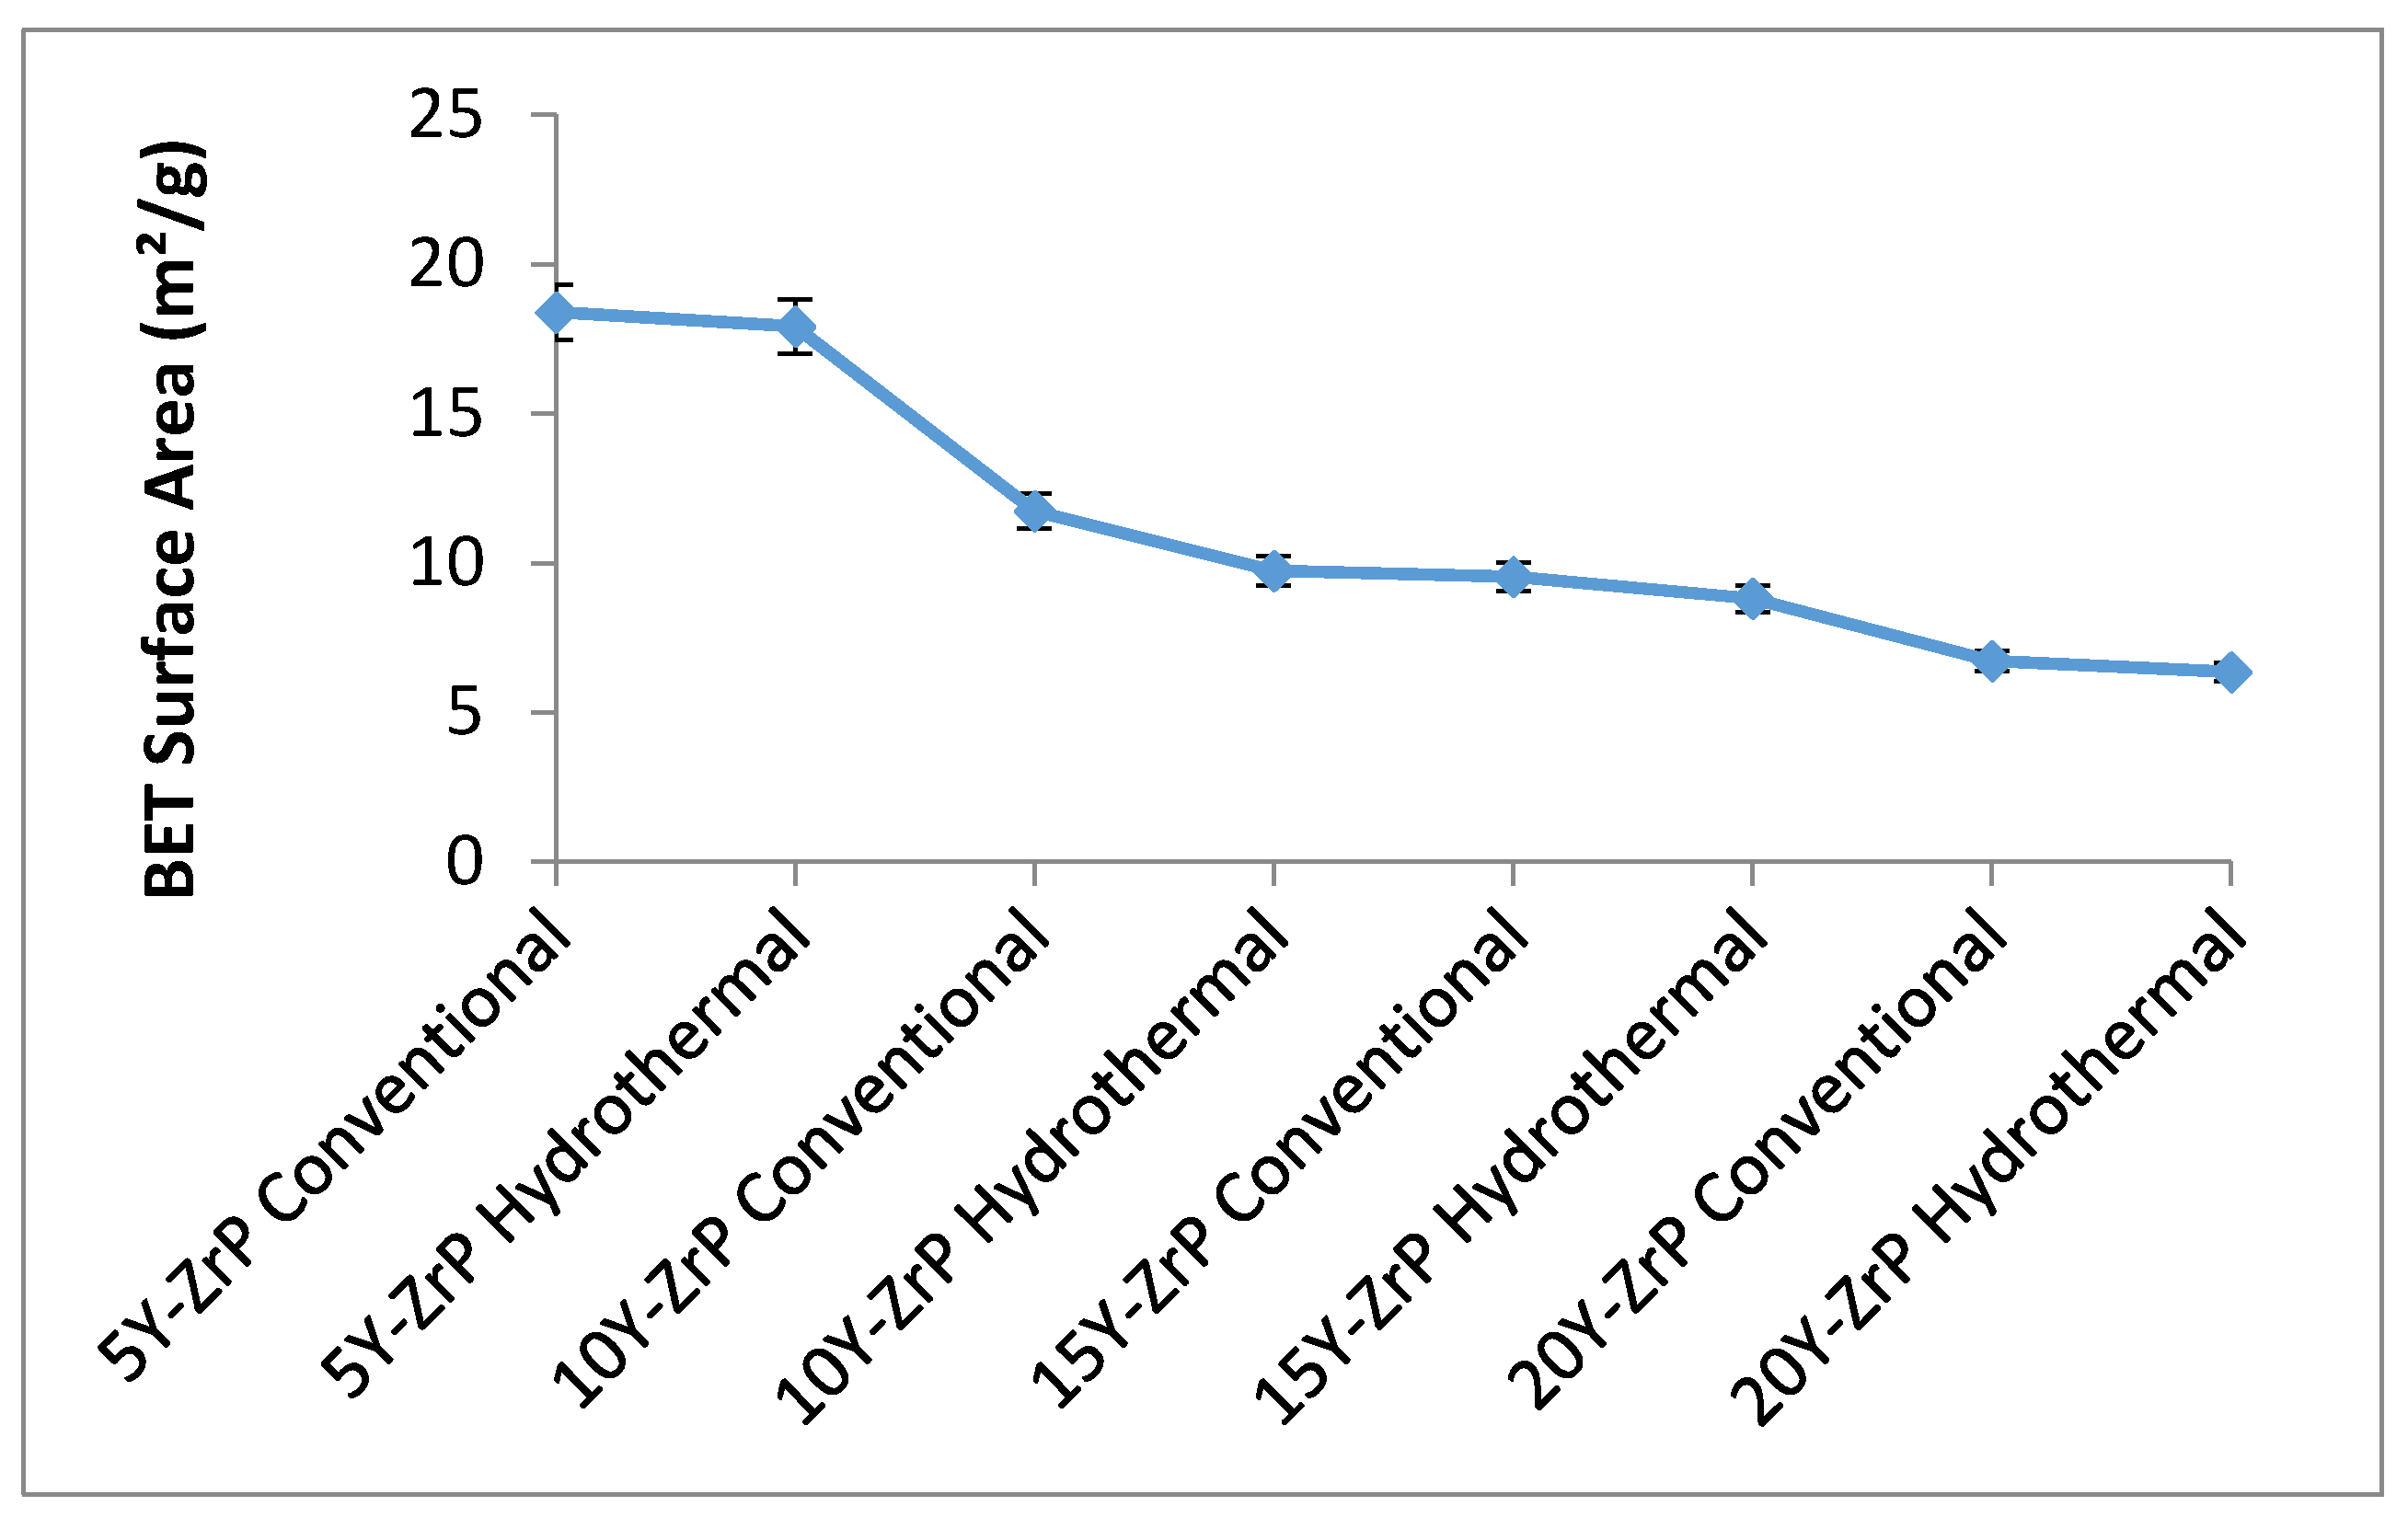
3.3. BET Surface Area of Y–ZrP
The BET surface area analysis was carried to understand the changes in the morphology and properties of the synthesised Y–ZrP samples as compared to the α-ZrP. A summary of the results for all the synthesised Y–ZrP samples are shown in the
Figure 5 below.
There was a sharp decrease in the BET surface area of the synthesised Y–ZrP samples as the amount of yttrium substitution increased from 5% to 15%, irrespective of the method of synthesis. However, there was little difference between the 15% and 20% Y–ZrP products, due to solubility limits whereby two-phase products formed beyond 15% yttrium substitution. The reason for this can be variations in particle sizes due to doping concentrations that could affect the specific surface area. It was observed from the SEM and particle size measurements that the 5% and 10% Y–ZrP samples consisted of more regular-sized particles of 1–2 µm and the products were single-phase compared to the 15% and 20% Y–ZrP samples that consisted of larger particles (5 µm); therefore the surface area decreased with increasing yttrium substitution.
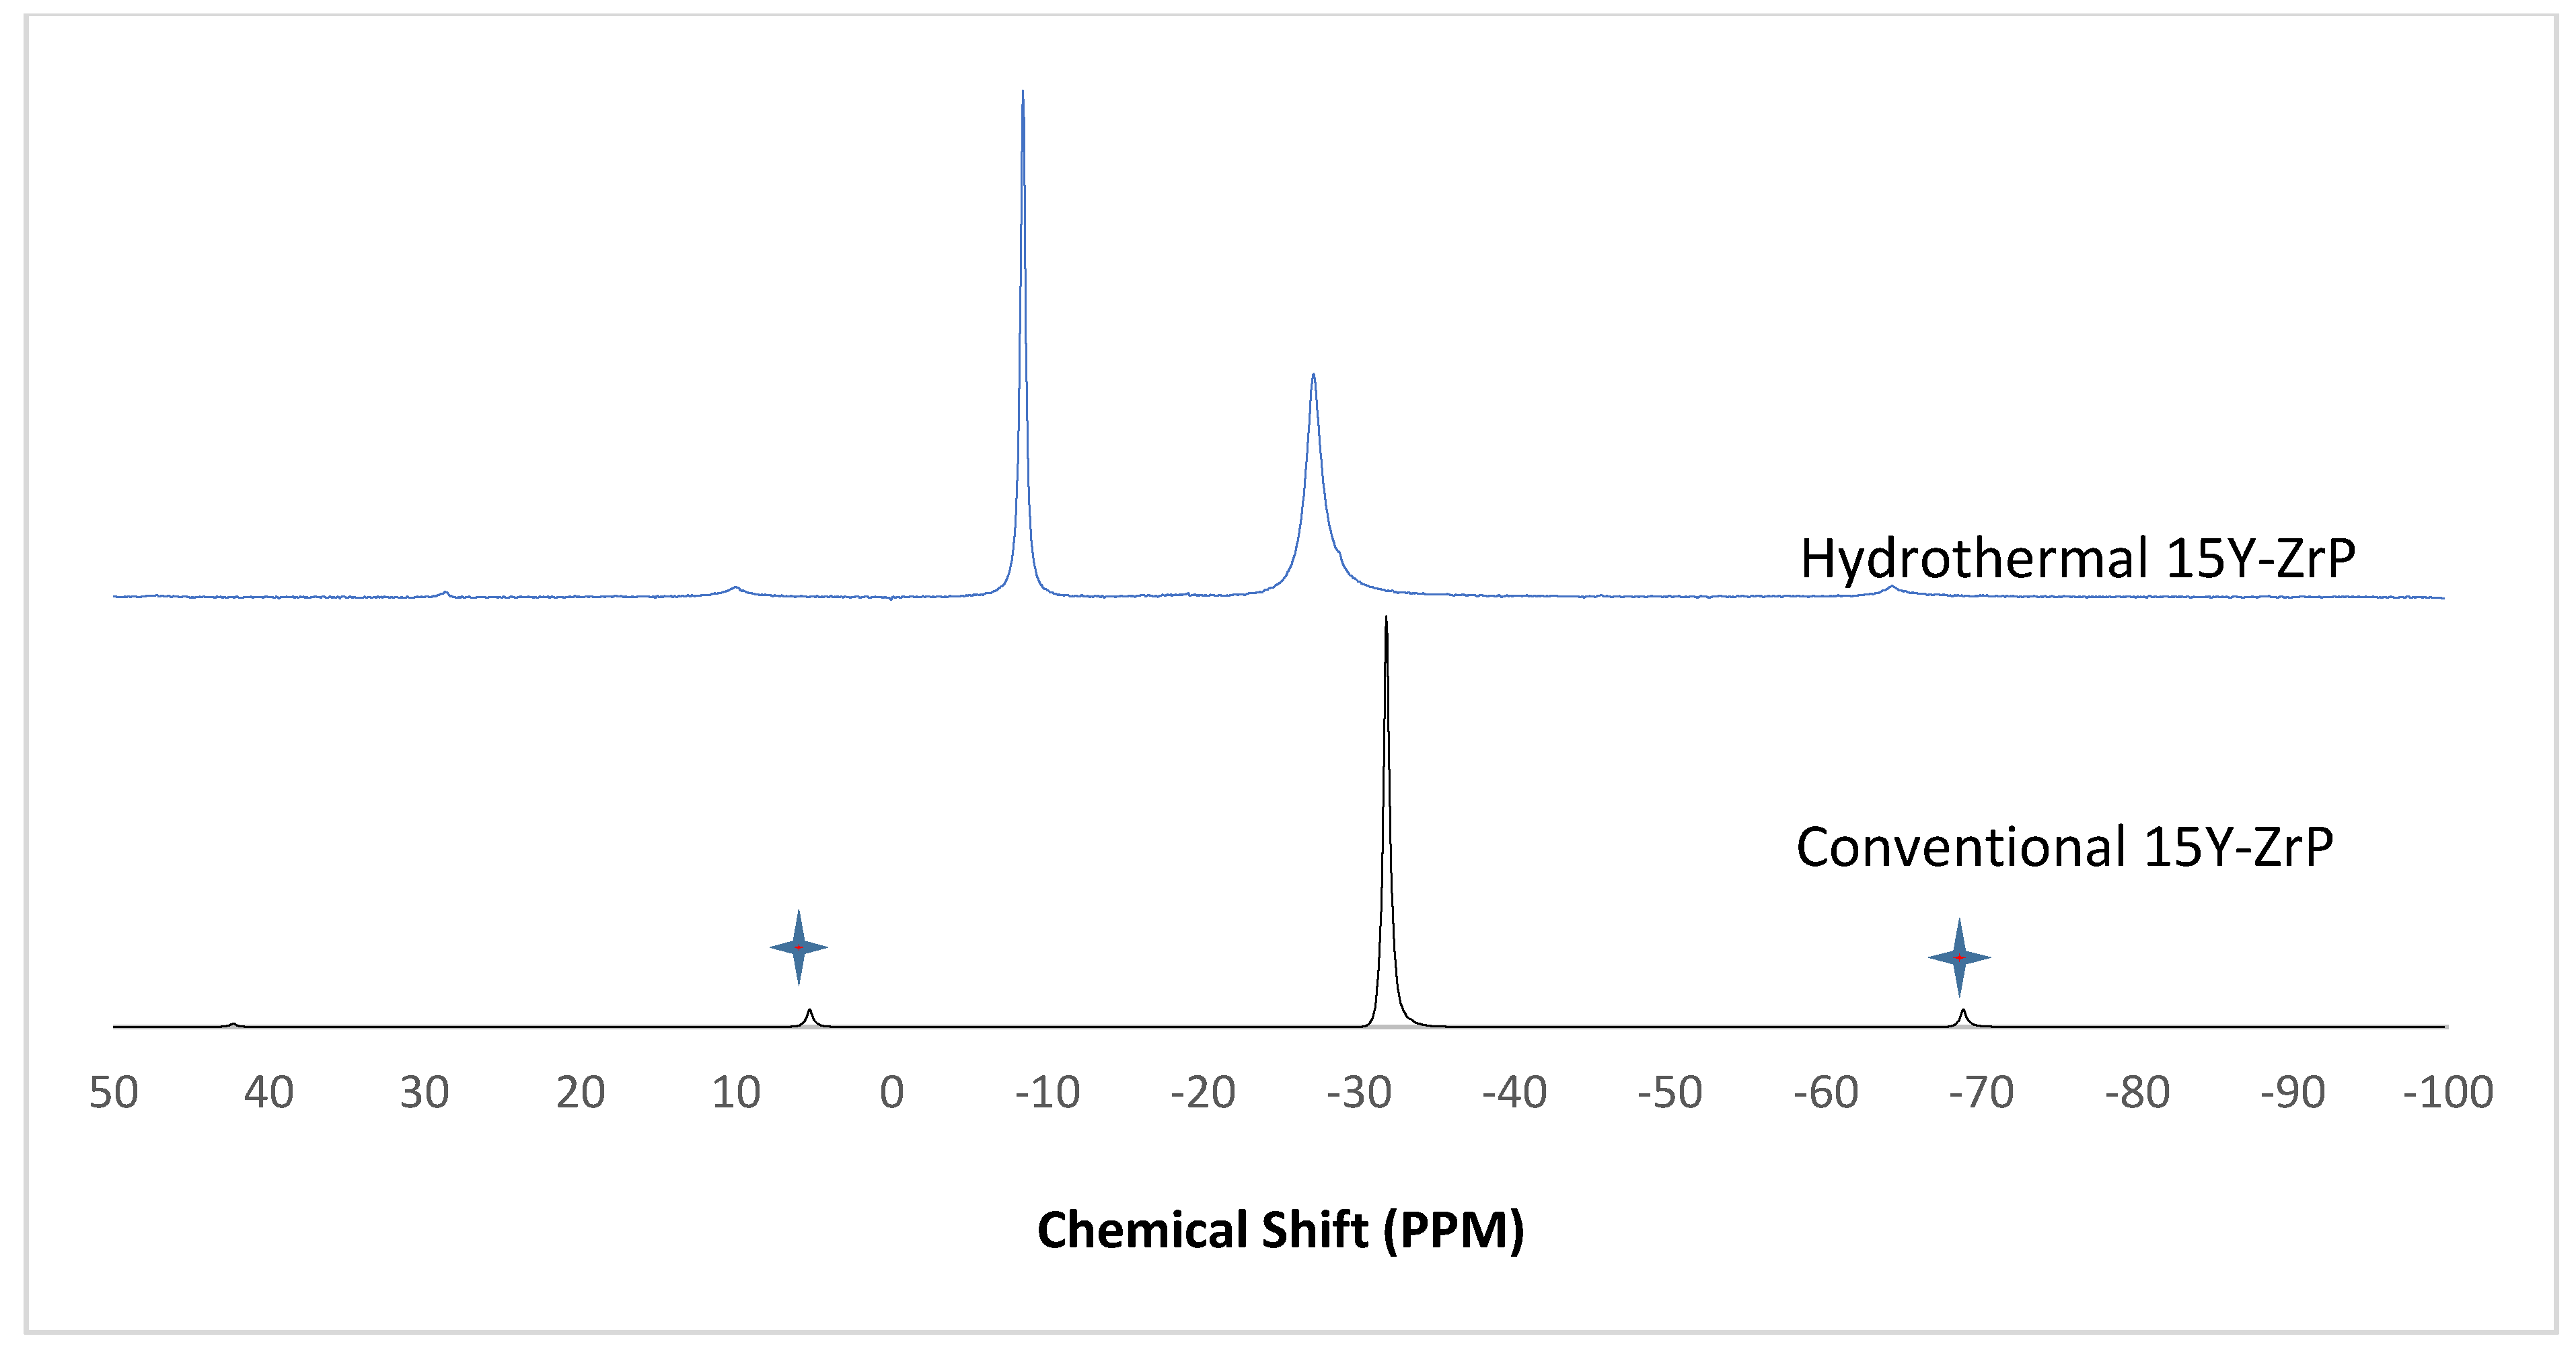
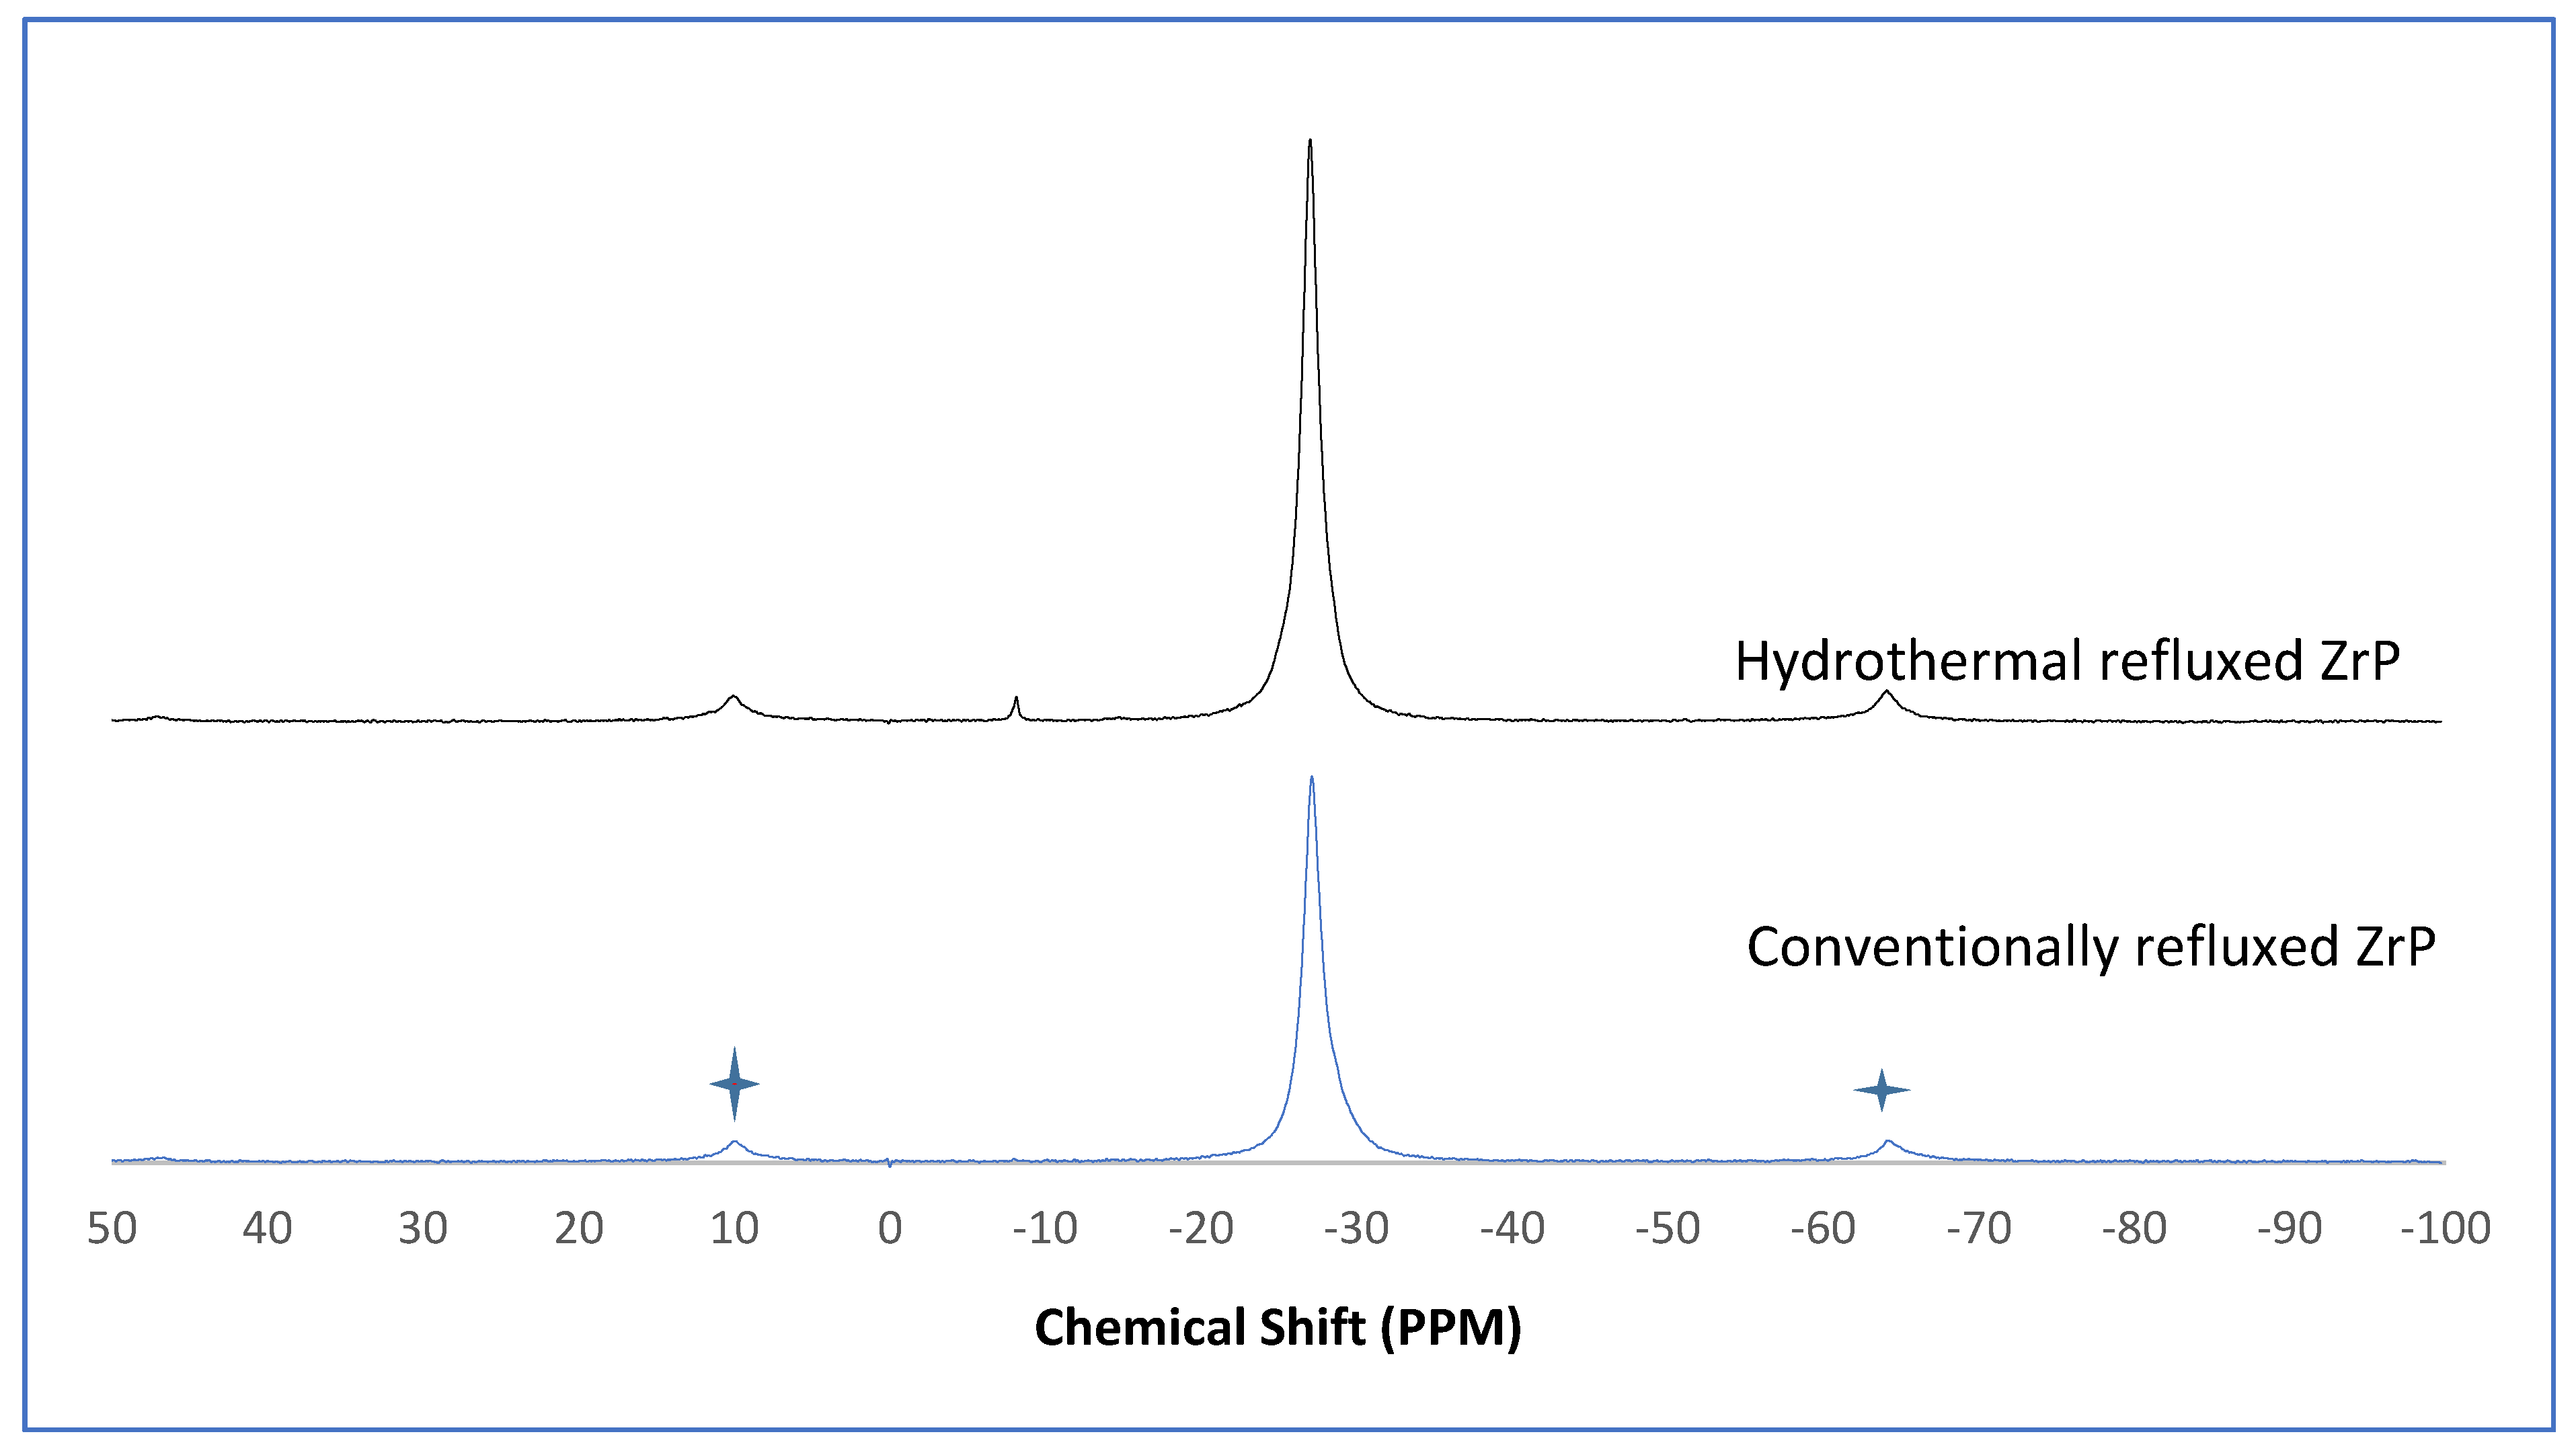
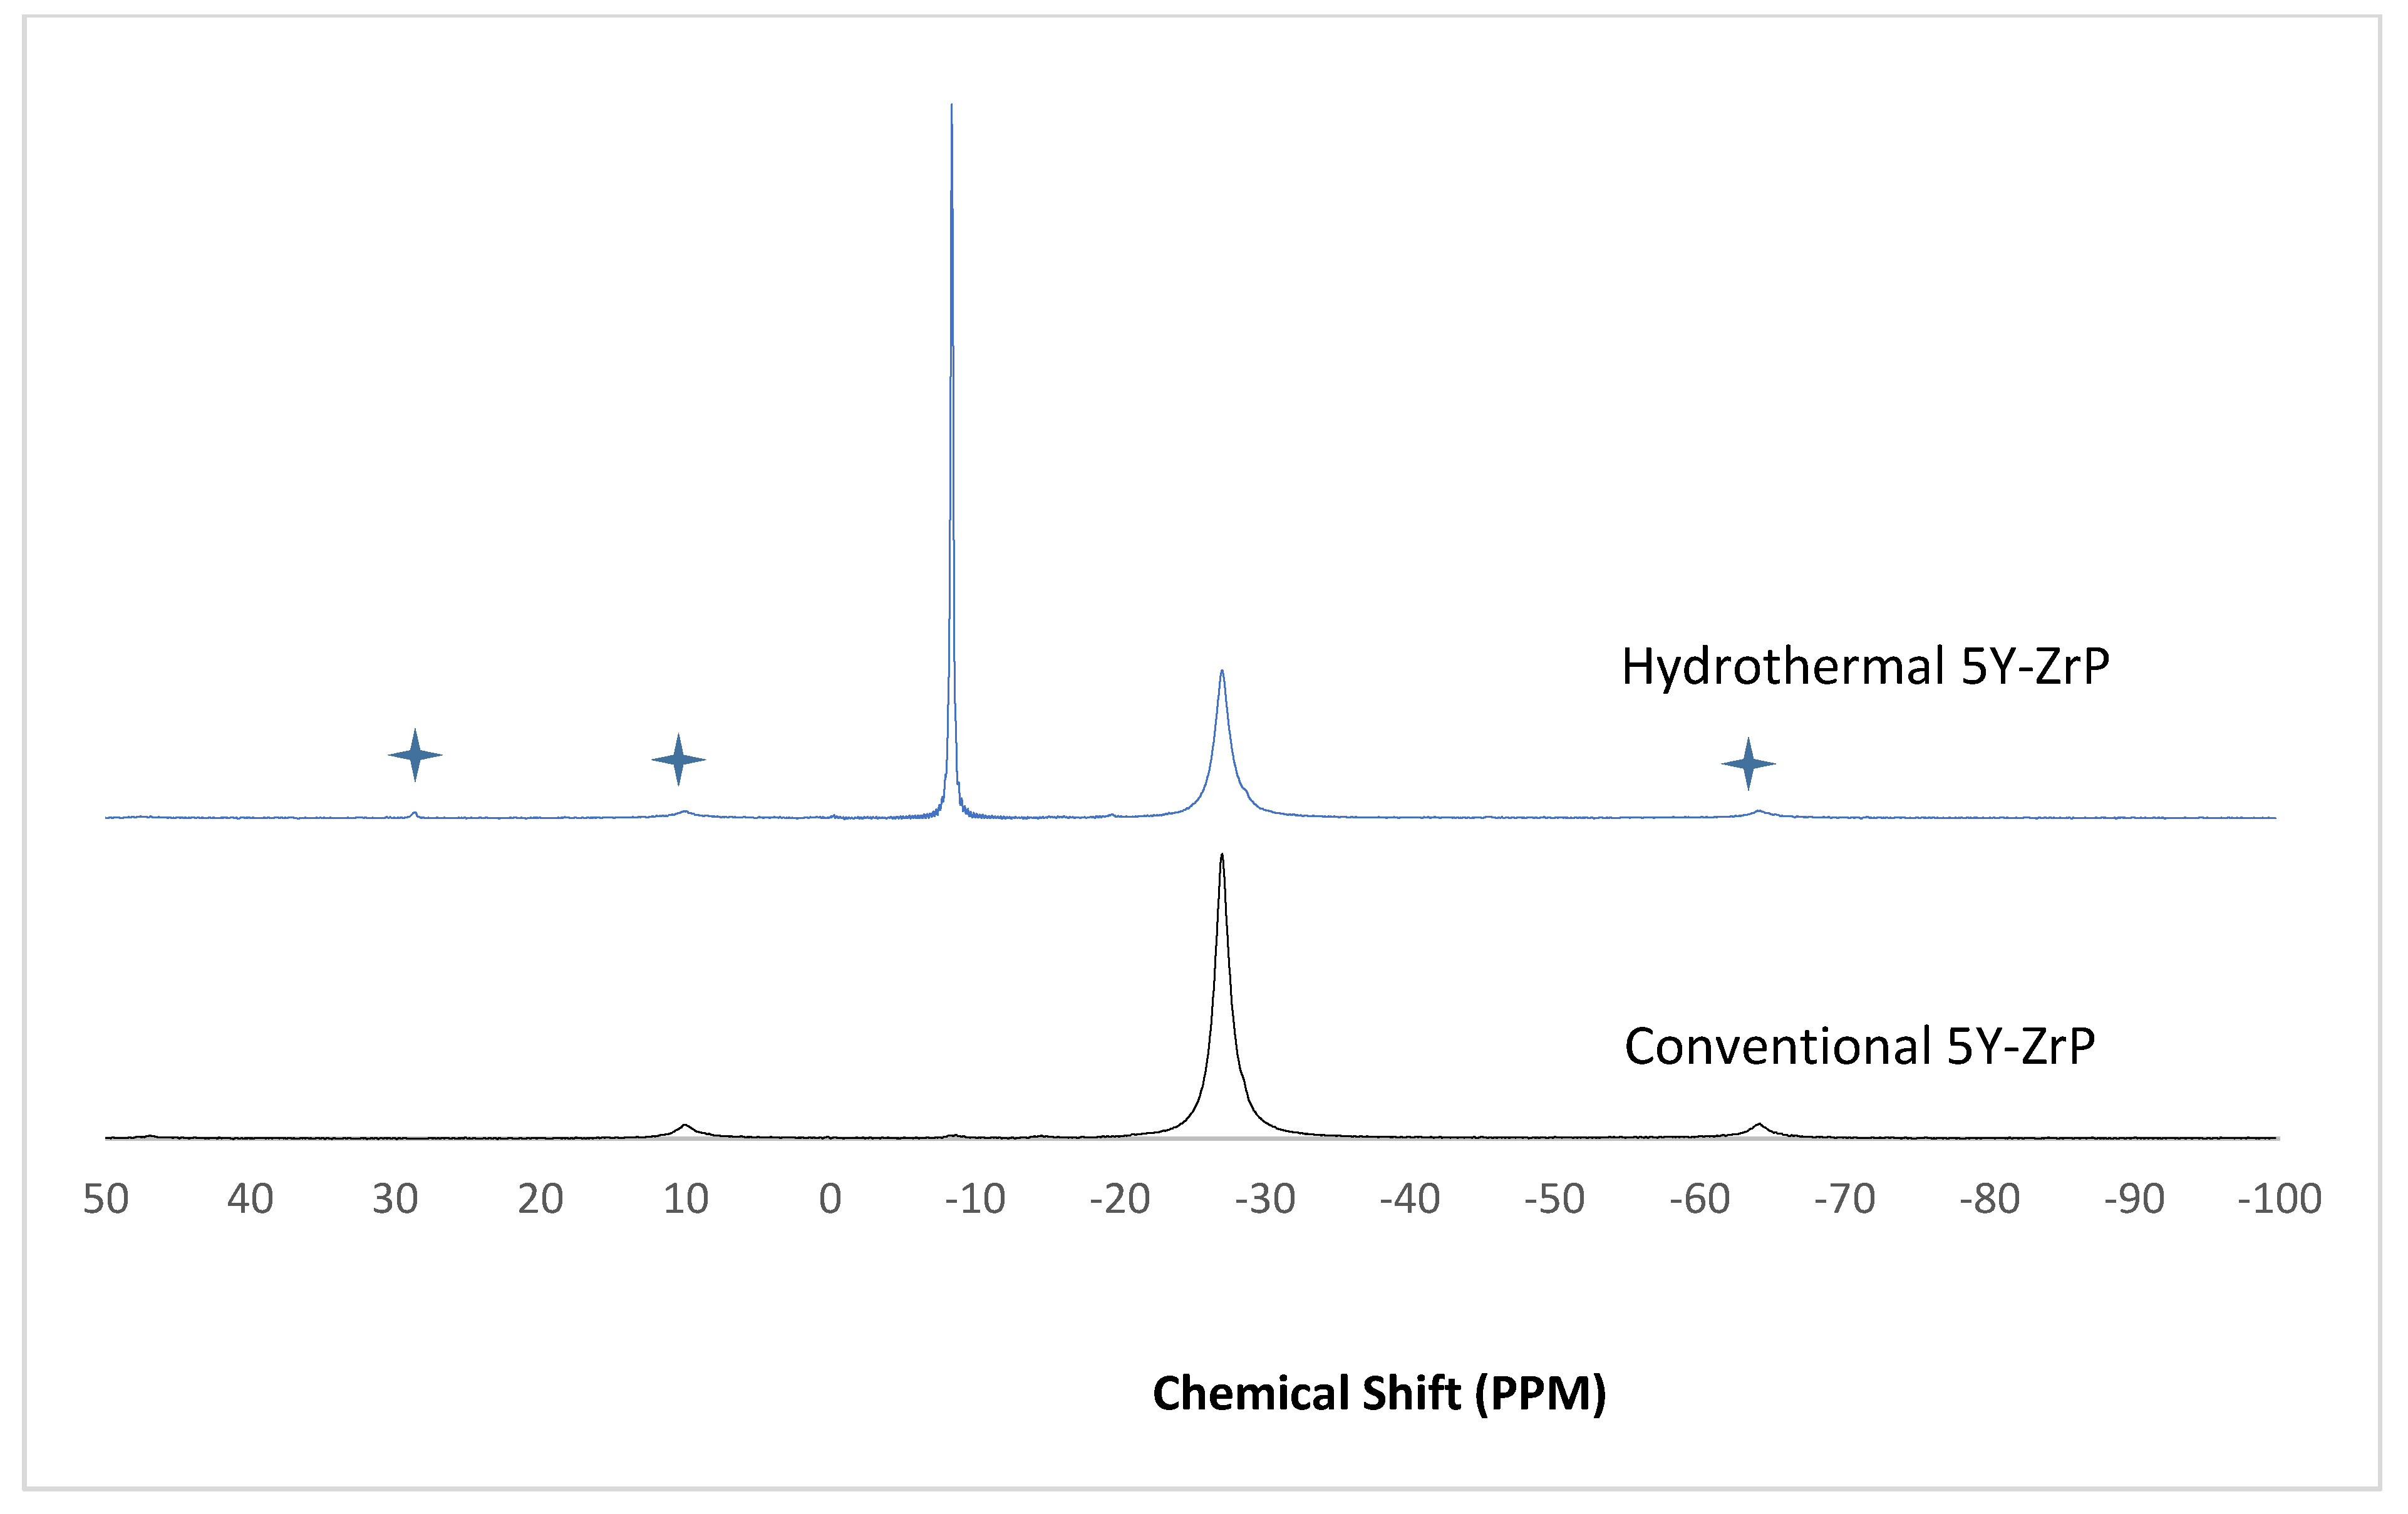
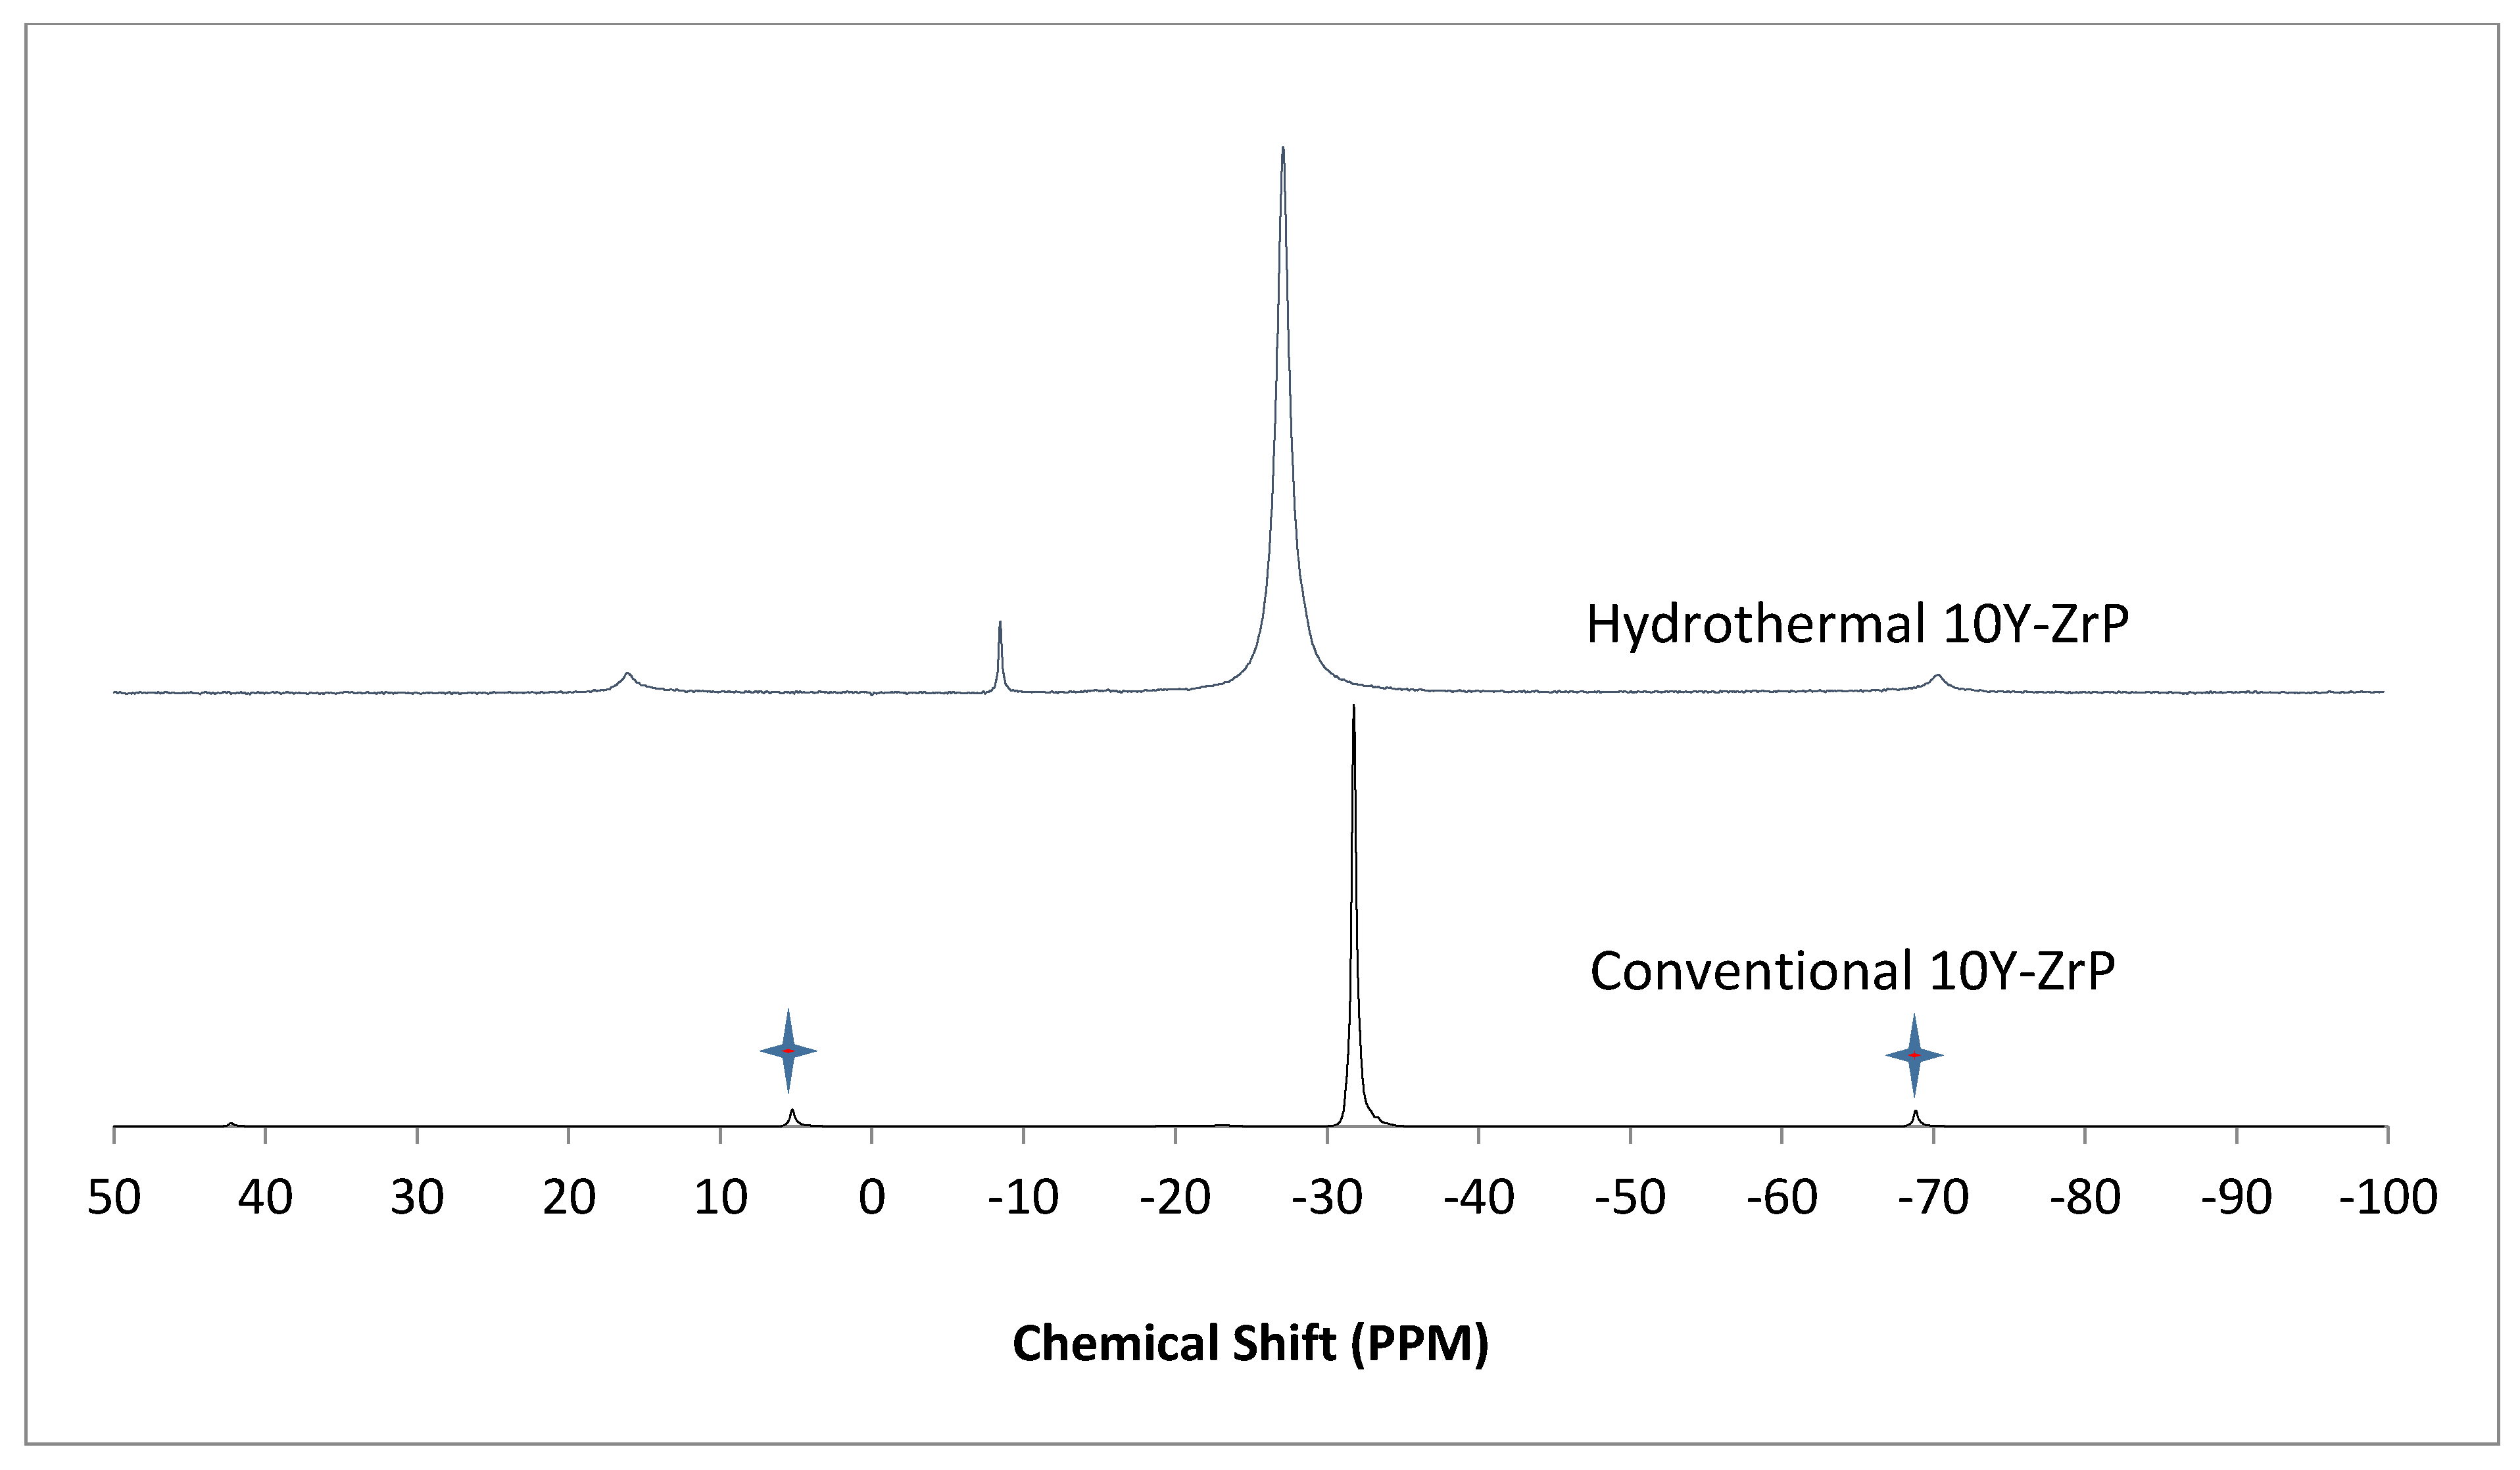
3.4. NMR of Y–ZrP
The α-ZrP and Y–ZrP samples obtained using both methods of synthesis were analysed by solid-state
31P NMR (MAS-NMR), and the results are shown in
Figure 6,
Figure 7,
Figure 8 and
Figure 9. All the resonant peaks in this study were shifted by approximately 7.4 ppm upfield, relative to the ammonium phosphate that was used as an external standard. The results showed that a single peak was present at approximately −27.1 ppm for the refluxed Y–ZrP products, while two peaks at approximately −8.1 ppm and −27.1 ppm were present for the hydrothermal samples. This trend was also observed for the refluxed and hydrothermally synthesised α-ZrP samples. However, the relative intensities of the Y–ZrP peaks at −8.1 ppm and −27.1 ppm had a ratio of 3:1 as compared to those of α-ZrP peaks, for which the peak at −8.1 ppm was highly damped.
The presence of an intense peak at −8.1 ppm is thought to be related to the yttrium substitution which took place at the O–Zr sites that exhibited unshielded protons from the phosphate groups. This led to an increase in the dipolar interactions between the protons and the phosphorus nuclei and hence increased the peak intensity due to cross polarisation. The narrow and sharp appearance of this peak as compared to the relatively broader peaks of the parent α-ZrP might be due to the line broadening effect in the latter caused by fast decay of the nuclei signal. However, it could also be possible that the increased intensity of the peak at −8.1 ppm was due to the increased presence of [H
2PO
4]
− groups in addition to [HPO
4]
2− groups, due to the charge imbalance created by yttrium doping, since the integrated peak areas showed that the peak at −27.1 ppm was 1.5 times that at −8.1 ppm. Finally, the
31P NMR spectrum for YPO
4, as shown in the literature [
19], indicates an intense peak with a chemical shift of −19.34 ppm along with two very weak peaks present at −8.29 ppm and −15.54 ppm (corrected upfield shifts). The absence of these peaks for the synthesised Y–ZrP samples discount the presence of a YPO
4 phase in the products. This relevantly confirmed the hypothesis whereby increased proton sites were achieved by doping a trivalent cation at the sites of a tetravalent metal framework.
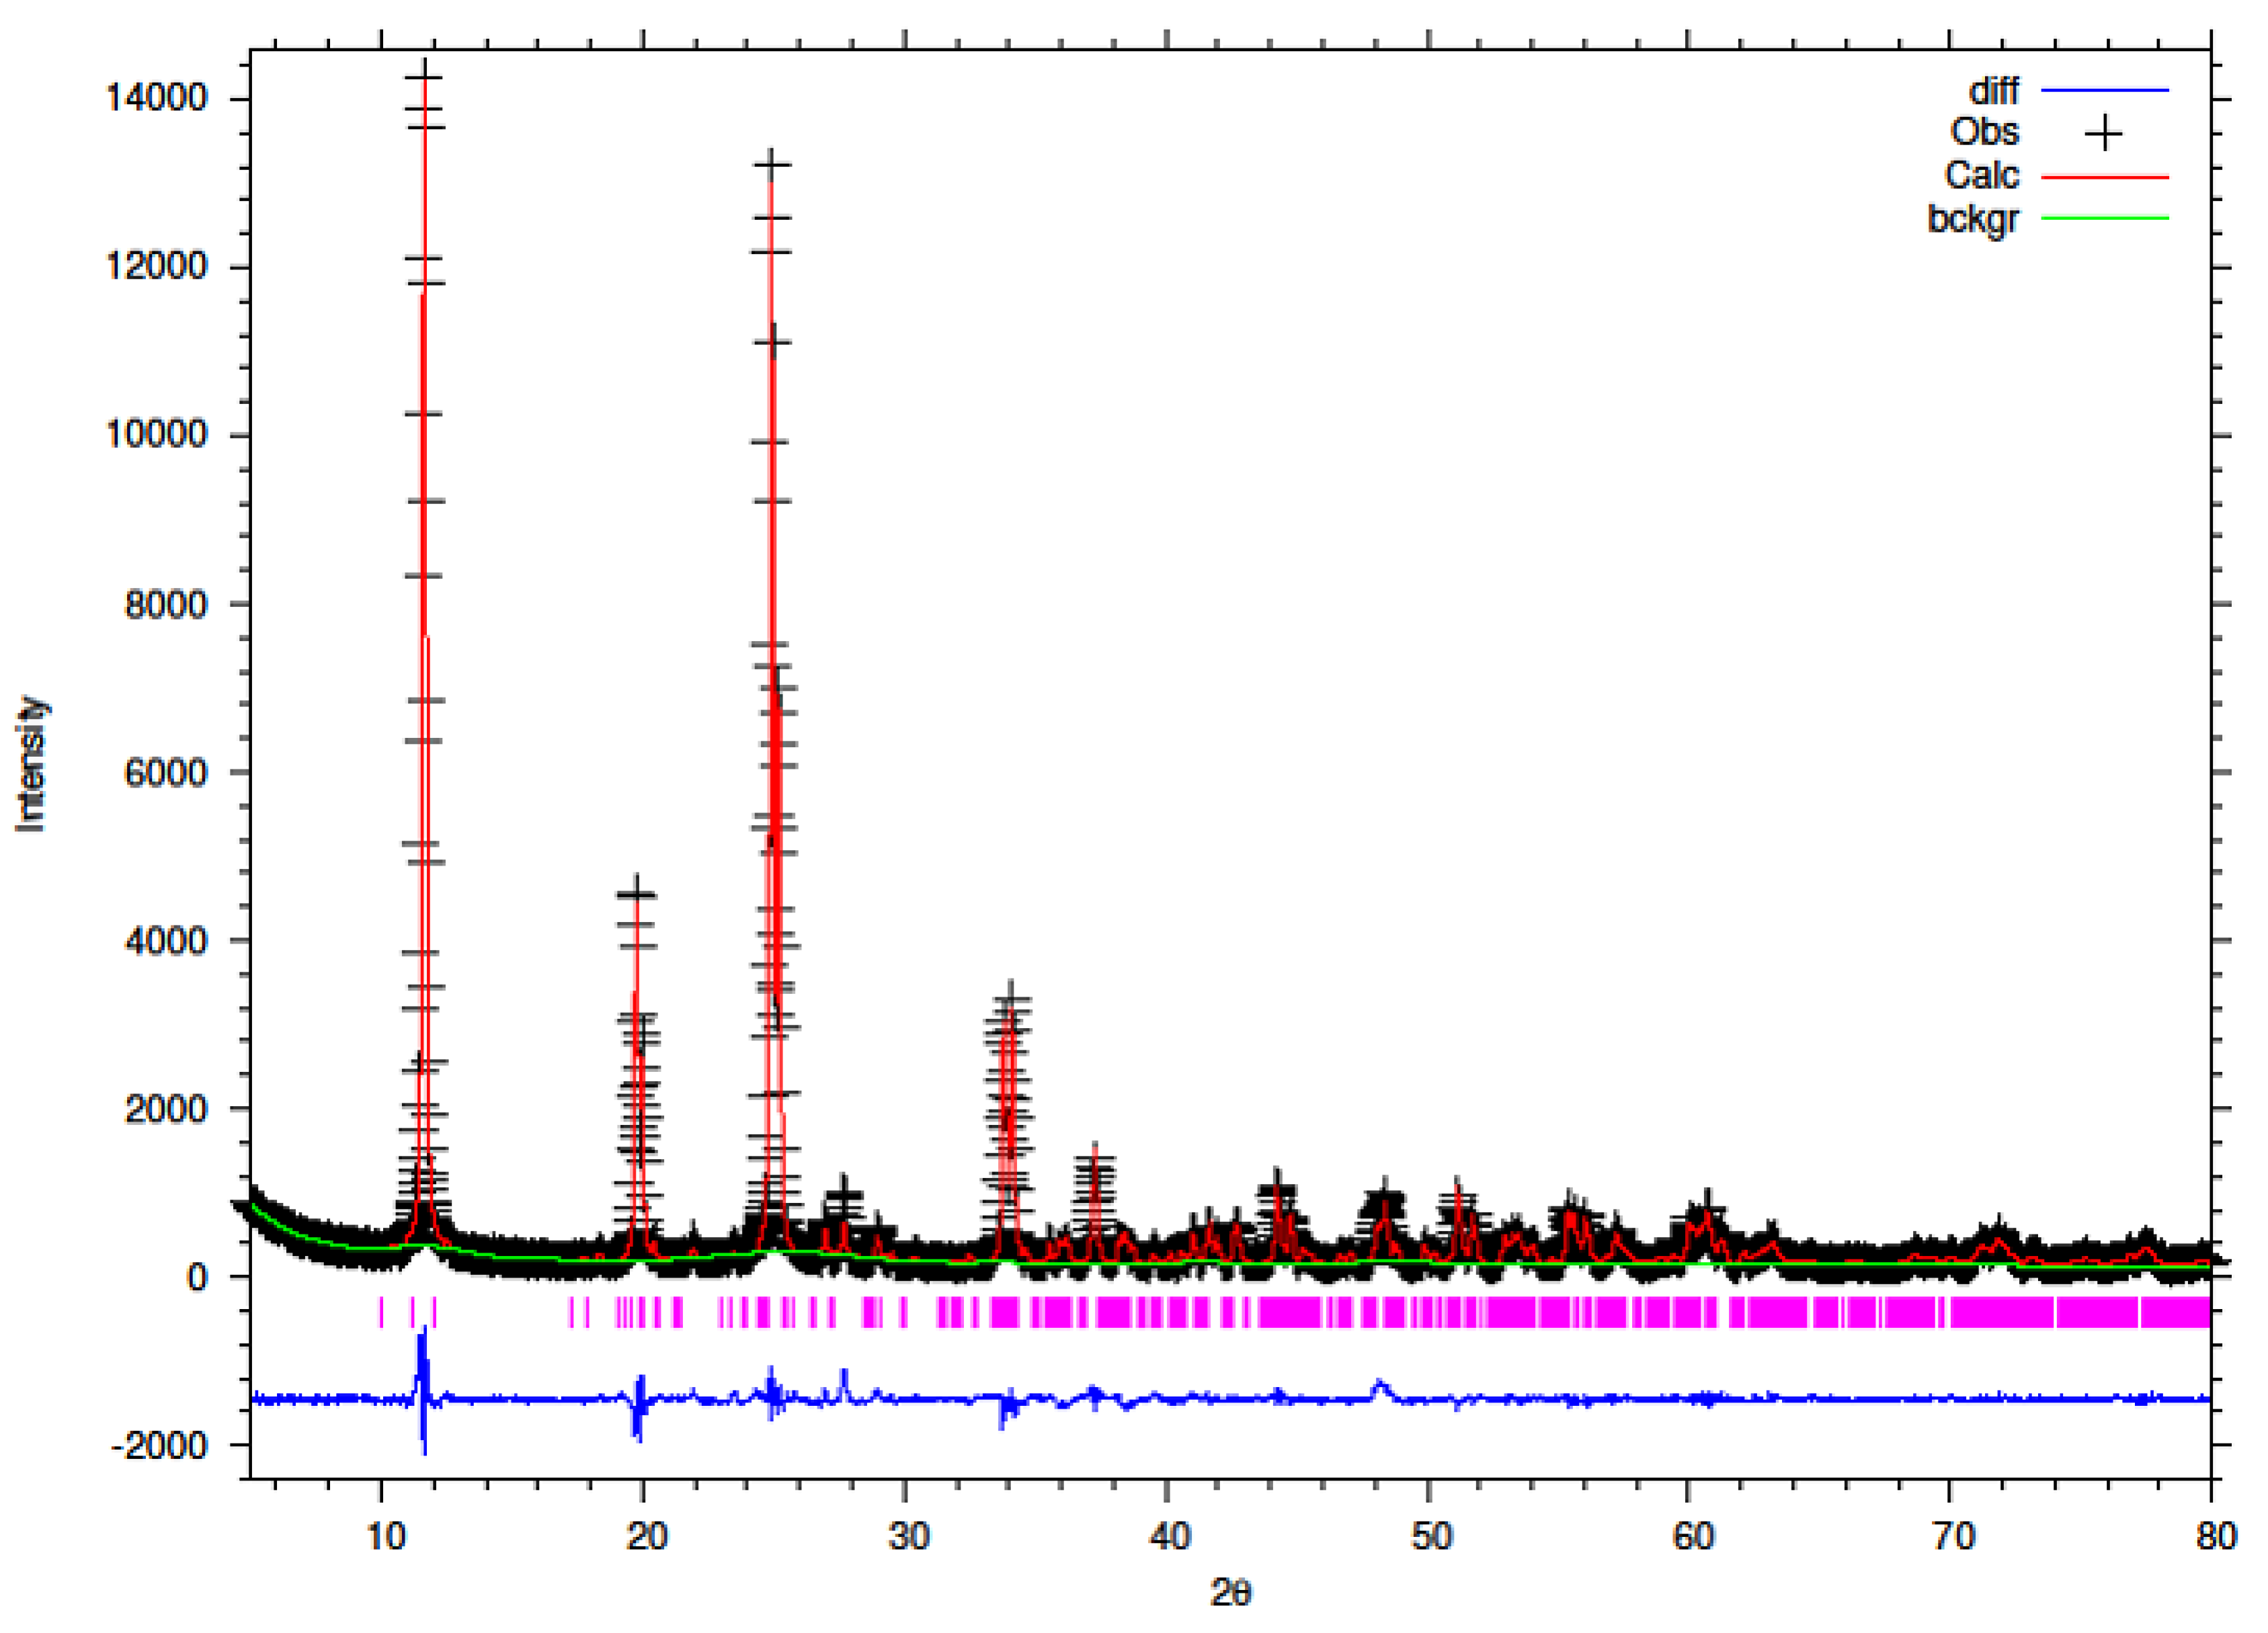
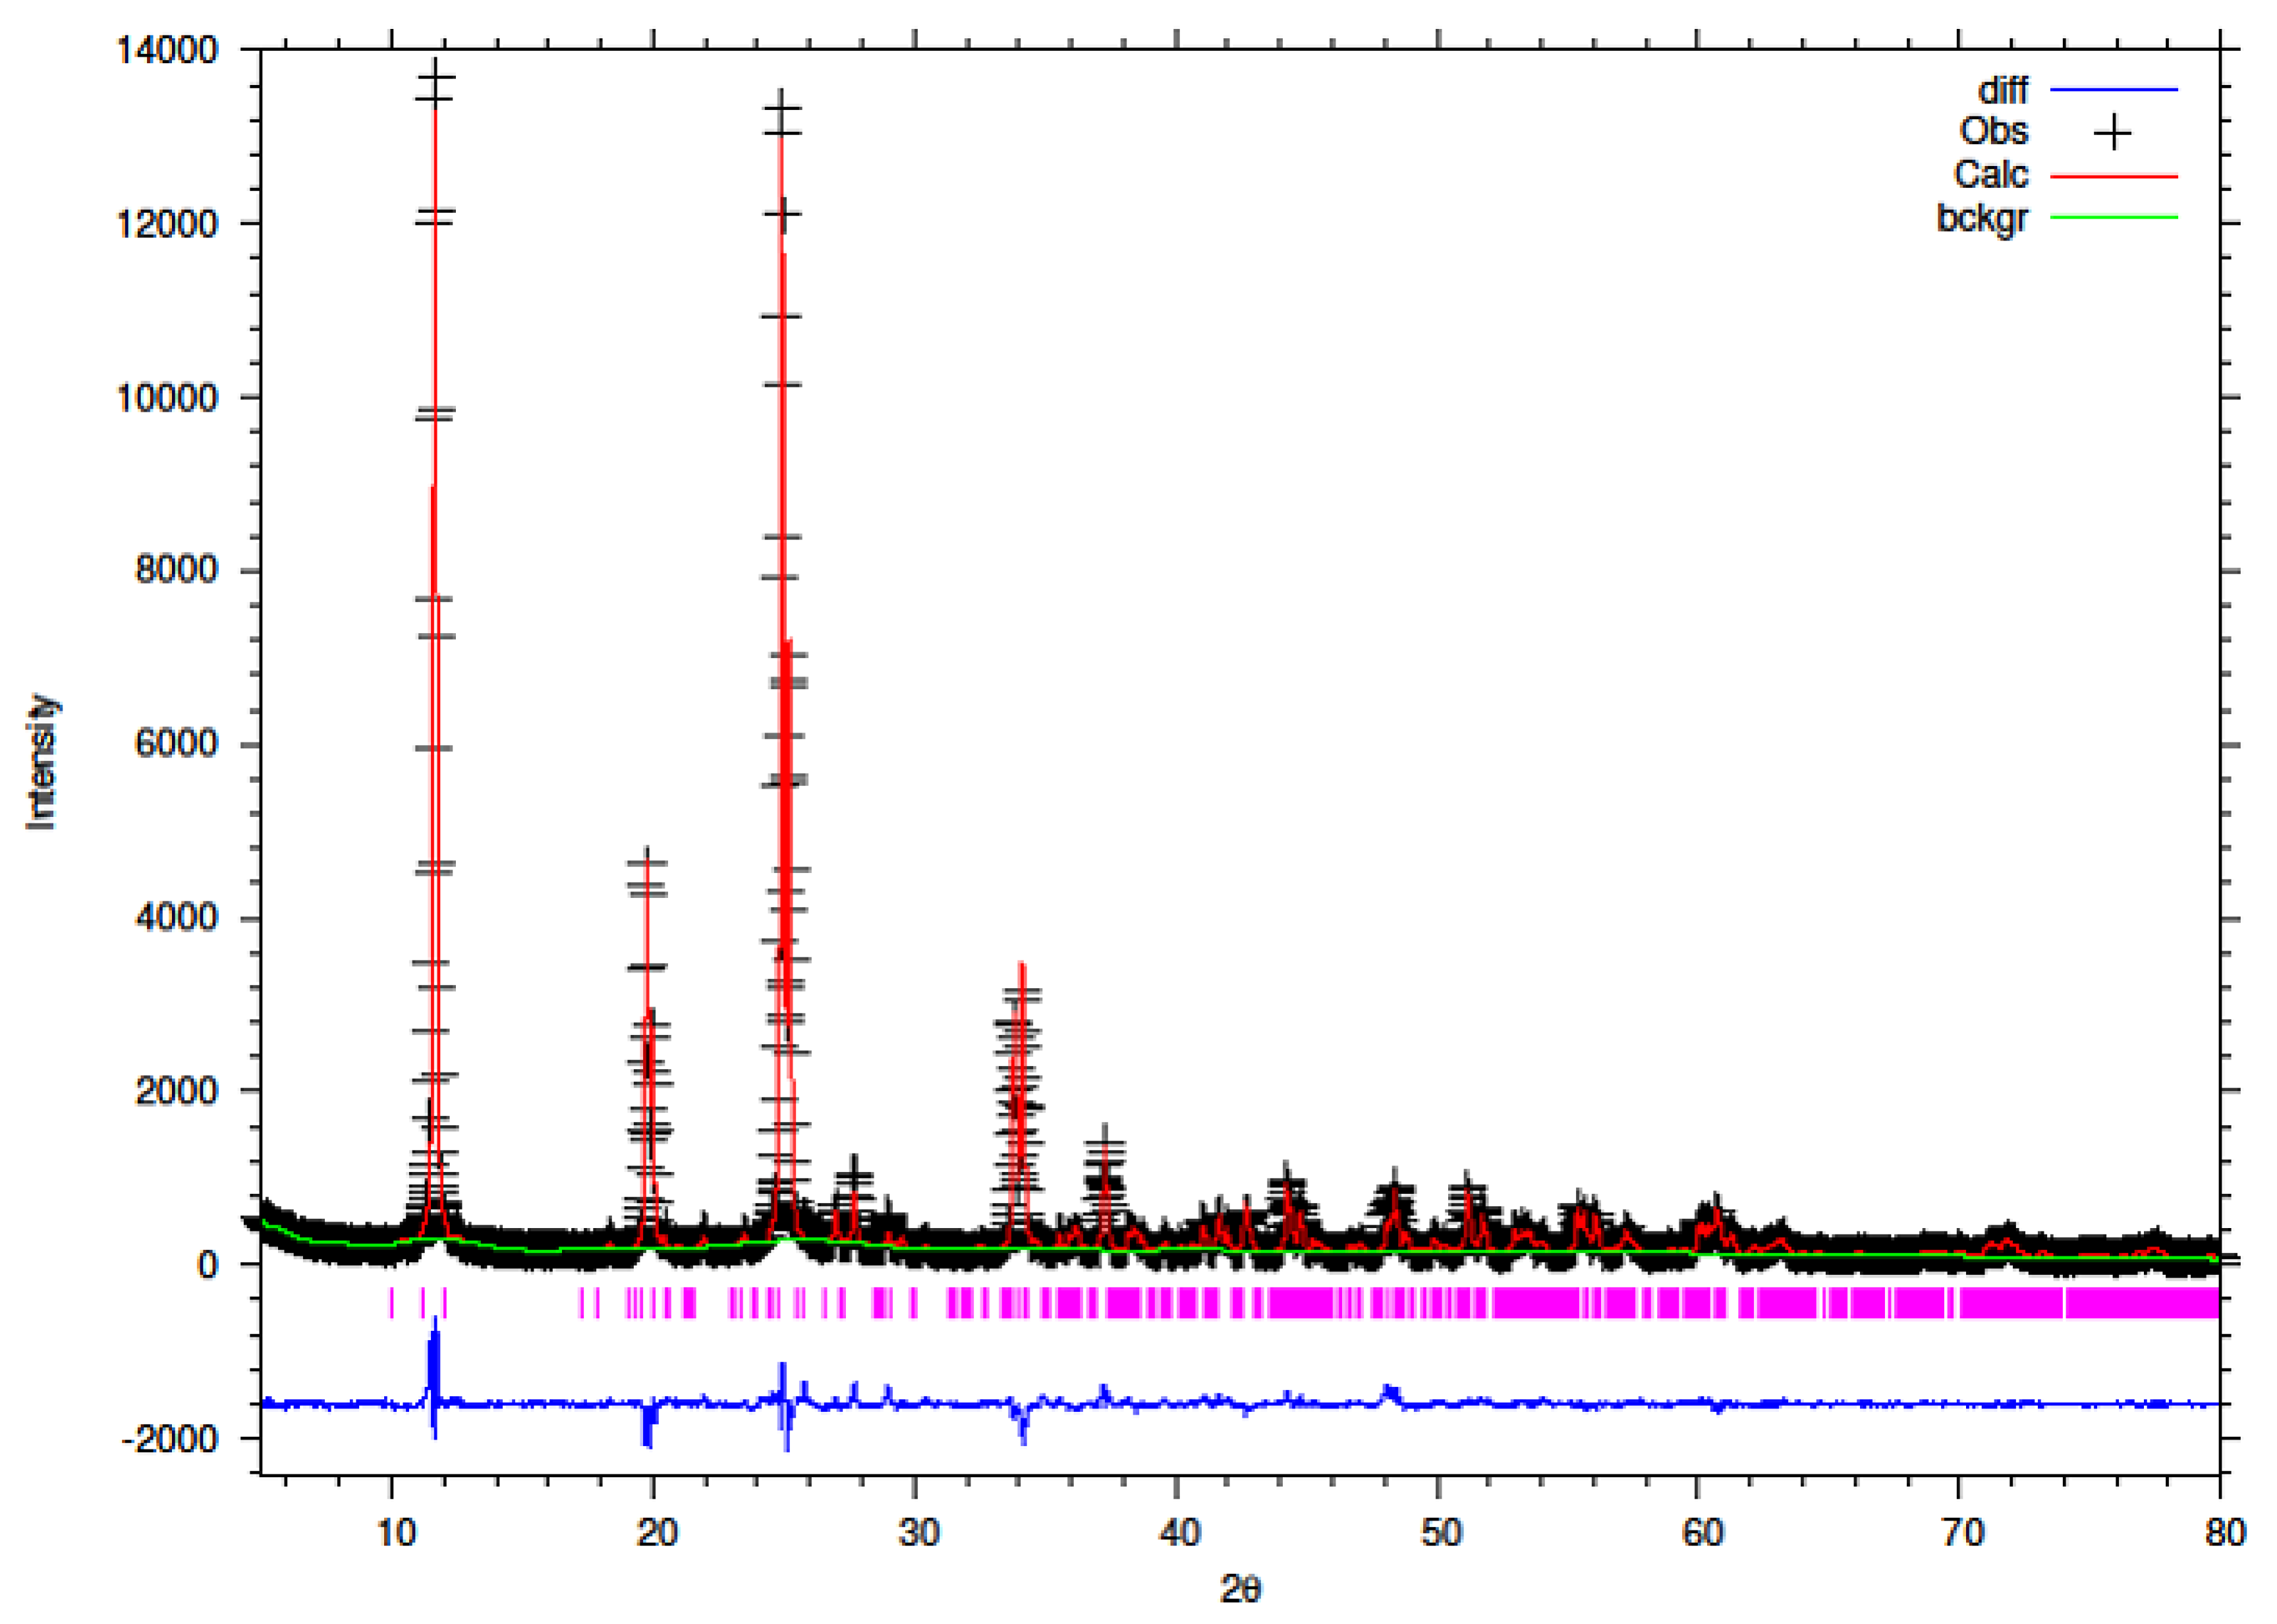
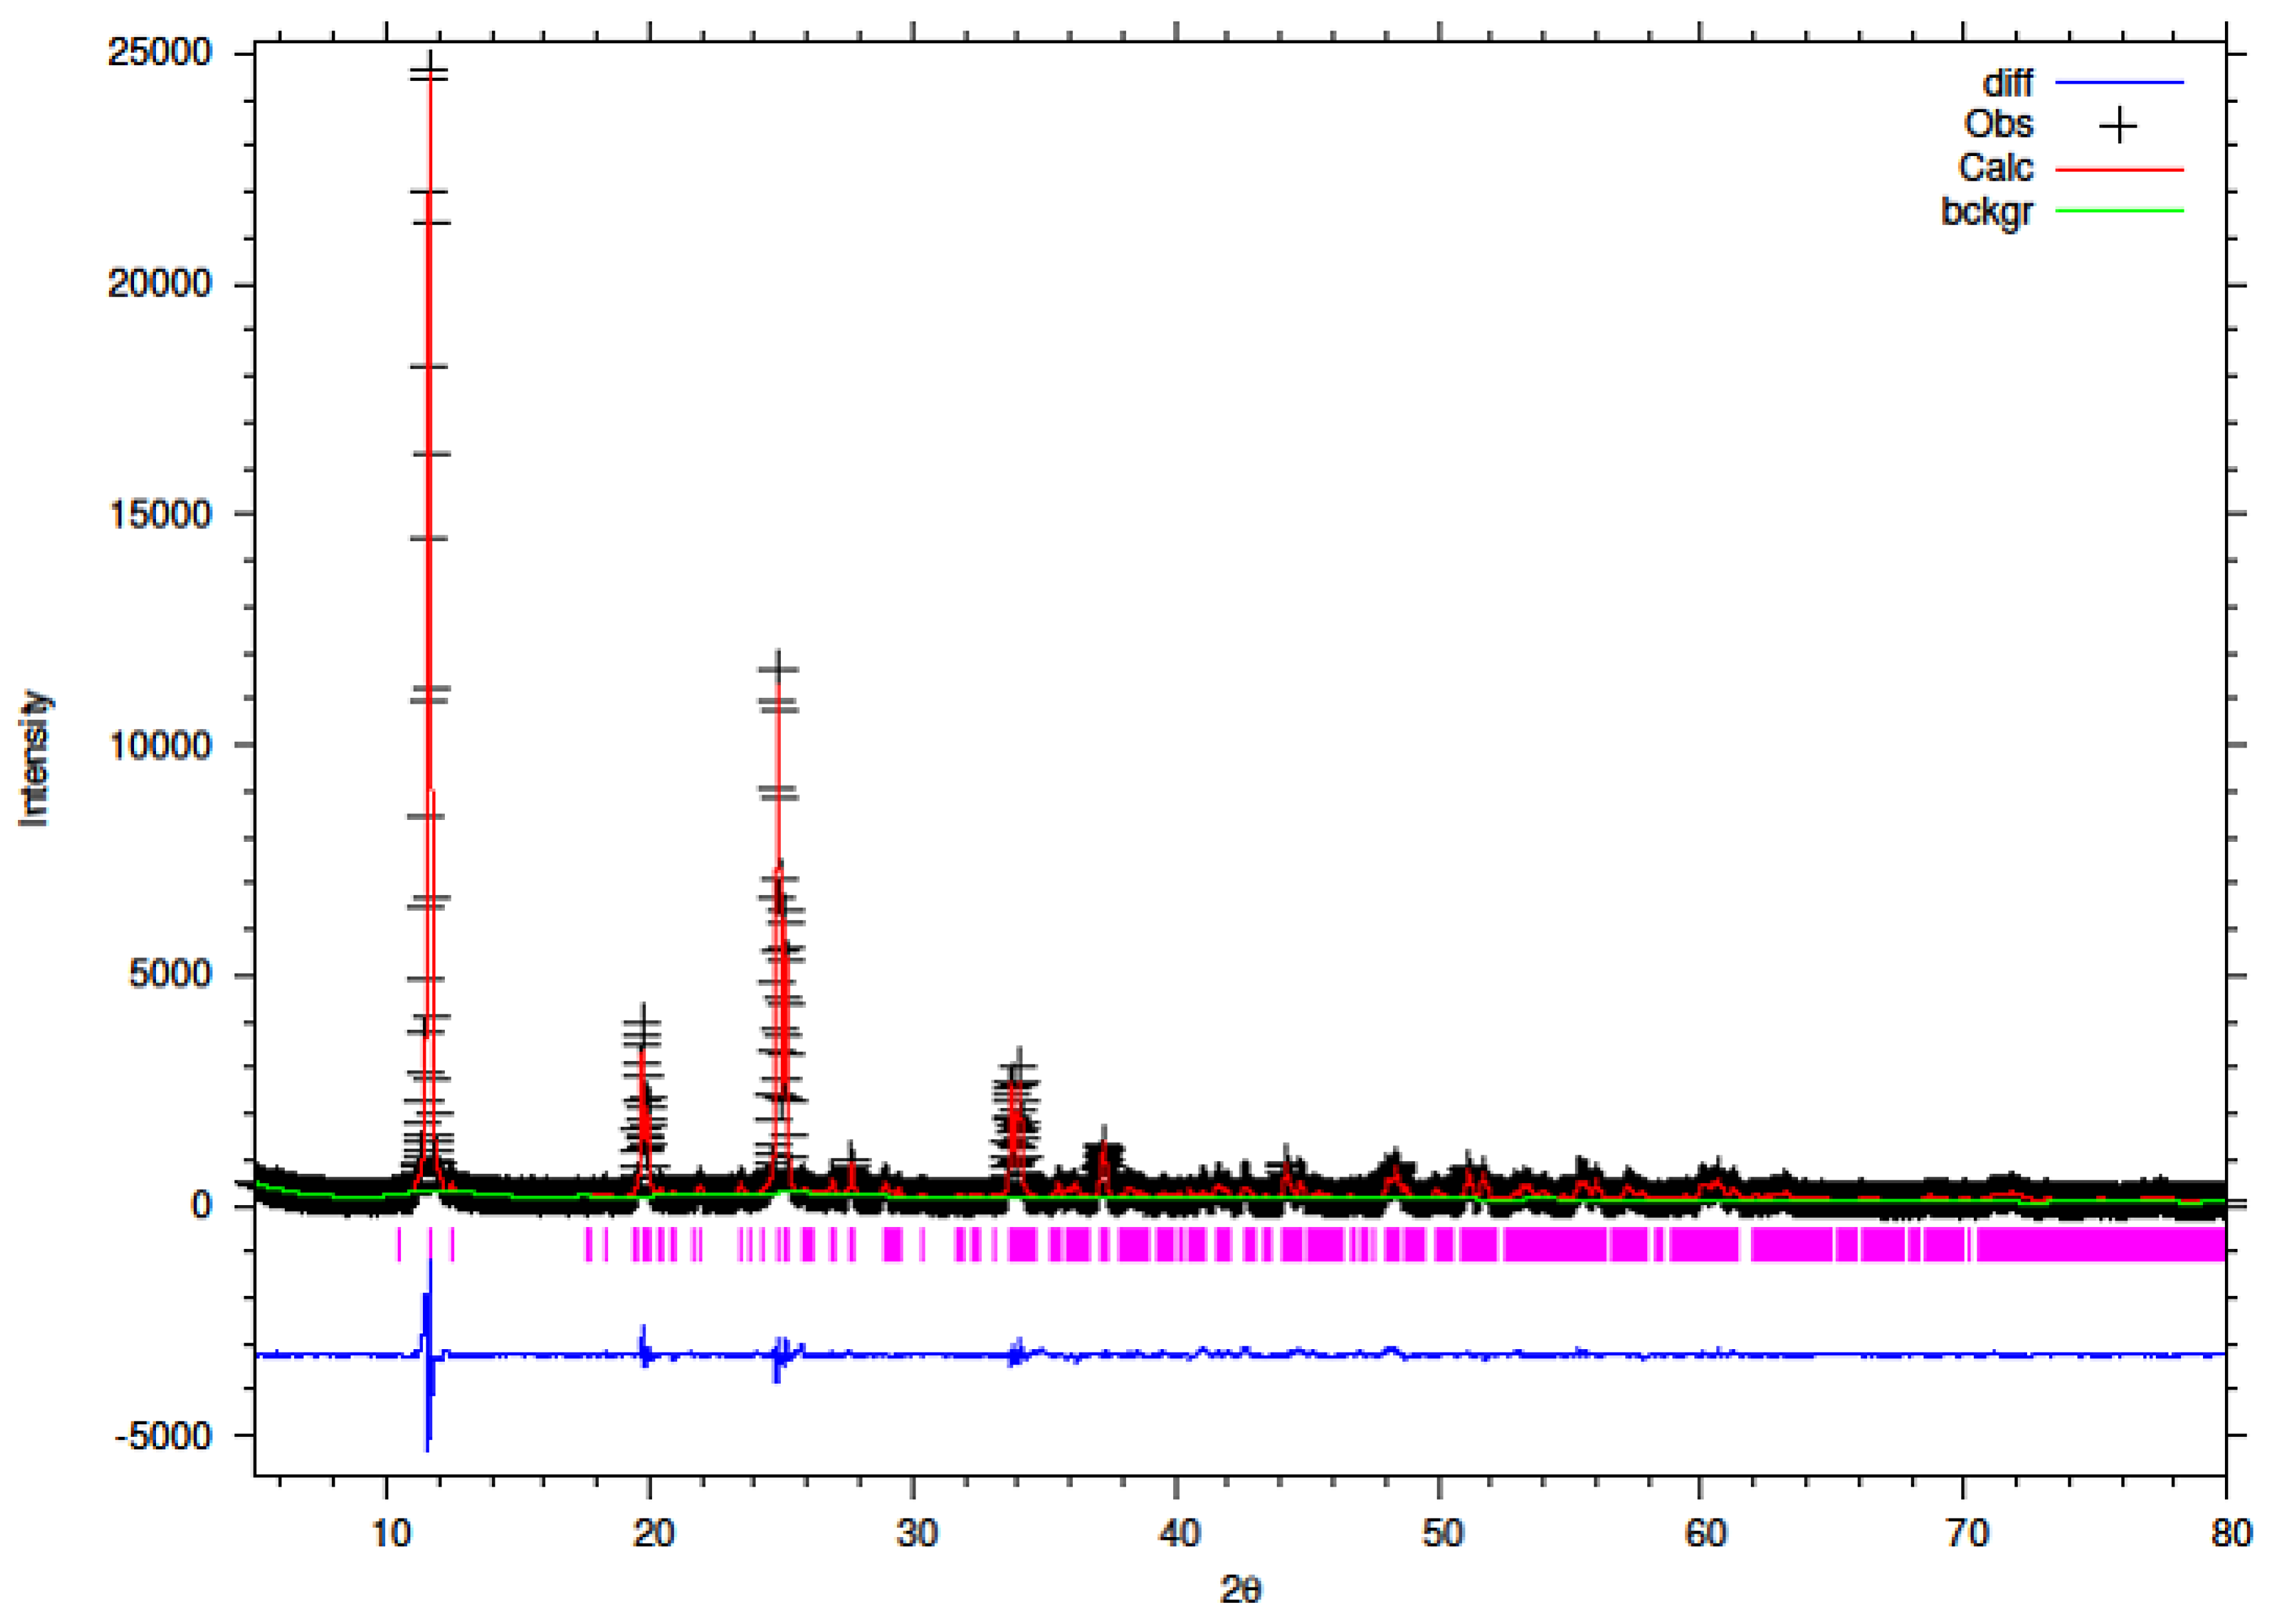
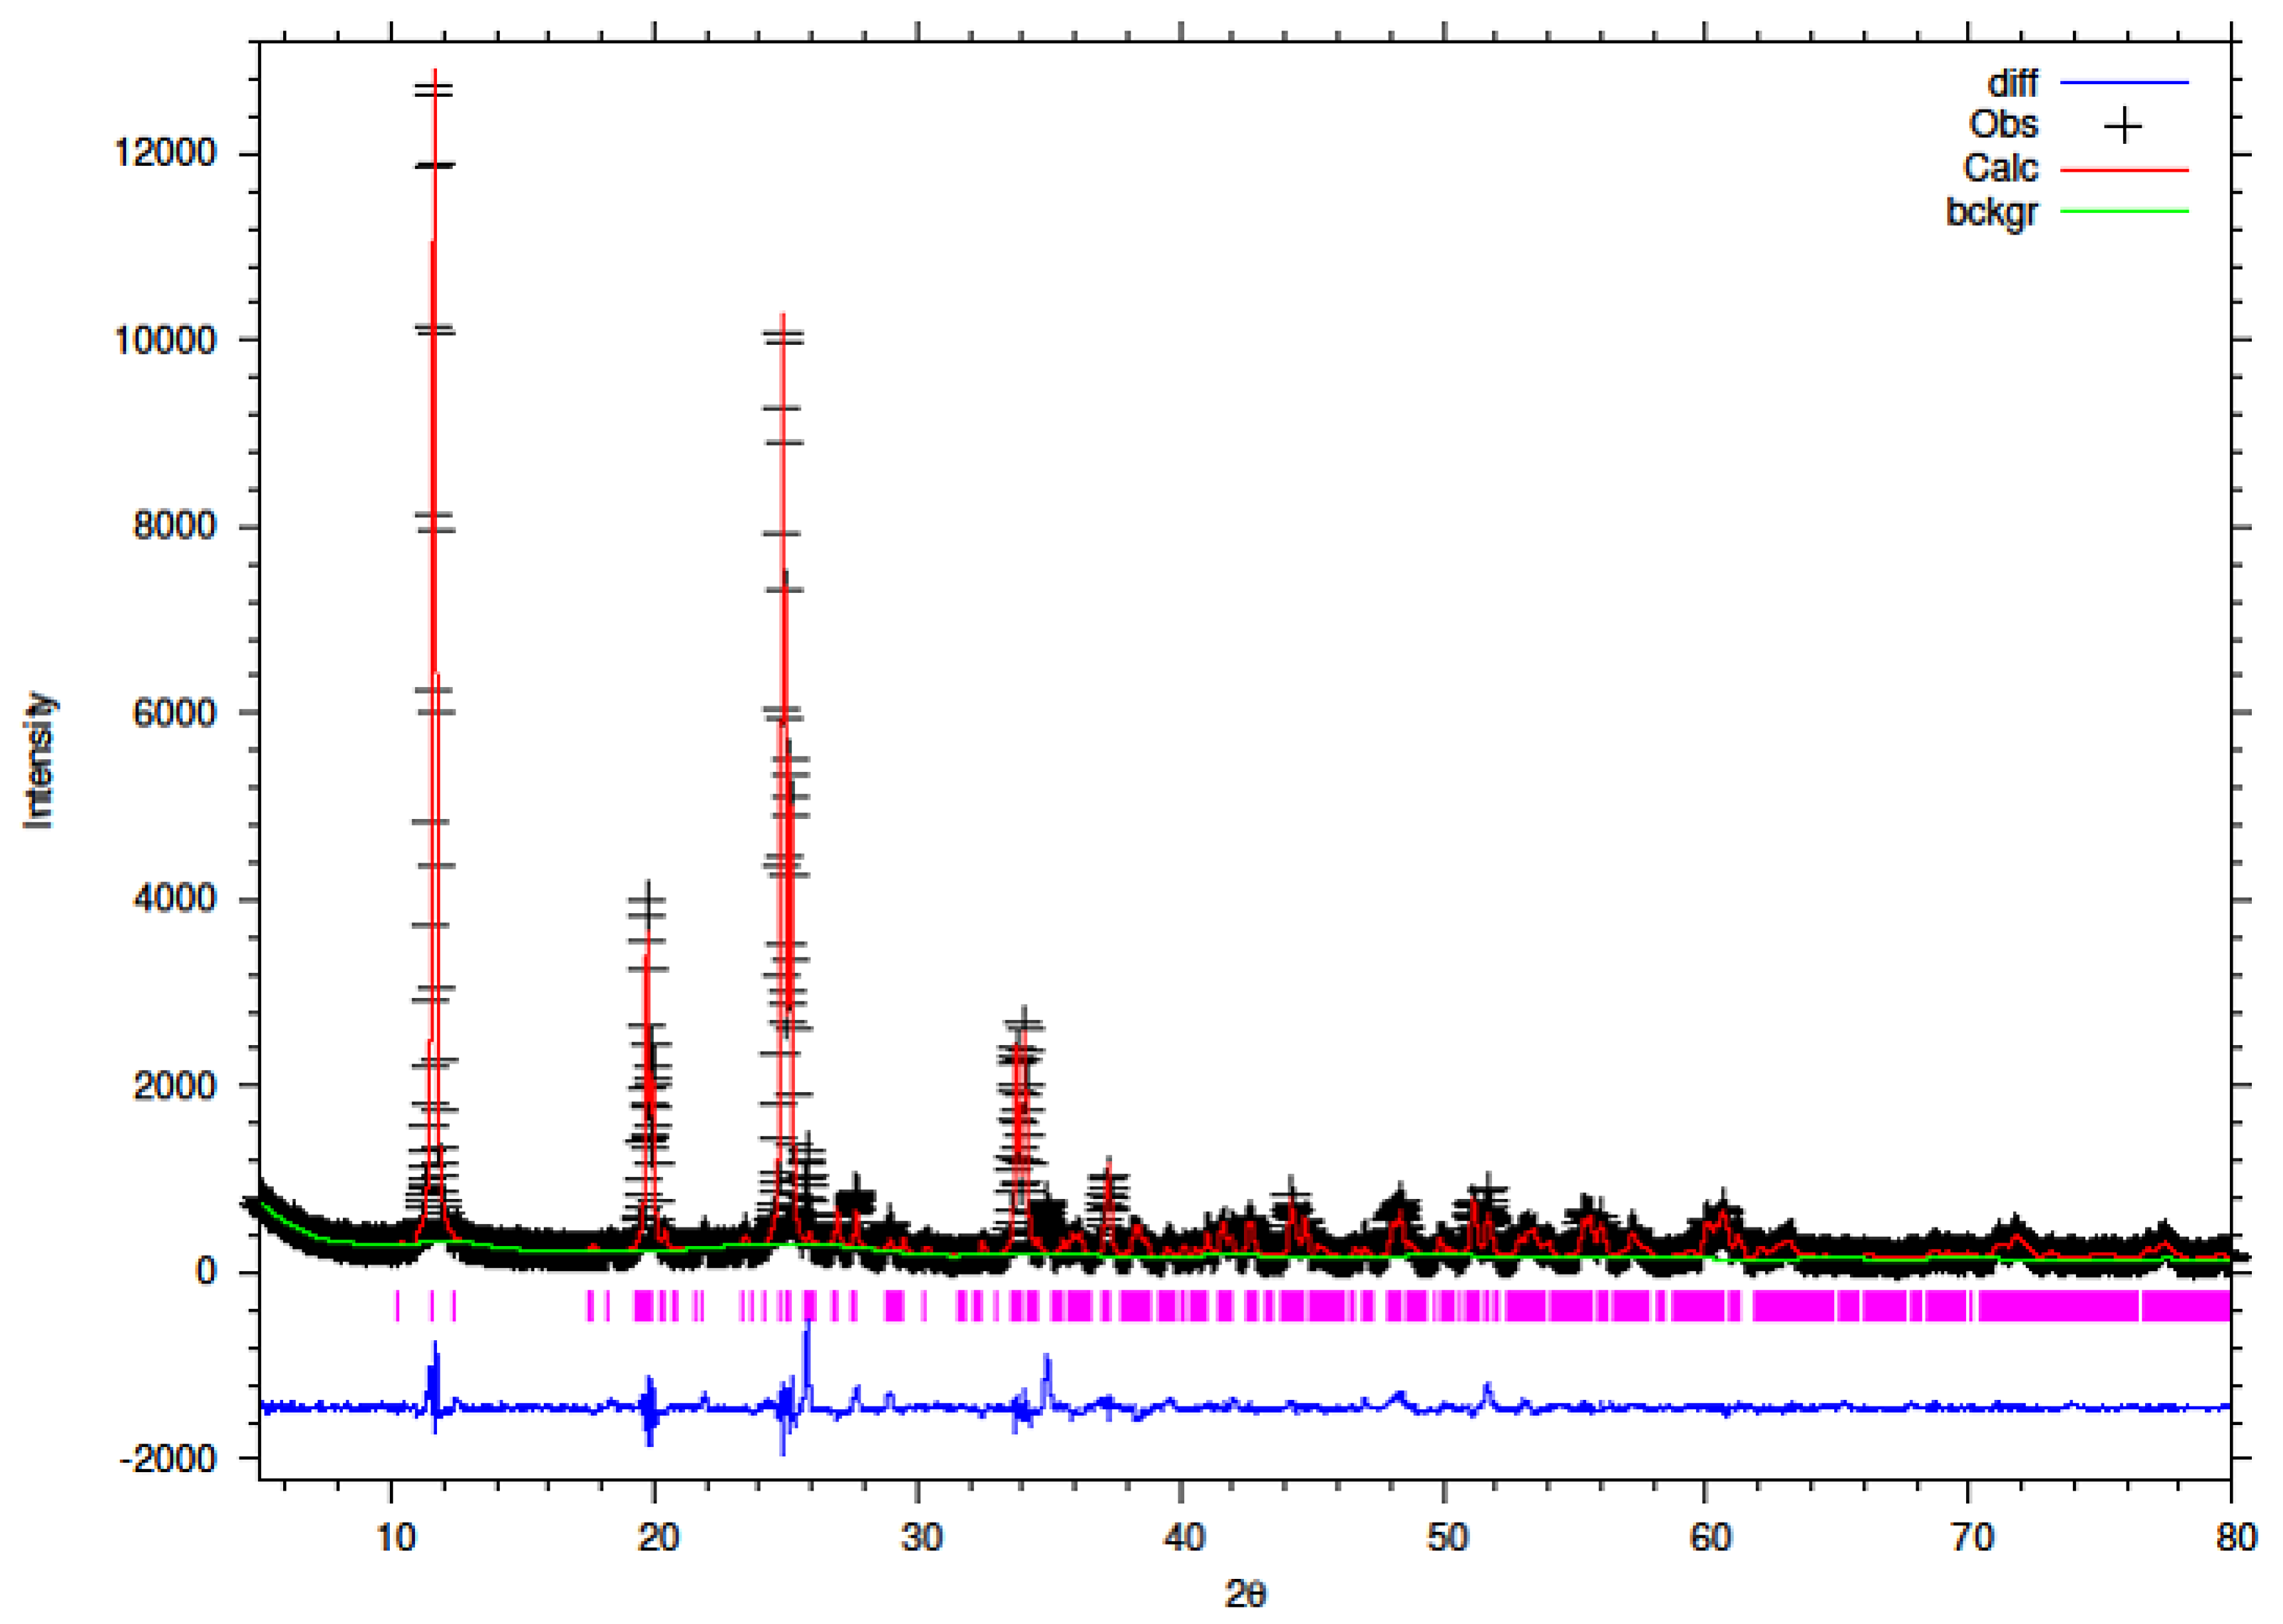
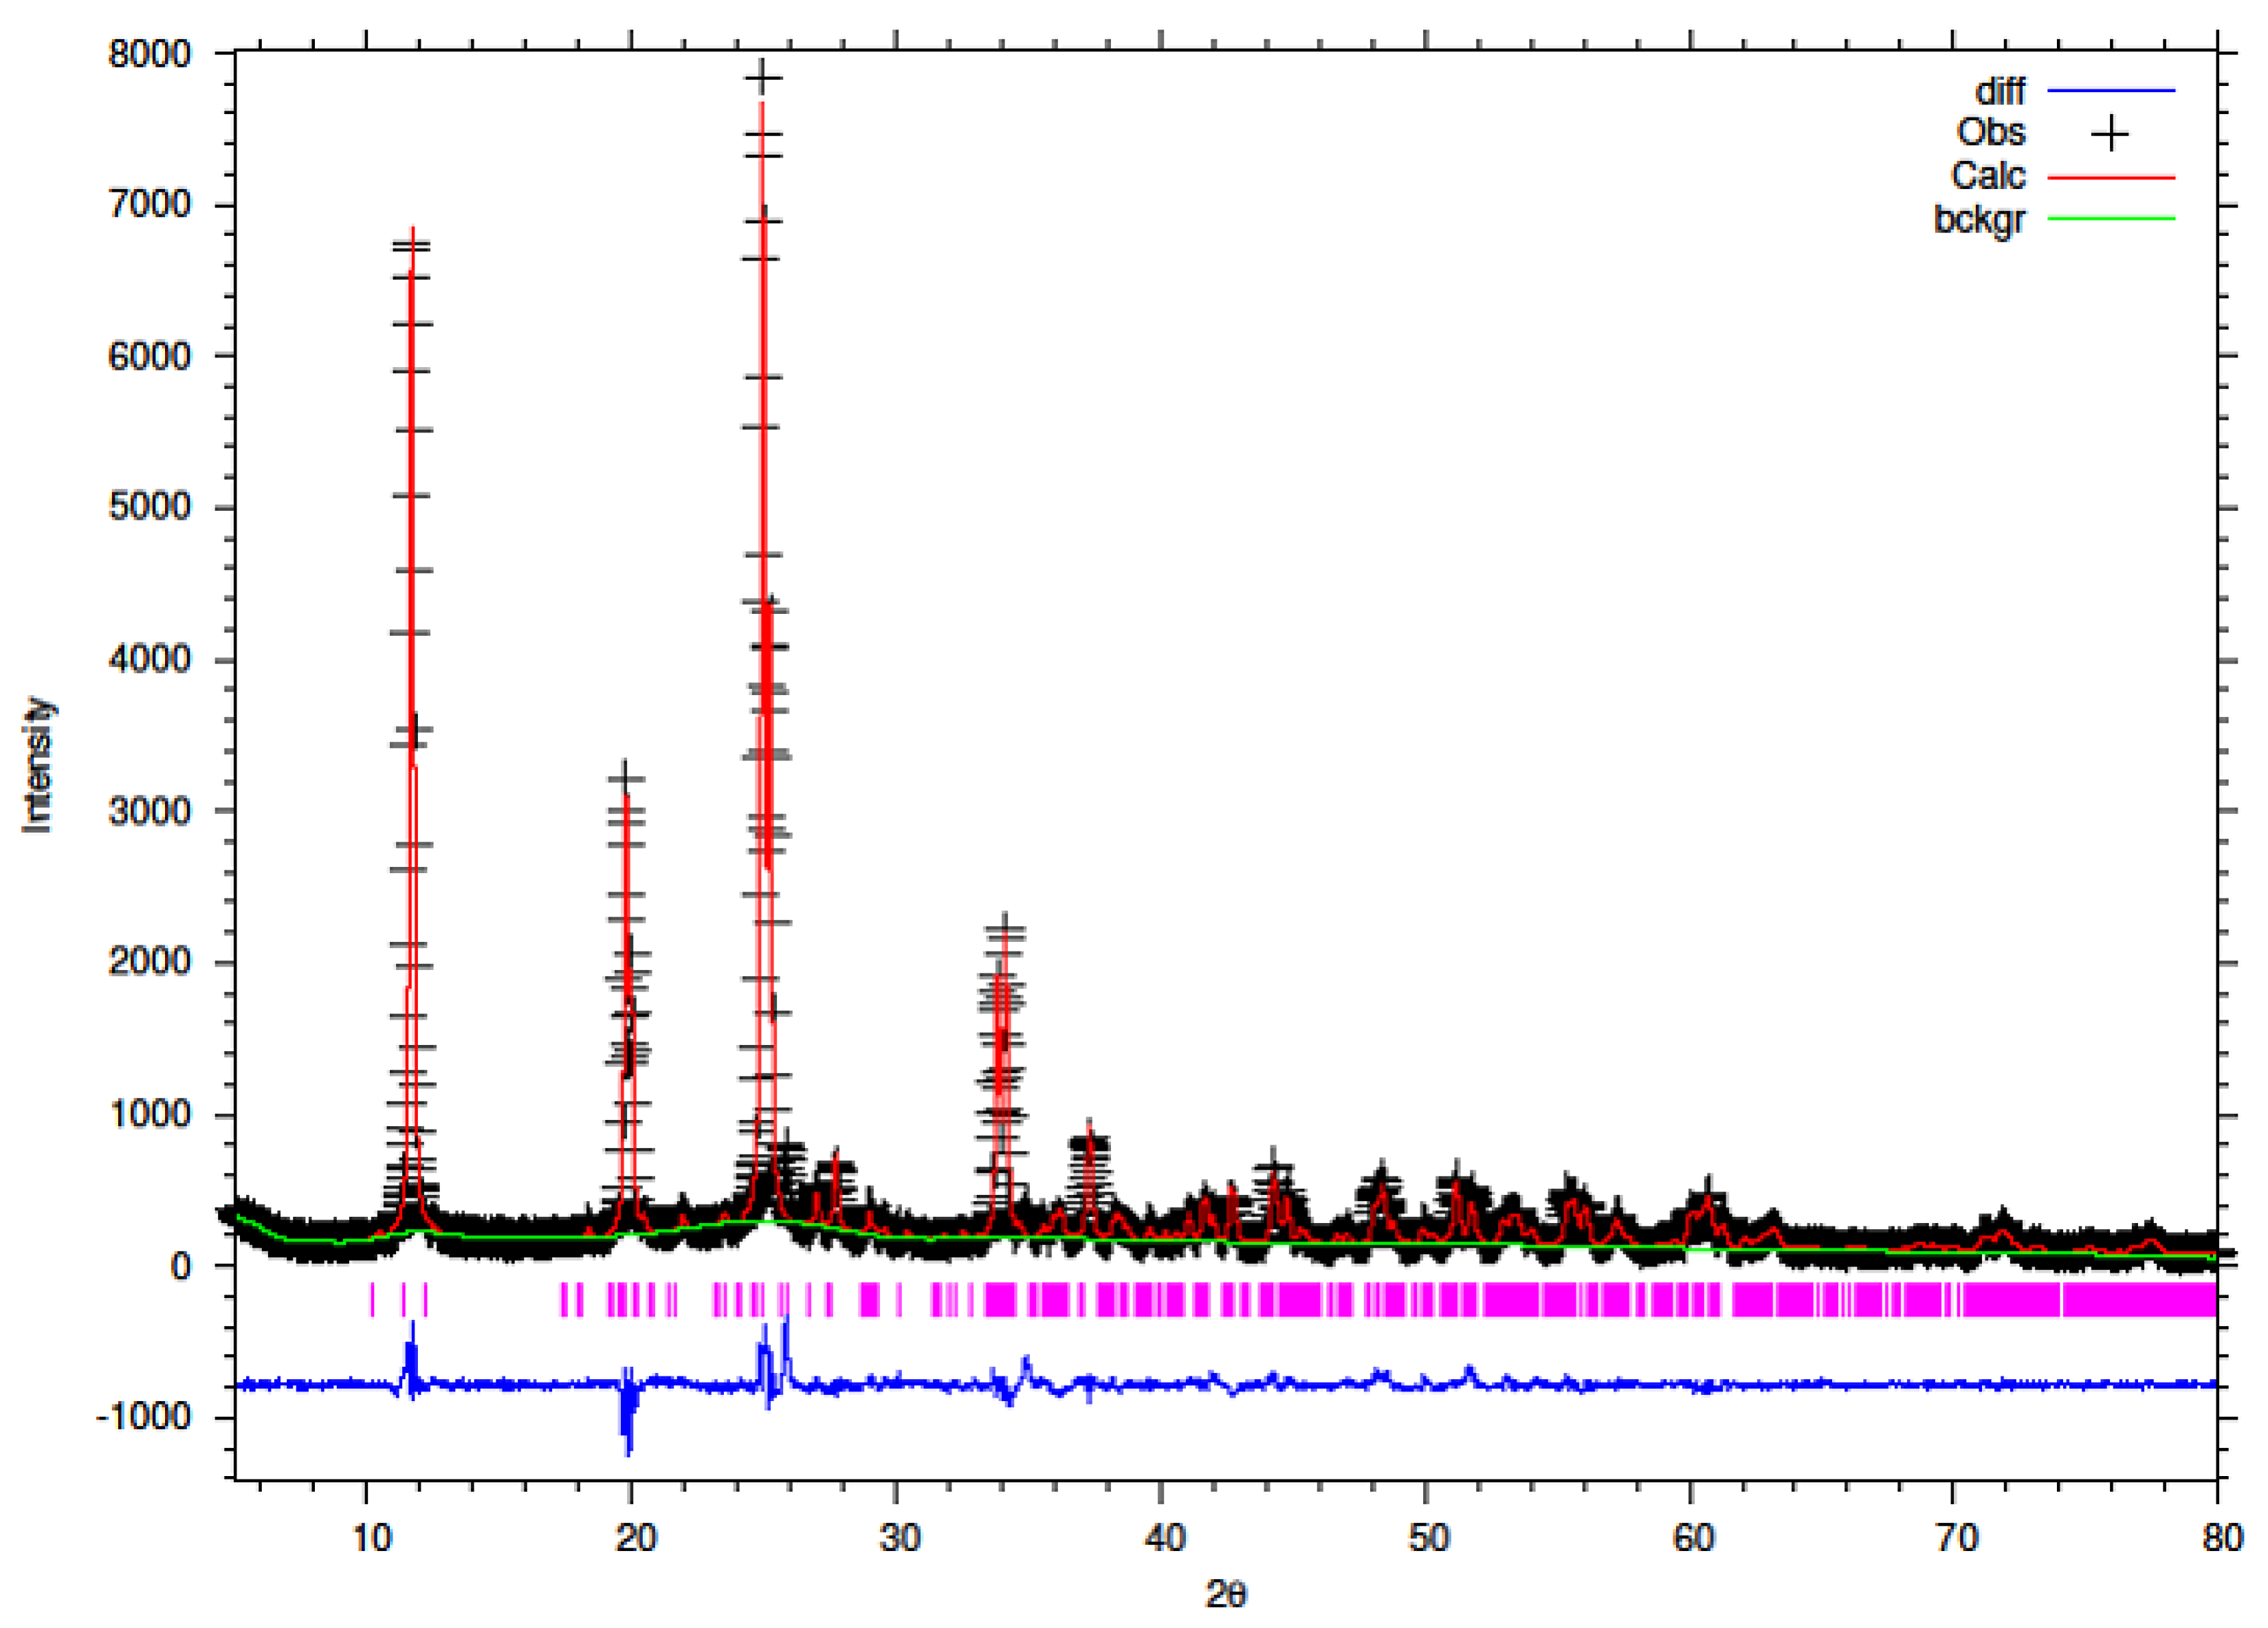
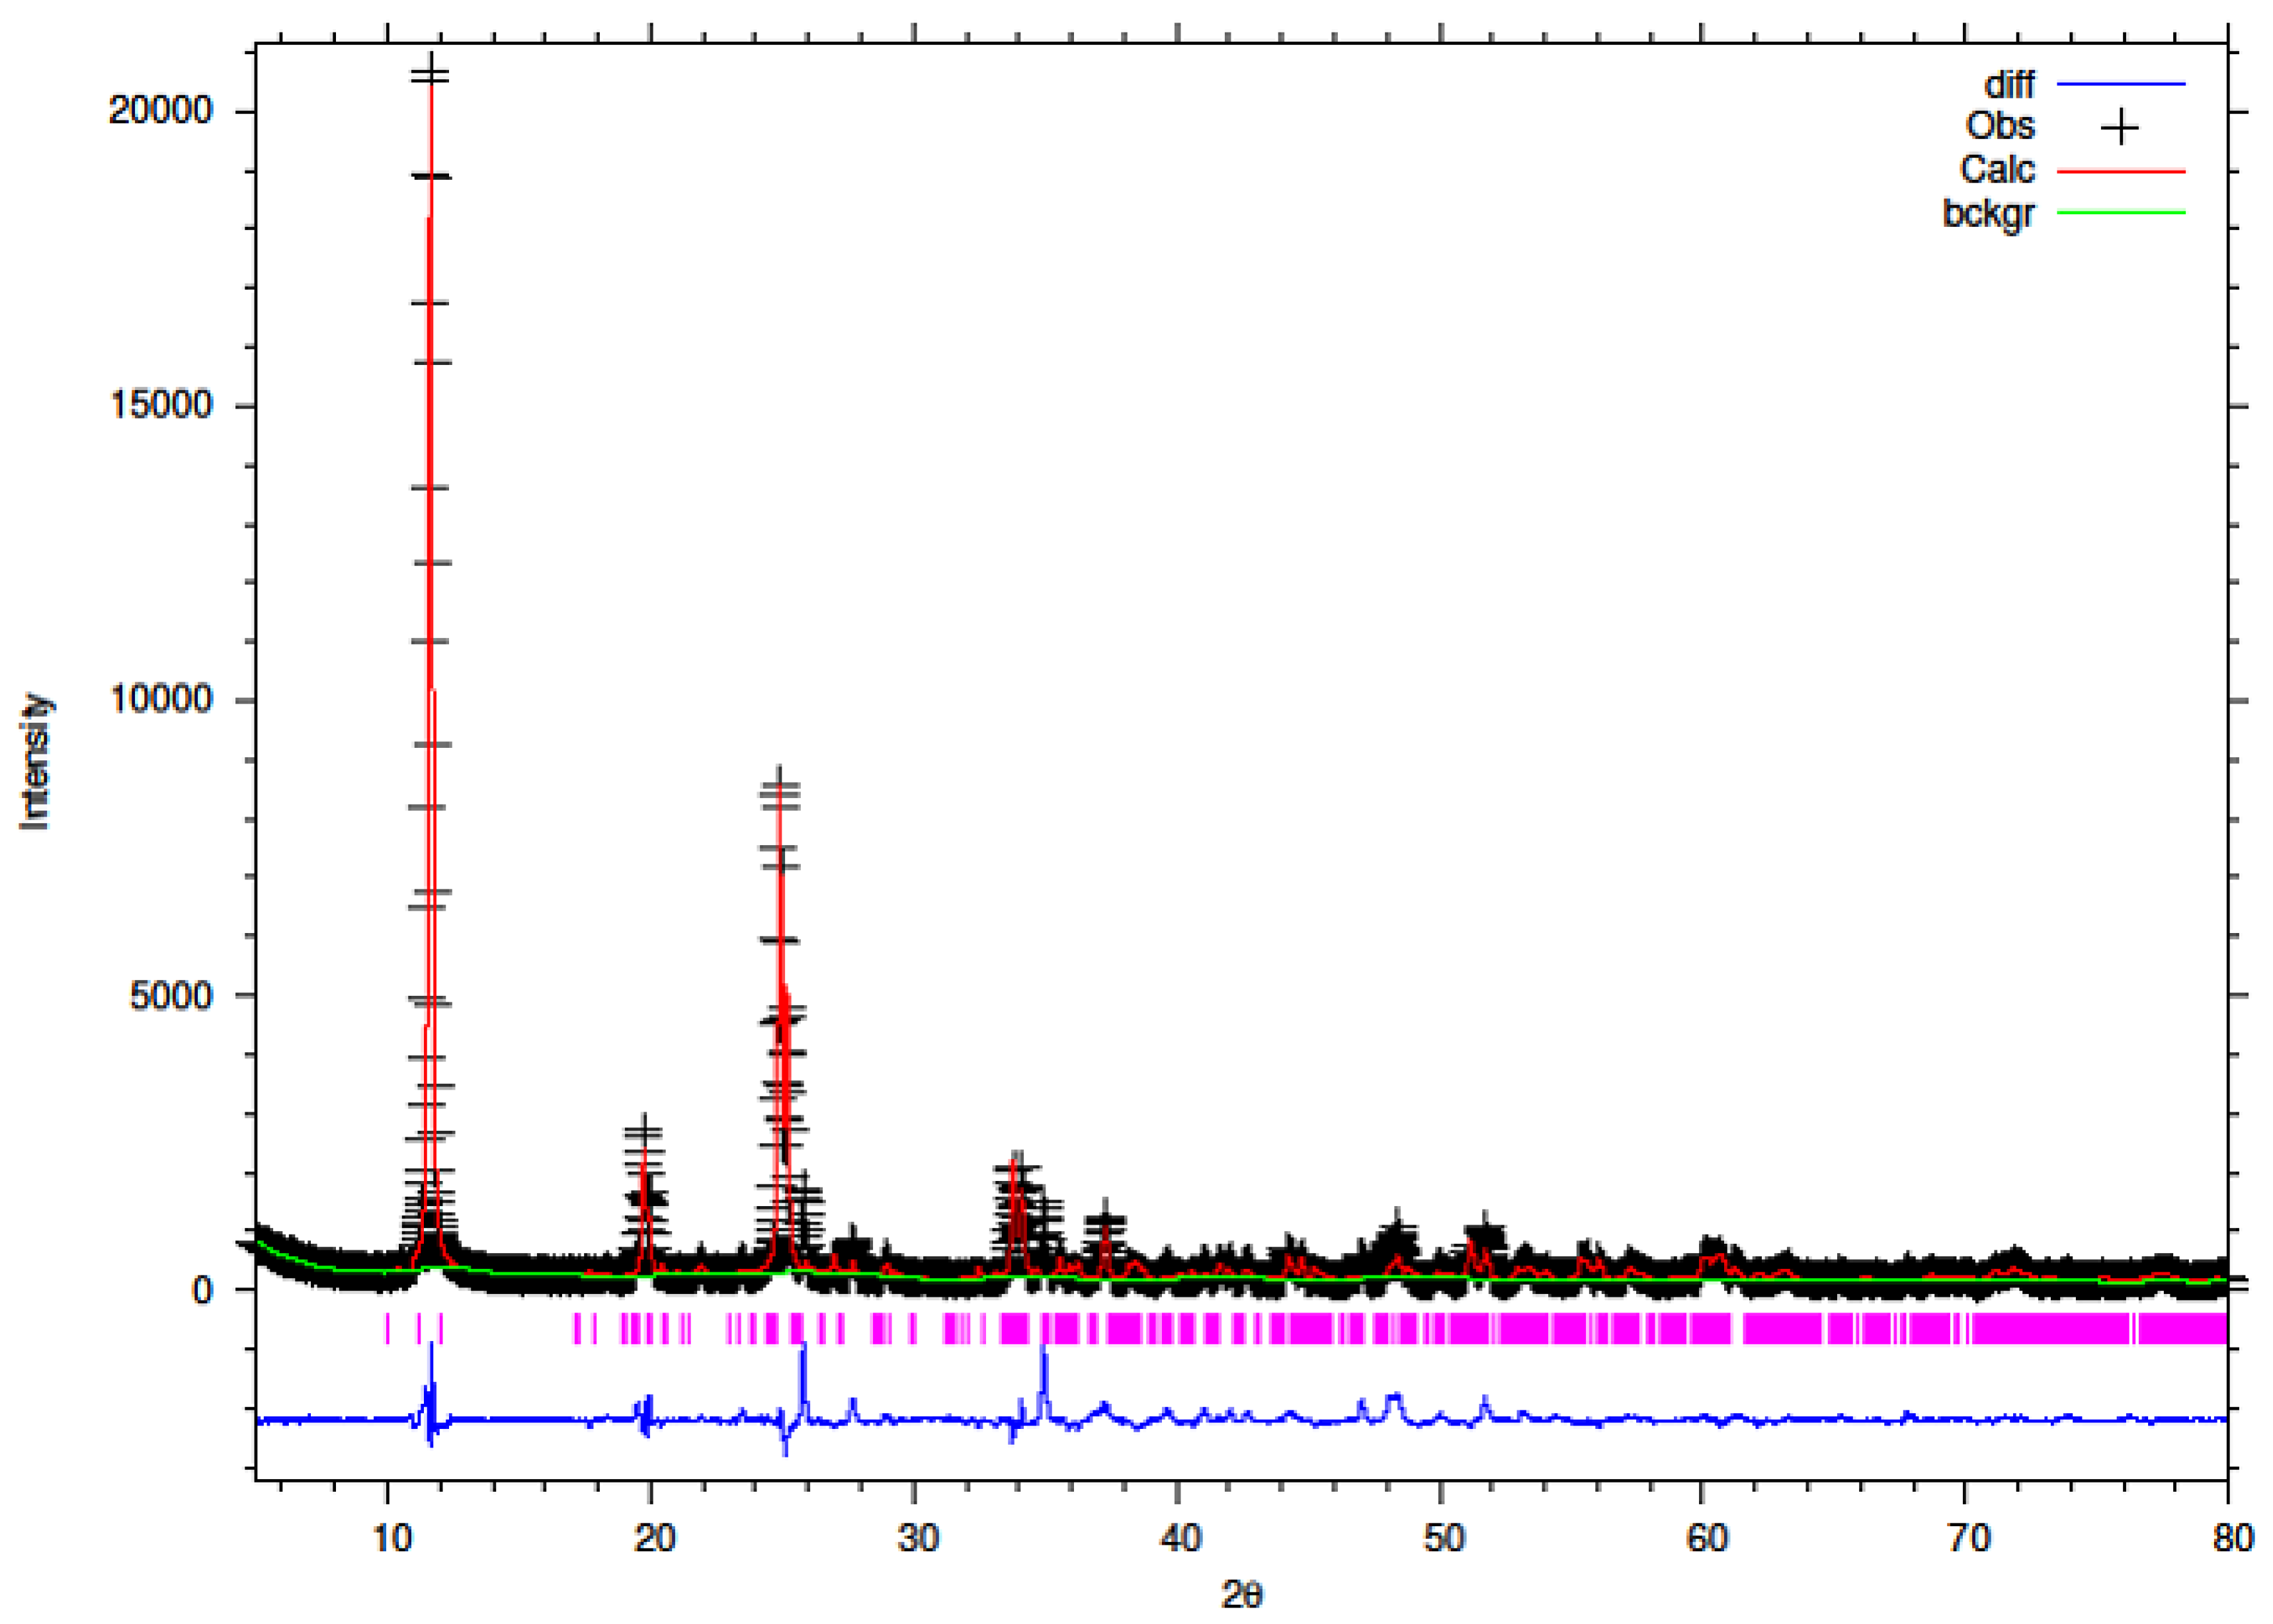
3.5. Rietveld Refinement of Y–ZrP
The XRD data obtained for all Y–ZrP samples were refined using Rietveld refinement and the GSAS/EXPGUI software package [
18,
19]. The samples were refined using the starting structural model of Clearfield and Smith [
10] for α-ZrP with the space group P2
1/c. The results for the structural parameters and lattice coordinates for the samples synthesised using the two methods are presented in
Table 2,
Table 3,
Table 4,
Table 5,
Table 6,
Table 7,
Table 8 and
Table 9 together with the final Rietveld plots in
Figure 10,
Figure 11,
Figure 12,
Figure 13,
Figure 14 and
Figure 15. A list of selected refined bond angles from Rietveld refinement is presented in
Supplementary Tables S1 and S2.
It can be observed that the refluxed samples showed comparable results for all doping levels along with similar structural parameters and atomic coordinates, compared to α-ZrP [
13]. However, the 15% Y–ZrP sample showed a significant decrease in the average bond distance (2.0443 Å) as compared to that of 2.0631 Å for refluxed α-ZrP, showing a difference of 0.02 Å. This was due to the Zr–O (1) distance that was reduced by approximately 0.08 Å, in addition to other M–O bonds. On the other hand, 5% and 10% refluxed Y–ZrP samples showed a slight increase in average bond distances as compared to α-ZrP, but followed a decreasing trend as the yttrium substitution increased.
The hydrothermally synthesised Y–ZrP materials also followed a similar trend to that shown by the refluxed samples, but the decrease in the average bond distance for the hydrothermally synthesised 15% Y–ZrP sample (2.01222 Å) was higher compared to the that for 15% refluxed Y–ZrP (2.04433 Å). This was again due to the reduced Zr–O(1) distance which was lowered by approximately 0.11 Å.
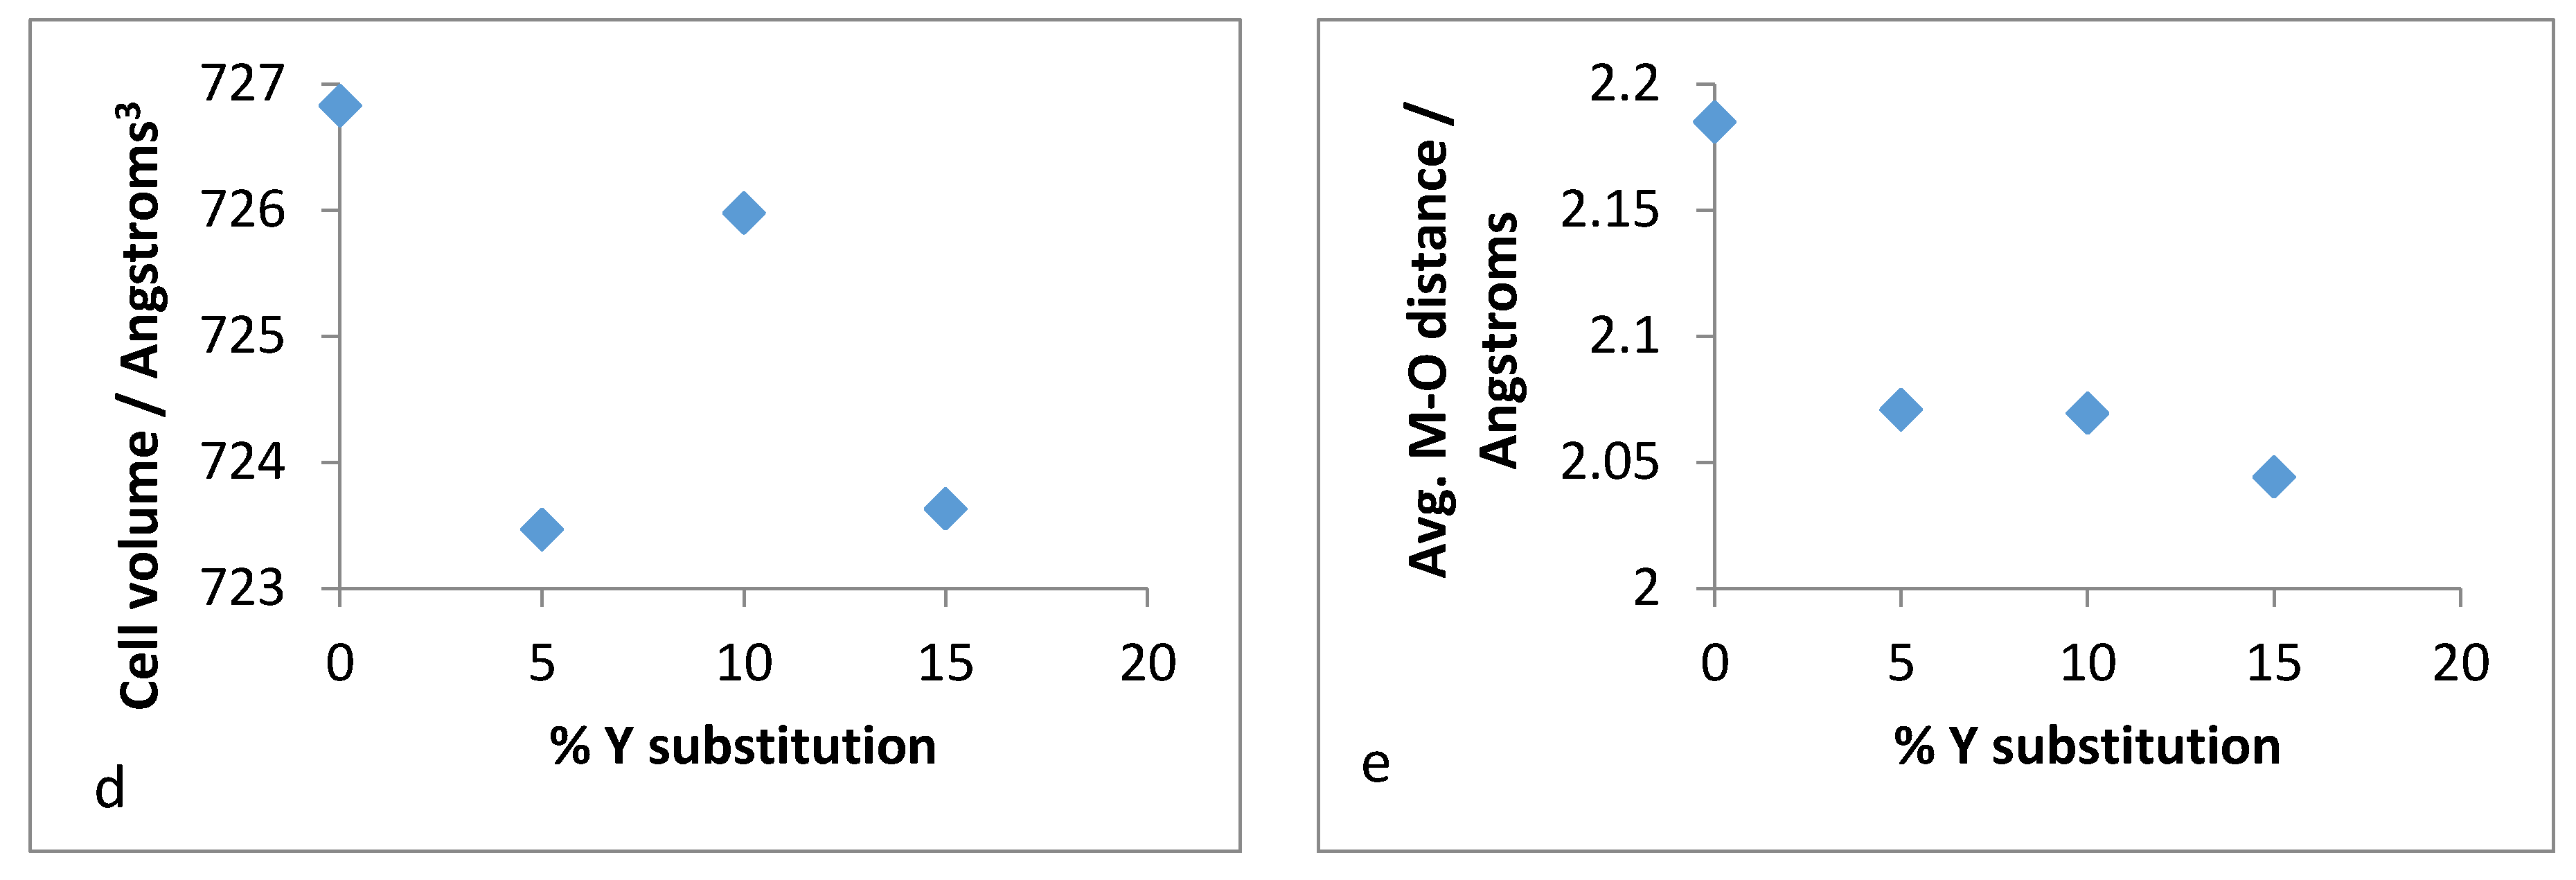
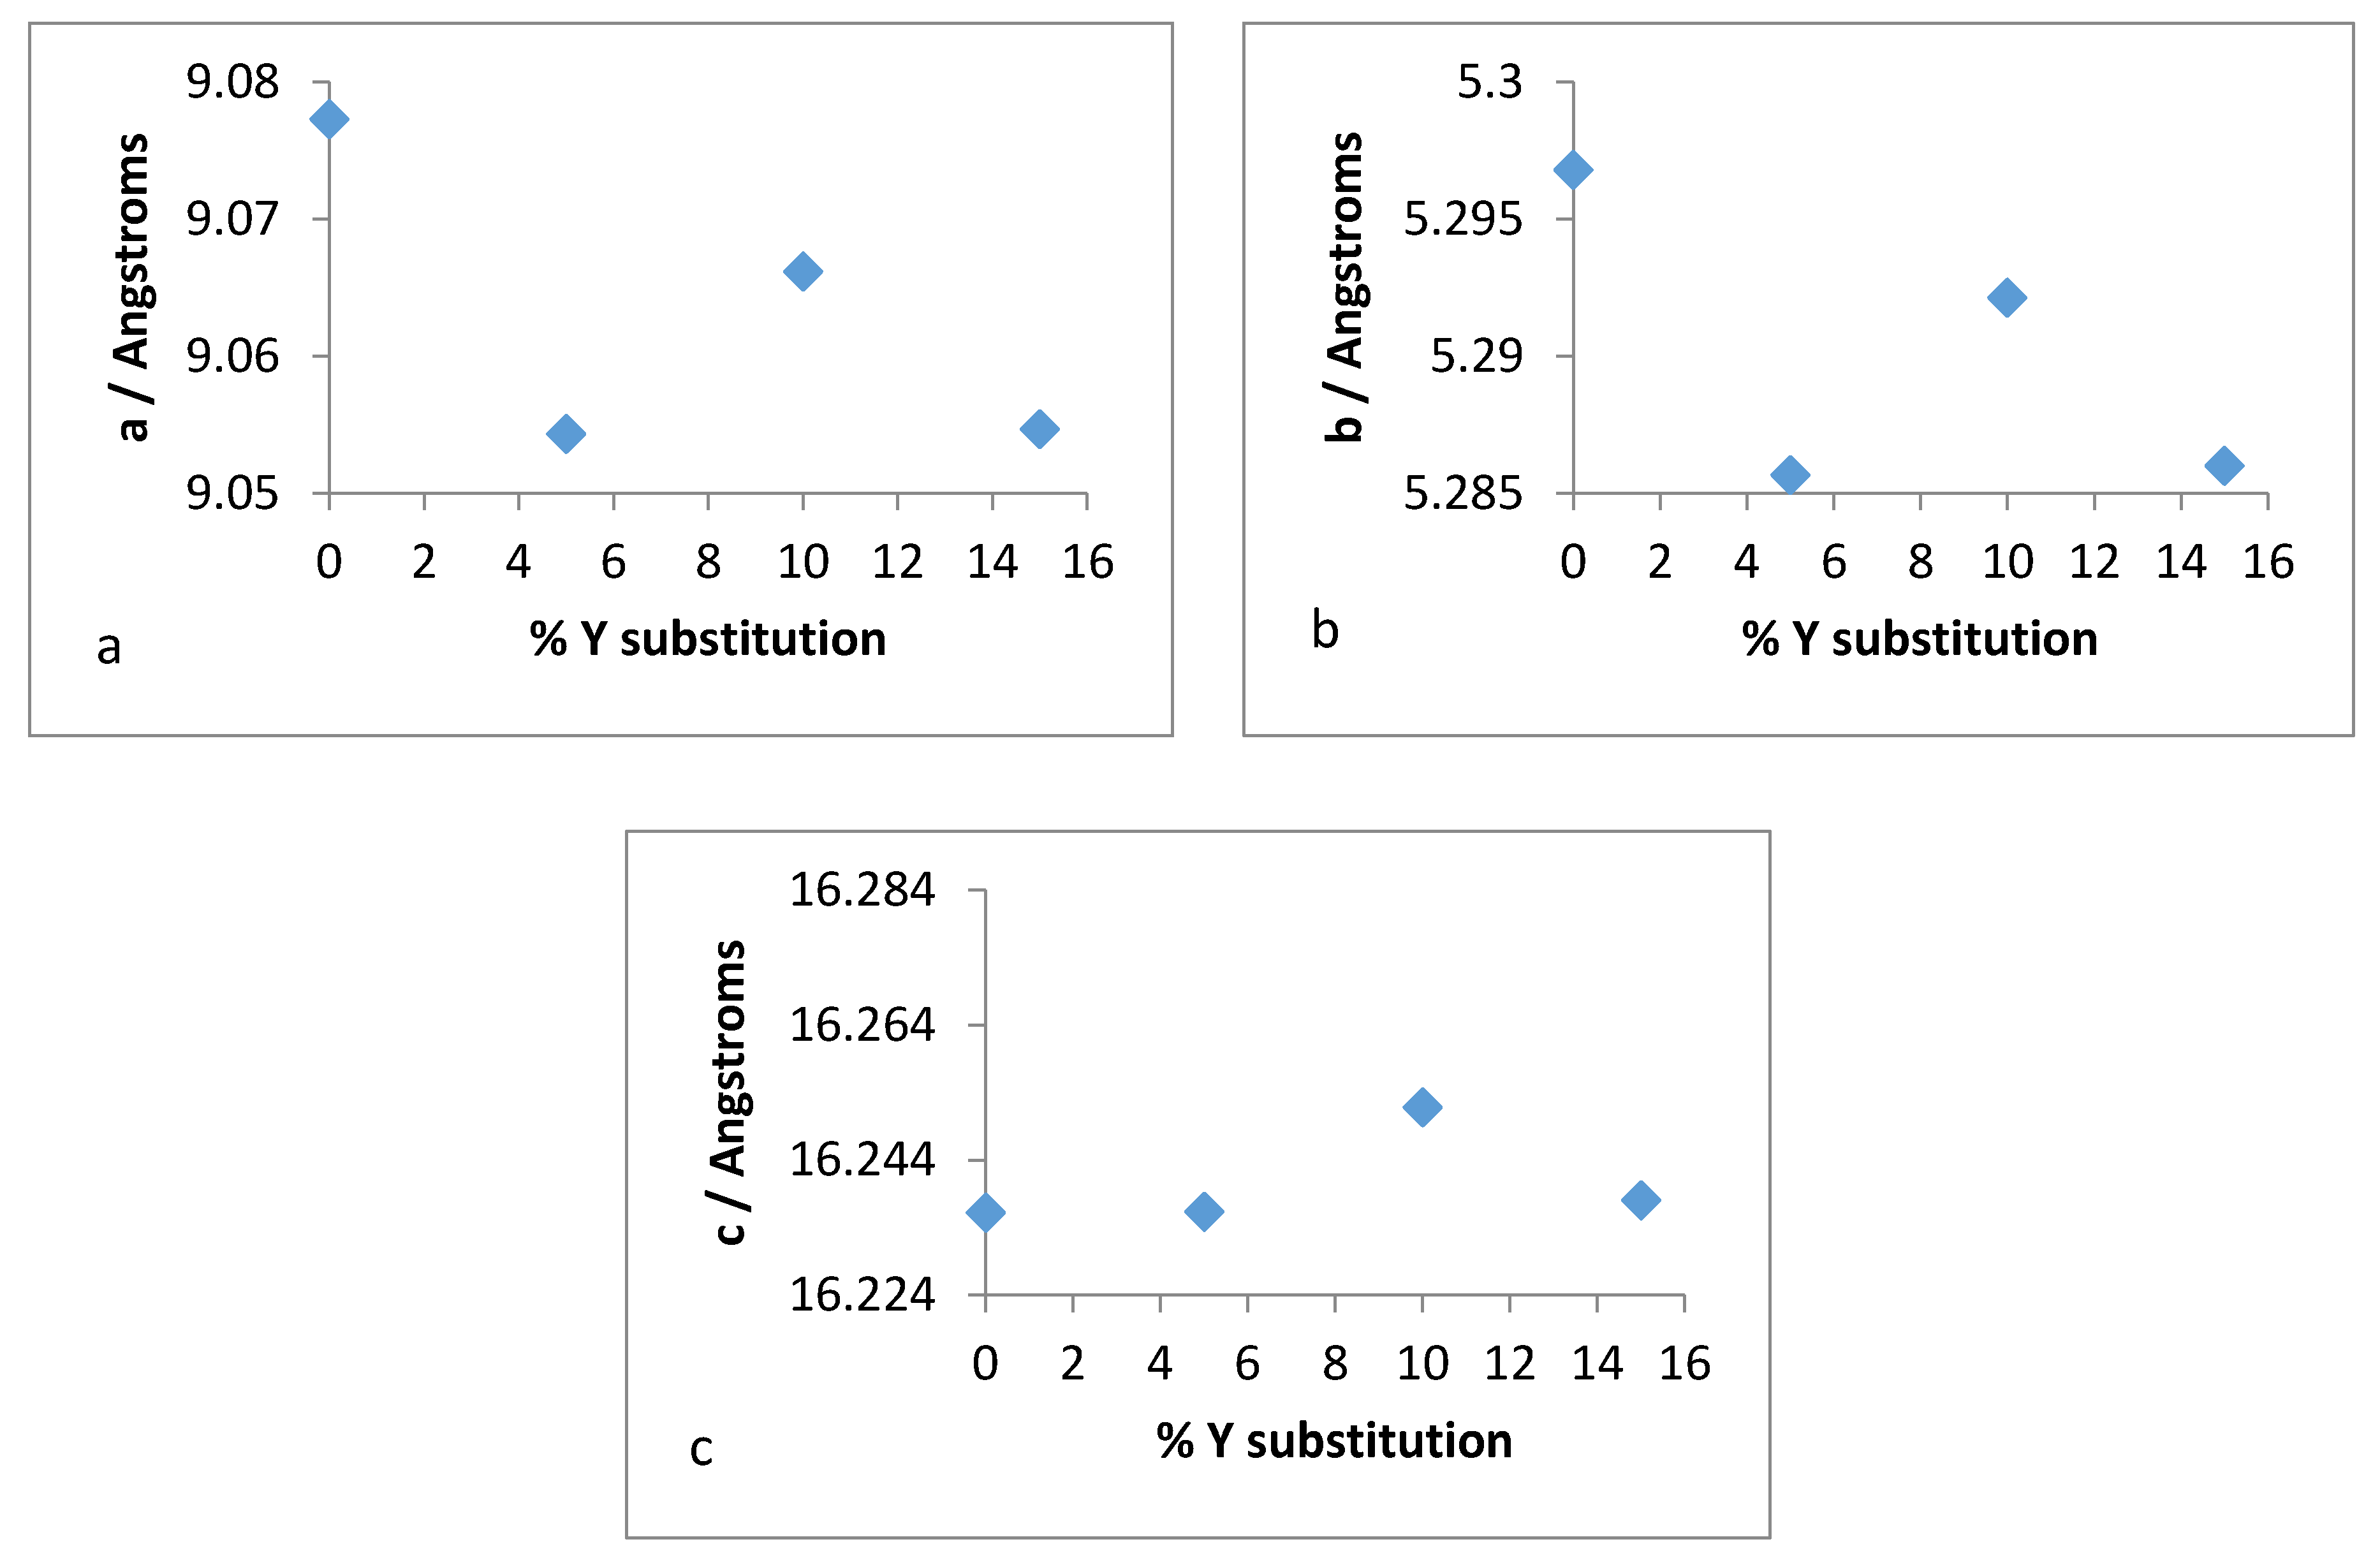
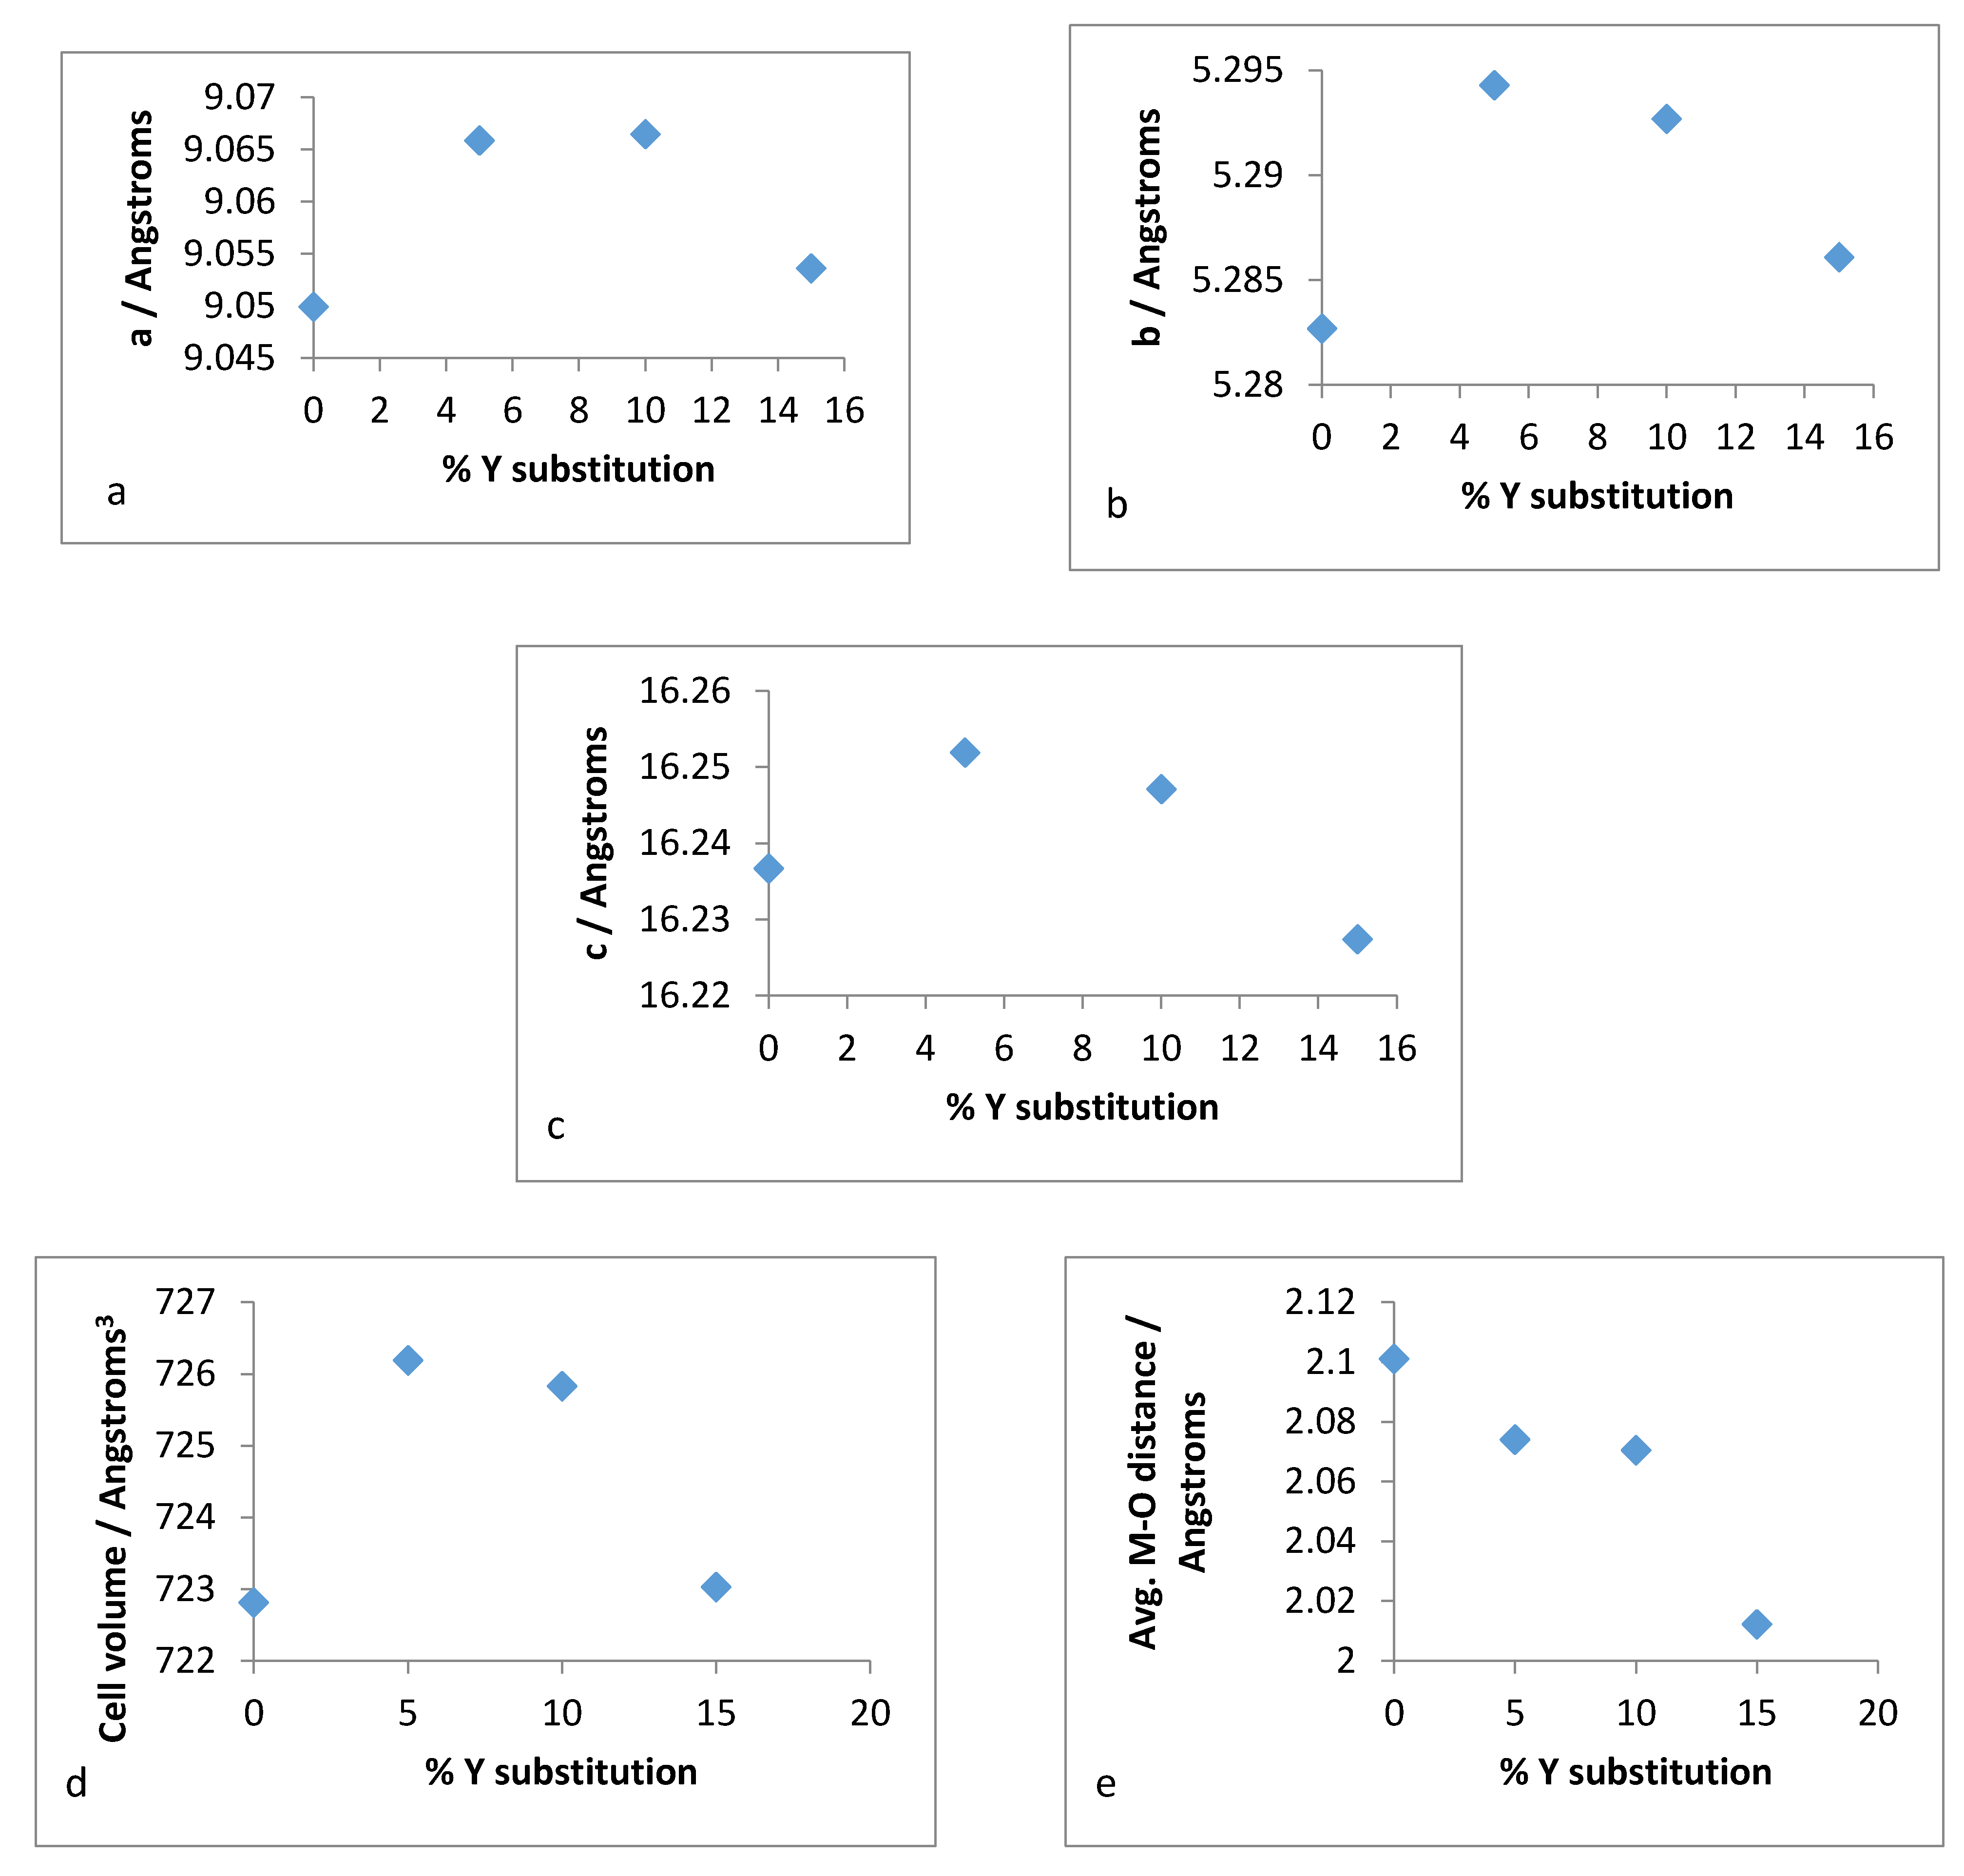
Therefore, it was of interest to analyse the lattice parameters order to determine if the substitution of zirconium with yttrium followed the Vegard’s law. The unit cell constants (a,b,c) along with the volume and average bond distances are plotted for both refluxed and hydrothermally synthesised Y–ZrP samples in
Figure 16 and
Figure 17.
It was observed from the unit cell plots of refluxed Y–ZrP samples that the
a-axis and
b-axis showed a general decrease, whereas the
c-axis increased slightly with an increase in yttrium substitution. In addition, the cell volume and average bond distances decrease compared to those of α-ZrP. These results suggest that the yttrium-substituted samples did not obey the Vegard’s law, as there was no steady increase in the lattice parameters with increasing amounts of the larger Y
3+ cation. The reason for the deviation from the Vegard’s law can be attributed to many factors such as valence state, electron affinity and percentage substitution of cation that can affect the bond lengths and unit cell dimensions. This was confirmed by the results presented in
Figure 16e that show that the average bond length for conventionally refluxed Y–ZrP samples was reduced upon yttrium substitution.
It is evident from the unit cell plots for the hydrothermally synthesised Y–ZrP samples that the cell parameters (a,b,c) and cell volume of 5% and 10% Y–ZrP increased overall, as compared to those of α-ZrP. On the other hand, although the a-axis and b-axis increased for the 15% Y–ZrP samples, the c-axis was reduced. In addition to this, there was a non-linear reduction in average bond distances with an increase in yttrium substitution for all Y–ZrP samples, which clearly indicates a deviation from the Vegard’s law. It is therefore believed that the reduced bond distances suggest clustering of the substituted yttrium cations together in the lattice plane, along with a loss of zirconium cations from those sites, that can result in vacancies in the metal sub-lattice. This could be the underlying reason for the limit of formation of solid solutions beyond a 15% substitution, as these defects will affect the stability of the entire system.
3.6. Ion Exchange Results
The results obtained from the analysis of the ICP-MS filtrate in
Table 10 show an increased percentage of Co
2+ ions incorporation into Y–ZrP, as compared to α-ZrP from both routes of reflux. However, the increase was non-linear with respect to the degree of yttrium substitution, indicating that a 5% yttrium substitution increased the Co
2+ ion-exchange capacity of the exchangers. In fact, the capacity for Co
2+ ion exchange increased from 4.6% to at least 6.4% and even up to 10.56%, which represents an increase in capacity from a minimum 50% to over 150%, as compared to α-ZrP. On the other hand, the effect of substitution was not highly differentiable for the Sr
2+ and Cs
+ ions in the solution. This showed that the overall exchange capacity of yttrium-doped α-ZrP was increased by the uptake of additional Co
2+ ions, without compromising the uptake capacities of Sr
2+ and Cs
+ ions. Overall, the order of uptake (in terms of total % of ions removed from the solution) for Y–ZrP followed the trend Sr
2+ ≥ Co
2+ > Cs
+, whereas α-ZrP exhibited a clear preference for the exchange of Sr
2+ ions over caesium and cobalt ions. The ion-exchange results were complemented by measuring the pH of the solution before and after the exchange, as presented in
Table 11. It was noted that the stock pH of the starting solution was 6.30 and reduced systematically to 3.57 for a 50% higher exchange and to 2.35 for a 150% higher exchange. This clearly complemented the success of ion exchange by donating extra protons to the solution and hence justifies the increased capacities of the substituted materials.
4. Conclusions
It was demonstrated that yttrium-doped α-zirconium phosphate can be synthesised using both reflux and hydrothermal methods. However, a miscibility gap was observed for yttrium substitution beyond a 15% molar ratio into the α-ZrP framework. The products obtained with 15% or less substitution were isostructural to α-ZrP, as shown by Rietveld refinement and powder XRD analysis. However, the average M–O distance for the products synthesised using the two methods did not follow a linear trend, which indicated no metal ordering within the layers, as opposed to an almost uniform framework found in α-ZrP. This effectively indicates that the yttrium doping concentrations do not obey the Vegard’s law and possess a solubility limit for forming solid solutions at high dopant concentrations.
In fact, the success of synthesising such doped zirconium phosphates proved to be highly advantageous towards selective ion exchange and its capacities, which is evident from the enhanced uptake of Co2+ ions. This is due to the fact that the exchange of zirconium atoms for yttrium not only distorted the lattice thus creating extra space in the lattice through the vacancies, but also allowed excessive protons to neutralise the charge imbalance created through the substitution of Zr4+ ions with Y3+. Overall, the analysis of a simulated nuclear waste solution with both ICPMS and pH measurements clearly showed that these novel ion exchangers are not just efficient at acidic pHs but also have a higher exchange capacity and an altered selectivity compared to α-ZrP. However, detailed analysis of these exchangers at various ion-exchange pHs as well as from different metal salt types needs to be performed. This will test the novel materials across a range of parameters for their commercial viability as successful ion exchangers that can be deployed for the treatment of actual nuclear waste streams.


 .
.


