Abstract
This paper addresses the issues of slug detection and characterization in air-water two-phase flow in a vertical pipeline. A novel non-invasive measurement technique using continuous-wave Doppler ultrasound (CWDU) and bandpass power spectral density (BPSD) is proposed for multiphase flow applications and compared with the more established gamma-ray densitometry measurement. In this work, analysis using time-frequency analysis of the CWDU is performed to infer the applicability of the BPSD method for observing the slug front and trailing bubbles in a multiphase flow. The CWDU used a piezo transmitter/receiver pair with an ultrasonic frequency of 500 kHz. Signal processing on the demodulated signal of Doppler frequency was done using the Butterworth bandpass filter on the power spectral density which reveals slugs from background bubbles. The experiments were carried out in the 2” vertical pipeline-riser at the process system engineering laboratory at Cranfield University. The 2-inch test facility used in this experiment is made up of a 54.8 mm internal diameter and 10.5 m high vertical riser connected to a 40 m long horizontal pipeline. Taylor bubbles were generated using a quick-closing air valve placed at the bottom of the riser underwater flow, with rates of 0.5 litres/s, 2 litres/s, and 4 litres/s. The CWDU spectrum of the measured signal along with the BPSD method is shown to describe the distinctive nature of the slugs.
1. Introduction
Multiphase flows are common in many industries such as nuclear, chemical, and petroleum, and are often required to be measured under harsh surroundings, access difficulties, and strict safety restrictions. The measurement of multiphase flow is essential in oil and gas production for monitoring, reservoir management, well testing, and production allocation.
Slug flow is one of the multiphase flow regimes and it is considered the most pervasive flow pattern conditions in vertical, horizontal, and inclined pipelines [1,2]. It is known as an irregular flow with a succession of liquid slugs, each accompanied by elongated gas bubbles above a thin liquid film layer [3,4]. During slug flow, liquid slugs move at a very high mixture velocity, as elongated bubbles flow with the smaller velocities in the long domain. The occurrence of slug flow may cause a serious problem in the piping systems and may cause large bubbles for the constant mixture velocity in the individual liquid and gas flow delivery systems. These bubbles may cause liquid carryover and gas carry-under or significant excursion levels, leading to unplanned plant shutdown and possible plant abandonment. The slug flow phenomenon induces unusual forces due to the high momentum when the slugs pass via the tees, elbows, pipes, and other processing equipment. Moreover, serious damage may occur in pipeline support and connections when slug flow low frequencies reach the piping structures’ resonance natural frequency [5]. The fluctuating gas and liquid slug flow induce structural problems that lead to corrosion and cracking of the pipe [6]. Moreover, the high slug frequency speeds up the corrosion rate in the pipe.
Since slug flow is often encountered in various industrial applications, for instance, in chemical engineering industries, especially in oil and gas pipelines, slugging regime is often encountered irrespective of the pipeline topology or inclination [7]. Hence, a comprehensive slug flow characterization is paramount to produce substantial information needed for multiphase flow equipment and pipeline designs [8,9]. With regard to this requirement, several measuring technologies and techniques have been adopted in multiphase flow slug analysis in the gas and oil pipelines, nuclear reactors, separation in oil production plants, and fuel channels in power generation plants.
Slug flow regime may be examined using different methods such as particle image velocimetry (PIV) and its modifications holographic particle image velocimetry (HPIV) and digital particle image velocimetry (DPIV), computer tomography (X-ray, optical, capacitive, and resistive), magnetic resonance imaging (MRI), speed cameras, hot-wire anemometry, nuclear, Coriolis flowmeters, and laser Doppler anemometry (LDA) techniques [10,11,12,13,14]. Radiation attenuation methods, especially gamma-ray, are reliable and determine multiphase flow regime characteristics non-intrusively [15]. Gamma-ray densitometry is less capital intensive when compared to other radiation attenuation methods. Although gamma-ray is a non-intrusive measurement widely used to measure two-phase gas-liquid local gas fraction in a pipeline, the major drawback is its radioactive nature, which is hazardous to humans and it requires strict safety standards compliance [16].
Stavland et al. [17] examined various gamma-ray beam trajectories for dual- and single-beam gamma-ray densitometers to determine the optimal dual-beam densitometer source-detector layout for gas-liquid vertical pipe flow. The experimental results show the beam trajectories that produced the best measurement accuracy for the dual- and single-beam gamma-densitometer.
Hanus et al. [16] used computational artificial intelligence techniques, a Nal(TI) scintillation detector, and an Am-241 gamma-ray source to study flow regime classification. Based on the time domain measuring signal analysis, nine flow features were extracted and used as the classifier input. In addition, six different artificial intelligence techniques, such as support vector machine, k-means clustering algorithm, probabilistic neural network, single decision tree, radial basis function neural network, and multilayer perceptron was adopted for the classification of flow regime. It was observed that all the methods achieved high-performance accuracy, hence, confirming the efficacy of gamma-rays and artificial intelligence for flow regime measurement. Other research on the characteristics of multiphase flow regimes or slug flow measurement can be found in [15,18,19,20,21,22,23,24,25,26].
Describing the features of multiphase flows using techniques that are non-radioactive, non-invasive, give a fast response, and are appropriate for opaque systems has been of great interest in several industrial applications. Ultrasonic measurement techniques have been proven to be promising for many of these requirements. There are many advantages of deploying ultrasonic measurement techniques such as measurement speed, accuracy, sensitivity, safety, and simplicity to deploy when compared with the existing non-invasive techniques like gamma-rays.
The conventional ultrasonic pulse-wave Doppler (PWD) has been in existence since 1986 in the medical field. The prime drawback of PWD is its theoretical limit in velocity measurements higher than a certain velocity [27]. The maximum Doppler frequency shift that a PWD unit can detect is just half the pulse repetition frequency (PRF). Hence, as the depth of the investigated region increases, the PRF must be reduced to enable the pulses to have enough time for another round journey. The problem of maximum velocity measurement is especially severe when it is paramount to take measurements of high-velocity flow regimes such as slug flow.
The PWD is mainly limited in the highest velocity it can measure by the sampling rate of the digitised analogue signals. To estimate, or extract, a shift in Doppler frequency from that of the ultrasound signal, the velocimeter measures the phase relationship between each continuous returning pulse ultrasound and a signal from the reference oscillator [28]. The maximum phase variation that can be noticed on either side of the two pulses is finite to a range −π to +π radians because angular measurements redo themselves every 2 π radians. Hence, assuming the target moves more than the λ/4 distance between the samples, its velocity may be wrongly interpreted. This drawback is due to the sampling theorem expression [29], which states that it is essential to sample a signal not less than twice the highest frequency available in the signal to prohibit ambiguity. The effect of the misinterpretation of a signal frequency in the PWD system above the Nyquist limit can also be dealt with using continuous-wave Doppler ultrasound (CWDU) [30].
In this work, analysis using time-frequency analysis of the CWDU is performed to infer the applicability of the bandpass power spectral density (BPSD) method for observing the slug front and trailing bubbles in a multiphase flow.
In summary, the contributions of this paper are as follows: (i) this appears to be the first trial towards slug flow characterisation using bandpass PSD and non-radioactive CWDU in a vertical pipeline system. By using this method for slug flow regime measurement, industries can achieve better process performance, increasing production and capital benefits, (ii) the distinctiveness of CWDU was examined and compared with a reliable and widely used flow measurement gamma-ray densitometer to prove the capability of CWDU in slug flow measurement.
The paper is structured as follows: Section 2 depicts the measurement principle used. In Section 3, the experimental method used is described while the signal analysis and observations are considered in Section 4. In Section 5, results and discussion of the analysed data are presented, and finally, the conclusion is drawn in Section 6.
2. The Ultrasonic Measurement Principles
Continuous-Wave Doppler Ultrasound (CWDU)
The shift in Doppler is the fluctuating frequency of an acoustic wave when there is a movement or shift between the source and the acoustic receiver, and the frequency shift is in proportion to the acoustic source velocity [25,31]. The acoustic source velocity can be obtained by calculating the change in frequency between the acoustic source and the receiver. In the CWDU technique, an acoustic frequency beam is continuously discharged from the transducer (ultrasonic) into the flow, and the sound wave is reflected by moving the scatters [32]. The scattered acoustic beam is received by another ultrasonic transducer and then the flow velocity is calculated with the change in frequency based on the Doppler effect. The Doppler ultrasonic principles are illustrated in Figure 1.
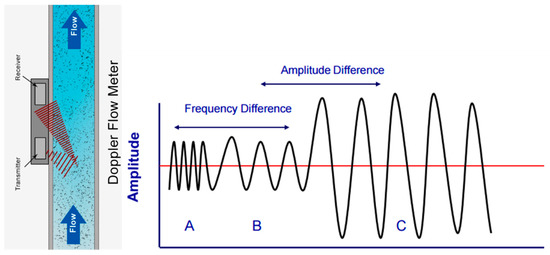
Figure 1.
Doppler ultrasonic principle [24].
The outline of the instrumentation process needed to detect shifts in Doppler of the received ultrasound is shown in Figure 2 and described below, assuming the signal transmitted is
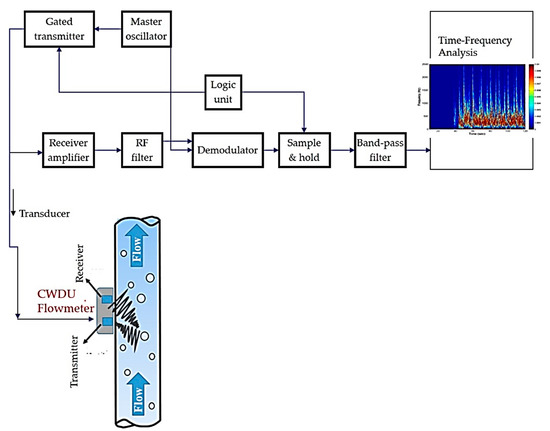
Figure 2.
Continuous-wave Doppler ultrasound system hardware block diagram [24].
Moreover, the signal received from one of the scatters is
where, , and the phase based on the distance of the scatterer from the phase shifts initiated within the transducer and the receiver is[33].
Mathematically, the multiplication of the signals gives
Hence, the signal is finally low-pass filtered to get rid of the (source frequency) leaving only the ultrasonic Doppler signal [33].
Moreover, there is a requirement for extra signal processing since the received ultrasound signal has reflected ultrasound of greater amplitude more than the backscattered signal from the scatterer in motion. This type of reflected ultrasound shows a low-frequency shift in Doppler. Hence, because of this, band-pass filtering may be needed to eliminate this error [33].
The CWDU implemented in this paper is a non-intrusive/non-invasive flowmeter manufactured by United Automation Ltd. based in Southport, the United Kingdom [24]. The CWDU is suitable for the measurement of ultrasonic reflective fluid of any flow. It calculates the shifts in frequency, processes the ultrasonic signals, and evaluates the velocity of the flow. The CWDU calculates the shift in frequency of the signals reflected from the discontinuities or scatters, like bubbles, in the flowing fluid. The CWDU has two separate crystal transducers embedded in one probe which transmit and receive ultrasonic signals continuously at 500 kHz.
In this study, the CWDU used has two piezoelectric crystal elements embedded in one transducer. The transducer is electrified by the electronic circuit of the meter in a continuous mode; one of the transducers emits an ultrasound signal and the other receiving transducer provides the output signals [34]. The received output signals are then oozed and amplified by the flowmeter electronics. The Doppler frequency shift signals are the processed output signal, and this was obtained using a data acquisition card (NI-PCI-6040E) and a LabVIEW program which controlled a 10 kHz sampling frequency for 120 s for each dataset [25].
3. The Experimental Process and Method
3.1. Overview of the Experimental Facility
The 2-inch vertical pipeline multiphase flow system used to carry out this experiment is at the Cranfield University process system engineering laboratory equipped up to an industrial scale. The flow facility contains a 10.5 m vertical riser, 54.8 mm internal diameter, 40 m horizontal pipe, and 0° inclinations. The temperature rating of the facility is in the range of 0–80 °C. The duty of the water pump is 100 m3/h at 10 barg and the duty of the two air compressors at 7 barg are 570 m3/h FAD and 840 m3/h FAD, respectively. The range of the water flow meter is between 0–7.36 kg/s and 0–30 kg/s, and the range of the airflow meter is between 0–150 Sm3/h and 100–4250 Sm3/h. The second flow loop test section has a transparent pipe for flow regime observation. The continuous-wave ultrasonic Doppler measurement system was mounted on the test section at the topside facility. The airflow rate was adjusted by controlling the valves to achieve the desired flow regime. More details of the experimental facility can be found in [24,25,35]. The experimental setup is illustrated in Figure 3.
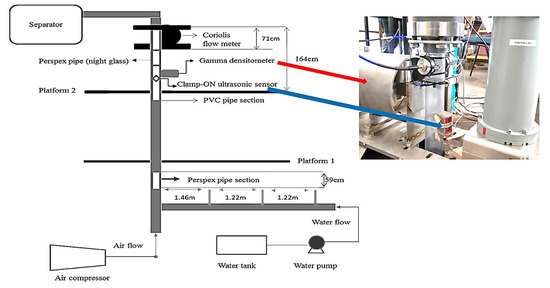
Figure 3.
Experimental setup [25].
The data acquisition system LabVIEW at a 10 kHz sampling frequency was employed to acquire the change in Doppler frequency signals which were further analysed using time-frequency analysis [24], as indicated in Figure 2.
3.2. Experimental Procedure
A total of nine test points were acquired to cover a range of test conditions. For a certain water flow rate, the air was injected using a quick-closing valve located at the base of the riser. The air valve was operated using a duty cycle arrangement, as shown in Figure 4. The data acquisition from CWDU had a maximum limitation of 120 s due to experimental hardware limitations and hence the total duration of each experiment was set to 120 s. Moreover, a stable reference period was desired to observe the onset of slugs and it was established that a stable period of 30 to 40 s would be sufficient in the flow conditions. Hence, a maximum of the first 40 s was kept as a single-phase water flow arrangement followed by opening and closing of the air valve for “a” and “b” seconds, respectively, thereby obtaining a valve duty cycle of “a:b”. The data acquisition time was set to 120 s for each test point.
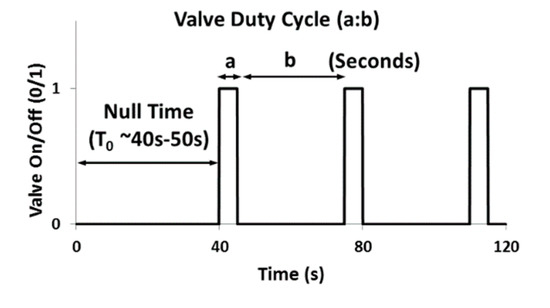
Figure 4.
The valve duty cycle (a:b).
Figure 4 explains the valve duty cycle of the experiment. The valve was turned on for 2 s and turned off for 30 s, and this process continued for a maximum of 120 s. This process was carried out to generate the slugs with Taylor bubbles in multiphase flow. Table 1 shows the experimental test matrix. At a water flow rate of 0.5 litres/s (l/s), the airflow rate valve was turned on for a duty cycle of “a:b”, and this same process was repeated for a water flow rate of 2.0 litres/s and 4.0 l/s. This desirable Taylor bubble structure arrangement is described in Figure 5 below.

Table 1.
Air valve duty cycle at various water flow rates.
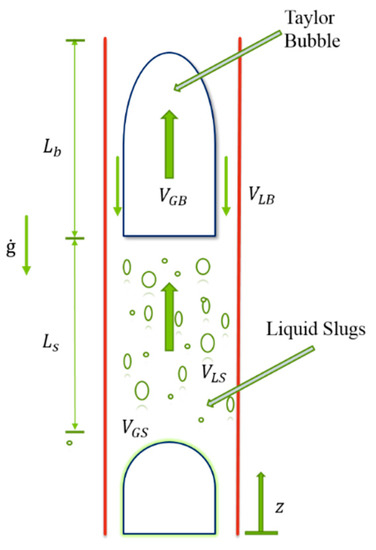
Figure 5.
Geometrical features of an air-water slug [36].
4. Signal Analysis and Observations
Spectral analysis methods are applied for the signal analysis of two-phase flow to estimate the instability periods. Signals from a two-phase flow can be examined by using the frequency domain to acquire the features of the various flow patterns, or by applying short-term Fourier transform (STFT) and obtaining power spectral density (PSD) [37]. Power spectral density is a frequency domain feature of a time series that is suitable for frequency composition detection in a stochastic process [38]. The PSD analysis is deployed to estimate the features of the air-water two-phase flow signal in a Doppler frequency domain which reveals signal spectral distribution patterns of slugs and trailing bubbles.
In the discrete-time case, the data to be transformed could be broken up into chunks of frames (which usually overlap each other, to reduce artefacts at the boundary). Each chunk is Fourier transformed, and the complex result is added to a matrix, which records the magnitude and phase for each point in time and frequency. This can be expressed as:
Likewise, with signal x[n] and window w[n]. In this case, m is discrete, and ω is continuous, but in most typical applications, the STFT is performed on a computer using fast Fourier transform, so both variables are discrete and quantised.
The magnitude squared of the STFT yields the spectrogram of the function:
In this study, STFT was applied in segments of 100 ms consisting of 1000 points.
Figure 6a shows the CWDU raw signals in blue, whereas the bandpass-filtered signals of the representative case of 1 kHz centre frequency with 100Hz bandwidth are shown in the red plot. It can be observed that the slug front and the trailing bubble signals are much more observable in the bandpass signals than the raw Doppler signal. Figure 6b shows the spectrogram image of the data using a short-term Fourier transform, which clearly shows the sharp signals of the slug front and broadened signals of trailing bubbles after the slug front. This spectrogram shows that around 1 kHz or above, there is a discernible difference between the slug front and the trailing bubbles and hence a bandpass filter can be effective in such a scenario for observing the slug front clearly.
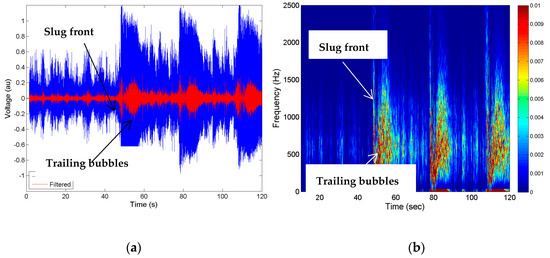
Figure 6.
The analysis methodology (a) raw Doppler signal (blue) and bandpass-filtered signal 0.95–1.05 kHz (red); (b) spectrogram image using short-term Fourier transform (STFT).
Figure 7 shows the comparison of signals from gamma measurement and that from CWDU. It can be observed from Figure 7a,b, which show CWDU signals with PSD and bandpass PSD, respectively, where the latter shows a much more discernible structure of the slug front and the trailing bubbles. In further sections, further analysis of bandpass PSD was carried out.
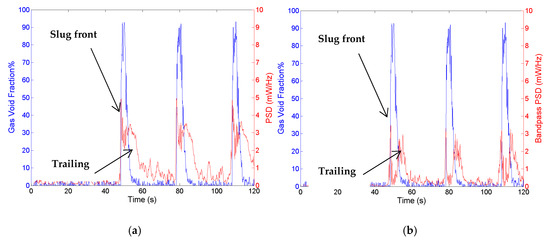
Figure 7.
(a) Gas volume fraction (GVF) from gamma and power spectral density (PSD) of Doppler signal using STFT; (b) GVF from gamma and bandpass PSD 0.95–1.05 kHz.
5. Results and Discussion
The objective of the nine test points presented in this study is to develop an understanding of the Doppler frequency response to various periodic air slug trains under different water flow rates. Hence, the test conditions were designed to create various patterns of the slug front and smaller bubbles in the slug tail. The signals in the time domain, as well as the frequency domain, were interpreted to develop effective signal processing methods that can detect and distinguish slugs from the background flow.
Table 2 shows a systematic analysis of the effect of the bandpass filters of various centre frequencies from 250 Hz to 1500 Hz with a bandwidth of 50 Hz applied on the test point’s power spectral density, and the results are summarised in the tables for the mean and kurtosis of the signals. The kurtosis of the periodic signals is a standard method of analysis in other domains, such as in vibration analysis of structures, which also relies on time-frequency analysis. For clear distinguishability of the slug fronts, the kurtosis of the signal PSD should be comparatively high and the mean PSD should be high. Table 2 shows the kurtosis of the signals from various experimental cases and compares them.
Table 2.
The effects of bandpass filters at the different centre frequencies.
As can be seen from the tables, as the centre frequency of the bandpass filter is increased, in general, the mean PSD decreases but the kurtosis increases. That means a high centre frequency is desirable for a bandpass filter, but a balance is needed to keep the mean of the signal sufficiently high. In a subsequent analysis of this paper, a centre frequency of 1000 Hz with a 50 Hz band (0.95–1.05 kHz) is used to illustrate the signals.
Figure 8 shows the raw time-domain signals (blue lines) as well as the proposed bandpass-filtered signals (red lines) obtained with a sixth-order Butterworth bandpass filter in the frequency range of 0.95 kHz–1.05 kHz. The basis of using the bandpass filter is that the slugs in a vertical pipe have the highest velocity due to buoyancy as compared to the smaller bubbles, which attain a terminal velocity with respect to the liquid, depending on the bubble size and surface tension, among other factors. The higher velocity of the slug front shows up as higher Doppler frequency signals in the CWDU measurements. The plots from Figure 8 indicate that the bandpass-filtered signals make it easier to distinguish slugs from smaller bubbles and hence is a good parameter for slug detection.
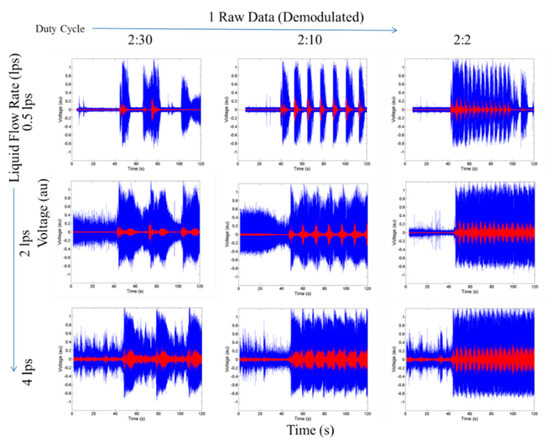
Figure 8.
The continuous-wave Doppler ultrasound (CWDU) reflection voltage (normalised) time-domain signals against time for various slug trains. Raw signals are in blue, and the corresponding bandpass-filtered signals (0.95–1.05 kHz) are shown in red. The Y-axis limits of each plot in this figure are 0 volts to 1 volt and the X-axis limits are 0 s to 120 s.
Figure 9 shows the short-term Fourier transform spectrogram images for the nine test points and reveals the frequency distribution of bubbles when a slug passes through. The higher the frequency, the higher the velocity of the scatterer. It can be observed that high-velocity components invariably arise during the passing of a slug front, which is expected. This is followed by the lower-frequency components, representing the trailing bubbles of the air slug. This forms the basis of the proposed bandpass PSD, where a bandpass filter is applied to filter out the higher-frequency components of the signal, representing slug fronts. This method makes the distinguishability of the slugs from the background scatterers more prominent, which is evident from Figure 10 and Figure 11.
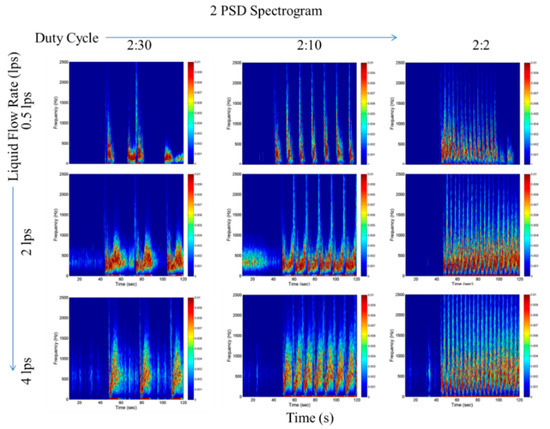
Figure 9.
The STFT spectrogram showing PSD for various slug trains. Most slug fronts can be seen at higher Doppler frequencies (>1000 Hz), and most slower trail bubbles are in lower Doppler frequencies (<600 Hz). The Y-axis limits of each plot in this figure are 0 volts to 1 volt and the X-axis limits are 0 s to 120 s.
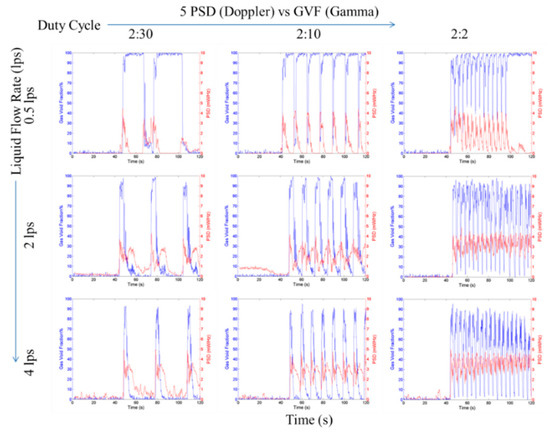
Figure 10.
The STFT average power spectral density for various slug trains. The gas void fractions (blue lines) are estimated from the gamma densitometer. The Y-axis limits of each plot in this figure are 0 volts to 1 volt and the X-axis limits are 0 s to 120 s.
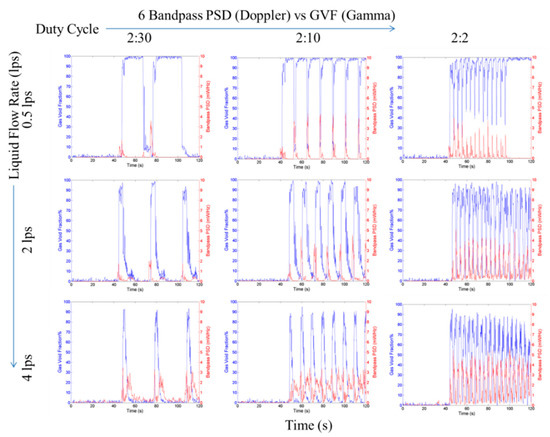
Figure 11.
The STFT average bandpass power spectral density (0.95–1.05 kHz) for various slug trains. The gas void fractions (blue lines) are estimated from the gamma densitometer. The Y-axis limits of each plot in this figure are 0 volts to 1 volt and the X-axis limits are 0 s to 120 s.
It can be observed in Figure 10 that the average power spectral density shows both the slug fronts as well as the trailing bubbles with similar prominence. This makes it hard to characterise and detect the slugs. It should be noted that the gas void fraction as measured by a gamma densitometer is used in this study to put in context the phase fraction content during the passing of the Taylor bubbles.
Figure 11 shows the results from the proposed bandpass power spectral density (BPSD) method using the bandpass range of 0.95–1.05 kHz. The majority of the trailing bubbles are filtered out using this method and the slug fronts gain more prominence, thereby making slug detection much easier even with a simple threshold-based algorithm. However, it should be noted that in practice, the bandpass filter frequencies may be a function of liquid flow rate and the gas void fraction.
A comparison of the effectiveness of the BPSD method used from CWDU and that from a gamma densitometer is shown in Table 3 below. It can be observed that the number of slugs observed from both the measurements closely match, thereby increasing the confidence in the capability of the BPSD method.
Table 3.
Comparison of the number of slugs observed from CWDU using the bandpass power spectral density (BPSD) method and that from gamma measurement.
6. Conclusions
Continuous-wave Doppler ultrasound is an established measurement technique, as well as multiphase flow measurement, however, conventional methods are based on power spectral density. In this work, a novel improved interpretation and signal analysis method using bandpass power spectral density on CWDU signals is proposed and investigated for air-water slug detection. In this work, analysis using time-frequency analysis of the CWDU is performed to infer the applicability of the BPSD method for observing the slug front and trailing bubbles in a multiphase flow. Experiments were performed in the second vertical risers of a three-phase flow loop. The experimental test points had three different water flow rates (0.5 litres/s, 2 litres/s, 4 litres/s) and each of the three different duty cycles for the air injection valve was tested to represent various slug trains conditions. The CWDU signals obtained from the experiment were processed using STFT, PSD, and the proposed bandpass PSD in the range of 0.95–1.05 kHz. The interpretation of the STFT spectrogram shows that the travelling scatterers result in a range of Doppler frequencies, with slug fronts showing up at the highest frequencies (>1000 Hz) among them and the trailing bubbles being of much lower frequencies (<600 Hz). The proposed novel bandpass PSD technique is demonstrated to be very effective in detecting slug fronts due to the higher distinguishability of slugs from the background scatterers and trailing bubbles.
Author Contributions
Conceptualization, methodology, software, validation, formal writing, and data curation, S.G.N. and P.S.; review and editing, project administration, funding acquisition, and supervision, S.G.N., P.S., E.I.A., P.L.L., and A.B. All authors have read and agreed to the published version of the manuscript.
Funding
This research received no external funding.
Institutional Review Board Statement
Not applicable.
Informed Consent Statement
Not applicable.
Conflicts of Interest
The authors declare no conflict of interest.
Nomenclature
| Source frequency | |
| Doppler frequency shift | |
| Frequency received | |
| Frequency transmitted | |
| Length of Taylor bubbles | |
| Length of slug body | |
| Gas bubble velocity | |
| The velocity of liquid in slug | |
| Signal transmitted | |
| Signals received | |
| Reference signal | |
| Doppler signal | |
| Acoustic impedance | |
| Phase term based on the shift in phase produced within the receiver and scatterer distance from the transducer |
References
- Wu, B.; Firouzi, M.; Mitchell, T.; Rufford, T.E.; Leonardi, C.; Towler, B. A critical review of flow maps for gas-liquid flows in vertical pipes and annuli. Chem. Eng. J. 2017, 326, 350–377. [Google Scholar] [CrossRef]
- Morgado, A.O.; Miranda, J.M.; Araújo, J.D.P.; Campos, J.B.L.M. Review on vertical gas–liquid slug flow. Int. J. Multiph. Flow 2016, 85, 348–368. [Google Scholar] [CrossRef]
- Falcone, G.; Hewitt, G.F.; Alimonti, C.; Harrison, B. Multiphase flow metering: Current trends and future developments. In Proceedings of the SPE Annual Technical Conference and Exhibition, New Orleans, Louisiana, 30 September–2 October 2002; pp. 77–84. [Google Scholar] [CrossRef]
- Thorn, R.; Johanson, G.A.; Hammer, E.A. Recent developments in three-phase flow measurement. Meas. Sci. Technol. 1997, 8, 691–701. [Google Scholar] [CrossRef]
- Ahmed, W.H. Experimental investigation of air–oil slug flow using capacitance probes, hot-film anemometer, and image processing. Int. J. Multiph. Flow 2011, 37, 876–887. [Google Scholar] [CrossRef]
- Villarreal, J.; Laverde, D.; Fuentes, C. Carbon-steel corrosion in multiphase slug flow and CO2. Corros. Sci. 2006, 48, 2363–2379. [Google Scholar] [CrossRef]
- Alssayh, M.; Addali, A.; Mba, D. Slug velocity measurement using acoustic emission technology. J. Process Mech. Eng. 2016, 230, 76–83. [Google Scholar] [CrossRef]
- Sharma, S.; Lewis, S.; Kojasoy, G. Local studies in horizontal gas–liquid slug flow. Nucl. Eng. Des. 1998, 184, 305–318. [Google Scholar] [CrossRef]
- Nieckele, A.O.; Carneiro, J.N.E.; Chucuya, R.C.; Azevedo, J.H.P. Initiation and Statistical Evolution of Horizontal Slug Flow with a Two-Fluid Model. J. Fluids Eng. 2013, 135, 121302. [Google Scholar] [CrossRef]
- Pusppanathan, J.; Rahim, R.A.; Phang, F.A.; Mohamad, E.J.; Ayob, N.M.N.; Rahiman, M.H.F.; Seong, C.K. Single-Plane Dual-Modality Tomography for Multiphase Flow Imaging by Integrating Electrical Capacitance and Ultrasonic Sensors. IEEE Sens. J. 2017, 17, 6368–6377. [Google Scholar] [CrossRef]
- Mohamad, E.J.; Rahim, R.A.; Rahiman, M.H.F.; Ameran, H.L.M.; Muji, S.Z.M.; Marwah, O.M.F. Measurement and analysis of water/oil multiphase flow using Electrical Capacitance Tomography sensor. Flow Meas. Instrum. 2016, 47, 62–70. [Google Scholar] [CrossRef]
- Rahim, R.A.; Yunos, Y.M.; Rahiman, M.H.F.; Muji, S.Z.M.; Thiam, C.K.; Rahim, H.A. Optical tomography: Velocity profile measurement using orthogonal and rectilinear arrangements. Flow Meas. Instrum. 2012, 23, 49–55. [Google Scholar] [CrossRef]
- Xue, T.; Chen, Y.; Ge, P. Multibubbles segmentation and characteristic measurement in gas-liquid two-phase flow. Adv. Mech. Eng. 2013. [Google Scholar] [CrossRef]
- Xue, T.; Qu, L.; Cao, Z.; Zhang, T. Three-dimensional feature parameters measurement of bubbles in gas-liquid two-phase flow based on virtual stereo vision. Flow Meas. Instrum. 2012, 27, 29–36. [Google Scholar] [CrossRef]
- King, M.J.S.; Hale, C.P.; Lawrence, C.J.; Hewitt, G.F. Characteristics of flowrate transients in slug flow. Chem. Technol. 1998, 24, 825–854. [Google Scholar] [CrossRef]
- Hanus, R.; Zych, M.; Kusy, M.; Jaszczur, M.; Petryka, L. Identification of liquid-gas flow regime in a pipeline using gamma-ray absorption technique and computational intelligence methods. Flow Meas. Instrum. 2018, 60, 17–23. [Google Scholar] [CrossRef]
- Stavland, S.H.; Satre, C.; Hjertaker, B.T.; Tjugum, S.A.; Hallanger, A.; Maad, R. Gas fraction measurements using single and dual beam gamma-densitometry for two phase gas-liquid pipe flow. In Proceedings of the I2MTC 2019—2019 IEEE International Instrumentation and Measurement Technology Conference, Auckland, New Zealand, 20–23 May 2019. [Google Scholar] [CrossRef]
- van Hout, R.; Barnea, D.; Shemer, L. Translational velocities of elongated bubbles in continuous slug flow. Int. J. Multiph. Flow 2002, 28, 1333–1350. [Google Scholar] [CrossRef]
- Dos Reis, E.; Leonardo, L.G. Characterization of slug flows in horizontal piping by signal analysis from a capacitive probe. Flow Meas. Instrum. 2010, 21, 347–355. [Google Scholar] [CrossRef]
- Andreussi, P.; Di Donfrancesco, A.; Messia, M. An Impedance method for the measurement of liquid holdup in two-phase flow. Int. J. Multiph. Flow 1988, 14, 777–785. [Google Scholar] [CrossRef]
- Fang, L.; Zeng, Q.; Wang, F.; Faraj, Y.; Zhao, Y.; Lang, Y.; Wei, Z. Identification of two-phase flow regime using ultrasonic phased array. Flow Meas. Instrum. 2020, 72, 101726. [Google Scholar] [CrossRef]
- Dos Reis, E.; Goldstein, L. A non-intrusive probe for bubble profile and velocity measurement in horizontal slug flows. Flow Meas. Instrum. 2005, 16, 229–239. [Google Scholar] [CrossRef]
- Masiukiewicz, M.; Anweiler, S. Two-phase flow structure assessment based on dynamic image analysis. Flow Meas. Instrum. 2019, 65, 195–202. [Google Scholar] [CrossRef]
- Nnabuife, S.G.; Pilario, K.E.S.; Lao, L.; Cao, Y.; Shafiee, M. Identification of gas-liquid flow regimes using a non-intrusive Doppler ultrasonic sensor and virtual flow regime maps. Flow Meas. Instrum. 2019, 68, 101568. [Google Scholar] [CrossRef]
- Nnabuife, S.G.; Kuang, B.; Whidborne, J.F.; Rana, Z. Non-Intrusive classification of gas-liquid flow regimes in an s-shaped pipeline riser using a Doppler ultrasonic sensor and deep neural networks. Chem. Eng. J. 2020, 403, 126401. [Google Scholar] [CrossRef]
- Kuang, B.; Godfrey, S.; Rana, Z. Pseudo-image-feature-based identification benchmark for multi-phase flow regimes. Chem. Eng. J. Adv. 2021, 5, 100060. [Google Scholar] [CrossRef]
- Takeda, Y. Ultrasonic Doppler method for velocity profile measurement in fluid dynamics and fluid engineering. Exp. Fluids 1999, 26, 177–178. [Google Scholar] [CrossRef]
- Aaslid, R.; Markwalder, T.M.; Nornes, H. Noninvasive transcranial Doppler ultrasound recording of flow velocity in basal cerebral arteries. J. Neurosurg. 1982, 57, 769–774. [Google Scholar] [CrossRef]
- Atkinson, P.; Wells, P.N. Pulse-Doppler ultrasound and its clinical application. Yale J. Biol. Med. 1977, 50, 367–373. [Google Scholar]
- Okamura, S.; Uchida, S.; Katsumata, T.; Iida, K. Measurement of solids holdup in a three-phase fluidized bed by an ultrasonic technique. Chem. Eng. Sci. 1989, 44, 196–198. [Google Scholar] [CrossRef]
- Weinstein, E. Measurement of the differential doppler shift. IEEE Trans. Acoust. 1982, 30, 112–117. [Google Scholar] [CrossRef]
- Chivers, R.C.; Hill, C.R. A spectral approach to ultrasonic scattering from human tissue: Methods, objectives and backscattering measurements. Phys. Med. Biol. 1975, 20, 799–815. [Google Scholar] [CrossRef]
- Cobbold, R. Doppler ultrasound: Physics, instrumentation, and clinical applications. J. Biomed. Eng. 1989, 11, 528. [Google Scholar] [CrossRef]
- Kremkau, F.W. Physical principles of ultrasound. Semin. Roentgenol. 1975, 10, 259–263. [Google Scholar] [CrossRef]
- Nnabuife, S.G.; Whidborne, J.; Lao, L.; Cao, Y. Venturi multiphase flow measurement based active slug control. In Proceedings of the ICAC 2019—2019 25th International Conference on Automation and Computing, Chinese Automation and Computing Society in the UK—CACSUK, Lancaster, UK, 5–7 September 2019; pp. 1–6. [Google Scholar] [CrossRef]
- Barbosa, J.R. Two-phase non-equilibrium models: The challenge of improving phase change heat transfer prediction. J. Braz. Soc. Mech. Sci. Eng. 2005, 27, 31–45. [Google Scholar] [CrossRef][Green Version]
- Shang, Z.; Yang, R.; Cao, X.; Yang, Y. An investigation of two-phase flow instability using wavelet signal extraction technique. Nucl. Eng. Des. 2004, 232, 157–163. [Google Scholar] [CrossRef]
- Matsumoto, S.; Suzuki, M. Statistical analysis of fluctuations of froth pressure on perforated plates without downcomers. Int. J. Multiph. Flow 1984, 10, 217–228. [Google Scholar] [CrossRef]
Publisher’s Note: MDPI stays neutral with regard to jurisdictional claims in published maps and institutional affiliations. |
© 2021 by the authors. Licensee MDPI, Basel, Switzerland. This article is an open access article distributed under the terms and conditions of the Creative Commons Attribution (CC BY) license (http://creativecommons.org/licenses/by/4.0/).