Article

Circumventing Unintended Impacts of Waste N95 Facemask Generated during the COVID-19 Pandemic: A Conceptual Design Approach

by
Oseweuba Valentine Okoro
1,*,
Adjoa Nkrumah Banson
2 and
Hongxia Zhang
3
1
Department of Process Engineering, Stellenbosch University, Private Bag X1, Matieland 7602, South Africa
2
Department of Physiotherapy and Rehabilitation Sciences, University of Health and Allied Sciences, Private Mail Bag 31, Ho, Volta Region P.O. Box 250353, Ghana
3
State Key Laboratory of Biobased Material and Green Papermaking, Qilu University of Technology, Shandong Academy of Science, Jinan 250353, China
*
Author to whom correspondence should be addressed.
ChemEngineering 2020, 4(3), 54; https://doi.org/10.3390/chemengineering4030054
Submission received: 20 August 2020 / Revised: 15 September 2020 / Accepted: 17 September 2020 / Published: 20 September 2020

Abstract

:
The global crisis arising from the current COVID-19 pandemic has resulted in a surge in the magnitude of global waste from used Personal Protective Equipment with special emphasis on waste N95 facemask. Creative approaches are therefore required to resolve the surging facemask waste disposal issue in an economical and environmentally friendly manner. In an attempt to resolve the evolving global waste challenge, the present study has assessed the economic and environmental performances of converting N95 facemasks to steam and electricity via a combined heat and power plant, to ethanol via a syngas fermentation process, and to an energy-dense gasoline-like oil product via a hydrothermal liquefaction process. These processes were assessed using “conceptual” process models developed using ASPEN plus as the process simulation tool. Economic and environment assessments were undertaken using net present values (NPVs) and the rate of potential environmental impacts (PEIs) respectively, as sufficient performance measures. Therefore, the present study was able to establish that the conversion of waste N95 facemask to syngas prior to a fermentation process for ethanol production constituted the least economical and least environmental friendly process with a negative NPV and the highest rate of PEI (1.59 PEI/h) value calculated. The NPV values calculated for N95 facemask waste conversion to steam and electricity and energy-dense oil processes were US$ 36.6 × 10⁶ and US$ 53 × 106 respectively, suggesting the preference for the production of a valuable energy-dense oil product. Furthermore, it was observed that when the environmental performance of both processes was considered, rates of PEIs of 1.20 and 0.28 PEI/h were estimated for the energy-dense oil production process and the steam and electricity generation process, respectively. Therefore, the study was able to establish that the utilisation of waste N95 facemask for steam and electricity generation and for generating an energy-dense oil product are both promising approaches that could aid in the resolution of the waste issue if both environmental and economic performances constitute crucial considerations.

1. Introduction

In December 2019, cases of “pneumonia” of unknown origin appeared in the Wuhan city in the Wubei province of China, which resulted in a number of hospital admissions [1,2]. From five persons initially reported in mid-December, the number increased to 41 by 2 January 2020 [2]. After intensive investigations by the Chinese Centre for Disease Control and Prevention (CDC), a new member of the Coronavirus (CoV) family was discovered as the causative agent for these clusters of the strange outbreak [1,2]. On 11 February 2020, the World Health Organisation (WHO) subsequently designated the name of this causative agent as “Coronavirus disease 2019” with the acronym “COVID-19” [1].
Corona viruses are positive-stranded microscopic ribonucleic acid (RNA) structures with crown-like appearance owing to spikes of glycoproteins on its envelope [1]. According to scientific nomenclature, the Orthocoronavirinae subfamily of the Coronavirus (Coronavidae) family has four genera of namely Alphacoronavirus, Betacoronavirus, Deltacoronavirus, and Gammacoronavirus with the COVID-19 virus established to belong to the Betacoronavirus genus [1]. The COVID-19 virus targets the human respiratory system, and similar to other respiratory viruses, it is highly contagious through infected aerosols from the mouth and nose released during coughing, sneezing, or even talking [1,2]. This is because the virus is transmitted through respiratory droplets that are at least 5 to 10 μm in diameter [2]. The COVID-19 virus itself is reported to be approximately 0.125 microns in size and is capable of “travelling” up to 1.8 m from the source to eventually settle on surfaces [3]. Within this radius, the virus could be inhaled by other persons, leading to serious health complications in some cases [2]. COVID-19 virus infections may present common symptoms such as coughing, fever, and tiredness [1,2] with less common symptoms being headaches, diarrhoea, difficulty breathing, and the loss of ability to smell or taste [2]. Pneumonia, acute respiratory syndrome, and acute cardiac injury are symptoms that have been reported at later stages of severe cases of the infection [2]. Although the disease originated in Wuhan, it started to spread since December and currently as at 19 June 2020, a total of 8,457,305 cases of COVID-19 have been reported worldwide with a devastating global death toll of 453,882 [4]. To limit the spread of COVID-19, there is the need to use a structural barrier that prevents infected respiratory droplets from travelling. Thus, facemasks became a crucial personal protective equipment for this purpose. Of the different types of these masks, surgical respirator masks were demonstrated to serve as effective protective barriers that reduced the wearer’s exposure to airborne biological pathogens such as COVID-19 virus [5].
These surgical respirator masks, classified as “FFP1” in compliance with EN149 EU standard, are also called the N95 facemasks because of its ability to achieve a 95% filtration of particles with a mass median diameter of 0.3 micrometers [3]. The N95 facemask may consist of multiple layers of nonwoven fabric, which are often made from polypropylene plastic (C3H6)n [6]. However, in most cases, N 95 masks contain a layer each of cellulose (C6H10O5) sandwiched between layers made of spun-bond polypropylene [5]. These N95 facemasks are typically single use, as they are considered to be contaminated and thus are plastic medical waste that must be disposed with the current pandemic, resulting in significantly increased upstream demand not “matched” with an effective downstream waste disposal approach [3,7]. According to Klemes et al. [7], the morbidity and significant mortality rate of the COVID pandemic often overshadows the seriousness of the long-term environmental effect of the poor waste plastic management [7]. For instance, it has been suggested that there is a risk of generating over 128,000 tonnes/y of unrecyclable plastic-related waste in the UK as a direct consequence of utilising disposable surgical masks [8]. Therefore, scientists have opined that this waste plastic surge due to COVID-19 presents an opportunity to accelerate immediate and even long-term changes in plastic waste management globally [7]. In order to satisfy waste disposal requirements, several approaches such as incineration of the waste have been employed, because it ensures the obliteration of the virus due to the high temperatures involved in the incineration process and also circumvents the low biodegradability concerns of the plastic-containing waste N95 facemask [9,10]. However, the incineration approach may result in the release of toxic and poisonous gases such as dioxins, furans, and polychlorinated biphenyls, which lead to associated unfavourable environmental outcomes [11,12]. Therefore, it is necessary that possible pathways for facemask waste management are investigated to mitigate the harmful impact of plastics on the environment. The current study proposes the investigation of waste N95 facemask management via its conversion to energy and fuels via the thermochemical transformations of gasification [13], hydrothermal liquefaction [13] and gasification–fermentation [14]. The aforementioned thermochemical transformation pathways are capable of facilitating the safe management of waste N95 facemask due to the high temperatures typically imposed while simultaneously enabling the downstream generation of steam electricity from syngas (via combined heat and power systems), energy-dense oils from hydrothermal liquefaction, and liquid fuels from gasification–fermentation [13,14]. Therefore, the current study presents a comparative assessment of the economic and environment impact performances of the technologies while using net present value (NPV) economic measures and a waste reduction (WAR) algorithm, respectively. Such a comparative assessment of possible waste N95 facemask management strategies are yet to be undertaken in the literature. In the present study, the representative waste N95 facemask has been modelled as consisting of three layers of polypropylene (PP) and one layer of cellulose (based on the BioFriendTM BioMaskTM N95 model) [15] with the mass fraction of cellulose specified to 0.25 of the total mass of the waste N95 facemask. This assumption became crucial, since the mass composition of the layers may vary widely as stated earlier above.

2. Materials and Methods

2.1. Modelling Approach

The present study assumes the availability of 1.77 tonnes per hour of waste N95 facemask, which translates to 1/10th of the mass of waste estimated to be available per h (assuming 300 working days/y) according to the UK scenario discussed briefly above. The composition of the representative waste N95 facemask employed in the current study is presented in Table 1. All simulations of waste N95 facemask management pathways specified above were achieved using ASPEN (Advanced System for Process Engineering) plus®® V10 process simulator (Aspen Technology Inc., Cambridge, MA, USA). This is because of its capability to generate accurate albeit simplified models can be solved for energy and mass balances in accordance with basic process engineering principles [16].
Employing the standard methodology in modelling the properties of components such as enthalpy and density, based on literature reported proximate and ultimate results, the inbuilt HCOALGEN and DCOALIGT models were employed in simulating the waste N95 facemask, ash, and char components. The properties of other chemical inputs, such as ethanol, water, and air employed in the simulation study were obtained from the databank of the chemical property library in ASPEN plus®® V10. The UNIQUAC thermodynamic property method in ASPEN plus was selected as sufficient in modelling and predicting the vapour–liquid equilibria of chemical species present in both complex non-ideal polar and nonpolar systems at low and high pressure [19,20]. Prior to undertaking the modelling processes, the stream class of MIXCISLD was employed in order to facilitate the modelling of solid components. Finally, all models were developed to simulate continuous operations while being under steady-state conditions. It must be acknowledged that in this process simulation study, conceptual models were developed using publicly available reaction conditions, conversions, and product yields with generic processes for producing the specified target products from waste N95 facemask modelled and simulated. In other words, possible modifications employed in the industry to optimise yields were not considered in the study. Such optimisation studies may be undertaken in future work. It must also be emphasised that due to the novelty of the feedstock (waste N95 facemask), there are currently no experimental data specifying the experimental yields of the product fractions from the conversion of waste N95 facemasks to valuable products via the thermochemical technologies. Therefore, simplified modelling approaches are necessary to determine process outcomes. Management processes that employ the waste N95 facemask in the generation of steam electricity from syngas via gasification (scenario i), energy-dense oils from hydrothermal liquefaction (scenario ii), and liquid fuel of ethanol from gasification–fermentation (scenario iii) as illustrated in Figure 1 are extensively discussed in the subsequent section. Clearly the high temperature thermochemical technologies considered in the present study will facilitate the sterilisation of the feedstock, thus, reducing the potential for unwanted (human) health challenges.

2.2. Process Description

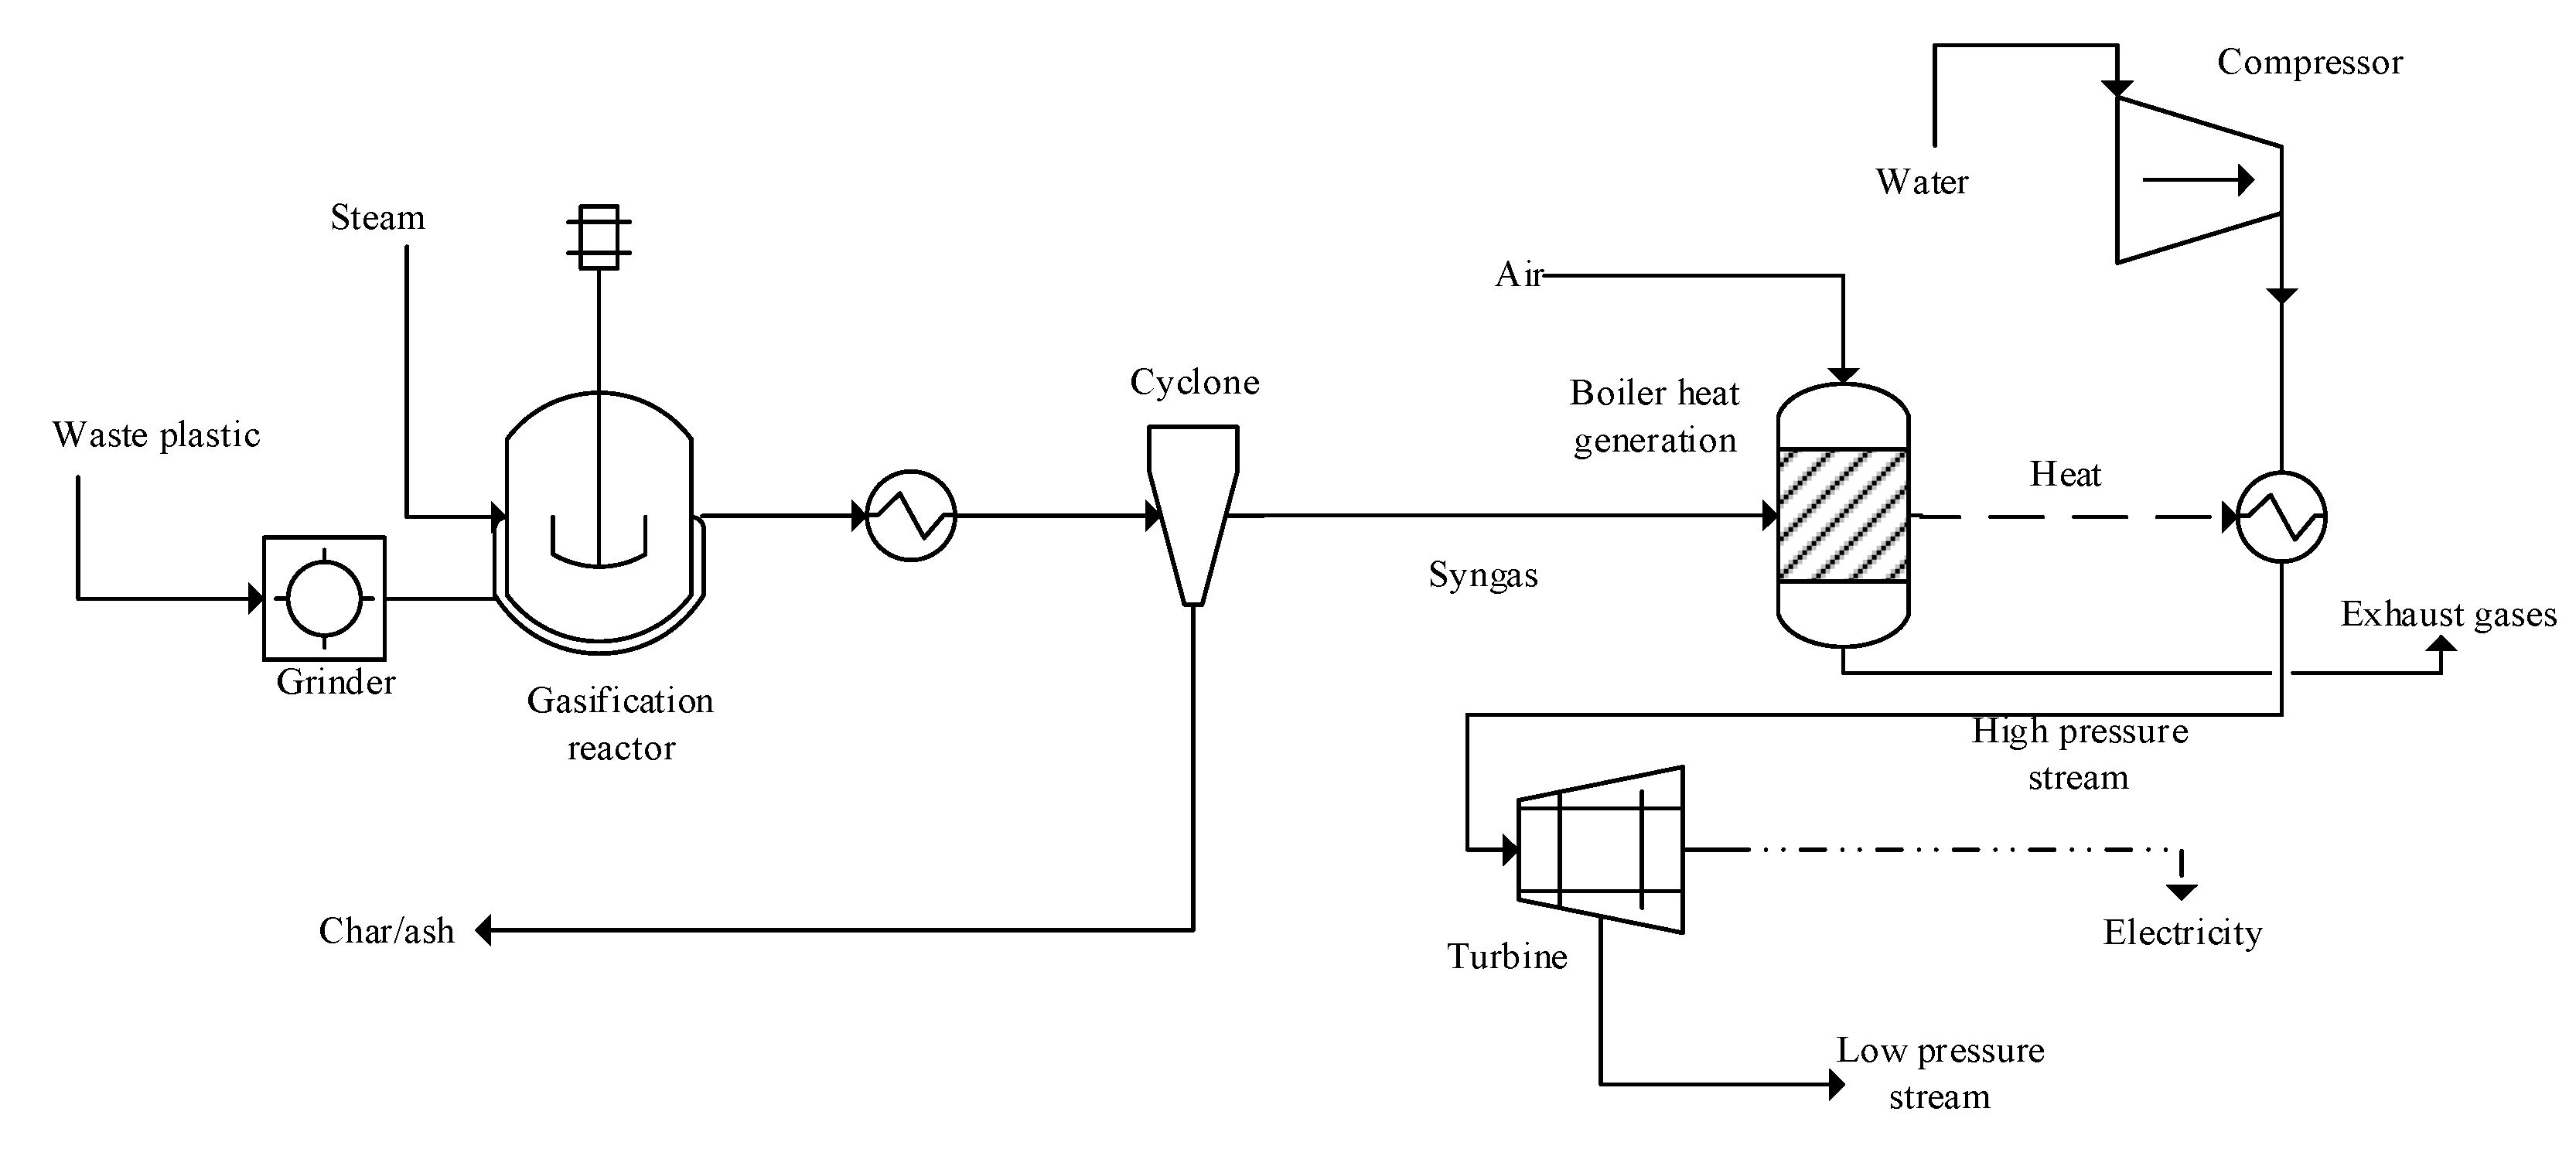
In scenario i, the generation of useful products of superheated steam and electricity using waste N95 facemask as a feedstock is summarised using the process flow diagram in Figure 2. In Figure 2, an initial grinding operation is undertaken to generate finely ground particles for enhanced mass and heat transfer. Grinding is specified as being achieved using an industrial grade grinder rated with the power requirement of 700 kWh/tonne of waste N95 facemask processed [21]. The grounded feed is subsequently transferred to the gasification reactor specified as operating at a temperature of 1000 °C and pressure of 1 atm with steam employed as the gasification agent. A steam-to-feed ratio of 2 is specified in the present study [22]. Under the aforementioned conditions, the waste undergoes partial oxidation to generate a gaseous mixture of mainly H2, CO, CO2, and CH4 and solids of ash and chars [13]. To simplify the study, possible process limitations due to tar generation and deposition have not been considered in the present study. Due to the lack of models to adequately predict the composition of the syngas product of the gasification process as a result of its high level of complexity, the present study has modelled the gasification of the waste N95 facemask using the equilibrium-based model in Aspen Plus [23]. Solid products of char and ash are subsequently removed from the syngas product using a cyclone with the resulting purified syngas assessed for its energy content in terms of its LHVsyngas in MJ/Nm3 for completeness using Equation (1) [24];
LHV s y n g a s = ( y co × 12.62 )   +   ( y H 2 × 10.79 )   +   ( y CH 4 × 35.81 )   +   ( y C 2 H 2 × 56.08 )   +   ( y C 2 H 4 × 59.04 )
where yCO, yH2, yCH4, yC2H2, and yC2H4 represent the mole fractions of CO, H2, CH4, C2H2 and C2H4, respectively. In this equation, Nm3 denotes the normal meter cubed such that “normal” denotes to normal conditions of 0 °C and 1 atm (standard atmosphere = 101.325 kPa).
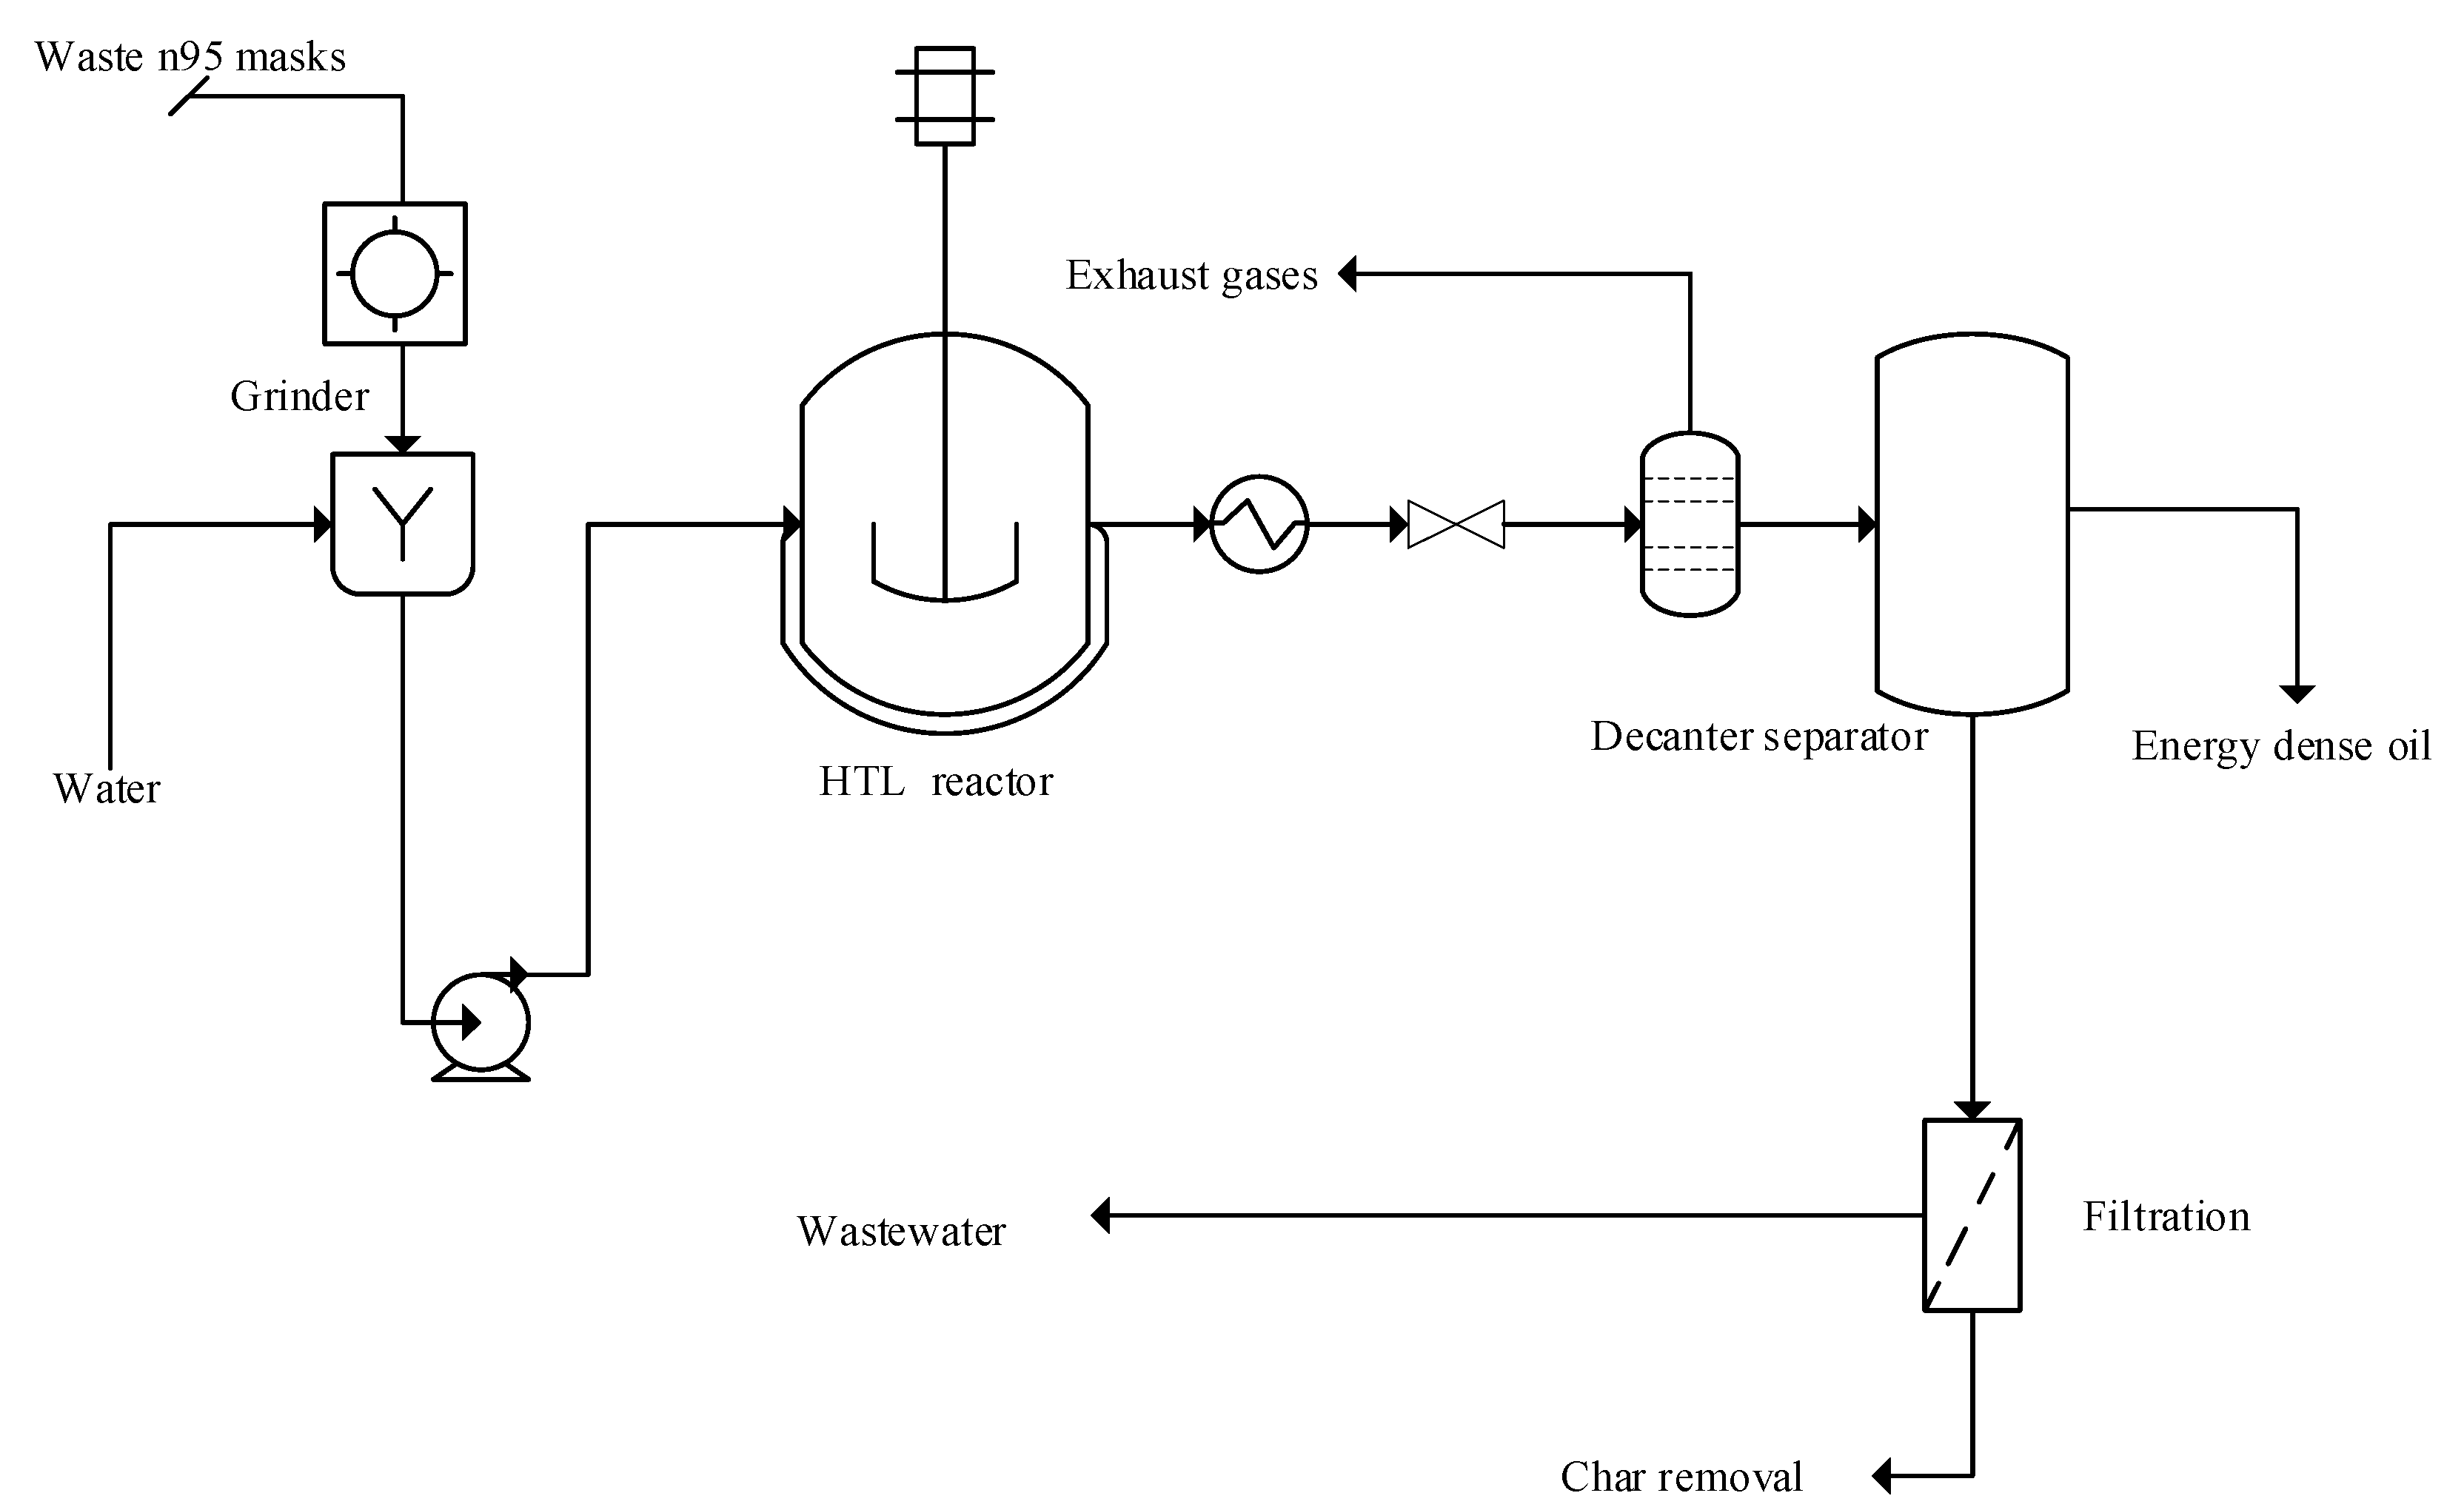
This energy content was compared to the energy content of syngas as obtained from the literature. Then, the ash-free syngas is transferred to a cogeneration system that facilitates combined heat and power production. Briefly, the cogeneration system employed in the present study involved the combustion of the syngas at 1000 °C with the generated heat employed in heating pressurised water (100 bar) to generate high-pressure steam. Electricity generation is achieved using a network of turbines in series with the resulting low-pressure steam available to satisfy heating requirements. The generation of syngas as a clean gaseous fuel prior to its combustion for heat and electricity generation was preferred to the direct combustion of the feedstock. This is because gasification processes enable greater control of emissions (i.e., GHGs, particulates) compared to combustion processes thus enhancing environmental performance [13]. In scenario ii, the generation of the useful product of an energy-dense (gasoline-like) oil via hydrothermal liquefaction and using waste masks as a feedstock is summarised using the process flow diagram in Figure 3 and based on previously reported work regarding waste plastic management [25]. For clarity, scenarios ii and iii (below) employ similar pathways and methods discussed in our earlier work in [25] for the different feedstock of plastics and thus are briefly discussed here and are also duly acknowledged. The readers are referred to [25] for more details. A flow diagram for the hydrothermal liquefaction process from [25] has been employed.
Figure 3 shows scenario ii, in which the waste N95 facemask, composed of polypropylene (also a plastic) and cellulose is converted to an energy-dense oil product. In Figure 3, the grinded waste mask and water were mixed and pumped to a high-press hydrothermal liquefaction (HTL) reactor. Due to the absence of experimental data regarding the preferred temperature and pressure conditions for processing the waste N95 facemask, the reported conditions for the HTL of PP to produce hydrocarbons of mainly gasoline have been employed [26]. Based on the experimental work in [26], it is also hypothesised that the supercritical water treatment of waste N95 facemask may lead to the generation of an energy dense gasoline product (C6–C12), since it contains PP. For simplicity the reported conditions of temperature of 425 °C and pressure of 23 MPa [26] have been applied. Therefore, these conditions have been specified in simulating the HTL process to promote enhanced gasoline production. Additionally, since a previous study has demonstrated that the hydrothermal liquefaction of cellulose (only) will lead to the generation of glucose and (hydroxymethyl)furfural (5-HMF) products [27], these products in addition to the gasoline product have been identified as the possible products of the HTL process. The HTL process has been simulated using an equilibrium-based model in Aspen Plus due to inherent complexities of the HTL process and also since the presence of equilibrium states during HTL processes have been reported in the literature [13,28]. Having completed the HTL reaction, Figure 3 shows that the product stream is cooled to 25 °C and depressurised to 1 atm. The cooled product mixture is subsequently transferred to a decantation separator. It is assumed that the separation of the oil product from water-soluble components is achievable due to the hydrophobicity characteristics of the oil fraction of the product mixture [29]. Further separation of the HTL–water and solid char fractions may be achieved using a filtration unit. As a further step, the higher heating value of the HTL oil mixture was estimated and compared to the higher heating value (HHV) of petroleum fuels using Equation (2) [30],
HHV o i l = 0.338 C + 1.428 ( H   O 8 ) + 0.095 S
where C, H, S, and O represent the percentage mass basis content of carbon, hydrogen, sulphur, and oxygen, respectively.
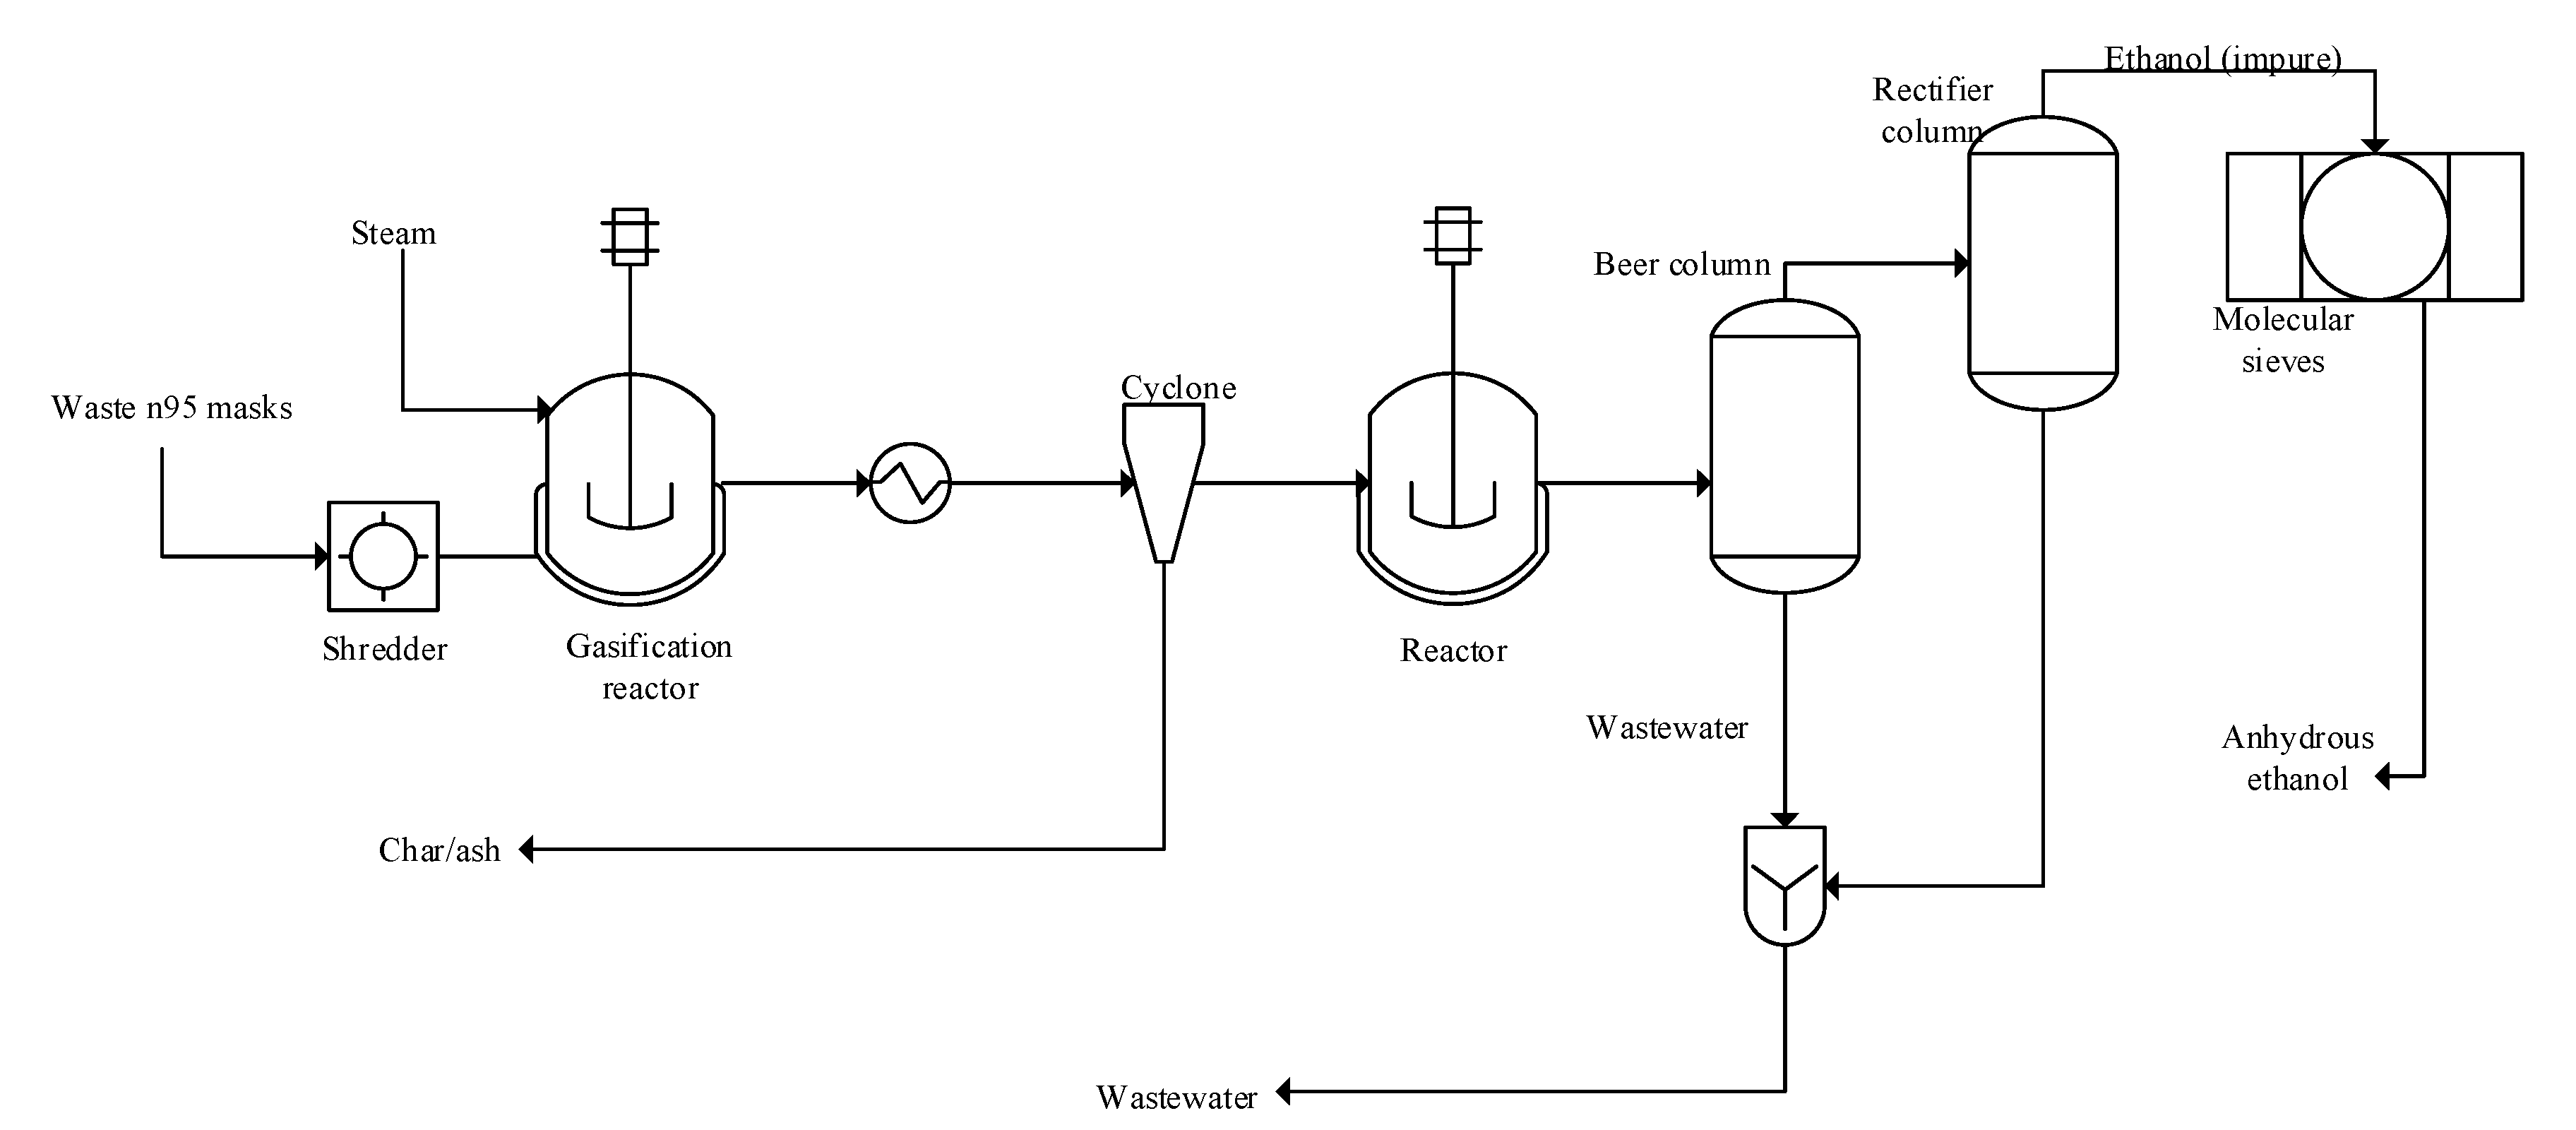
In scenario iii, syngas is generated using the steps described in scenario i above prior to biochemical ethanol production via the process from [25] is shown in Figure 4.
As discussed earlier in [25], Figure 4 shows that it is possible for syngas to be fermented under the action of acetogenic microorganisms [31,32]. The fermentation reactions are assumed to occur at process conversion efficiencies of 90% for CO and 70% H2 in accordance with the reported literature results [33]. Conversion and stoichiometry-based ASPEN models have been employed in simulating the fermentation process with the equations summarised in the supplementary file document. After the fermentation process, the broth containing the ethanol is subjected to distillation processes to enable the purification of the target ethanol product. Further enhancement of the concentration of the ethanol product is achieved using molecular sieves to generate anhydrous ethanol (ethanol content >99.7% mass basis) [34]. The anhydrous ethanol will have an HHV of 29.7 MJ/kg [35]. At the completion of the modelling of the scenarios stated above, mass balance calculations were performed in ASPEN plus. In addition, the energetic requirements of the processes were calculated for the scenarios using the ASPEN plus energy analyser add-on. In undertaking the energetic assessment, heat integration via pinch analysis was incorporated in the study. A comprehensive discussion of the pinch approach in achieving heat integration is not discussed further in this study and may be found elsewhere [16,36]. It must be emphasised that in the present comparative study, standard conditions obtained from the literature have been employed in modelling generic operations. In other words, optimisation strategies have not been undertaken in the present study. Such optimisation studies may constitute the basis of future work.

2.3. Economic Performance Measure

In each of the scenarios described in the earlier sections above, economic performances of the waste N95 facemask management strategies were assessed. In order to compare the different strategies, capital investment analysis was employed in the calculation of the net present value (NPV), which was used as a performance measure. To calculate the NPV of each strategy, a simple discounted cash flow approach was employed such that the NPV was calculated as the difference between the present value of cash inflows and cash outflows arising from the production and sale of the product streams. Discounted cash flows were evaluated for a 30 y project lifecycle with annual cash flow from assets (NRevs) incorporating product sales i.e., products of electricity and heat, energy-dense oil product, and ethanol (pre-COVID-19 selling prices utilised) in scenario i, scenario ii, and scenario iii, after subtracting the operating cost and income tax. Therefore, the NPV for each scenario was calculated using Equation (3) [37,38,39];
NPV = TCI + n = 1 t N Re v ( 1 + i ) n + S V n ( 1 + i ) n
where TCI denotes the total capital investment cost, i denotes the discount rate specified as 10% in the present study, and n has been specified as 30, which denotes the lifetime of the project. Of course, the lifetime is an assumed number. SVn is the salvage value, which is also assumed to be zero in the present study. NRev, which is the annual cash flow from assets, was calculated using Equation (4) [37];
N R e v = ( R t C t D t ) ( 1 T ) + D t
where Rt and Ct denote the total revenue before tax and total cost before tax in year t respectively; T and Dt denote the corporate marginal tax rate and the depreciation over the life of the plant.
In all scenarios, the avoided disposal cost of plastic-related waste of an average of USD 135 per ton [40] was incorporated in the development of the cash flow table. The total capital cost (TCI) for each process was estimated using established chemical engineering costing relationships based on the equipment purchase cost. These costing relationships have been summarised in the supplementary file. Similarly, the selling prices of the product streams are also presented in the supplementary file. Equipment purchase costs of common equipment such as pumps, compressors, and distillation columns were estimated using the ASPEN process economic analyser V11. For enhanced accuracy, the cost of specialised equipment, such as the cogeneration plant [41], specialised, hydrothermal liquefaction reactor [25], gasification reactor [42], cyclone [43], and plastic shredder [44] were obtained from costing correlations, previously reported studies, and the commercial vendor sites. To estimate the purchase costs for the appropriate capacities based on the sourced equipment purchase cost prices, the scaling approach was employed with the scaling factor specified as 0.6 [45]. Similarly, inflationary effects on money value were also considered and incorporated in the economic calculations more so as the purchase cost of the equipment was obtained from different sources with different reference years. The chemical engineering plant cost index (CEPCI) was employed in this regard using Equation (5) [45,46];
C i , 2020 = C i , r e f ( C E P C I 2020 C E P C I r e f )
where Ci,ref and Ci,2020 are the purchase costs for the ith equipment in the reference year and the current year of 2020. CEPCI2020 was specified as 607.5, which is the average CEPCI value for 2019, as the average value for the year of 2020 is not available at this time. CEPCIs of other years prior to 2019 were obtained from the literature [47,48]. In addition to the TCI, the operating cost (OPEX) was also estimated. The OPEX incorporates costs such as raw materials, utilities (as obtained from ASPEN Plus), labor cost, maintenance, insurance, etc. All relationships employed in OPEX estimation are also presented in the supplementary file.

2.4. Environmental Performance Assessment

In the present study, the waste reduction (WAR) algorithm (WAR version 1.0.17, United States Environmental Protection Agency, Washington, DC, USA) is a freely available open source software that has been employed extensively in undertaking a comparative assessment environmental performances in the literature [49,50]. This approach has been used in the current study since the potential environmental impacts of the alternative standalone pathways constitute the research focus. The WAR algorithm facilitates the utilisation of ASPEN plus obtained mass balance data for stream flow rates and compositional distribution as inputs in estimating potential environmental impacts (PEIs). The WAR algorithm also facilitates the estimation of the environmental impact indicators while also assessing the impact categories [51] as summarised in Table 2.
Based on the impact categories stated above, the WAR algorithm is able to facilitate the calculation of PEIs based on the impact or effect of the input and output flow rates (energy and mass) from a process if they were discharged arbitrarily [49]. In the present study, the rates of PEI of the three scenarios investigated have been comparatively assessed. To simplify the comparative assessment, the heating energy duty estimated using the ASPEN plus energy analyser was assumed to be satisfied using natural gas as the primary fossil-based energy source. Briefly, the conceptual rate of PEI out of a process is calculated using Equations (6) and (7) [51],
I · o u t c p = i c p I · i o u t = i c p M · i o u t k x i ϕ k
I · o u t e p = i e p g M · i o u t k x k i ϕ k
such that the summation of these equations facilitates the calculation of the rate of PEI out of a system.
In these Eqns., I ˙ o u t c p is the rate of PEI out of a system due to chemical interactions within the system; I ˙ o u t e p is the rate of PEI out of a system due to energy generation processes within the system; M ˙ i o u t is the mass flow rate of output stream i, xki is the mass fraction of component k in output stream i, and øk is the potential environmental impact due to component k. The parameter, øk, is the summation of the specific PEI of component k of the impact categories l as follows [51],
ψ k = l α i ϕ k l s
where αi represents the relative weighting factor of impact categories, l (Table 2), with all impact categories considered equally significant in the present study.
Further descriptions of the WAR algorithm are presented elsewhere and outside the scope of the present study [16,51,52].

3. Results and Discussion

The Aspen model process conditions are presented in the Supplementary Information document. Table 3 shows that the gasification of waste N95 facemask will lead to the yield of 3 kg of syngas for every kg of waste N95 facemask. This result is slightly larger than the yield of syngas of 2.4 kg per kg of wood biomass [53] with the difference explained by the difference in feedstock as highlighted by the comparatively higher carbon and hydrogen content of the waste N95 facemask. The syngas generated from the steam gasification of N95 facemask waste was also established to be composed of H2, CO, and CO2 in mass basis percentages of 12%, 27%, and 61% respectively.
The composition of the syngas on a mass basis is 12%, 27%, and 61% for H, CO, and CO2, which translates to a mole basis composition of 71%, 12%, and 17%. Therefore, the LHV of syngas can be estimated to be ≈9.8 MJ/Nm3. The LHV estimated is consistent with expectations from the literature for the LHV of syngas produced from plastic mixtures of 9.0 to ≈12 MJ/Nm3 [54,55]. Interestingly, when the mole percentage composition of the syngas generated in the present study is compared with the composition of the syngas generated from the gasification of PP alone, several variations are observed as illustrated in Table 4.
This difference in syngas compositions may be explained by recognising the compositional difference in the feedstocks, i.e., 75 wt% of PP in the present study compared to 100 wt% of PP in the study of Saebea et al. [56]. It is hypothesised that the reduced PP hydrocarbon content may be responsible for the absence of CH4 in the syngas product of the present study. Furthermore, the higher H2 concentrations in the present study are simply a reflection of the higher steam to feed ratio of 2 compared to 1 in the study of Saebea et al. [56]. The syngas generated is subsequently transferred to a combined heat and power (CHP) system steam and electricity generation. Employing a CHP system, it was also demonstrated that it is possible to generate 6141.28 kW of electricity and 10,000 kg/h of superheated steam at a temperature of 349.5 °C and pressure of 1 atm. Table 5 shows that the yield of the oil product is ≈78.2 wt%, which is slightly outside the range anticipated for thermochemical conversion of pure PP plastics to energy dense oil of 70–80 wt% [57]. The HHV of this oil product can be estimated to be 36 MJ/kg (Equation (2)), which is higher than the HHV of butanol (34.4 MJ/kg) and slightly less than the HHV of heavy fuel oil (39 MJ/kg) [35]. The results also show that for the waste N95 facemask composed of cellulose and propylene, in mass ratios of 1:3, the resulting energy-dense oil product was characterised by negligible 5-(hydroxymethyl)furfural formation-based compositional estimates using the Gibbs free energy minimisation reaction approach.
Further assessment of the results presented in Table 5 shows that the gasoline fraction of the oil product, designated as C6–C12, was estimated to constitute the major component, with a value of ≈95 wt%. This observation is not entirely unexpected, since previous experimental work had established that the HTL of only PP feed would produce a mainly gasoline-like product of >80 wt% gasoline content that is capable of being utilised directly in gasoline blends [26]. Conveniently, this result also suggests that further upgrading of the energy-dense oil product may not be necessary due to the high gasoline content of the oil product. However, crucially, since the oil product is not completely gasoline, the selling price of the oil product (PO) cannot be equivalent to the selling price of gasoline (PG) and was estimated as dependent on the mass fraction of the solely gasoline fraction (x), (i.e., PO = x PG) and employed in NPV calculations.
Based on the results presented in Table 6, 0.63 kg of ethanol may be generated from 1 kg of waste N95 facemask. Discussions related to the yields of syngas have been presented earlier above. On a carbon monoxide (CO) basis, the ethanol yield is shown to be 48% on a mole basis. This ethanol yield on a CO mole basis is higher than the ethanol yield reported for the syngas fermentation of 39.6% in the study of Rajagopalan et al. [58] and less than the yield reported in the work of Shen et al. of 51% [59]. Utilising a molecular sieve, the ethanol with a purity of 99.8 wt% was generated.
Employing the ASPEN energy analyser, the gross heating duty shown in Figure 5a represents the total amount of energy to be supplied for heating process streams, externally, in the absence of heat integration. Meanwhile, the gross cooling duty in Figure 5a also represents the cooling duty necessary in order to satisfy set process temperatures. Figure 5b, on the other hand, assesses the effect of total heat integration on utility requirements in all scenarios considered.
Figure 5a shows that no external heating requirements are required in both the waste N95 facemask conversion to steam and energy via CHP and oil energy-dense production via HTL processes. These observations are not unexpected, since both processes are highly exothermic at steady-state conditions [60,61,62], more so at high temperatures, and cooling utilities will be required to maintain set temperatures. Figure 5a shows that the cooling requirements in the waste N95 facemask conversion to steam and energy via CHP and oil energy-dense product via the HTL processes before (after) heat integration are 17,340 kW (19,450 kW) and 3336 kW (3324 kW), respectively. It is interesting to note that heat integration in the CHP process results in the requirement for a higher external cooling utility requirement. This is because heat integration limits the loss of heat via waste ash steam, making the heat available for the overall process, thus implying a higher need for external cooling. In the waste N95 facemask–syngas–fermentation process, the externally required heating and cooling utilities before (after) heat integration were calculated to be 7197 kW (5404 kW) and 9892 kW (8100 kW), respectively.
The energy and mass balance results generated thus far were employed in cost estimates with the total capital cost (i.e., CAPEX) and the operating cost (OPEX) results presented in Table 7. Table 7 also shows that scenario ii and scenario i, representing the process for waste N95 facemask conversion to energy-dense oil product via HTL and steam and energy via CHP constitutes the best and second best economically viable processes with NPV values of MU$ 53.07 (MU$ denotes million US dollars) and MU$ 36.6 respectively. Scenario ii’s high NPV is a reflection of the generation of a valuable energy-dense oil product and the absence of addition oil upgrading steps, while the NPV of scenario i may be a reflection of the simplicity of the process.
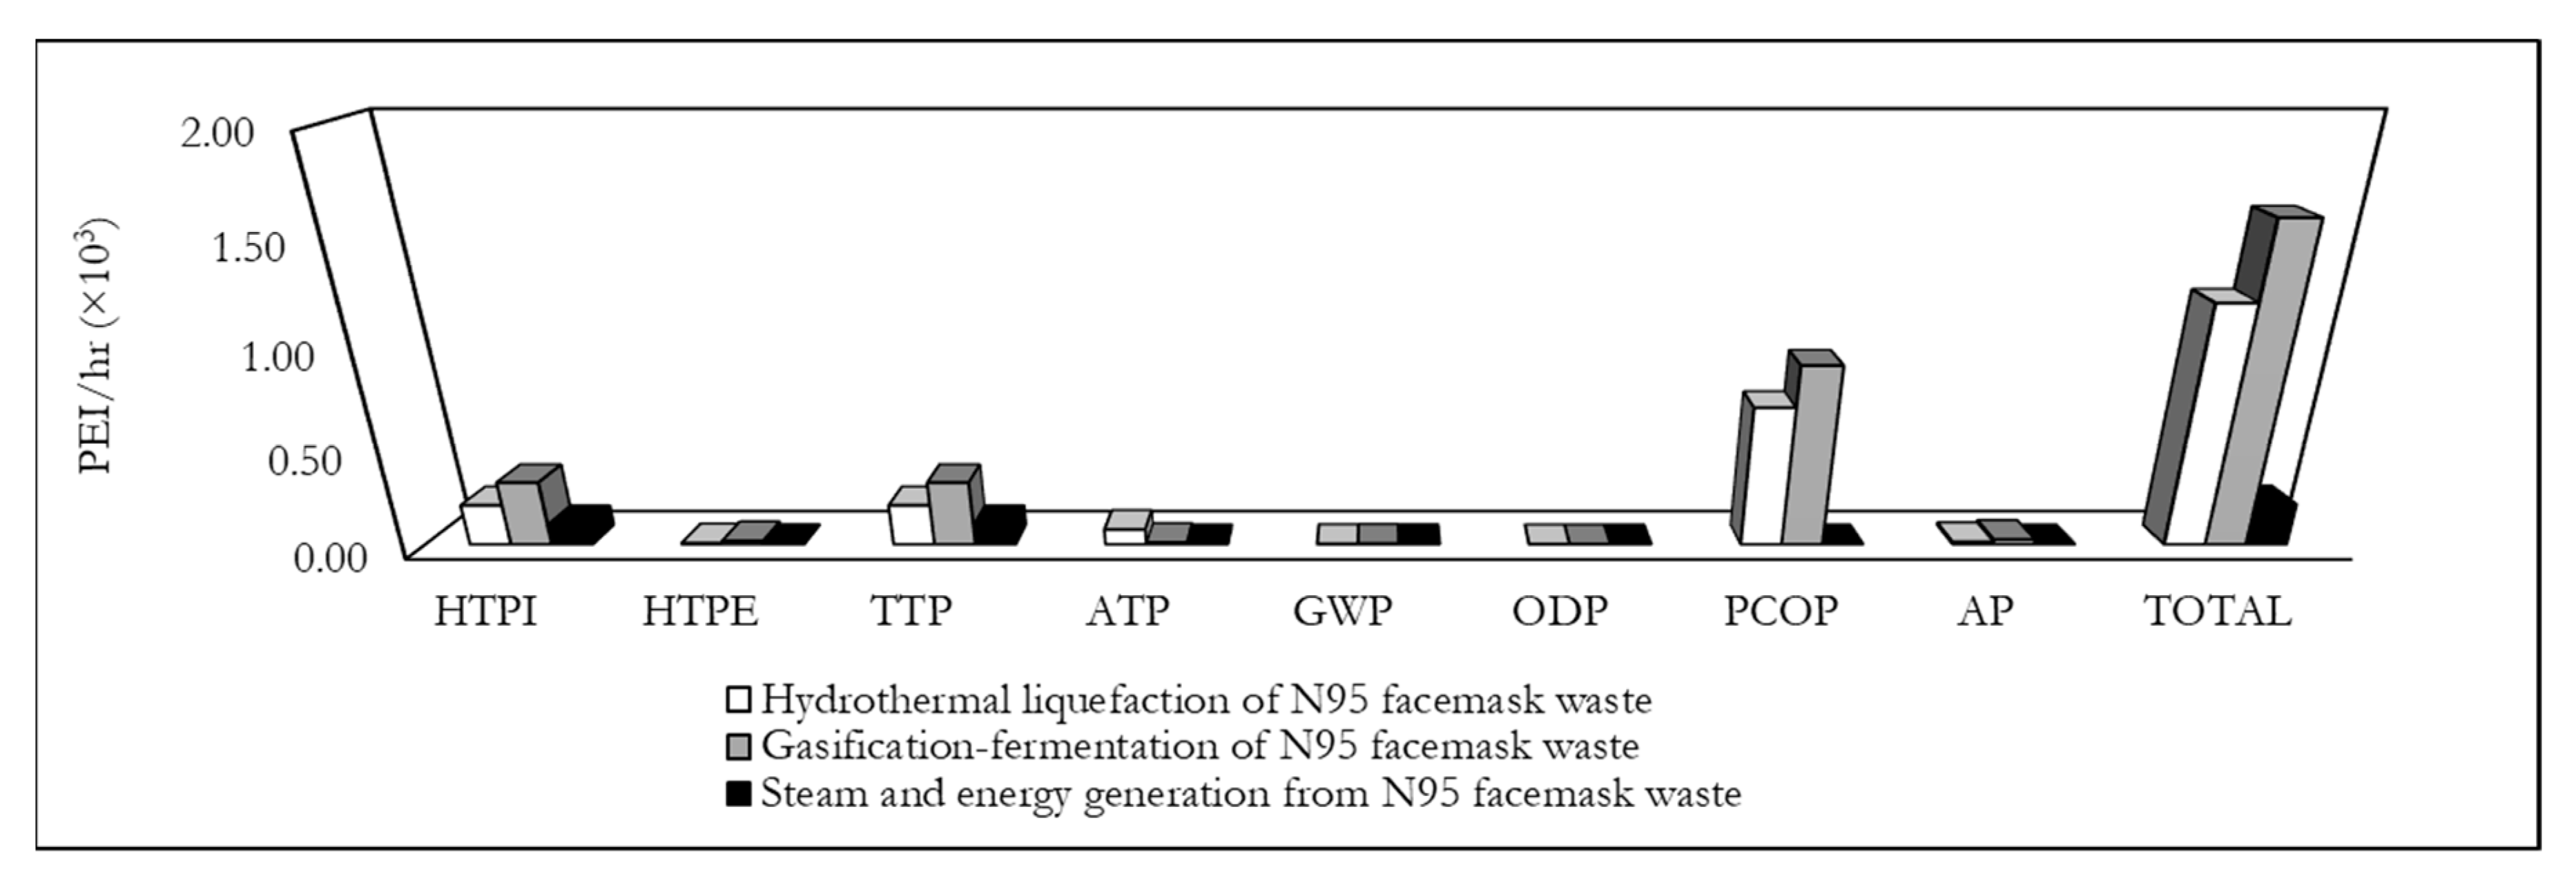
Based on the WAR results presented in Figure 6, the gasification–fermentation of N95 facemask waste for ethanol production (scenario iii) is estimated to present the highest rate of potential environmental impact (1.59 PEI/h) followed by the PEI of HTL of N95 facemask waste for the production of an energy-dense oil product (scenario ii) with a value of (1.20 PEI/h) and the PEI of the process for steam and energy generation from N95 facemasks via a gasification and cogeneration system (scenario i), with a value of (0.28 PEI/h). Figure 6 also shows that the photochemical oxidation potential (PCOP) index constitutes the major impact category of the PEI for scenario iii and scenario ii processes. The high PCOP indexes of scenario iii (≈0.9 × 10⁻³ PEI/h) and scenario ii (≈0.7 × 10⁻³ PEI/h) relative to scenario i (≈0 PEI/h) is a reflection of the increased potential of photochemical smog formation in sunlight and low-humidity conditions due to the generation of precursory (secondary) pollutants of volatile organic compounds (i.e., ethane, ethylene) [63]. Such a generation of volatile organic compounds (VOCs) is absent in scenario i as the combusted syngas does not result in VOCs. Similarly, scenarios iii and ii are also observed to present higher indexes of HTPI of ≈0.32 × 10⁻³ PEI/hand ≈0.2 × 10⁻³ PEI/hrespectively compared to the HTPI index value of ≈0.1 × 10⁻³ PEI/h, implying that scenario iii will present the least favorable effect on humans possibly due to the combined effects of the waste streams. Similar trends are also observed when the TTP (i.e., measure of terrestrial toxicity) indexes for all scenarios are considered.
The generation of large residual post-HTL water in scenario ii is also shown to lead to a higher potential of increased aquatic toxicity if disposed in surrounding aquatic bodies. Based on the result presented in Figure 6, scenario iii, which describes the gasification–fermentation of waste N95 facemask for ethanol production, will constitute the least environmentally favorable approach for waste N95 facemask management; scenario i, which describes steam and energy generation using waste N95 facemask as the feedstock, is considered the most environmentally favorable approach. Therefore, it may be suggested that if both environmental and economic performance parameters constitute indicators of importance to policy makers, the utilisation of waste N95 facemask for steam and electricity generation and energy-dense oil product generation will be the preferred waste management processes overall. However, if economics constitute the focus of policy makers, then it may be more favorable to employ the waste N95 facemask stream in the production of an energy-dense oil product via HTL.

Study Considerations and Limitations

At this juncture, it is important to state that favorable economic and environmental performances of the waste N95 facemask conversion to the energy-dense oil are largely a function of the avoided upgrading steps that typically characterise HTL processes. In other words, higher mass fractions of the cellulose fraction in the waste may lead to the production of an oil product characterised by reduced gasoline fraction and an increased composition of oxygenated compounds. Such oxygenated compounds will reduce the overall HHV of the oil product with additional upgrading steps, potentially leading to unfavourable economic and environmental outcomes. Furthermore, in this study, the boundaries of the processes have been defined such that possible challenges associated with contamination in the facemasks due to suspensions in the air are not considered. This is because the concentration of such impurities will vary significantly (and continuously) for different locations. It is also acknowledged that the study assumes that a plant lifespan of 30 years in all scenarios. This assumption is supported by the anticipation that although the authors are hopeful that the COVID-19 pandemic is resolved soon, the medical sector will continue to generate masses of polypropylene containing medical waste facemasks, since they constitute an invaluable component of personal protective equipment. It must also be acknowledged that results of the study have not been compared with experimental results, due to the absence of the latter in literature, with the predicted yields of the products obtained solely via simulation work. Experimental work to further support the conclusions of the present study is therefore required and may constitute the basis of future work in the area. The results in the present study thus provide a generalized basis for the comparison of possible waste facemask conversion and utilization technologies, and seek to aid preliminary decision making processes regarding the application of suitable management strategies to mitigate the associate challenges of medical waste management.

4. Conclusions

In this study, a process simulation and a cost analysis were carried out for waste N95 facemask conversion to steam and electricity, energy-dense oil (36 MJ/kg), and ethanol products. The generation of steam and electricity via CHP and the generation of ethanol via fermentative processes employed syngas as an intermediate product. Using conceptual process models developed using Aspen Plus, this study was able to show that the conversion of waste N95 facemask to the aforementioned products was technically feasible, and they could constitute suitable approaches to managing the waste N95 facemask streams. The study demonstrated that based on economic feasibility measures, it was economically impractical to consider ethanol production from N95 facemask waste via a syngas fermentation process, since a net present value (NPV) of –MU$46 was estimated. Interestingly, the waste N95 facemask conversion to syngas for steam and electricity generation and conversion to an energy-dense oil product were shown to be both favorable processes, when both economics and environmental performance outcomes were considered. Further environmental performance assessments established that the waste N95 facemask to syngas fermentation process is also the least environmentally favorable process overall, thus reemphasising the impracticability of the process in the study.

Supplementary Materials

The following are available online at https://www.mdpi.com/2305-7084/4/3/54/s1. Table S1: Economic assumptions employed in the study; Table S2: Capital cost components employed in TCI (CAPEX) determination; Table S3: Operating cost components employed in TOC (OPEX) determination (all costs used are available in the associated reference sources); Table S4: Data employed in developing the cash flow table; Table S5: Thermodynamic model inputs and major reaction equations.

Author Contributions

Conceptualization, O.V.O. and A.N.B.; methodology, O.V.O., A.N.B. and H.Z.; software, O.V.O.; validation, O.V.O., A.N.B. and H.Z.; writing—original draft preparation, O.V.O. and A.N.B.; writing—review and editing, O.V.O. and H.Z. All authors have read and agreed to the published version of the manuscript.

Funding

This research received no external funding.

Conflicts of Interest

The authors declare no conflict of interest.

References

  1. Cascella, M.; Rajnik, M.; Cuomo, A.; Dulebohn, S.C.; Di Napoli, R. Features, evaluation and treatment coronavirus (COVID-19). In Statpearls [Internet]; StatPearls Publishing: Treasure Island, FL, USA, 2020. [Google Scholar]
  2. Rothan, H.A.; Byrareddy, S.N. The epidemiology and pathogenesis of coronavirus disease (COVID-19) outbreak. J. Autoimmun. 2020, 109, 102433. [Google Scholar]
  3. Allison, A.L.; Ambrose-Dempster, E.; Aparsi, T.D.; Bawn, M.; Arredondo, M.C.; Chau, C.; Chandler, K.; Dobrijevic, D.; Hailes, H.C.; Lettieri, P.; et al. The environmental dangers of employing single-use face masks as part of a COVID-19 exit strategy. UCL Open Environ. Prepr. 2020. [Google Scholar] [CrossRef]
  4. European Centre for Disease Prevention and Control. COVID-19 Situation Update Worldwide, as of 19 June 2020. Available online: https://www.ecdc.europa.eu/en/geographical-distribution-2019-ncov-cases (accessed on 19 June 2020).
  5. Filligent (HK) Limited. N95-FDA; Center for Devices and Radiological Health: Hong Kong, China, 2013. Available online: https://www.accessdata.fda.gov/cdrh_docs/pdf12/K122702.pdf (accessed on 16 May 2020).
  6. Thomasnet. How to Make N95 Masks. 2020. Available online: https://www.thomasnet.com/articles/plant-facility-equipment/how-to-make-n95-masks/ (accessed on 18 June 2020).
  7. Klemeš, J.J.; Van Fan, Y.; Tan, R.R.; Jiang, P. Minimising the present and future plastic waste, energy and environmental footprints related to COVID-19. Renew. Sustain. Energy Rev. 2020, 127, 109883. [Google Scholar] [CrossRef]
  8. Ennomotive. 6 Types of Masks and their Effectiveness against COVID-19. 2020. Available online: https://www.ennomotive.com/types-of-masks-covid-19/ (accessed on 16 May 2020).
  9. Huang, J. Polymer waste management -biodegradation, incineration, and recycling. J. Macromol. Sci. 1995, 32, 593–597. [Google Scholar] [CrossRef]
  10. Hamad, K.; Kaseem, M.; Deri, F. Recycling of waste from polymer materials: An overview of the recent works. Polym. Degard. Stabil. 2013, 98, 2801–2812. [Google Scholar] [CrossRef]
  11. Verma, R.; Vinoda, K.S.; Papireddy, M.; Gowda, A.N.S. Toxic Pollutants from Plastic Waste—A Review. Procedia Environ. Sci. 2016, 35, 701–708. [Google Scholar] [CrossRef]
  12. Burra, K.G.; Gupta, A.K. Synergistic effects insteam gasification of combined biomass and plastic waste mixtures. Appl. Energy 2018, 211, 230–236. [Google Scholar] [CrossRef]
  13. Okoro, O.V.; Sun, Z.; Birch, J. Meat processing waste as a potential feedstock for biochemicals and biofuels —A review of possible conversion technologies. J. Clean. Prod. 2017, 142, 1583–1608. [Google Scholar] [CrossRef]
  14. Sun, X.; Atiyeh, H.K.; Huhnke, R.L.; Tanner, R.S. Syngas fermentation process development for production of biofuels and chemicals: A review. Bioresour. Technol. Rep. 2019, 7, 100279. [Google Scholar] [CrossRef]
  15. Filligent. FDA Government. 2012. Available online: https://www.accessdata.fda.gov/cdrh_docs/pdf19/K192105.pdf (accessed on 12 June 2020).
  16. Okoro, O.V.; Sun, Z.; Birch, J. Catalyst-Free Biodiesel Production Methods: A Comparative Technical and Environmental Evaluation. Sustainability 2018, 10, 127. [Google Scholar] [CrossRef] [Green Version]
  17. Bousquet, J. Thermal Data for natural and synthetic fuels by siddhartha gaur (VSLR Sciences -Dallas, TX) and Thomas B. REED (Colorado School of Mines-Golden, CO)Marcel DEKKER, 1988, 258 pages., Price 167, 71 euros. Can. J. Chem. Eng. 2005, 83, 389. [Google Scholar] [CrossRef]
  18. Li, D.-T.; Li, W.; Li, B.-Q. CO-Carbonization of Coking-Coal with Different Waste Plastics. J. Fuel Chem. Technol. 2001, 29, 19–23. [Google Scholar]
  19. Nakayama, T.; Sagara, H.; Arai, K.; Saito, S. High pressure liquid-liquid equilibria for the system of water, ethanol and 1,1-difluoroethane at 323.2 K. Fluid Phase Equilibria 1987, 38, 109–127. [Google Scholar] [CrossRef]
  20. Geanã, D.; Feroiu, V. Prediction of Vapor−Liquid Equilibria at Low and High Pressures from UNIFAC Activity Coefficients at Infinite Dilution. Ind. Eng. Chem. Res. 1998, 37, 1173–1180. [Google Scholar] [CrossRef]
  21. Totsch, W.; Gaensslen, H. Polyvinylchloride: Environmental Aspects of a Common Plastic; Elsevier: London, UK, 2012. [Google Scholar]
  22. Bhaskar, T.; Balagurumurthy, B.; Singh, R.; Poddar, M.K. Chapter 12—Thermochemical Route for Biohydrogen Production. In Biohydrogen; Pandey, A., Chang, J.-S., Hallenbecka, P.C., Larroche, C., Eds.; Elsevier: Amsterdam, The Netherlands, 2013; pp. 285–316. [Google Scholar] [CrossRef]
  23. Gagliano, A.; Nocera, F.; Bruno, M.; Cardillo, G. Development of an equilibrium-based model of gasification of biomass by Aspen Plus. Energy Procedia 2017, 111, 1010–1019. [Google Scholar] [CrossRef]
  24. Kaewluan, S.; Pipatmanomai, S. Potential of synthesis gas production from rubber wood chip gasification in a bubbling fluidised bed gasifier. Energy Convers. Manag. 2011, 52, 75–84. [Google Scholar] [CrossRef]
  25. Okoro, O.V.; Faloye, F.D. Comparative Assessment of Thermo-Syngas Fermentative and Liquefaction Technologies as Waste Plastics Repurposing Strategies. AgriEngineering 2020, 2, 378–392. [Google Scholar] [CrossRef]
  26. Chen, W.-T.; Jin, K.; Linda Wang, N.-H. Use of Supercritical Water for the Liquefaction of Polypropylene into Oil. ACS Sustain. Chem. Eng. 2019, 7, 3749–3758. [Google Scholar] [CrossRef]
  27. Möller, M.; Harnisch, F.; Schröder, U. Hydrothermal liquefaction of cellulose in subcritical water—The role of crystallinity on the cellulose reactivity. RSC Adv. 2013, 3, 11035–11044. [Google Scholar] [CrossRef]
  28. Valdez, P.J.; Tocco, V.J.; Savage, P.E. A general kinetic model for the hydrothermal liquefaction of microalgae. Bioresour. Technol. 2014, 163, 123–127. [Google Scholar] [CrossRef]
  29. Jones, S.; Zhu, Y.; Anderson, D.; Hallen, R.; Elliot, D.; Schmidt, A.; Albrecht, K.; Hart, T.; Butcher, M.; Drennan, C.; et al. Process Design and Economics for the Conversion of Algal Biomass to Hydrocarbons: Whole Algae Hydrothermal Liquefaction and Upgrading; Pacific Northwest National Laboratory: Springfield, MI, USA, 2014.
  30. Vardon, D.R.; Sharma, B.K.; Scott, J.; Yu, G.; Wang, Z.; Schideman, L.; Zhang, Y.; Strathmann, T.J. Chemical properties of biocrude oil from the hydrothermal liquefaction of Spirulina algae, swine manure, and digested anaerobic sludge. Bioresour. Technol. 2011, 102, 8295–8303. [Google Scholar] [CrossRef]
  31. Ukpong, M.N.; Atiyeh, H.K.; De Lorme, M.J.; Liu, K.; Zhu, X.; Tanner, R.S.; Wilkins, M.R.; Stevenson, B.S. Physiological response of Clostridium carboxidivorans during conversion of synthesis gas to solvents in a gas-fed bioreactor. Biotechnol. Bioeng. 2012, 109, 2720–2728. [Google Scholar] [CrossRef] [PubMed]
  32. Tanner, R.S.; Miller, L.M.; Yang, D. Clostridium ljungdahlii sp. nov., an acetogenic species in clostridial rRNA homology group I. Int. J. Syst. Evol. Microbiol. 1993, 43, 232–236. [Google Scholar] [CrossRef] [PubMed] [Green Version]
  33. Phillips, J.R.; Klasson, K.T.; Clausen, E.C.; Gaddy, J.L. Biological production of ethanol from coal synthesis gas. Appl. Biochem. Biotechnol. 1993, 39, 559–571. [Google Scholar] [CrossRef]
  34. Amigun, B.; Petrie, D.; Görgens, J. Feedstock and Technology Options for Bioethanol Production in South Africa: Technoeconomic Prefeasibility Study. Energy Fuels 2012, 26, 5887–5896. [Google Scholar] [CrossRef]
  35. Engineering ToolBox. Fuels—Higher and Lower Calorific Values. 2003. Available online: https://www.engineeringtoolbox.com/fuels-higher-calorific-values-d_169.html (accessed on 10 June 2020).
  36. Kemp, I.C. Pinch Analysis and Process Integration: A User Guide on Process Integration for the Efficient Use of Energy; Elsevier: Amsterdam, The Netherlands, 2011. [Google Scholar]
  37. Mupondwa, E.; Li, X.; Tabil, L.; Falk, K.; Gugel, R. Technoeconomic analysis of camelina oil extraction as feedstock for biojet fuel in the Canadian Prairies. Biomass Bioenergy 2016, 95, 221–234. [Google Scholar] [CrossRef]
  38. Násner, A.M.L.; Lora, E.E.S.; Palacio, J.C.E.; Rocha, M.H.; Restrepo, J.C.; Venturini, O.J.; Ratner, A. Refuse Derived Fuel (RDF) production and gasification in a pilot plant integrated with an Otto cycle ICE through Aspen plus™ modelling: Thermodynamic and economic viability. Waste Manag. 2017, 69, 187–201. [Google Scholar] [CrossRef]
  39. Arjunan, K. IRR Performs Better than NPV: A Critical Analysis of Cases of Multiple IRR and Mutually Exclusive and Independent Investments. SSRN Electron. J. 2017. [Google Scholar] [CrossRef]
  40. Environment. The Potential of Recycled Plastics; Plastics Industry Association: Washington, DC, USA, 2020. [Google Scholar]
  41. ETSAP. Combined Heat and Power. Energy Technology Network: Energy Technology Systems Analysis Programme. 2010. Available online: https://iea-etsap.org/E-TechDS/PDF/E04-CHP-GS-gct_ADfinal.pdf (accessed on 7 March 2020).
  42. Dutta, A.; Talmadge, M.; Hensley, J.; Worley, M.; Dudgeon, D.; Barton, D.; Groendijk, P.; Ferrari, D.; Stears, B.; Searcy, E.M. Process Design and Economics for Conversion of Lignocellulosic Biomass to Ethanol: Thermochemical Pathway by Indirect Gasification and Mixed Alcohol Synthesis; National Renewable Energy Lab. (NREL): Golden, CO, USA, 2011.
  43. Rickman, W.S. Handbook of Incineration of Hazardous Wastes (1991); CRC Press: Boca Raton, FL, USA, 2017. [Google Scholar]
  44. Alibaba. Plastic Machinery Hdpe Polycarbonate. 2020. Available online: https://www.alibaba.com/product-detail/Plastic-Machinery-hdpe-polycarbonate-7-5_62538362812.html?spm=a2700.galleryofferlist.0.0.48fd258aHoj76o (accessed on 20 February 2020).
  45. Towler, G.; Sinnott, R. Chemical Engineering Design: Principles, Practice and Economics of Plant and Process Design; Elsevier: Amsterdam, The Netherlands, 2008. [Google Scholar]
  46. Okoro, V.O.; Sun, Z. Desulphurisation of Biogas: A Systematic Qualitative and Economic-Based Quantitative Review of Alternative Strategies. ChemEngineering 2019, 3, 76. [Google Scholar] [CrossRef] [Green Version]
  47. Chemengonline. 2019 Chemical Engineering Plant Cost Index Annual Average. 2020. Available online: https://www.chemengonline.com/2019-chemical-engineering-plant-cost-index-annual-average/ (accessed on 2 July 2020).
  48. Magnehi. Chemical Engineering Plant Cost Index (Averaged Over Year). 2011. Available online: http://folk.ntnu.no/magnehi/cepci_2011_py.pdf (accessed on 2 July 2020).
  49. Moncada, J.; Tamayo, J.A.; Cardona, C.A. Integrating first, second, and third generation biorefineries: Incorporating microalgae into the sugarcane biorefinery. Chem. Eng. Sci. 2014, 118, 126–140. [Google Scholar] [CrossRef]
  50. Rincón, L.E.; Jaramillo, J.J.; Cardona, C.A. Comparison of feedstocks and technologies for biodiesel production: An environmental and techno-economic evaluation. Renew. Energy 2014, 69, 479–487. [Google Scholar] [CrossRef]
  51. Young, D.M.; Cabezas, H. Designing sustainable processes with simulation: The waste reduction (WAR) algorithm. Comput. Chem. Eng. 1999, 23, 1477–1491. [Google Scholar] [CrossRef]
  52. Gangadharan, P.; Kanchi, K.C.; Lou, H.H. Evaluation of the economic and environmental impact of combining dry reforming. Chem. Eng. Res. Des. 2012. [Google Scholar] [CrossRef]
  53. Mustafa, A.; Calay, R.K.; Mustafa, M.Y. A techno-economic study of a biomass gasification plant for the production of transport biofuel for small communities. Energy Procedia 2017, 112, 529–536. [Google Scholar] [CrossRef]
  54. Rutberg, P.G.; Kuznetsov, V.A.; Serba, E.O.; Popov, S.D.; Surov, A.V.; Nakonechny, G.V.; Nikonov, A.V. Novel three-phase steam–air plasma torch for gasification of high-caloric waste. Appl. Energy 2013, 108, 505–514. [Google Scholar] [CrossRef]
  55. Lee, J.W.; Yu, T.U.; Lee, J.W.; Moon, J.H.; Jeong, H.J.; Park, S.S.; Yang, W.; Lee, U.D. Gasification of mixed plastic wastes in a moving-grate gasifier and application of the producer gas to a power generation engine. Energy Fuels 2013, 27, 2092–2098. [Google Scholar] [CrossRef]
  56. Saebea, D.; Ruengrit, P.; Arpornwichanop, A.; Patcharavorachot, Y. Gasification of plastic waste for synthesis gas production. Energy Rep. 2020, 6, 202–207. [Google Scholar] [CrossRef]
  57. Kunwar, B.; Chandrasekaran, S.R.; Moser, B.R.; Deluhery, J.; Kim, P.; Rajagopalan, N.; Sharma, B.K. Catalytic Thermal Cracking of Postconsumer Waste Plastics to Fuels. 2. Pilot-Scale Thermochemical Conversion. Energy Fuels 2017, 31, 2705–2715. [Google Scholar] [CrossRef]
  58. Rajagopalan, S.; Datar, R.P.; Lewis, R.S. Formation of ethanol from carbon monoxide via a new microbial catalyst. Biomass Bioenergy 2002, 23, 487–493. [Google Scholar] [CrossRef]
  59. Shen, Y.; Brown, R.; Wen, Z. Enhancing mass transfer and ethanol production in syngas fermentation of Clostridium carboxidivorans P7 through a monolithic biofilm reactor. Appl. Energy 2014, 136, 68–76. [Google Scholar] [CrossRef]
  60. Akhtar, J.; Amin, N.A.S. A review on process conditions for optimum bio-oil yield in hydrothermal liquefaction of biomass. Renew. Sustain. Energy Rev. 2011, 15, 1615–1624. [Google Scholar] [CrossRef]
  61. Midgett, J.S. Assessing a Hydrothermal Liquefaction Process Using Biomass Feedstocks. Master’s Thesis, Louisiana State University, Baton Rouge, LA, USA, 2008. [Google Scholar]
  62. Remón, J.; Randall, J.; Budarin, V.L.; Clark, J.H. Production of bio-fuels and chemicals by microwave-assisted, catalytic, hydrothermal liquefaction (MAC-HTL) of a mixture of pine and spruce biomass. Green Chem. 2019, 21, 284–299. [Google Scholar] [CrossRef]
  63. Manahan, S.E. Environmental Chemistry; CRC Press: New York, NY, USA, 2017. [Google Scholar]
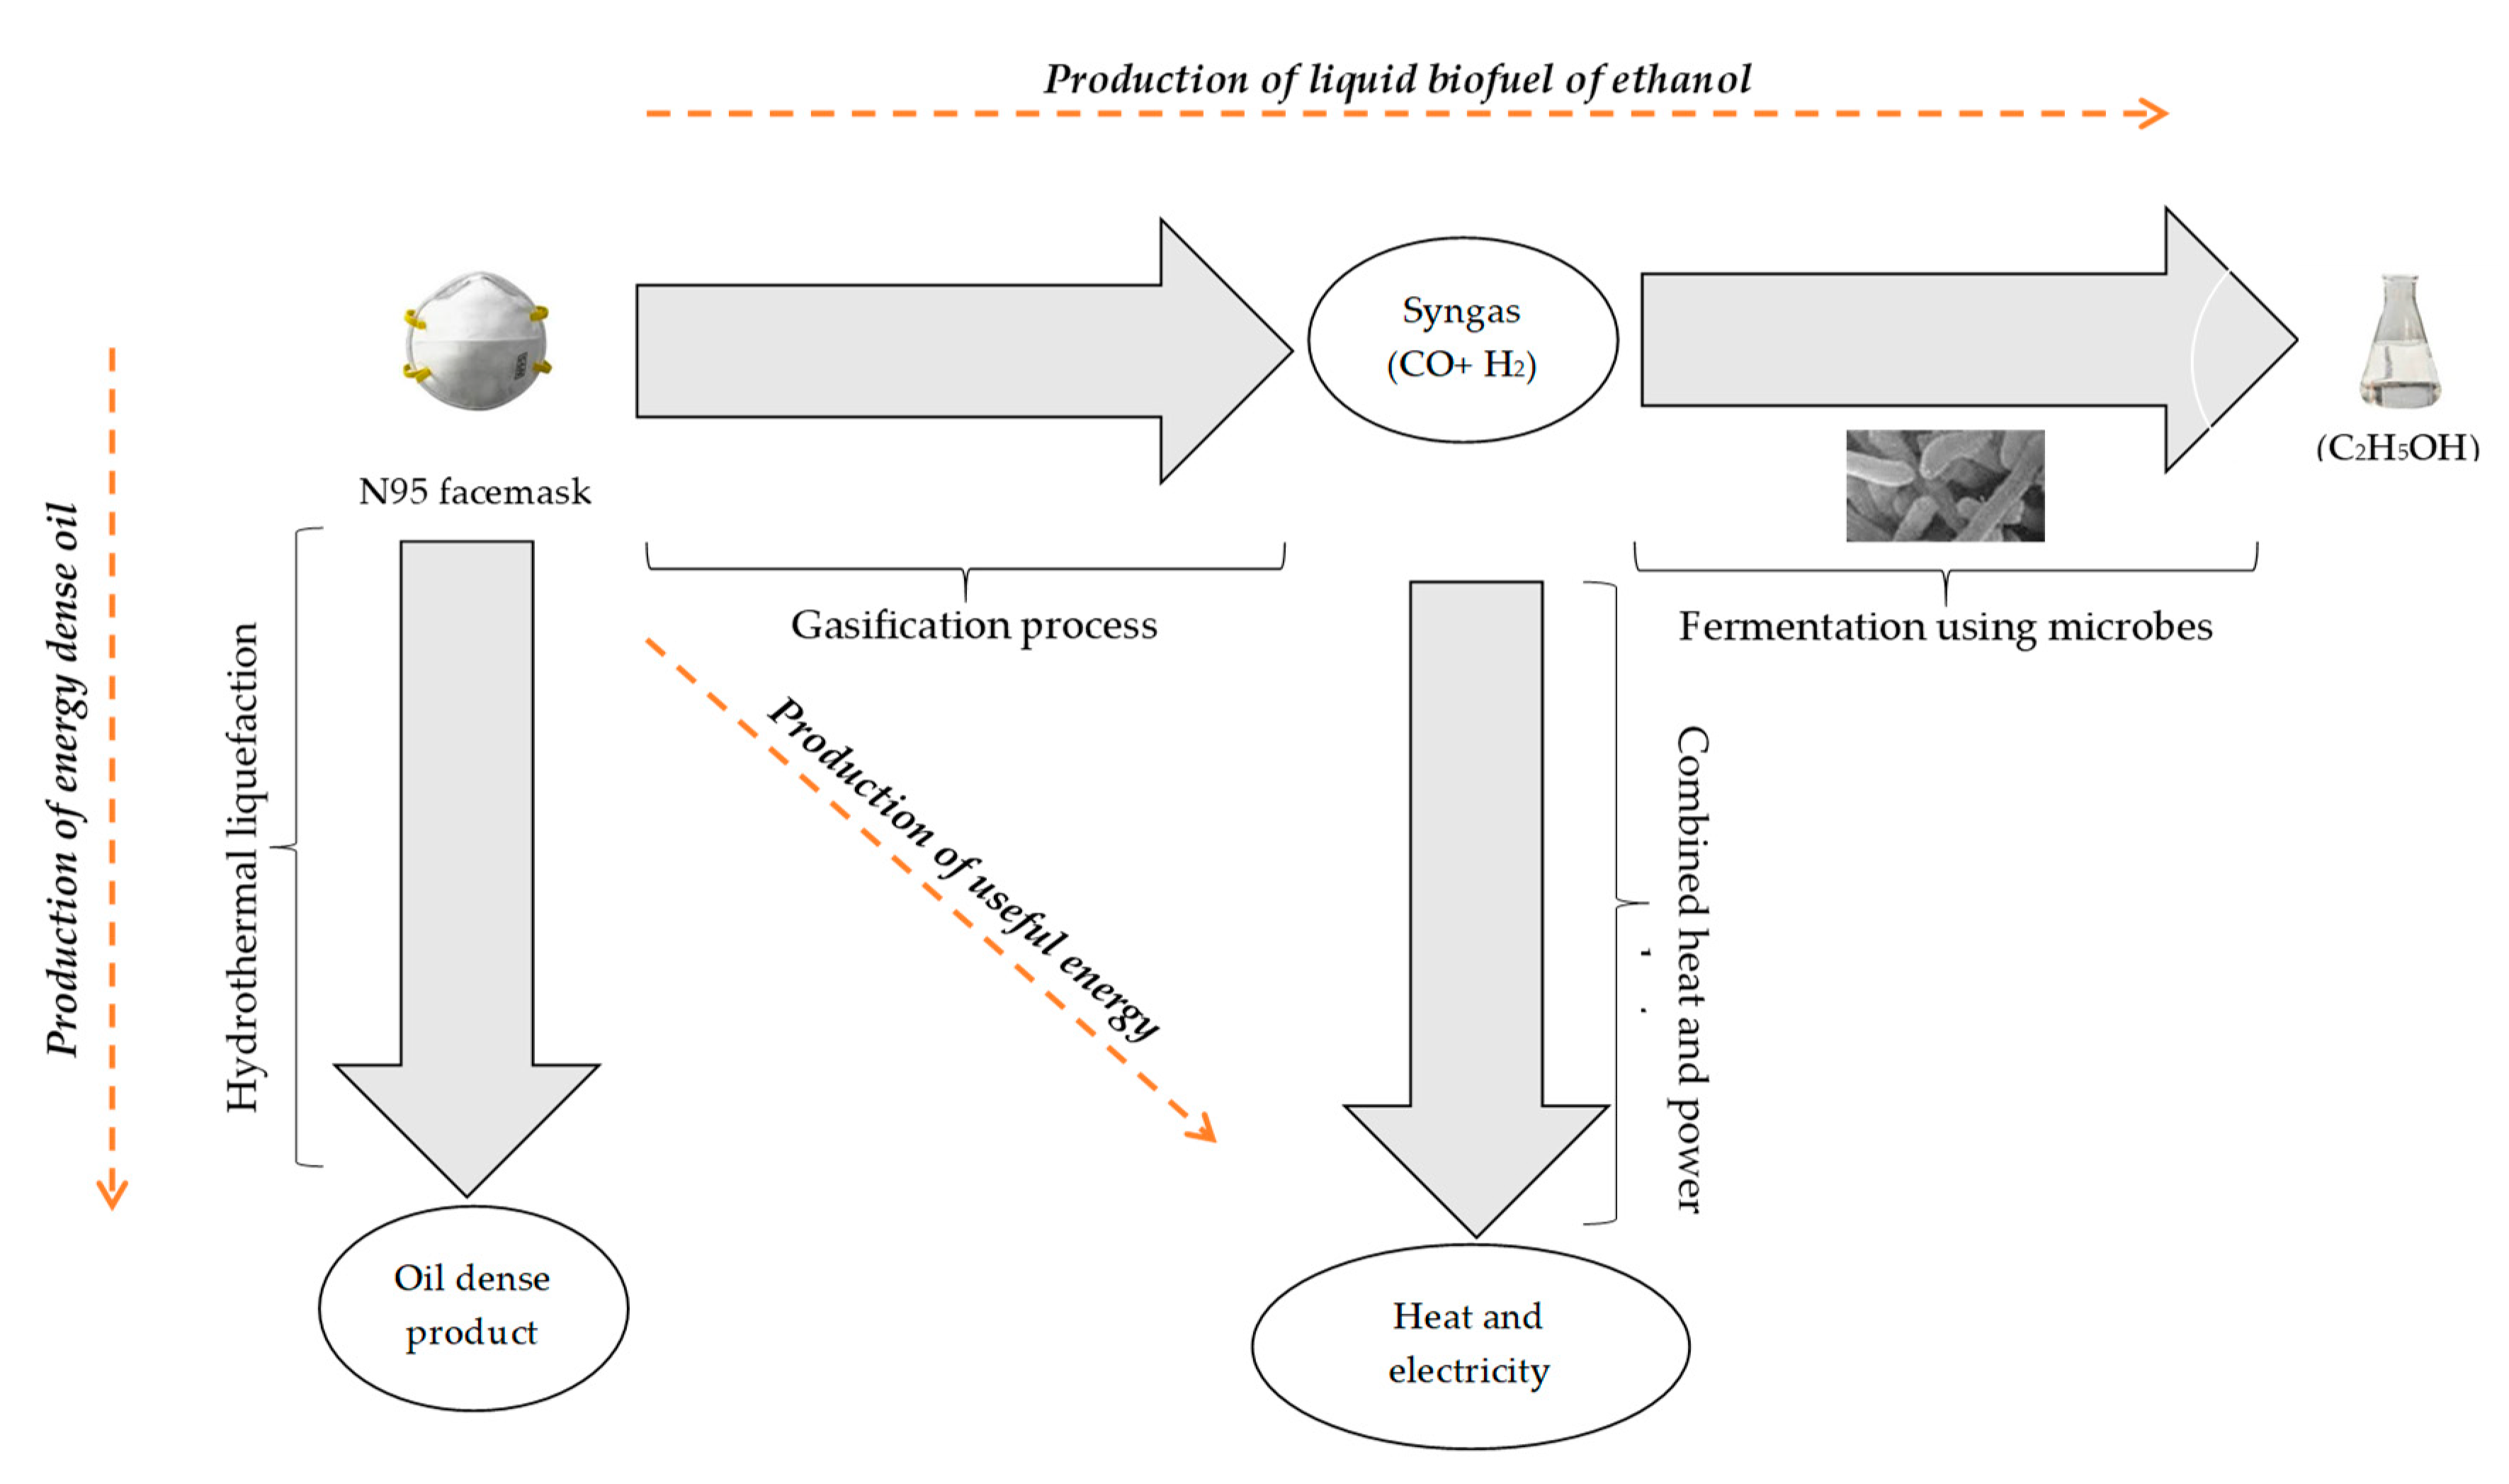
Figure 1. Pathways for value extraction from waste N95 facemask.
Chemengineering 04 00054 g001
Figure 2. Waste N95 facemask conversion to the heat energy and electrical power (scenario i).
Chemengineering 04 00054 g002
Figure 3. Waste N95 facemask conversion to an energy-dense (gasoline-like) oil product (scenario ii).
Chemengineering 04 00054 g003
Figure 4. Waste N95 facemask conversion to ethanol via syngas fermentation (scenario iii).
Chemengineering 04 00054 g004
Figure 5. Utility requirements for the processes considered in the present study without heat integration (a) and with heat integration (b).
Chemengineering 04 00054 g005
Figure 6. The comparative assessment of the potential environmental impacts of hydrothermal liquefaction (HTL) of waste N95 facemask, gasification–fermentation of waste N95 facemask and steam and energy generation from waste N95 facemask production processes. HTPI denotes the ingestion impact category, HTPE denotes inhalation/dermal impact category, TTP denotes terrestrial toxicity impact category, ATP denotes aquatic toxicity impact category, GWP denotes global warming potential impact category, ODP denotes ozone depletion potential impact category, AP denotes acidification potential impact category, and PCOP denotes photochemical oxidation potential impact category.
Chemengineering 04 00054 g006
Table 1. Composition of representative waste N95 facemask (75 wt% of polypropylene) employed in the present study [17,18].
Proximate AnalysisUltimate Analysis
Waste N95 Facemask Ash a
(wt%)
Volatiles a
(wt%)
FC a
(wt%)
Carbon b
(wt%)
Hydrogen b
(wt%)
Oxygen b
(wt%)
Nitrogen b
(wt%)
Sulphur b
(wt%)
(C3H6)n0.8299.18083.7513.982.2700
C6H10O500044.446.1749.3800
a Dry mass basis, bash free basis, FC denotes fixed carbon; b ash-free basis
Table 2. Impact categories in the waste reduction (WAR) algorithm [16,52].
General Impact CategoryImpact CategoryMeasure of Impact Category
Human toxicityIngestion (HTPI)LD50
Inhalation/dermal (HTPE)OSHA PEL
Ecological toxicityAquatic toxicity (ATP)Fathead Minnow LC50
Terrestrial toxicity (TTP)LD50
Global atmospheric impactsGlobal warming potential (GWP)GWP
Ozone depletion potential (ODP)ODP
Regional atmospheric impactsAcidification potential (AP)AP
Photochemical oxidation potential (PCOP)PCOP
Table 3. Mass balance results for major streams in the process for waste N95 facemask gasification for steam and power generation (scenario i).
Stream Property.Waste N95 Facemask Cellulose FractionPolypropylene FractionSyngas AshSteam
Temperature (°C)252525100025349.5
Pressure (atm)111111
Mass Fractions (x)
Water0.000.000.000.000.001.00
Polypropylene0.750.001.000.000.000.00
Hydrogen0.000.000.000.120.000.00
Carbon monoxide0.000.000.000.270.000.00
Carbon dioxide0.000.000.000.610.000.00
Ash0.000.000.000.001.000.00
Cellulose0.251.000.000.000.000.00
Mass Flows (kg/h)1770442.51327.55310.013.110000
Table 4. Mole composition of syngas from the gasification of waste N95 facemask and pure PP feedstock.
Molar Composition of SyngasThis StudyPure PP a Feed [56]
Hydrogen7167.25
Carbon monoxide1725.24
Carbon dioxide127.33
Methane00.18
a PP denotes polypropylene.
Table 5. Mass balance results for major streams in the process for N95 facemask waste liquefaction for energy-dense oil production (scenario ii).
Stream PropertyWaste N95 Facemask Cellulose FractionPolypropylene FractionHTL Product MixOil ProductGas Product
Temperature (°C)2525254252525
Pressure (atm)11122711
Mass Fractions (x)
Water0 Trace00
Polypropylene0.7501000
CO0000.20400.773
CO20000.00700.025
Ash0000.00700
C11H22000TraceTrace0
C12H240000.0040.0060
C8H180000.000Trace0
C9H200000.0140.0190
C10H220000.0360.0500
C11H240000.2330.3200
C12H260000.2880.400
C5H120000.0370.0510
C6H140000.0500.0680
C7H160000.0660.0910
CH40000.01300.048
C2H60000.00500.021
C3H80000.01200.046
C4H100000.02300.088
Cellulose0.2510000
HMF000Trace00
Mass Flows1770.0442.51327.52002.91460.7529.1
Table 6. Mass balance results for major streams in the process for waste N95 facemask syngas fermentation for ethanol production (scenario iii).
Stream PropertyWaste N95 FacemaskCellulose FractionPolypropylene FractionSyngasEthanolWaste Water
Temperature (°C)25252510002525
Pressure (atm)111111
Mass Fractions (x)
Water0.000.000.000.000.000.48
Polypropylene0.750.001.000.000.000.00
Ethanol000010.03
Hydrogen0.000.000.000.120.000.00
Carbon monoxide0.000.000.000.270.000.00
Carbon dioxide0.000.000.000.610.000.00
Acetic acid0.000.000.000.001.000.49
Cellulose0.251.000.000.000.000.00
Mass Flows (kg/h)1770442.51327.55310.01113.93187.5
Table 7. Outcome of the economic assessment.
Economic ParameterScenario iScenario iiScenario iii
Fixed capital investment (MU$)7.244.088.36
Working capital investment (MU$)0.360.200.42
Total capital investment (MU$)7.604.288.78
Fixed operating cost (MU$)1.761.491.85
Variable operating cost (MU$)10.231.2611.55
Total operating cost (MU$)11.992.7513.40
NPV (MU$)36.653.07−46.1
Negative net present value (NPV) indicates that the project is not feasible (MU$ denotes million U$ in the reference year of 2020).