1. Introduction
The realm of porous materials has quickly become the subject of much fascination and growth in the areas of noise reduction [
1,
2,
3,
4], heat transfer [
5,
6,
7], filtration [
8,
9], and aeration [
10], as well as light-weight structural components [
11]. Foamed and porous aluminum are specifically interesting for their exceptional advantages in low density and energy absorption, making them aptly relevant to the provided applications. However, an understanding of porous aluminum and porous aluminum composite’s corrosion behavior is essential to ensuring their integrity as mechanical elements in commercial products. In this work, a powder metallurgy-fabricated carbon network/aluminum matrix (C/Al) porous composite was examined for its resistance to corrosion. This was accomplished via a comparison of its pseudo exchange current density of corrosion (
icorr) to that of aluminum alloy 6061-T6 and 1235 in various environments. Dynamic polarization curves were generated from the kinetic interactions of these materials in solutions of seawater at 6% salinity and sulfuric acid at 0.2 N and 0.1 N. The resulting conclusions prove useful by corroborating the benefit of the inclusion of a carbon network within a porous aluminum structure via the manufacturing methods described in Reference [
12]. Aqueous corrosion is referred to as the degradation of a material via a reduction/oxidation reaction with the environment, attendant to the formation of cations, leading to the loss of engineering function [
13]. All testing and analysis were conducted under this description for corrosion in a wetted setting. Further, uniform corrosion is a thermodynamically driven process that can be determined spontaneous by the Gibb’s Free Energy relationship, in using a given metal’s standard electromotive force potential, which is related to the standard hydrogen electrode (SHE) [
13]. Uniform corrosion is a highly important type of chemical deterioration because it acts on the entirety of a metal’s exposed surface area. Its presence is expected in most corrosion systems, given the mechanical components exposure to an aqueous surrounding of which it is susceptible. The potential for other corrosion phenomena is dependent on the component’s interaction with other metals, potentials, temperature, and stresses [
13].
Electrochemical kinetics can be used to analyze the uniform corrosion of a specific system through kinetically polarizing a metal as both anode and cathode. This is known as cathodic/anodic or dynamic polarization and can be accomplished potentiostatically or galvanostatically. Potentiodynamic polarization testing requires an induced potential for the recording of current per unit area noted as exchange current densities. As opposed to the use of thermodynamics, which provides a probability for corrosion, kinetics offers the determination of a corrosion rate through the process described in ASTM G59 [
14]. Of the available parameters in mixed-potential theory, the output current densities are a fundamental aspect of the corrosion system’s degradation rate (
CR). This is because a larger
icorr, and pseudo
icorr, most often infers a larger
CR relative to other materials tested in the same environment. The pseudo
icorr of each metal/electrolyte corrosion cell provides a basic mode of contrast for suggesting a material’s vulnerability to uniform corrosion. By this method, the corrosion behavior and integrity of a product exposed to a given environment can be deduced [
13].
As with the various forms of corrosion, there are also different aqueous environments. As derived from the possible applications which could involve the C/Al composite, salinated and acidic surroundings can be considered extreme cases. These environment types are aggressive, by way of leading to early oxidation, which provides the benefit to understanding their effect on the porous material. Aluminum’s inability to produce a passive oxide layer in concentrated sulfuric and hydrochloric acid is significant for future studies of porous aluminum protection against corrosion [
13].
Salinated environments, such as seawater, can have a detrimental effect on the surface of a metal and is a specific problem for mechanical components at or near coastlines. The presence of salt in the corrosion system acts within the electrolyte to make more ions available for electron transfer. This increases the efficiency of the oxidation reaction on the exposed surface and leads to more rapid degradation [
13]. The incidence of chlorine can remove some metals’ passive layer, but an alumina coating is unaffected [
13]. The consequence of an acidic solution on the integrity of a metal is similar to a salinated one. However, when an acid is present in the environment, it expels excess hydronium (H
+) into the electrolyte. If no stronger oxidizing agent is present, then H
+ becomes the primary oxidizer. Thus, the added H
+ increases the oxidation rate by way of increasing the available oxidizer, meaning more surface metal can be oxidized within the same time period [
13]. These corrosion mechanisms are present in the electrochemical cells of this work’s experiment.
Of the common metals used as mechanical components, aluminum is particularly unique for its low density to strength ratio [
15]. Both its mechanical and chemical properties show its promise as an ideal porous metal. Aluminum, and its alloys, are generally resistant to chemical attack that would cause active corrosion in normal working environments. Exposure of aluminum to common corrosive environments causes instantaneous oxidization and the development of a passive oxide surface layer [
13]. Under specific conditions of pH and potential, Al will actively corrode. These values are given as a pH less than four or greater than seven and potentials above −1.75 V; refer to Al’s Pourbaix diagram in Reference [
16]. This occurrence is possible in the applications provided and therefore offers the grounds for additional corrosion prevention techniques. A common form of corrosion deterrence is coating the material surface with a nobler one [
13]. In the case of this work, the carbon network of the C/Al composite can be viewed as a coating on the Al matrix [
12].
Within the area of study of porous materials, the importance of pore size and shape cannot be understated. These materials can be designed to exhibit an assortment of characteristics that are significantly different from their bulk forms. This aspect of porous materials is outlined by their pore geometry, which may be modified to fit specific criteria [
17]. One of the processes used to manufacture reliable porous aluminum structures is described in Reference [
17]. It suggests the benefit of Lotus type pores, which are cylindrically shaped via a directionally controlled fabrication method. This increases the structural integrity in the pore axial direction relative to the common spherical type pore [
17]. The pore geometry of the C/Al composite is a matrix of nonhomogeneous and intermittently connected spherical pores with properties that fluctuate between specimens [
12]. Highly reproducible pore geometries are important to a material’s technology development because they offer design precision and can lead to accurately modeled representations of material degradation behavior.
2. Materials and Experimental Methods
The details for the powder metallurgical method that was used to produce the C/Al composite are detailed in Reference [
12]. Aluminum powders were used at a nominal size of 30 μm and granulated white C&H sugar was used as a spacer and sieved to less than 45 μm. A green compact was thereafter produced following the mixture of 10 g of sugar and aluminum powder, at a composition of Al: sugar = 1:0.5, under a pressure of 40 MPa [
12]. The resultant circular disk had a diameter of 25 mm, with a thickness of 4 mm, and retained these dimensions through the remainder of the procedure. Following the construction of the powder compact, it was placed in a quartz tube for sintering. The tube was moved to a furnace and heated at a rate of 5 °C/min until reaching 500 °C. The disk was then sintered at this temperature for 2 h before furnace cooling to ensured material stability. The subsequent composite morphology exhibited a porous structure of aluminum intermingled and impregnated by a carbon network [
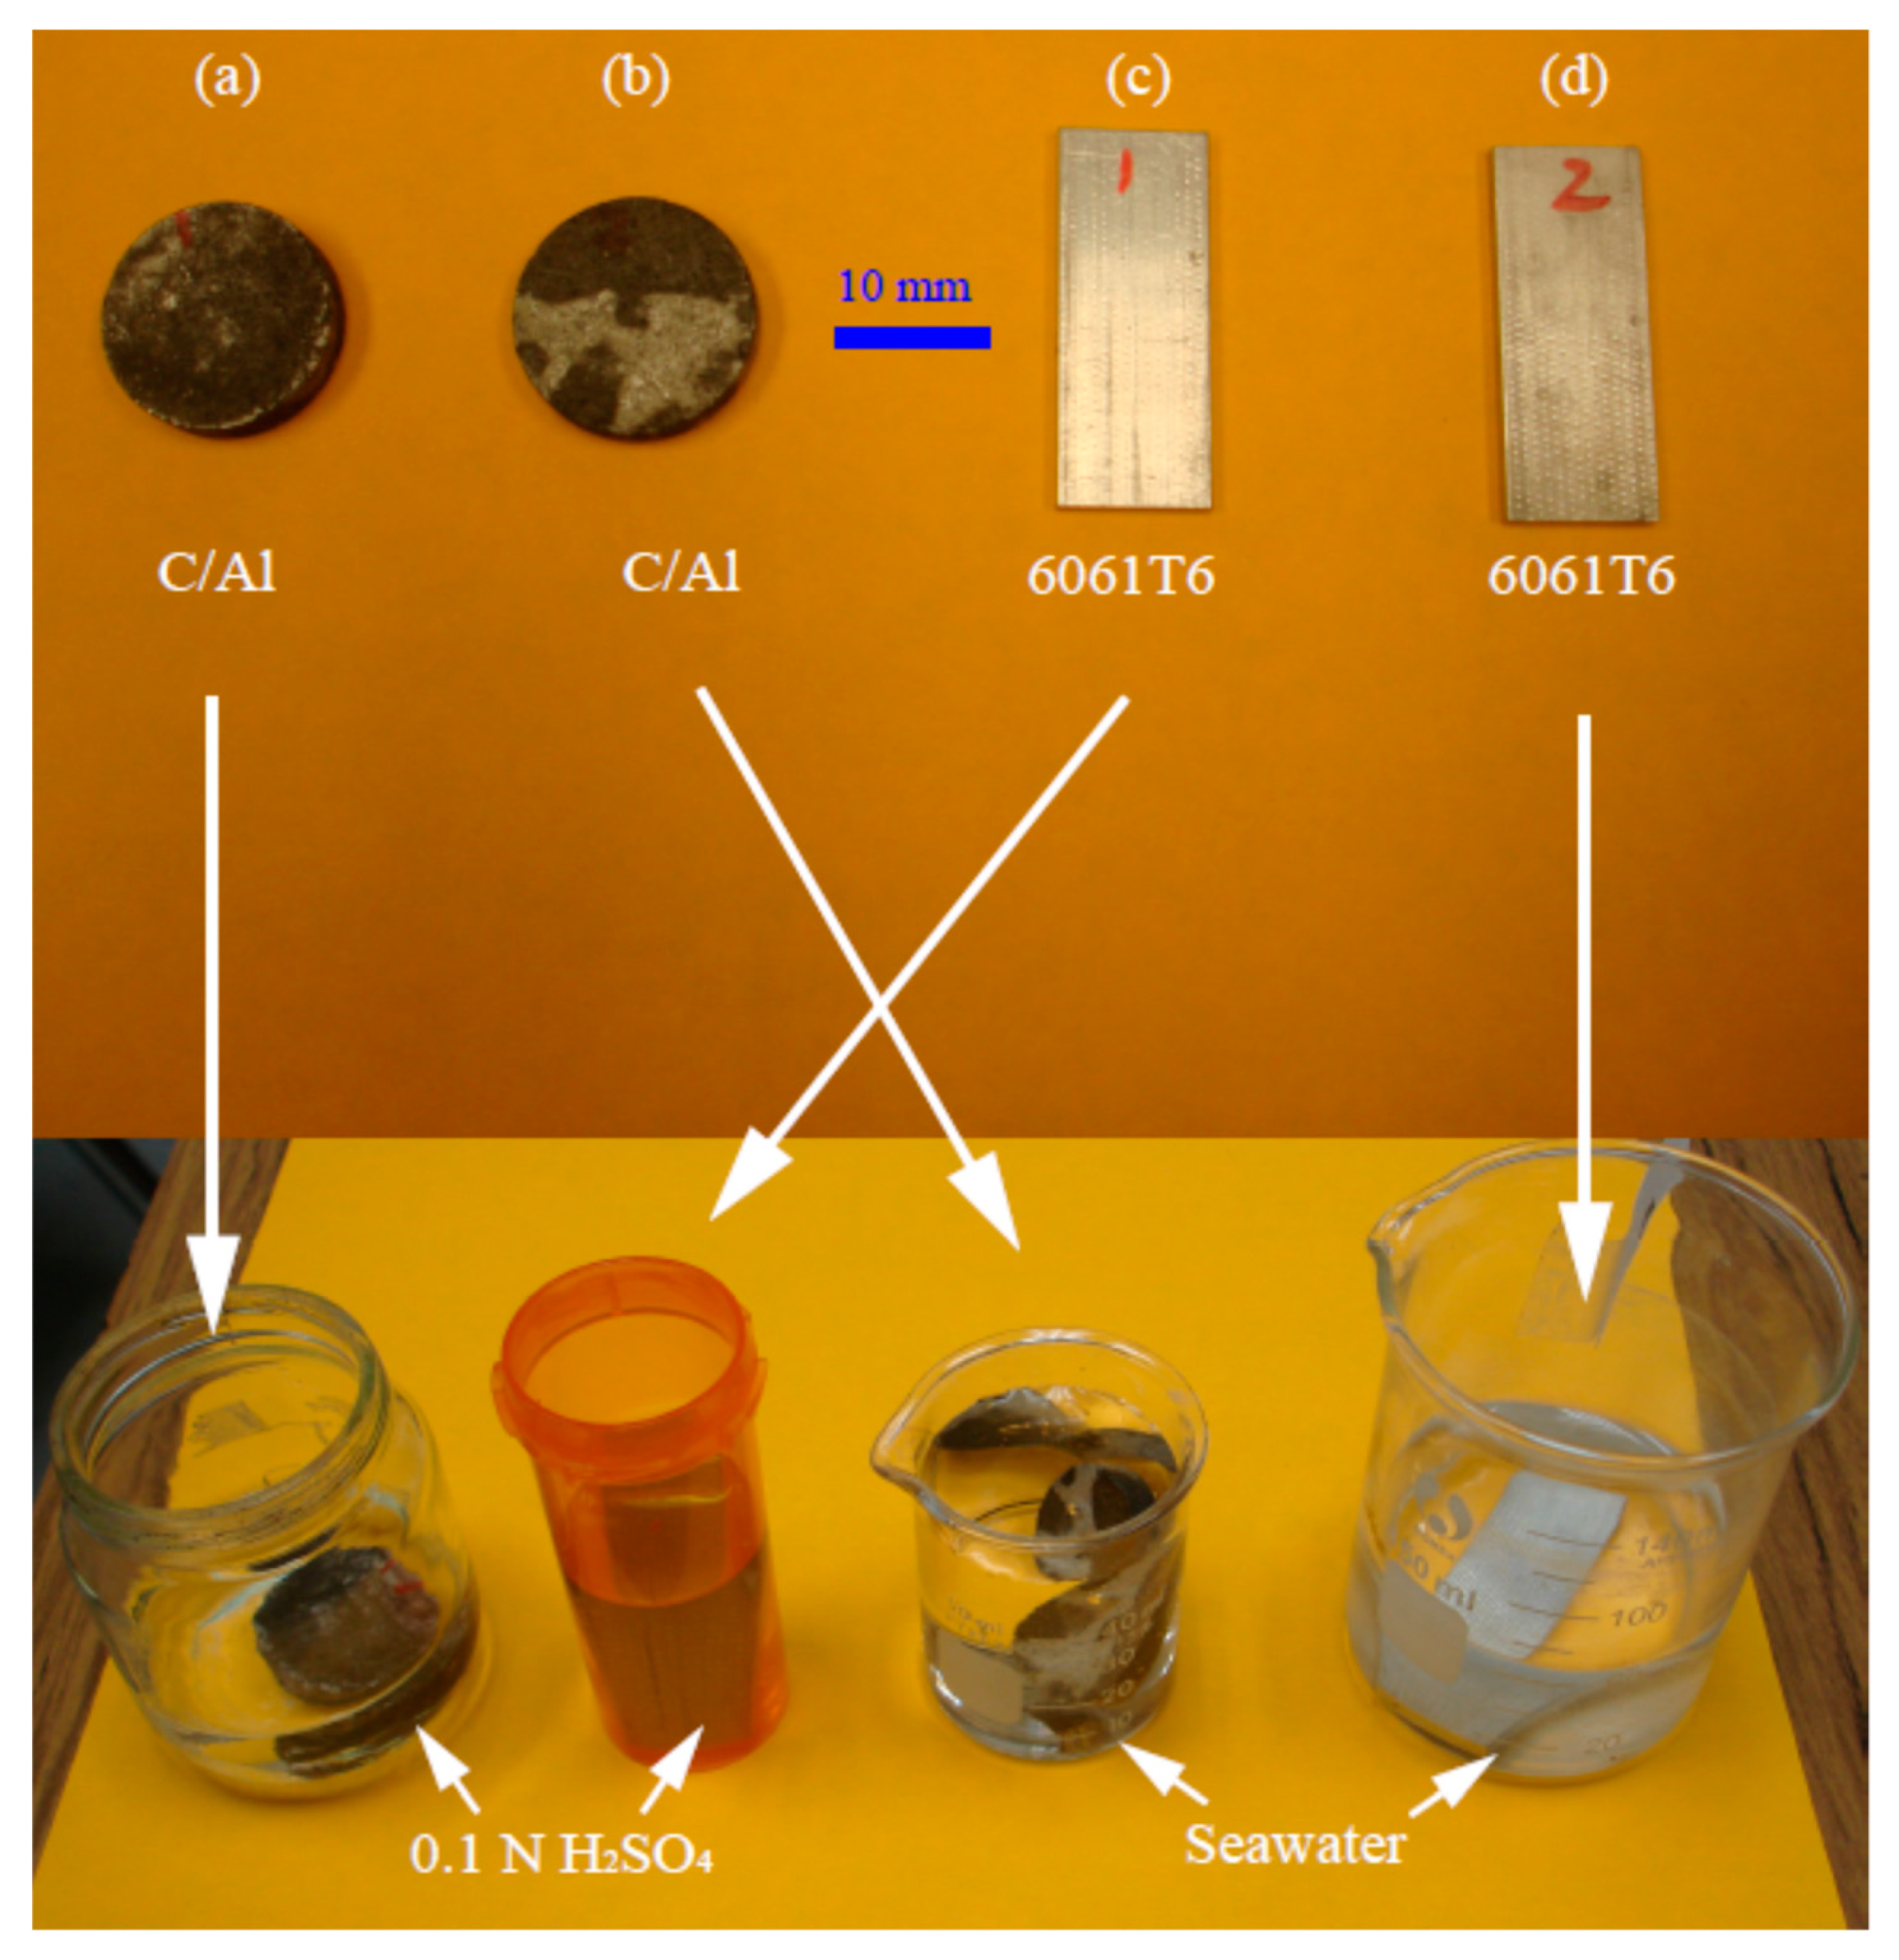
12]. During this work’s testing, the composite was submerged in solution to a depth of 10 mm, resulting in an active area of 7.45 cm
2.
Along with the cellular composite, the experiment also used two separate types of aluminum as modes of comparison. A sample of pure aluminum in the form of foil, aluminum 1235, was taken and submerged at a rectangular area of 1.50 cm
2 [
15]. Data was thereafter collected from a flat bar of aluminum 6061-T6 with a constituent composition of: 97.90 wt % Al, 1.00 wt % Mg, 0.60 wt % Si, 0.28 wt % Cu, and 0.20 wt % Cr. [
18]. The specimen was situated into each experimental solution at 18 mm, at 18 mm in width and 2 mm in thickness, leading to a total submerged area of 7.02 cm
2.
The environments used in this work include sulfuric acid at 0.2 N and 0.1 N, as well as seawater with 6% salt content. An initial solution of H
2SO
4, R-0736G containing only 5% at full concentration, was diluted about 0.15 times to create a concentration of 0.2 N. After experimentation, the same solution was again diluted by half with DI water to serve as the 0.1 N environment for the proceeding test. The seawater used here was gathered from Venice Beach, California, U.S. to stand as a representation of what the composite would encounter if implemented at or near a coastline. A salinity of 6% refers to the seawater from this location with 34 % salt. The chemical ion contributions of salt from greatest to least are as follows: Cl, Na, SO
42−, Mg, Ca, K, HCO
3−, Br
1−, BO
33−, Sr, and F
2. From this, the greatest ionic contributions to corrosion were Cl (19.35 ‰), Na (10.75 ‰), SO
42− (2.70 ‰), and Mg (1.30 ‰) [
19].
The potentiodynamic electrochemical test executed in this work only rudimentarily followed that of the standard test and reduction described in ASTM G59. The experimental setup is that of a simple cell, similar to that described in Reference [
13]. The working electrodes of the experiment were the C/Al composite, Al 1235, and Al 6061-T6 samples. An Ag/AgCl reference electrode acted in solution, as opposed to within a Luggin Capillary. This caused an increase in ohmic resistance within the system from around 2 mm, refer to Reference [
14], to 40 mm. A Pt counter electrode was used but was again positioned in the system at an improper distance from the specimen [
14]. These incorrect placements were the cause of unwarranted resistance, but were consistent throughout the experiment. The reference and counter electrodes were situated in a 3-hole Teflon cap clamped to the rod of a stamped steel support stand. The working electrode position was tuned on an adjustable clamp ring affixed to the same support stand as the Teflon cap. All electrodes were thereafter submerged into 100 mL of the testing solution. Alligator clips were used as the interface between each electrode and a CHI 440C Electro-Chemical Analyzer with serial #: A2977. Following a data collection procedure for an individual corrosion system, the solution was replaced, and all components cleaned with deionized (DI) water. Testing for each corrosion system was implemented four separate times to confirm data consistency.
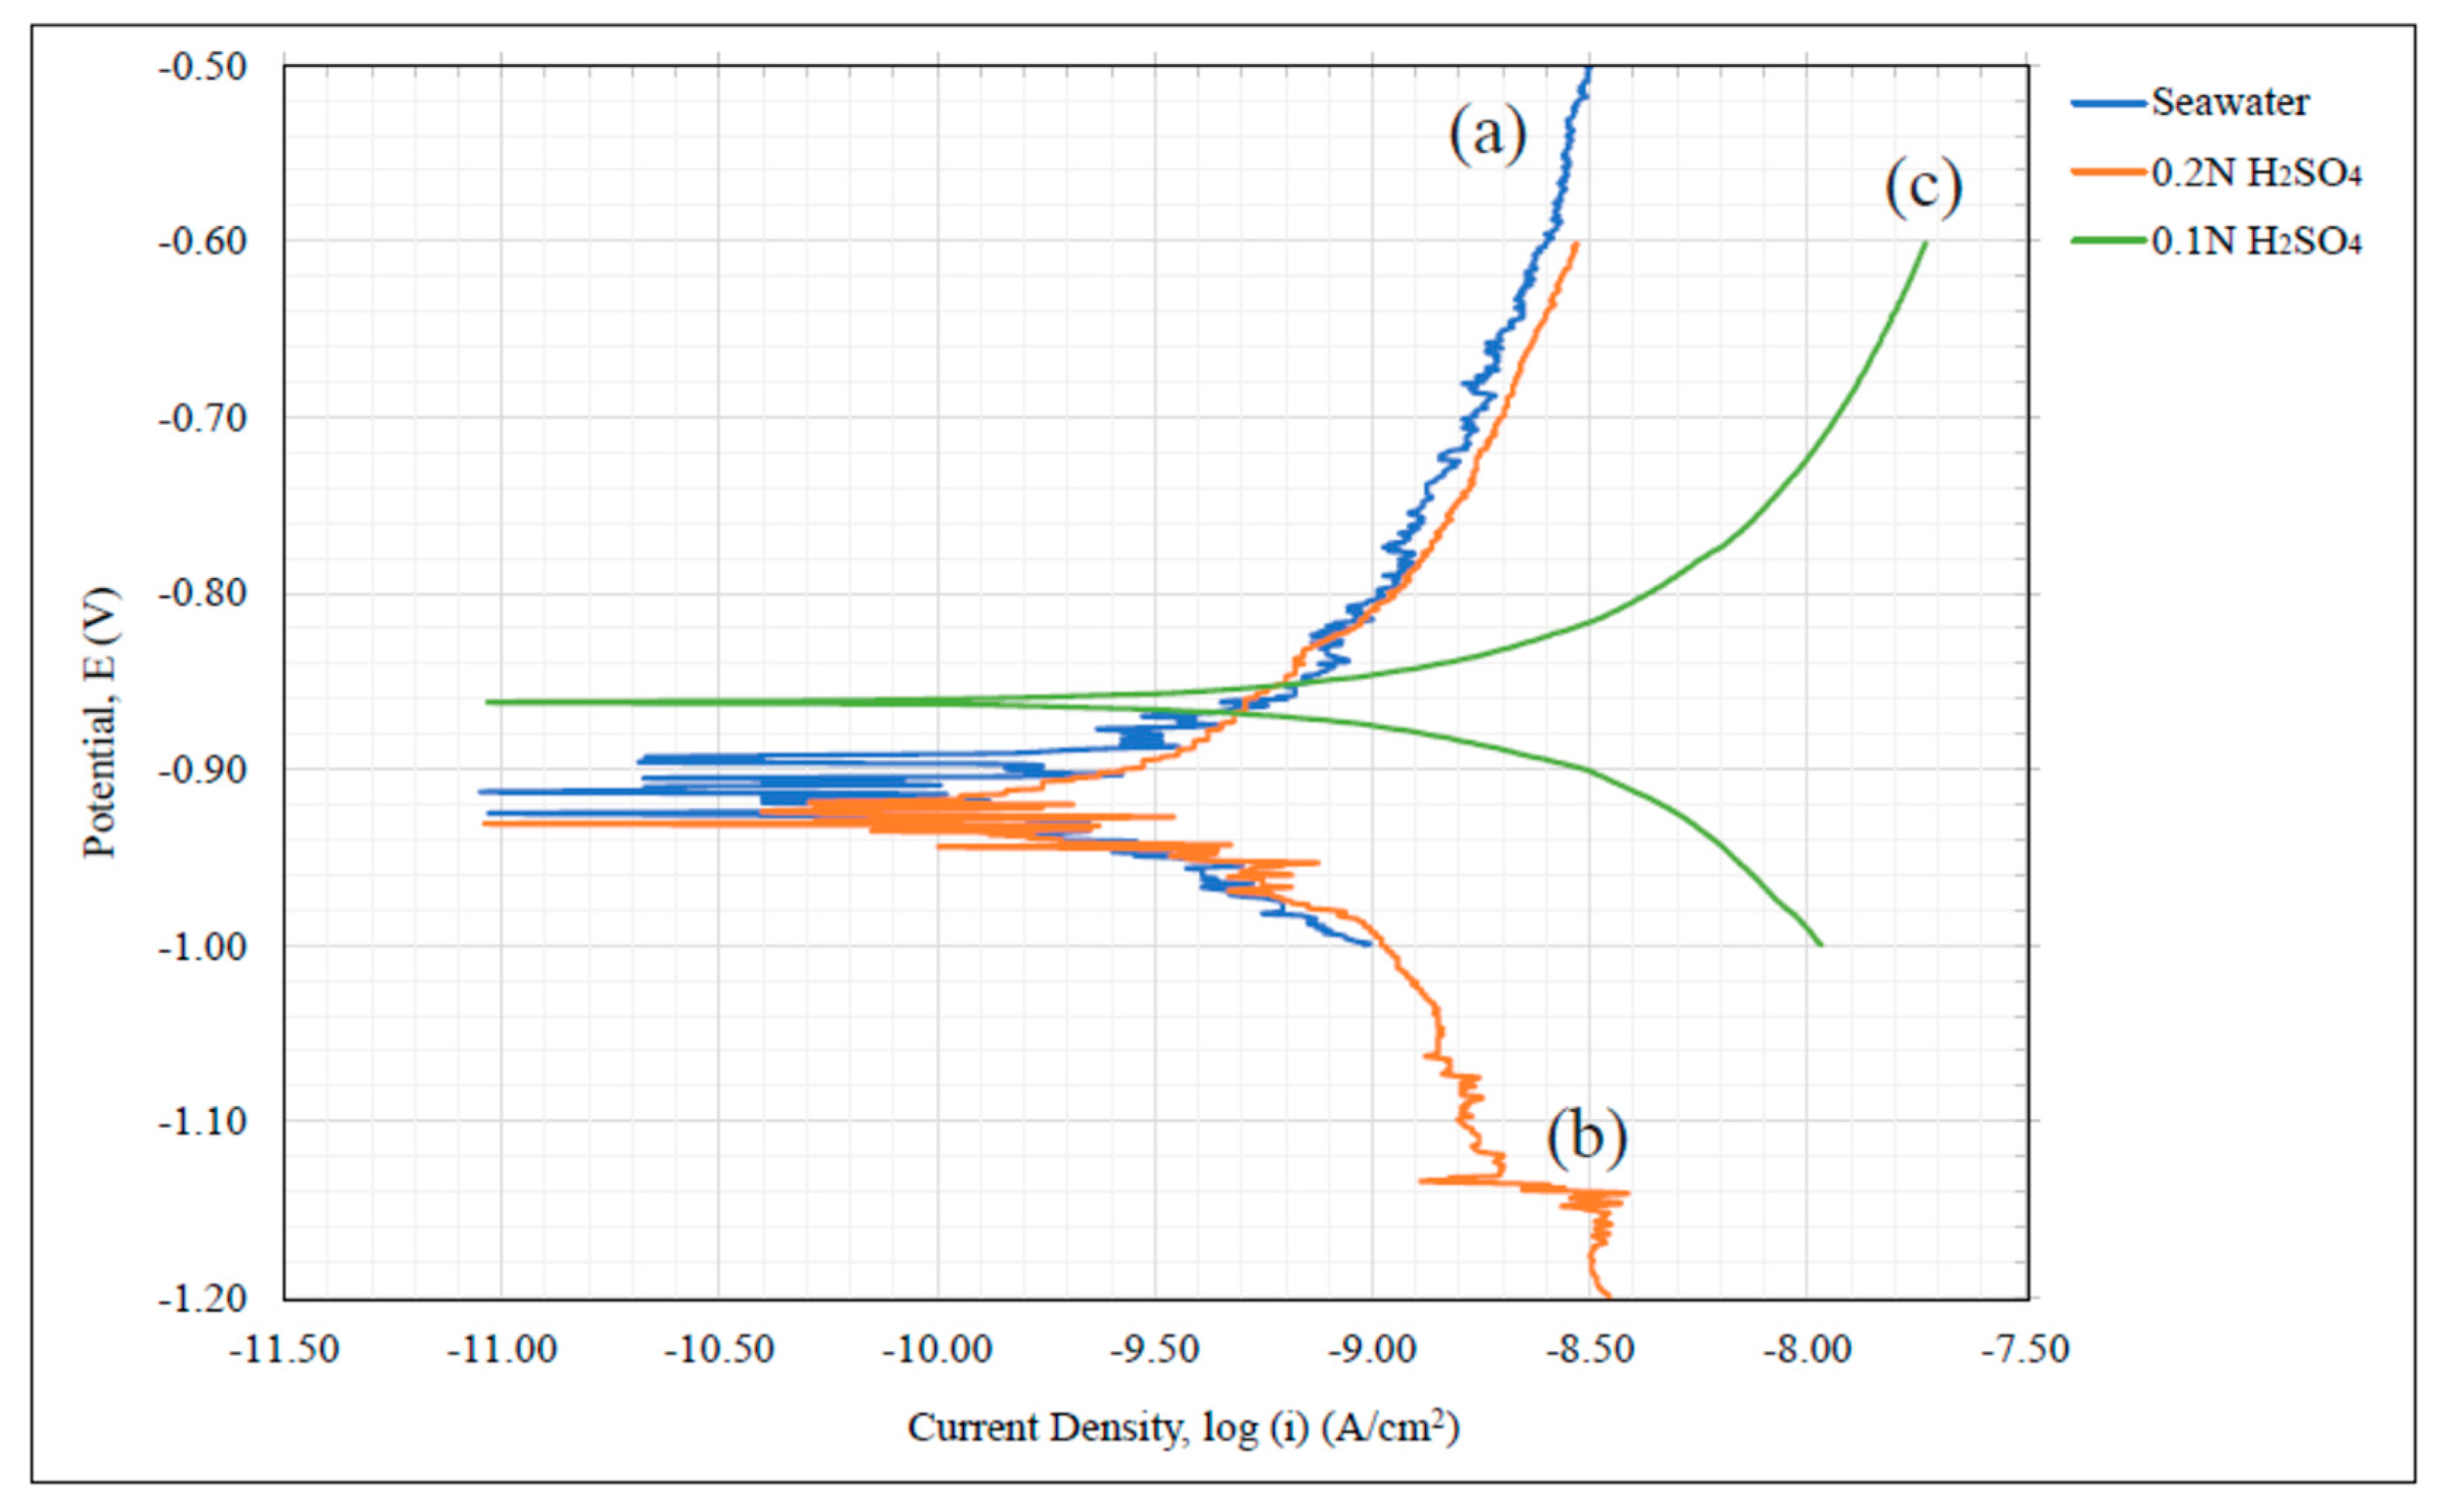
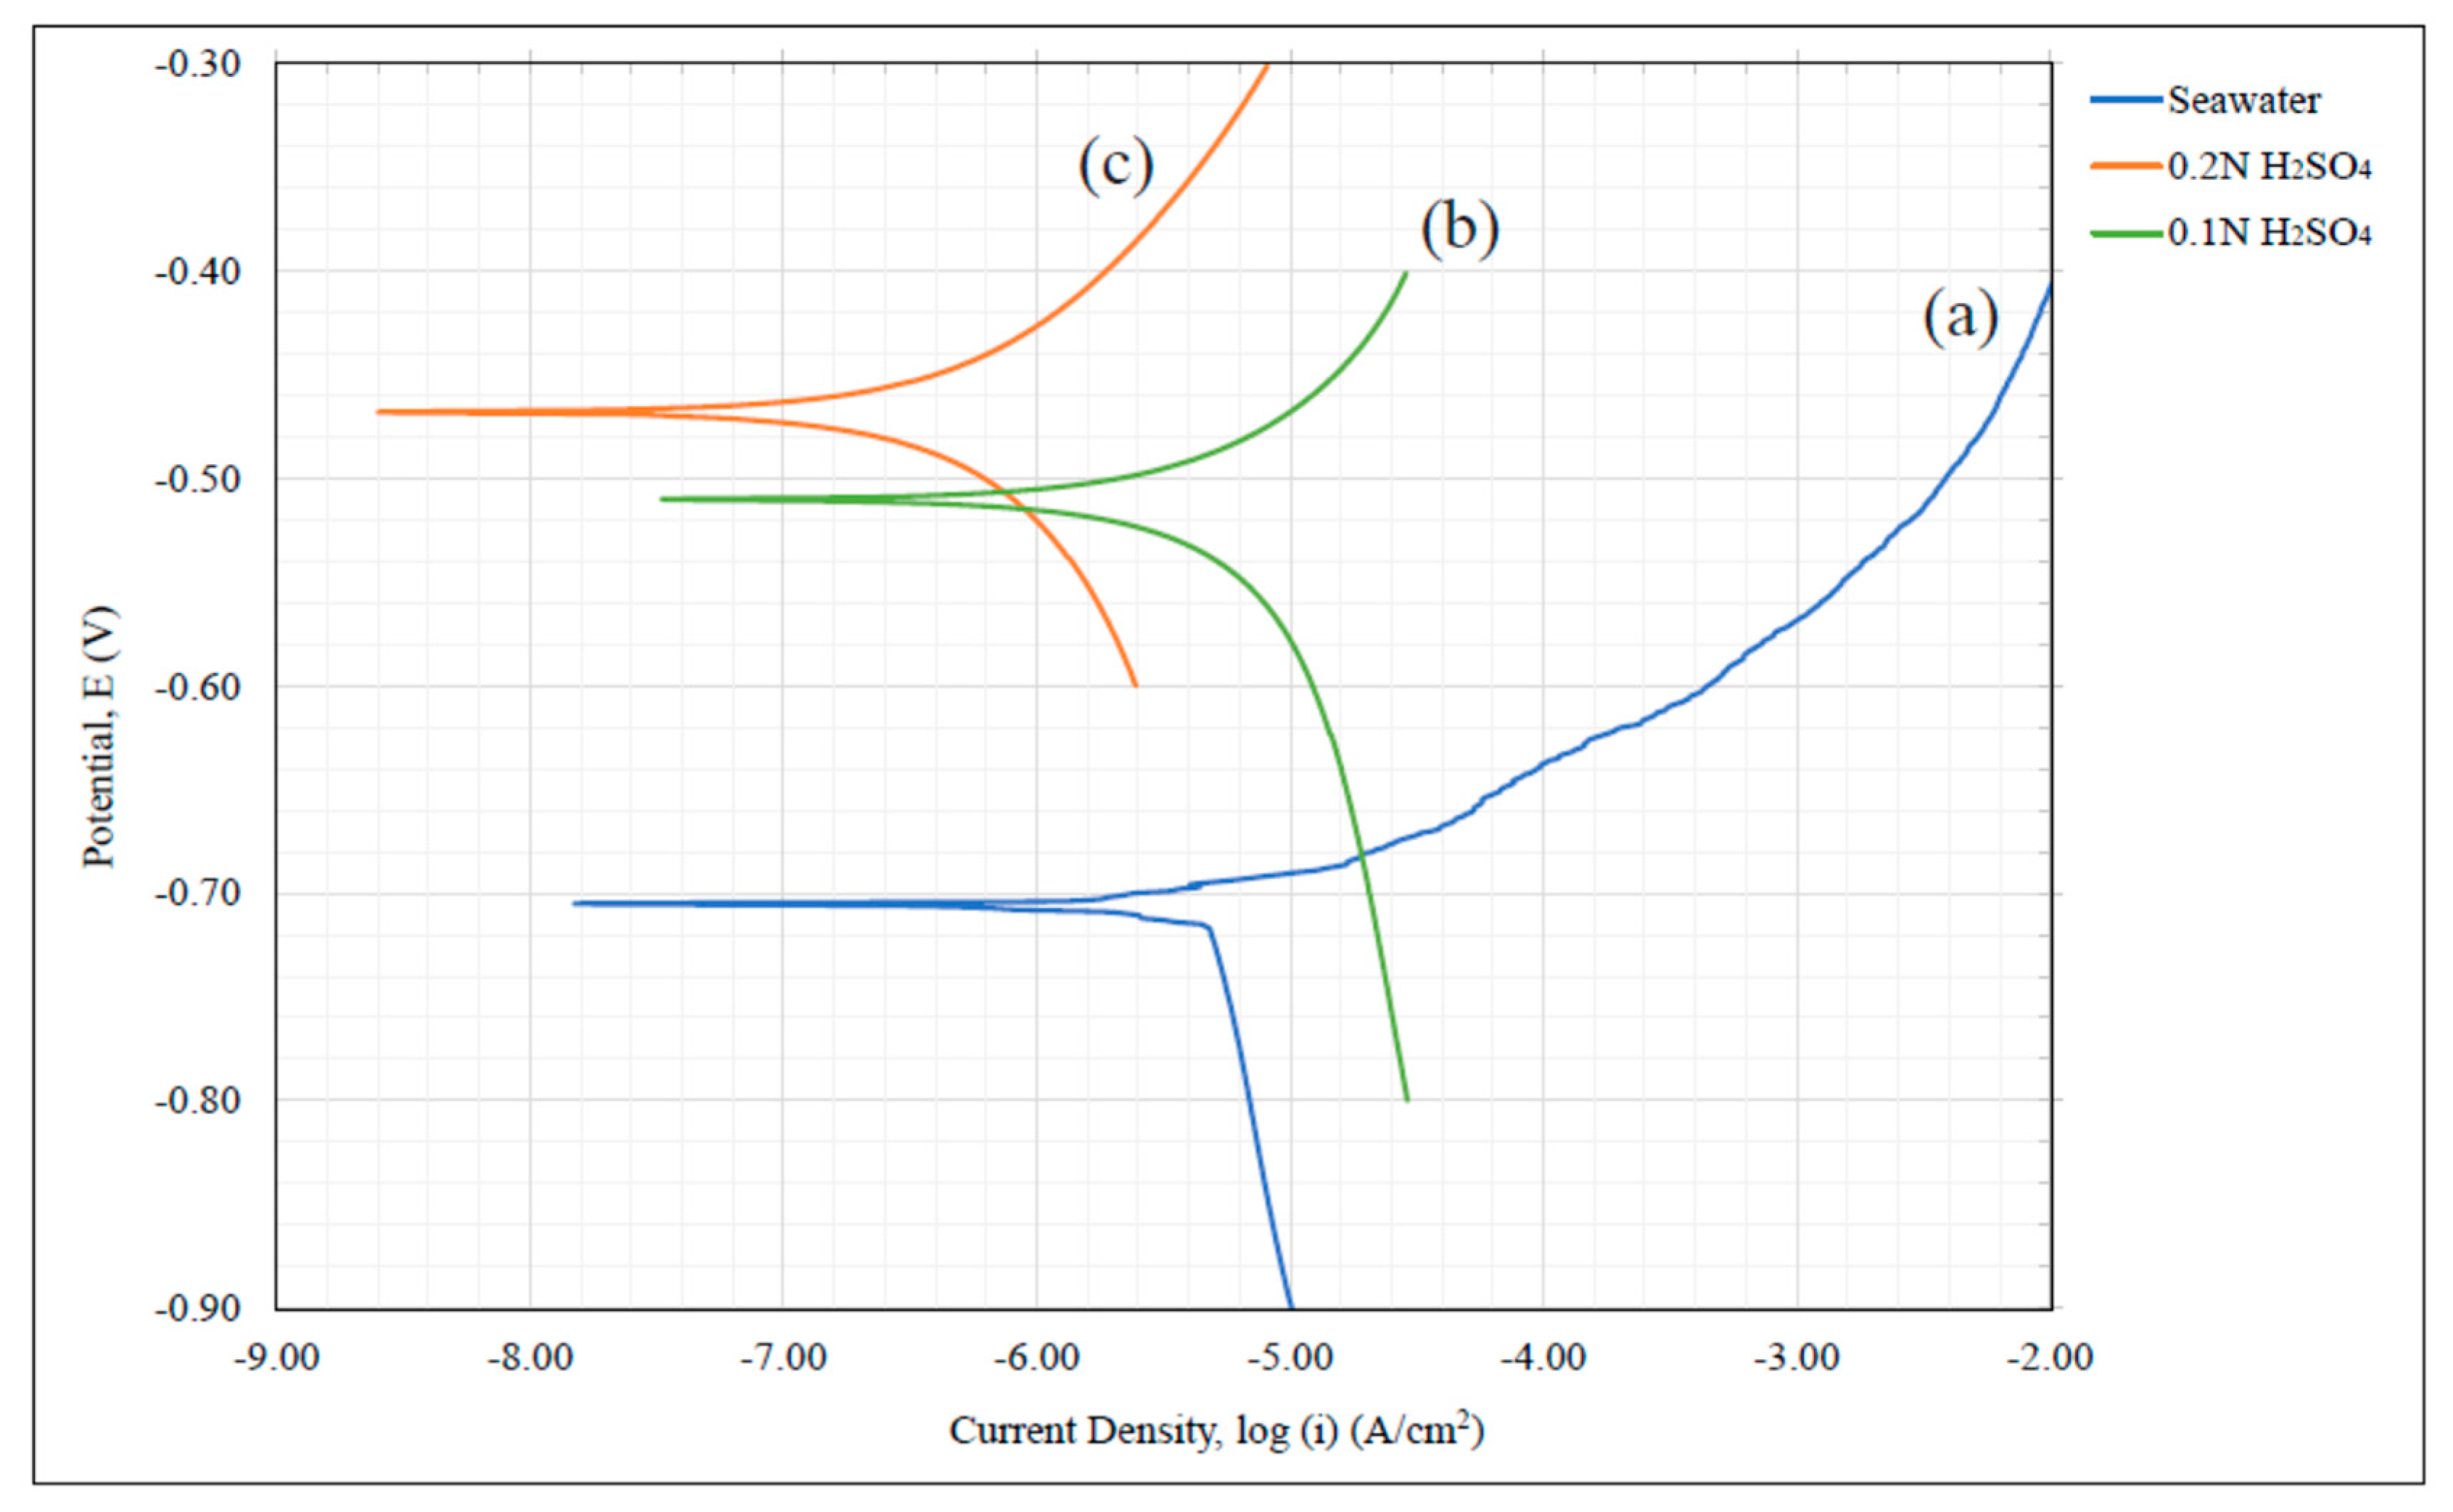
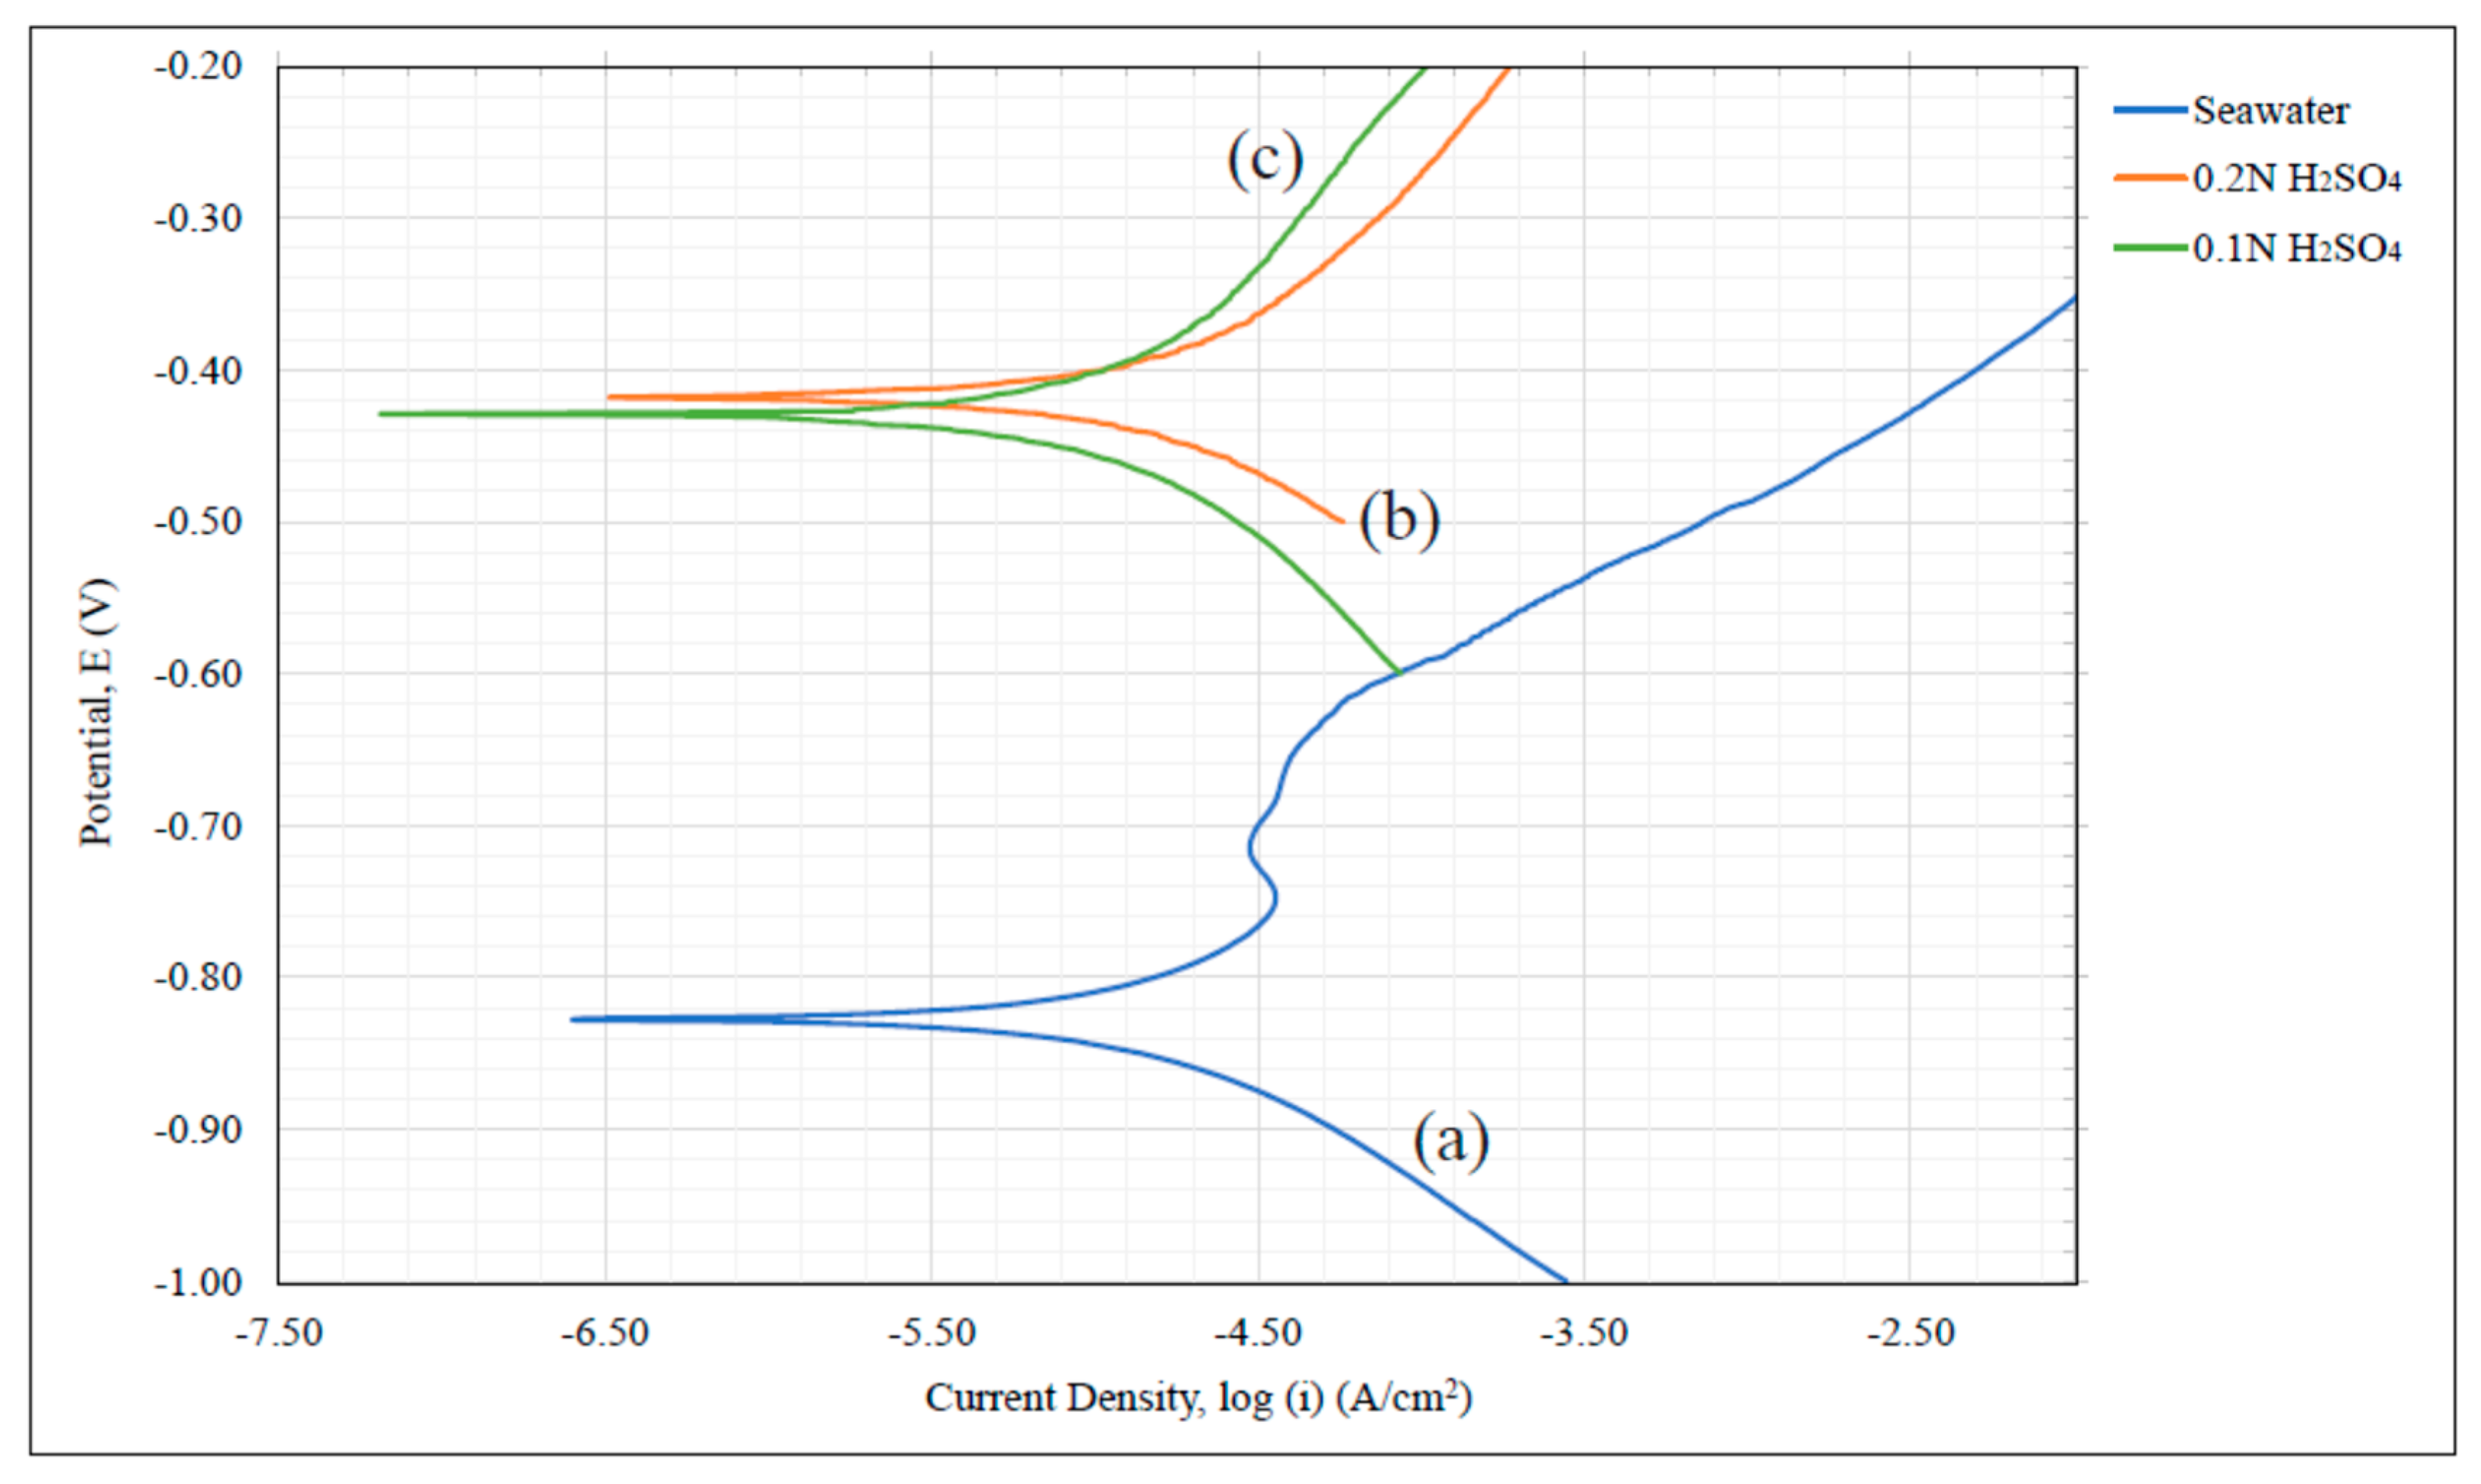
Each test was conducted within the voltage range of −1 V and 0.5 V; a larger range is recommended for future experimentation. Outputs of the testing were presented as log(i) and exchange current densities were taken in A/cm
2. A graphical distribution of the data resulted in the cathodic and anodic polarization curves. These were presented on a semi-log plot of current density (A/cm
2) versus potential (V) also referred to as a Tafel plot [
13]. These polarization curves for all data were recorded and permitted the extrapolation of Tafel coefficients and pseudo exchange current densities for corrosion as outlined in ASTM G5 and Ref. [
13]. The parameters were recorded as: the pseudo potential for corrosion (
Ecorr) in V, the pseudo exchange current density of corrosion (
icorr) in A/cm
2, and the rates of cathodic and anodic reactions (β
c and β
a respectively) in V/dec. The horizontal asymptotic pseudo
Ecorr line provided a reference for the extrapolation of a regression line from the most linear portion of the cathodic polarization line whose slope was β
c. The exchange current density at the point of intersection of these lines was recorded as the pseudo
icorr. It was also used as the pivot point for the generation of a regression line between it and the first point of contact from below with the anodic polarization line. The slope of this constructed adjacent line was determined as β
a.
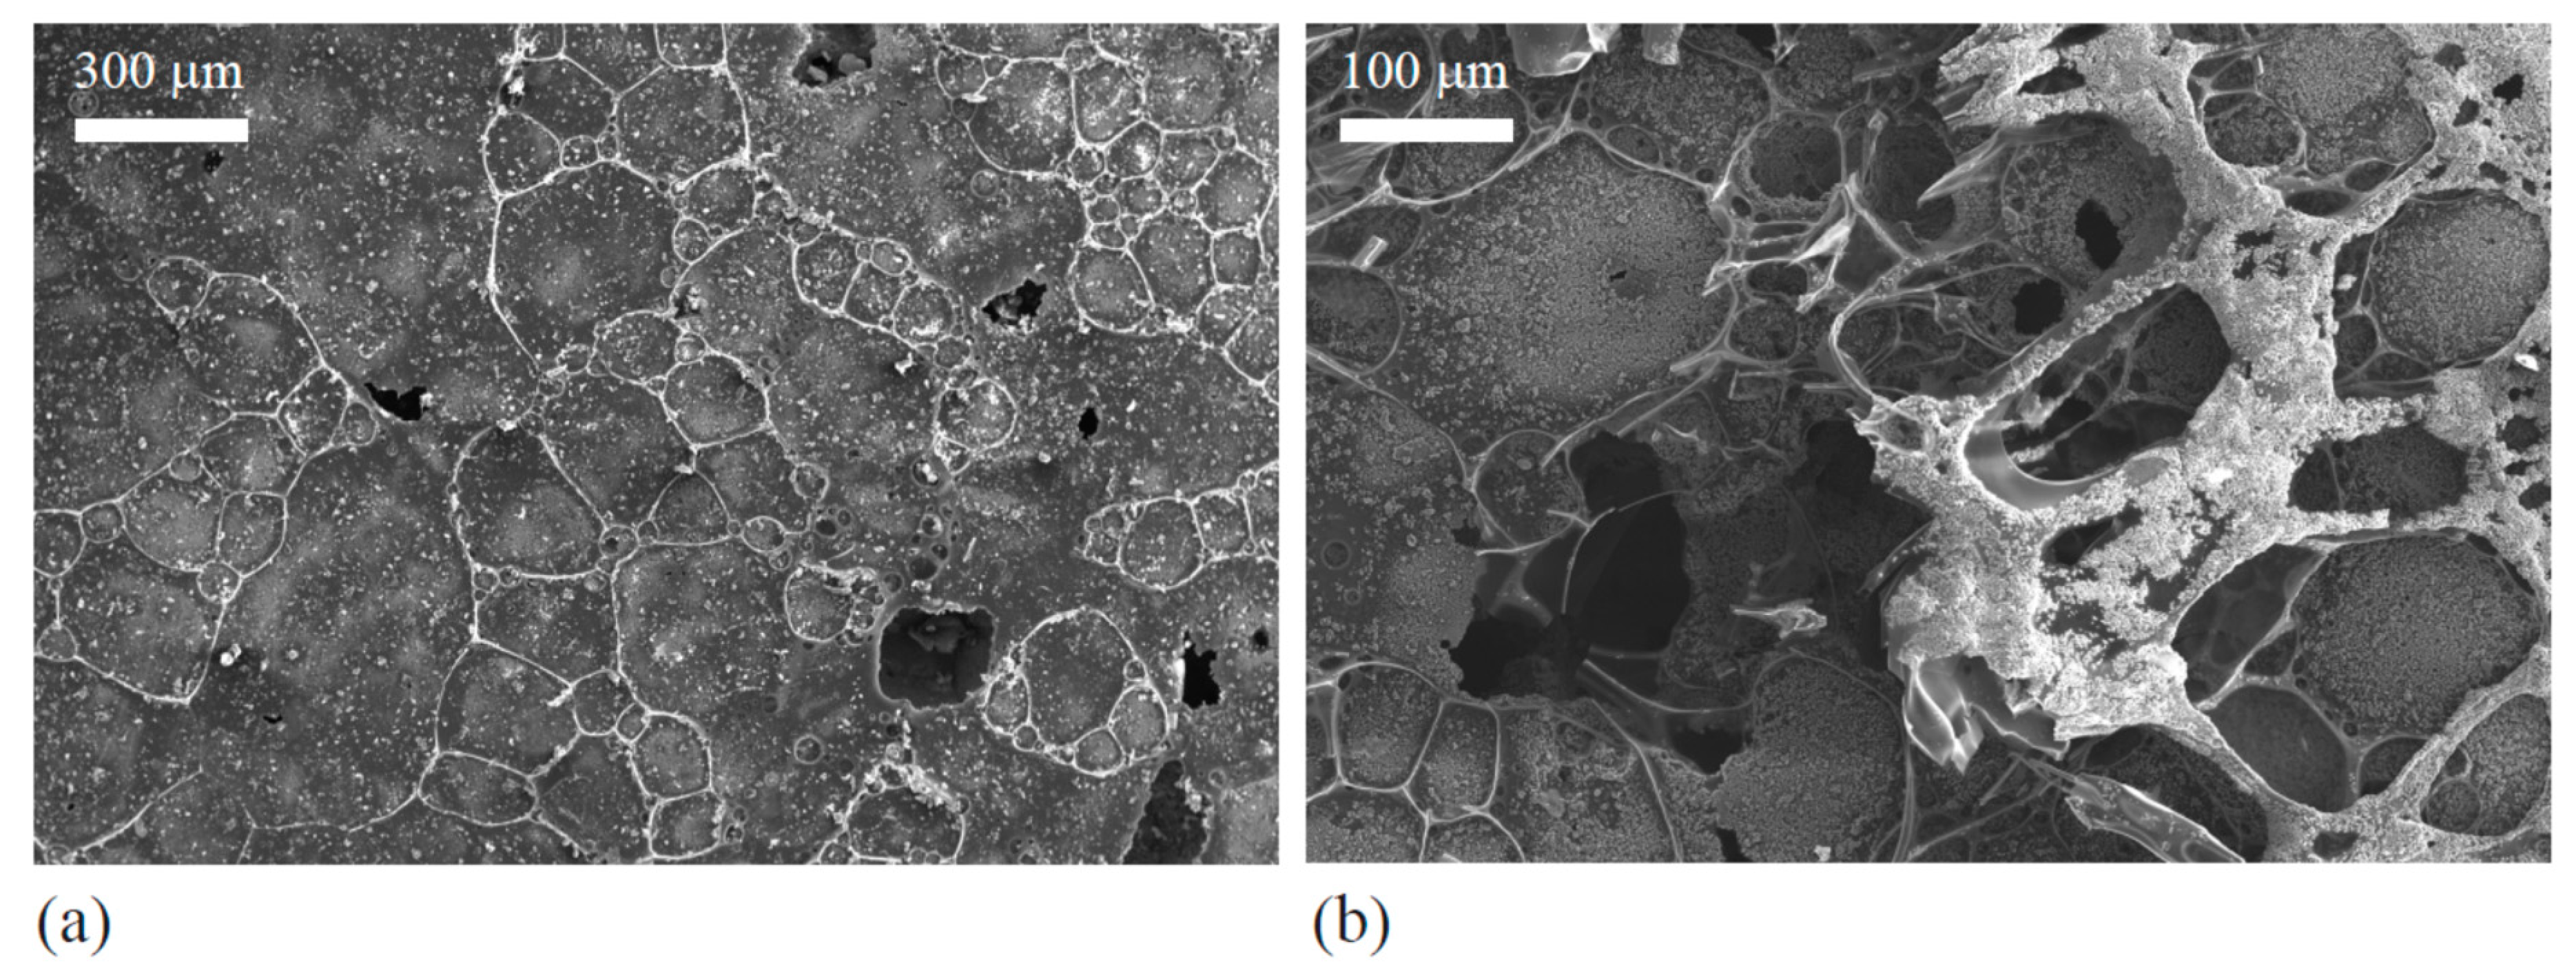
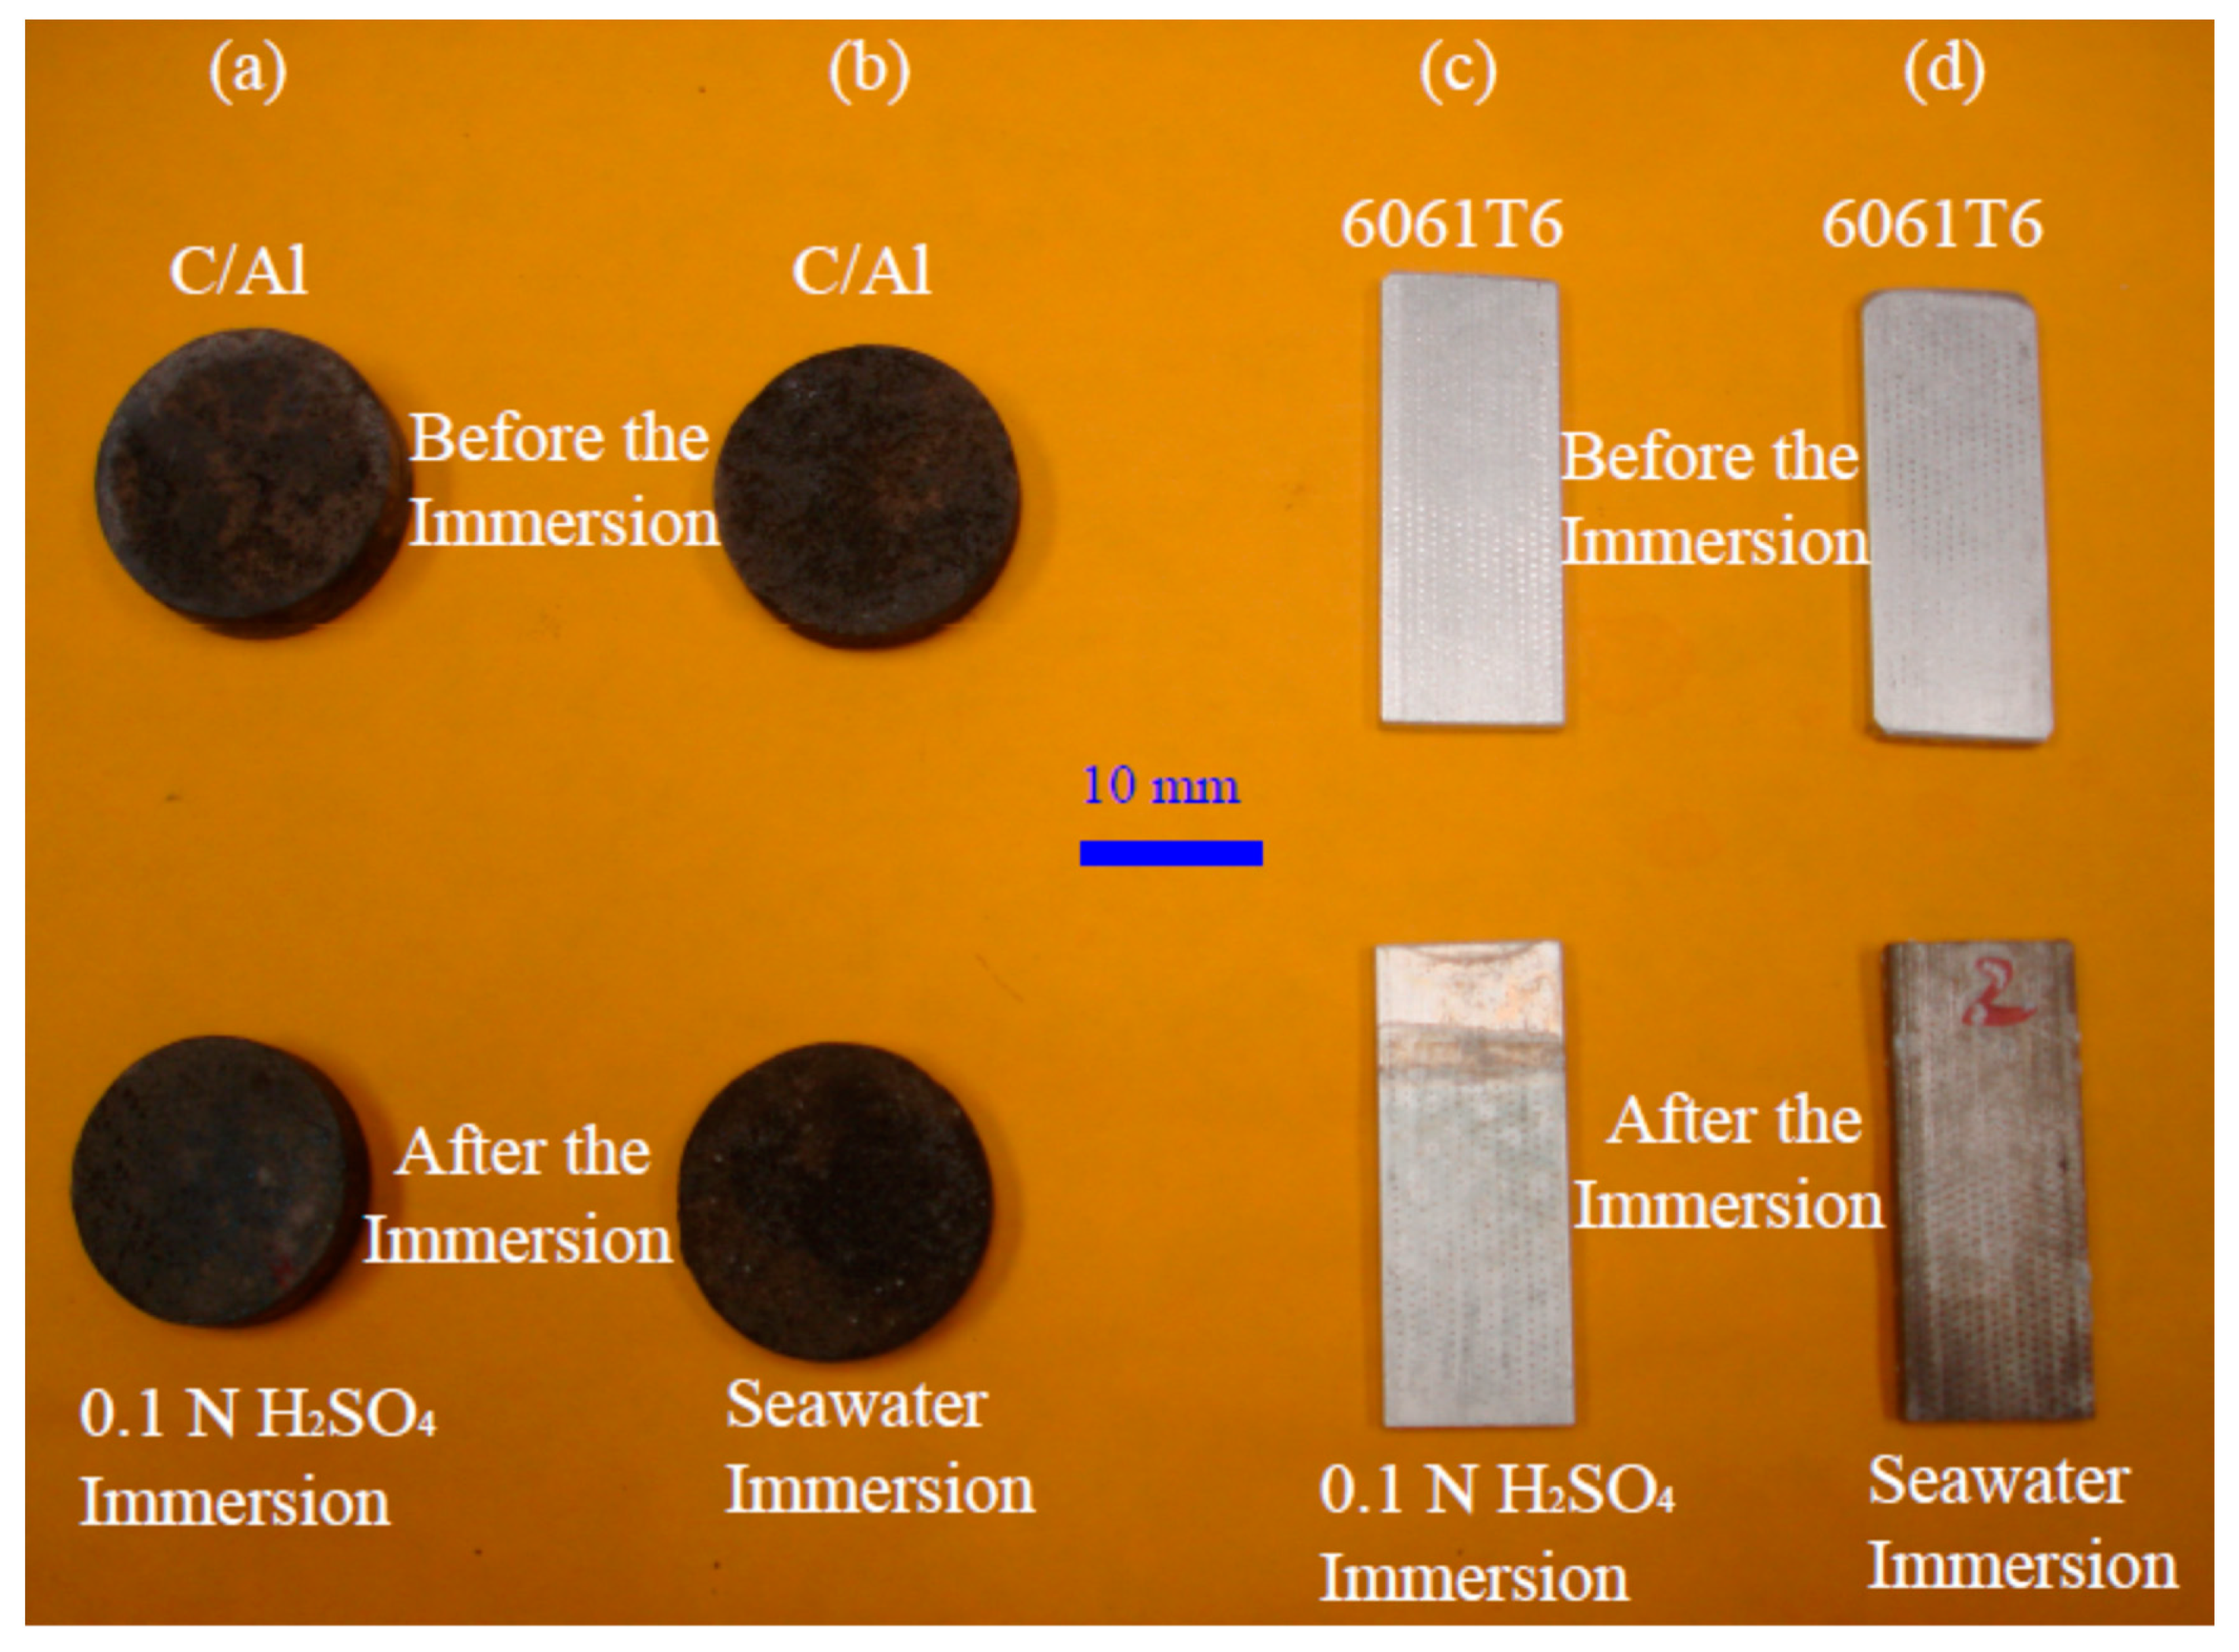
The electrochemical impedance spectroscopic (EIS) tests were performed in the traditional three-electrode cell containing seawater and sulfuric acid as the electrolytes. The sinusoidal signal was generated by a function generator supplied by PASCO, Roseville, CA, USA. The frequency range used was from 0.001 Hz to 100 kHz. An EXTECH LCR meter with the model number of 380,193 made by Fotronic Corporation, located in Melrose, MA, USA, was used to measure the impedance during the polarization by the potentials with the frequency control via the function generator. The real part and the imaginary part of the impedance data were recorded and processed using a MatLab code. Immersion corrosion tests on typical specimens were performed at a room temperature of 20 °C. Both optical images and scanning electron microscopic images of the corroded surfaces were captured to reveal the degradation of the materials in seawater and sulfuric acid.
4. Electrochemical Impedance Spectroscopy (EIS)
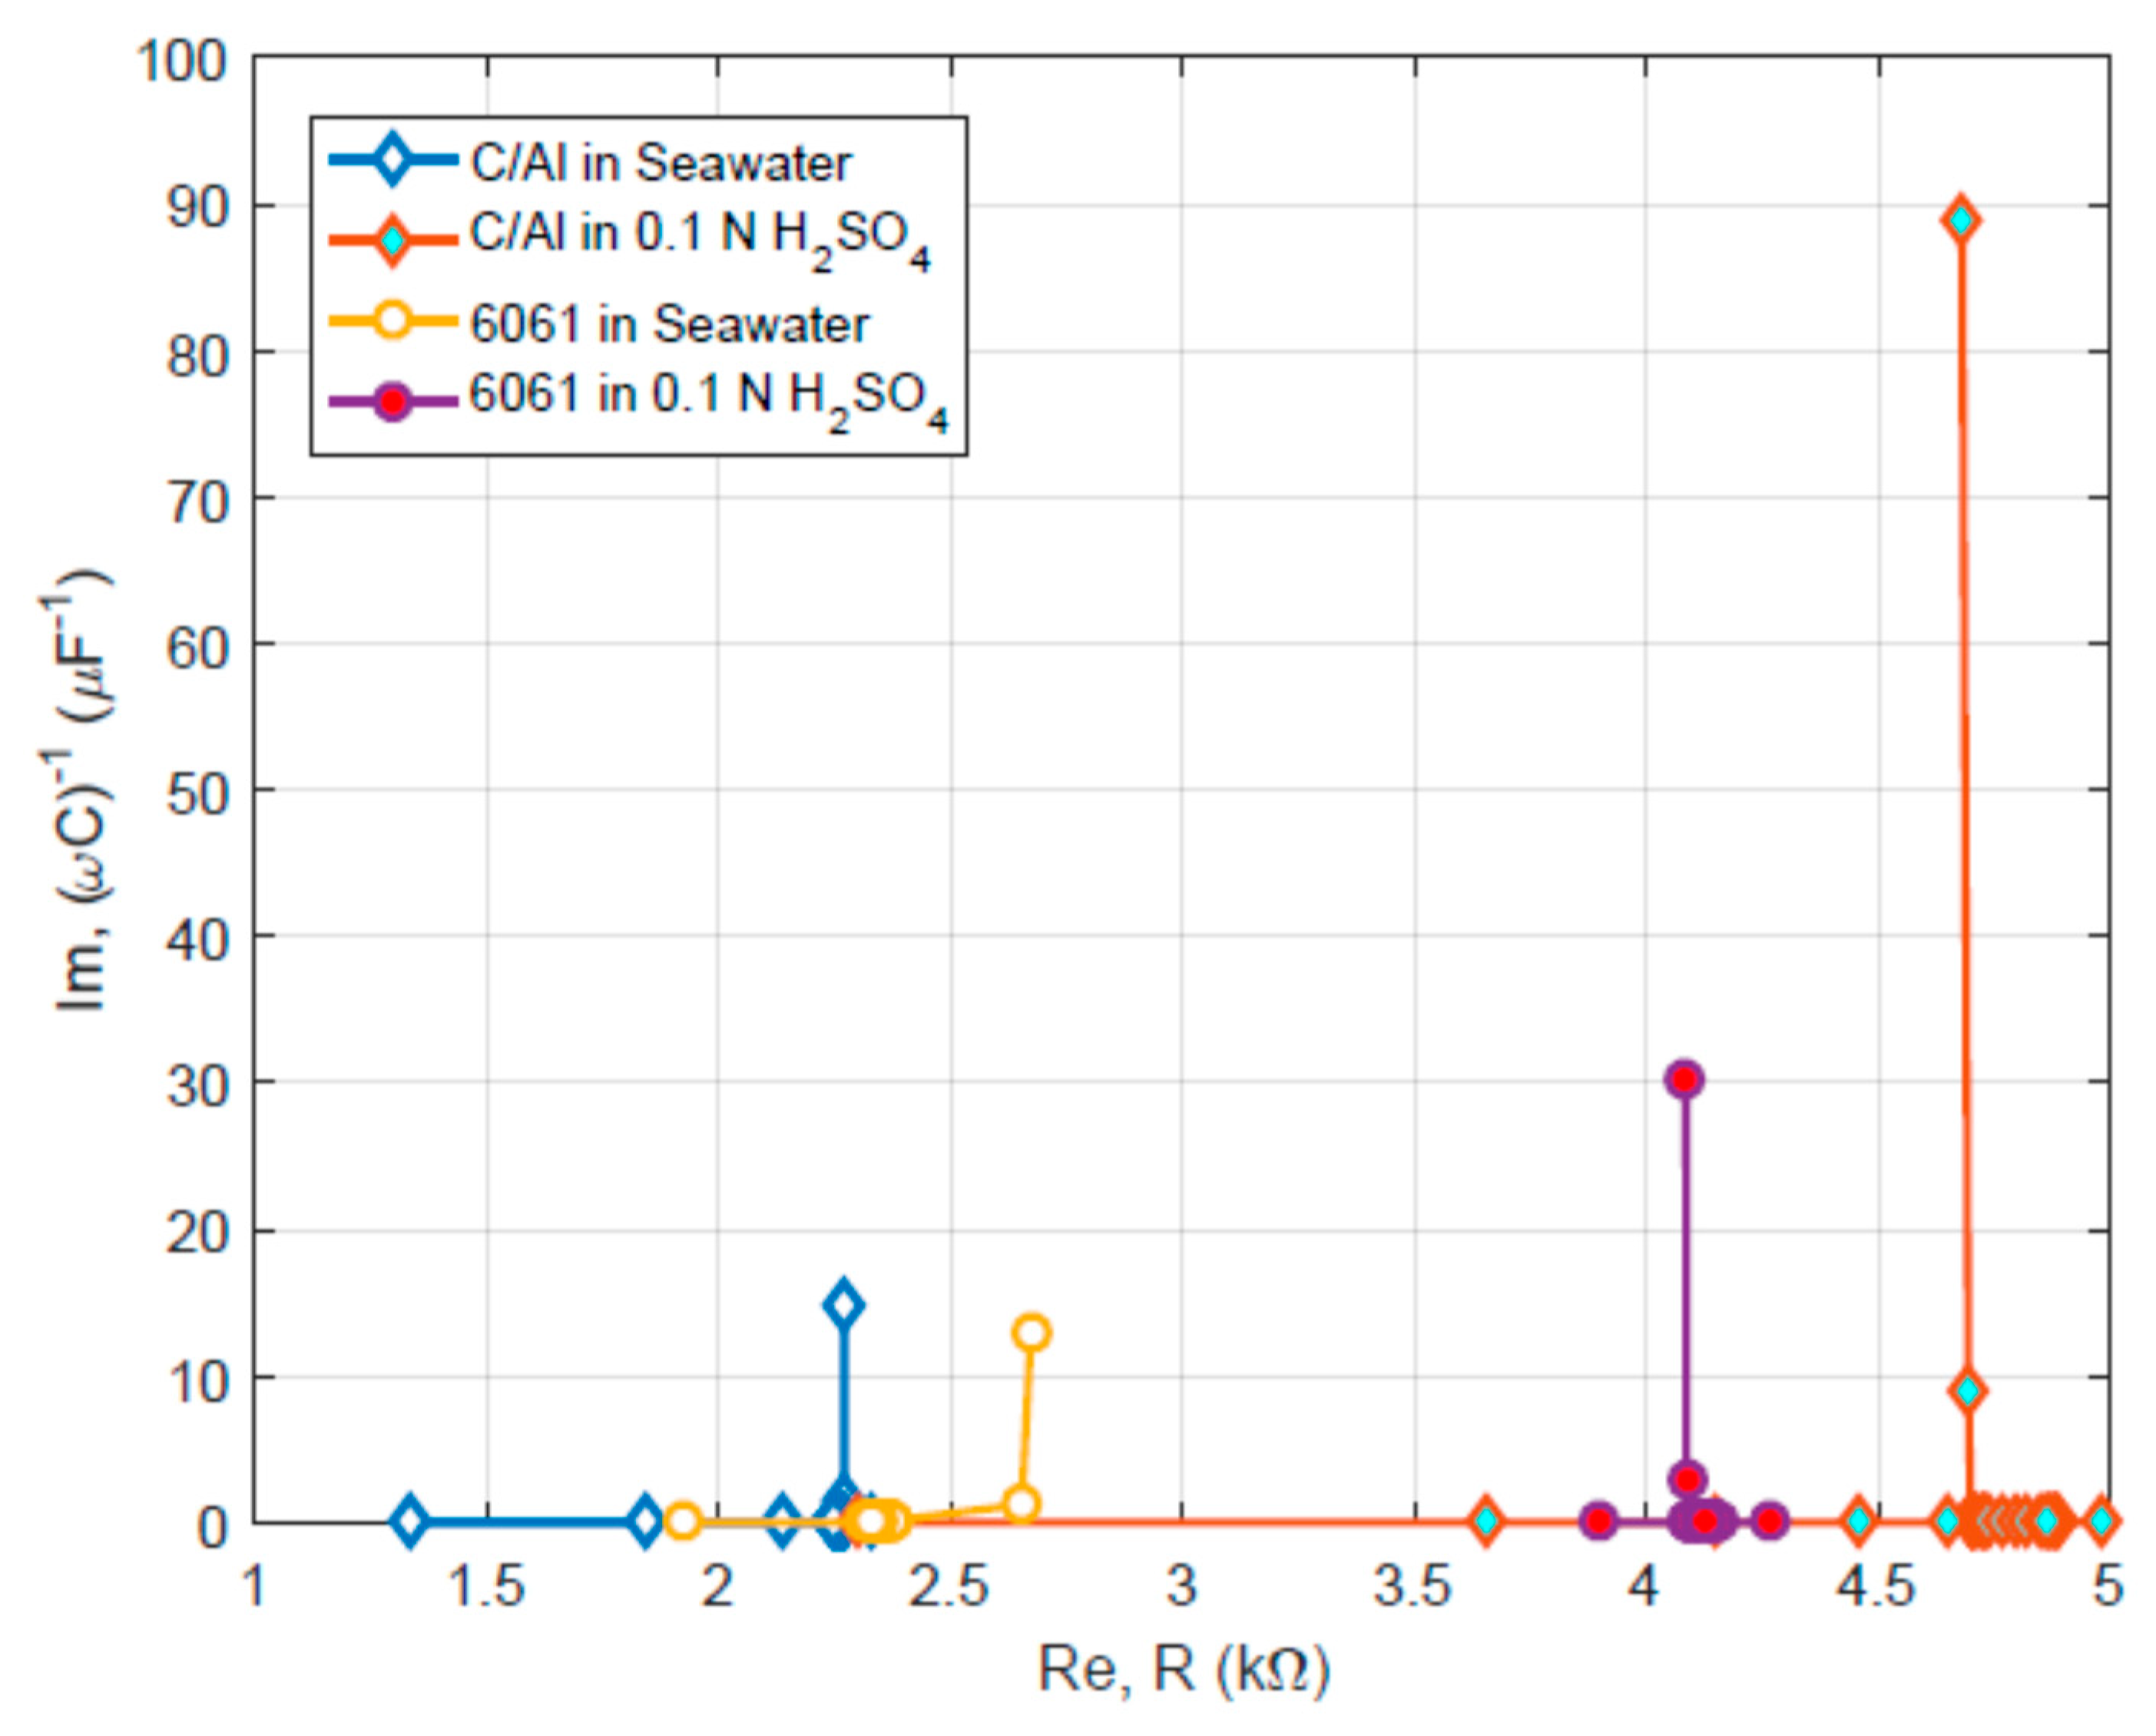
During the electrochemical impedance spectroscopic (EIS) tests, a three-electrode cell was used. The reference electrode was the Ag/AgCl in KCl solution. The counter electrode was a platinum wire. The working electrode was either the C/Al composite or the 6061 aluminum alloy. 0.1 N sulfuric acid and seawater were used as the electrolytes for the tests. The polarization potential in sine wave was added between the working electrode and the counter electrode. The impedance between the working electrode and the reference one was recorded. The frequency of the polarization potential changed from 0.001 Hz to 100 kHz. The real part and the imaginary part of the impedance data were plotted to examine the electrochemical reaction mechanisms associated with the corrosion of the materials in both the sulfuric acid solution and seawater.
Figure 8 shows the results from the EIS tests on different materials in the acid and seawater. Obviously, these plots reveal the pure capacitive coating-like behavior. Such a behavior seems reasonable because both materials could form passive coatings in the oxidative acid and in the seawater electrolyte. The seawater has a pH value close to 7.5, which allows aluminum to form a passivation layer. While the sulfuric acid is intrinsically oxidative, causing the aluminum alloy to form surface film. The EIS measurement results are also in agreement with the morphological analysis results.
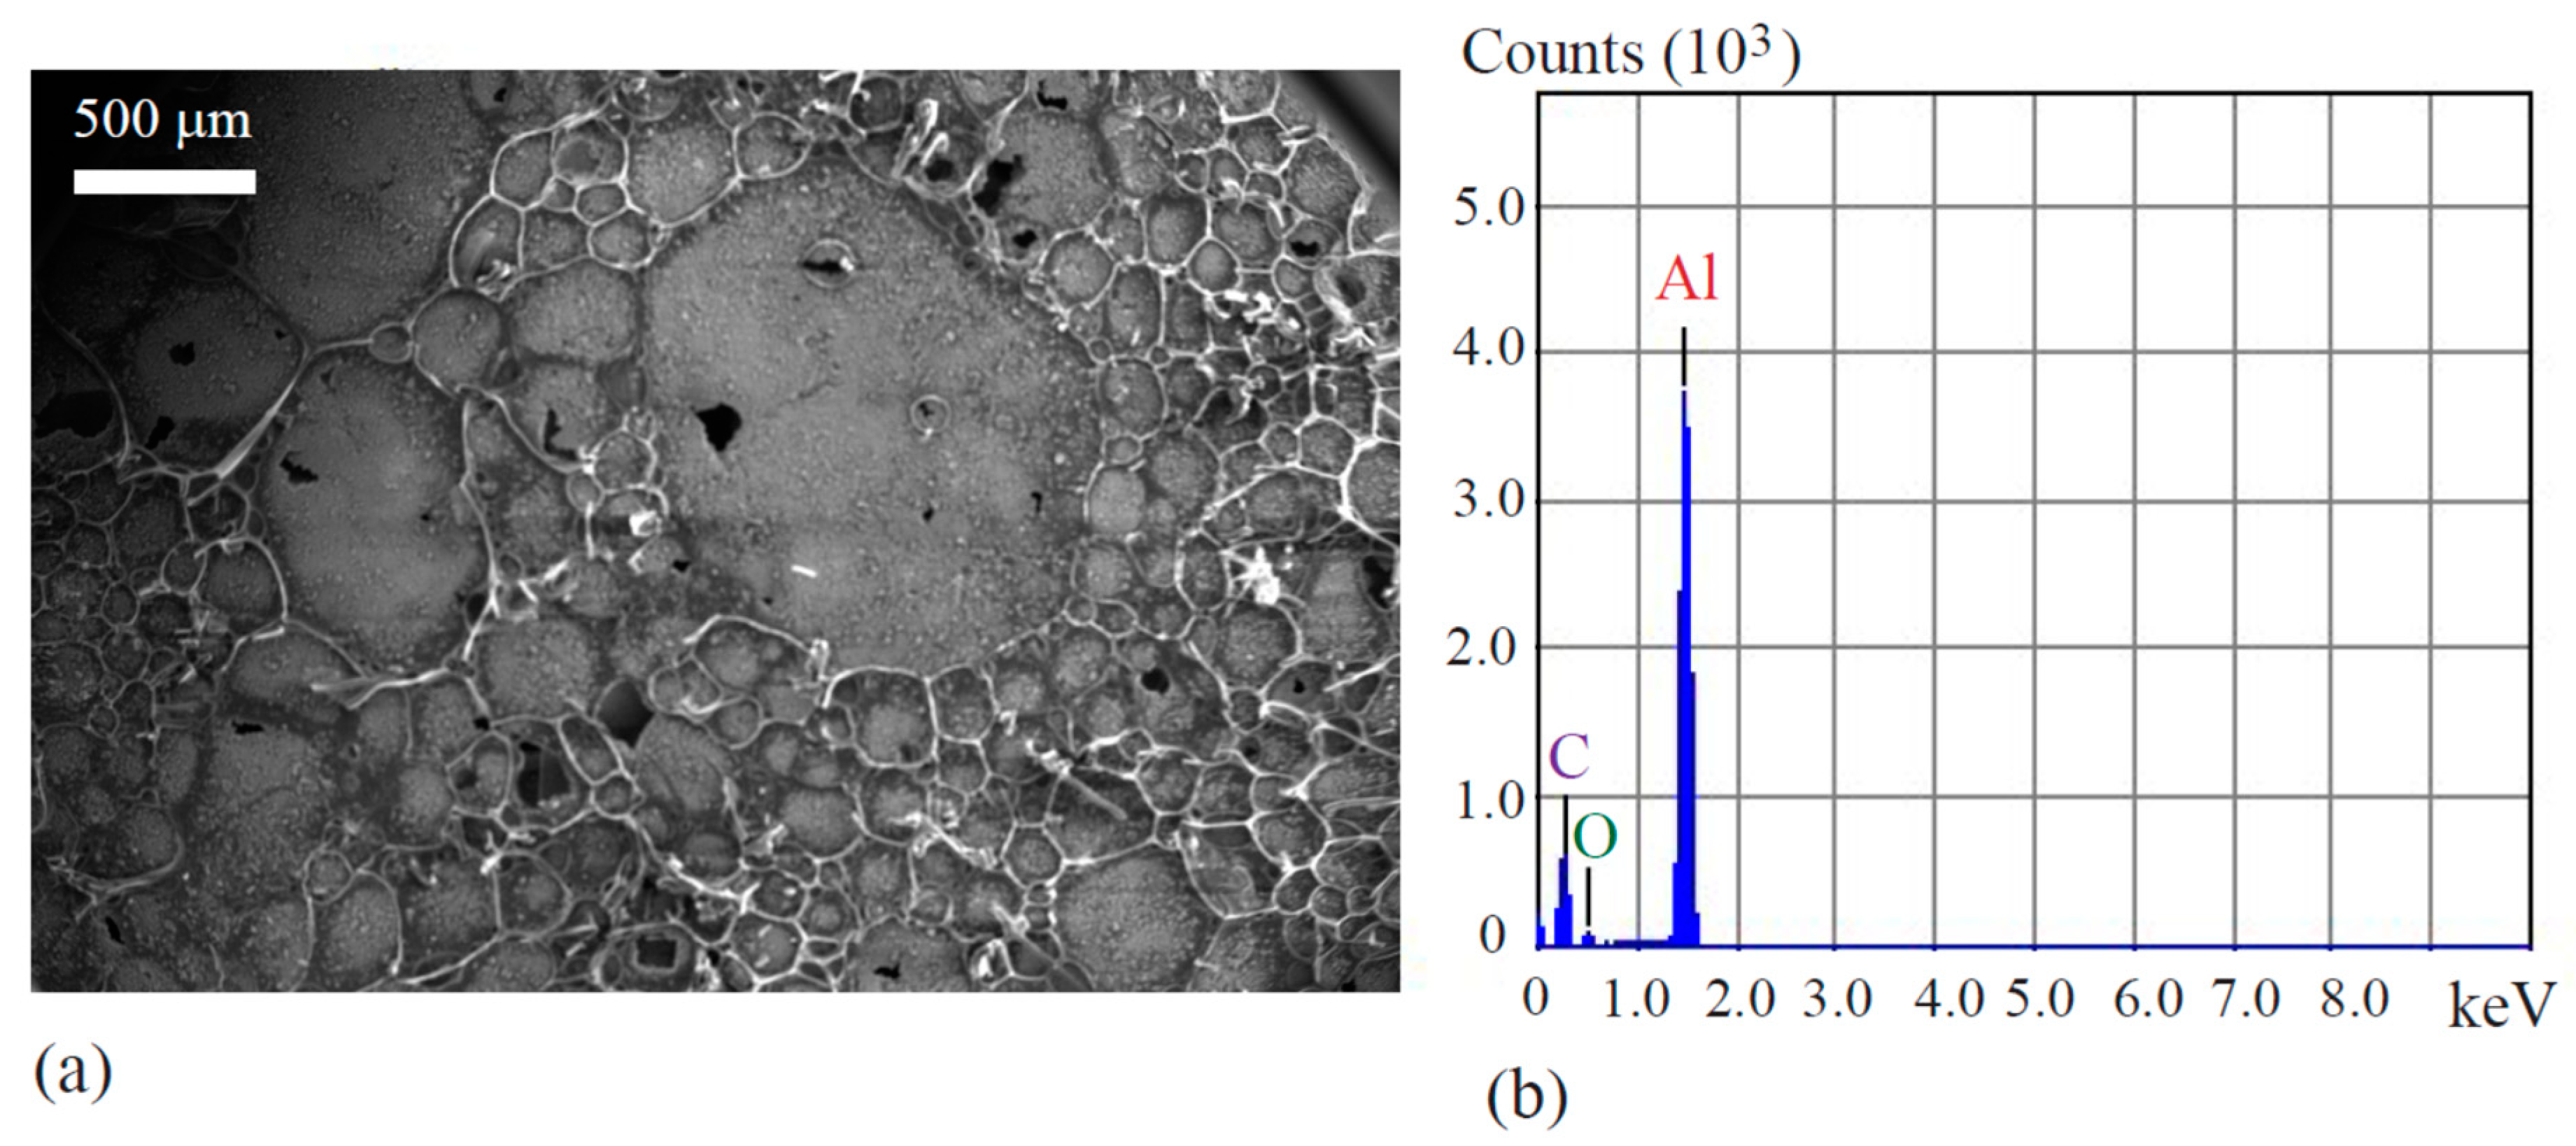
Figure 6a,b show that the aluminum grains were covered by the carbon networks, while
Figure 7c,d reveal that the 6061 aluminum alloy specimens were covered by colored coatings.
The methodologies of this work’s tests deviate from the standard model as provided in Ref. [
14]. Due to the differences in controlling the corrosion conditions, it is important to mention that the Tafel plot data recovered in this work’s testing could generate some errors in calculating the corrosion rate. That is why in this work, we estimated the corrosion rates of the two materials (C/Al and 6061 Al alloy) from the immersion tests. An accurate comparison of the investigated materials—C/Al composite, Al 1235, and aluminum 6061-T6- kinetic phenomena in each testing solution -H
2SO
4 at 0.2 N and 0.1 N as well as seawater at 6% salinity—can only be made consistent by following the procedures in ASTM G59 [
14], G3 [
20], and G5 [
21]. These outline an experimental method and provide a data reduction procedure that uses relationships (1) through (4) of Reference [
14] to generate a precise
CR value.
The major distinction between the data reduction procedure in this work and that of the standard was the use of the polarization curves and pseudo icorr. This parameter provides a basis of comparison between materials in the same environment, and was only a preliminary suggestion of the true icorr and CR. A future experiment would gather subsequent data of each corrosion system using the polarization resistance (Rp) method.
In this step, a similar practice to that for developing a dynamic polarization curve would be used. However, only a small potential scan would be applied to the system to prevent over polarization of the working electrode surface [
13]. The exchange current density range must also fit within the negative and positive regions. From here, an origin—at the steady state value 0 A/cm
2 and the corresponding true
Ecorr—could be developed and the
Rp slope, in ohm-cm
2, may be determined following the relationship in (1) of Reference [
14]. From this complementary information, the true
icorr and
CR could be reliably deduced.
Although not within the scope of this work, a comment is added regarding the importance of intergranular graphite to corrosion phenomena. As mentioned earlier, an exposure of the base metal element Al to an environment that could catalyze active corrosion could generate a galvanic corrosion system of a large potential difference with graphite acting as a highly effective cathode [
13]. Additionally, the interaction between Al and electrolytes could cause oxide growth, via crevice corrosion, that would induce intergranular stresses and cause premature material failure [
22]. A recommendation is made for future study of the consequence this and activity difference have on the C/Al composite’s longevity in corrosive settings.
It is meaningful to examine the trend of impedance change during the polarization processes. To implement this, the AC voltammetry technique was used in the study. The CH Instrument Model 440C Electrochemical Workstation was used to generate the polarization signal and to perform the data acquisition. As is known, the AC Voltammetry is capable to analyze the Faradaic impedance. In our work, a low-amplitude sinusoidal voltage with the amplitude of 25 mV is given to the working electrode (the 6061-T6 and C/Al composite). The frequency of the sinusoidal AC voltage is 100 Hz. The work electrode was polarized by increasing or decreasing DC voltages relative to the Ag/AgCl reference electrode. Because of the difference in the time scale, the AC component of the total current can be readily differentiated from the DC component. During the test, the total current, the scanning potential, the in-phase current and the out-of-the-phase current were recorded. The data were used to generate the polarization curves and the electrochemical or Faradaic impedance.
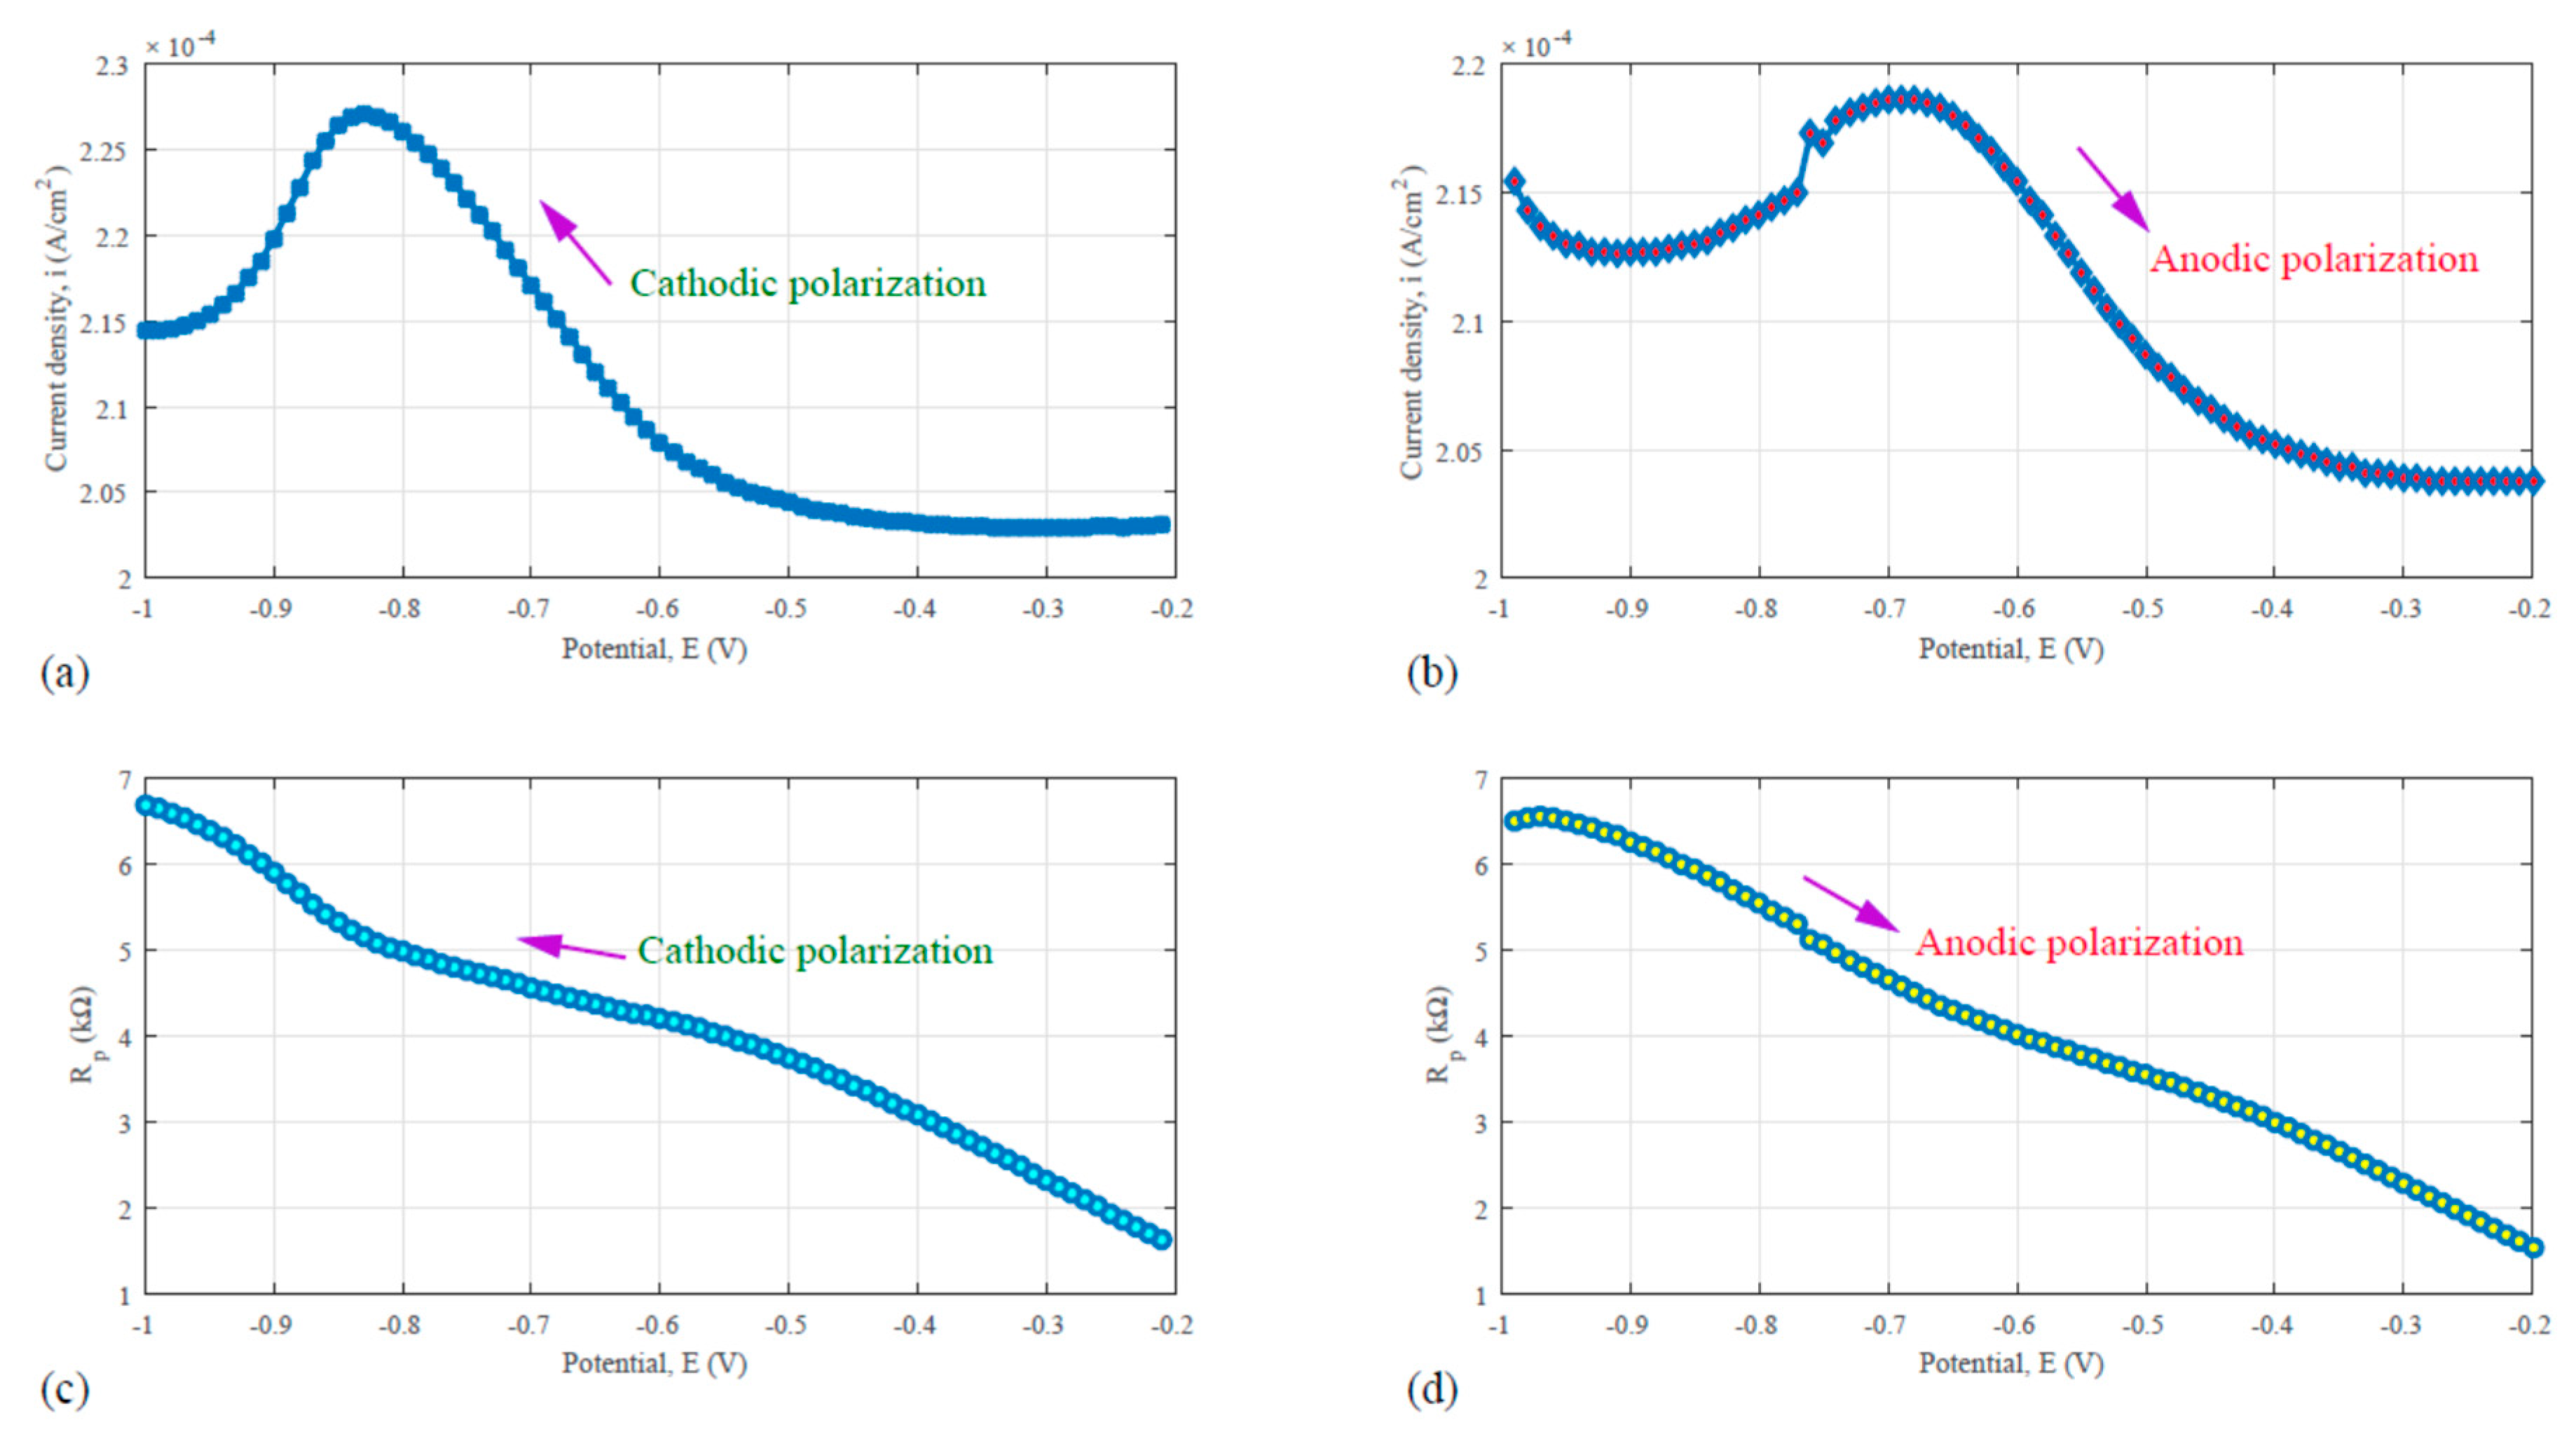
Figure 9 shows the AC voltammetry and the electrochemical impedance results based the test for the 6061-T6 aluminum alloy in 0.1 N H
2SO
4.
Figure 9a is the cathodic polarization curve that is corresponding to the downward sweep scan with the potential decreasing from −0.2 V to −1.0 V. While
Figure 9b represents the anodic polarization curve with the potential increasing from −1.0 V to 0.2 V. In the tests for generating both sub-plots, the sinusoidal signal was superposed onto the linear DC scanning potential. In
Figure 9a, a peak located between −0.9 and −0.7 V was found. In
Figure 5b the peak slightly shifted to the range from −0.8 to −0.6 V. The corrosion potential of the aluminum alloy, as shown in
Figure 2 curve (c), falls into the potential range, as revealed by
Figure 9a,b. This indicates that the electrochemical reaction of 6061 corrosion in 0.1 N sulfuric acid can be detected by the Taefl method and the AC voltammetry.
Evaluation of the reaction resistance was made. The results as shown in
Figure 9c come from the division of the scanning potential by the corresponding in-phase current during the downward sweep or cathodic polarization cycle. While the results, as shown in
Figure 9, stand for the division of the scanning potential by the corresponding in-phase current during the upward sweep or anodic polarization cycle. The electrochemical impedance of the system reached a value between 4 and 5 kΩ. Comparing with the EIS results shown in
Figure 8 was made. In
Figure 8, the real part of the impedance ranges from 3.9 to 4.3 kΩ, which is slightly lower than the results from
Figure 9c or d.
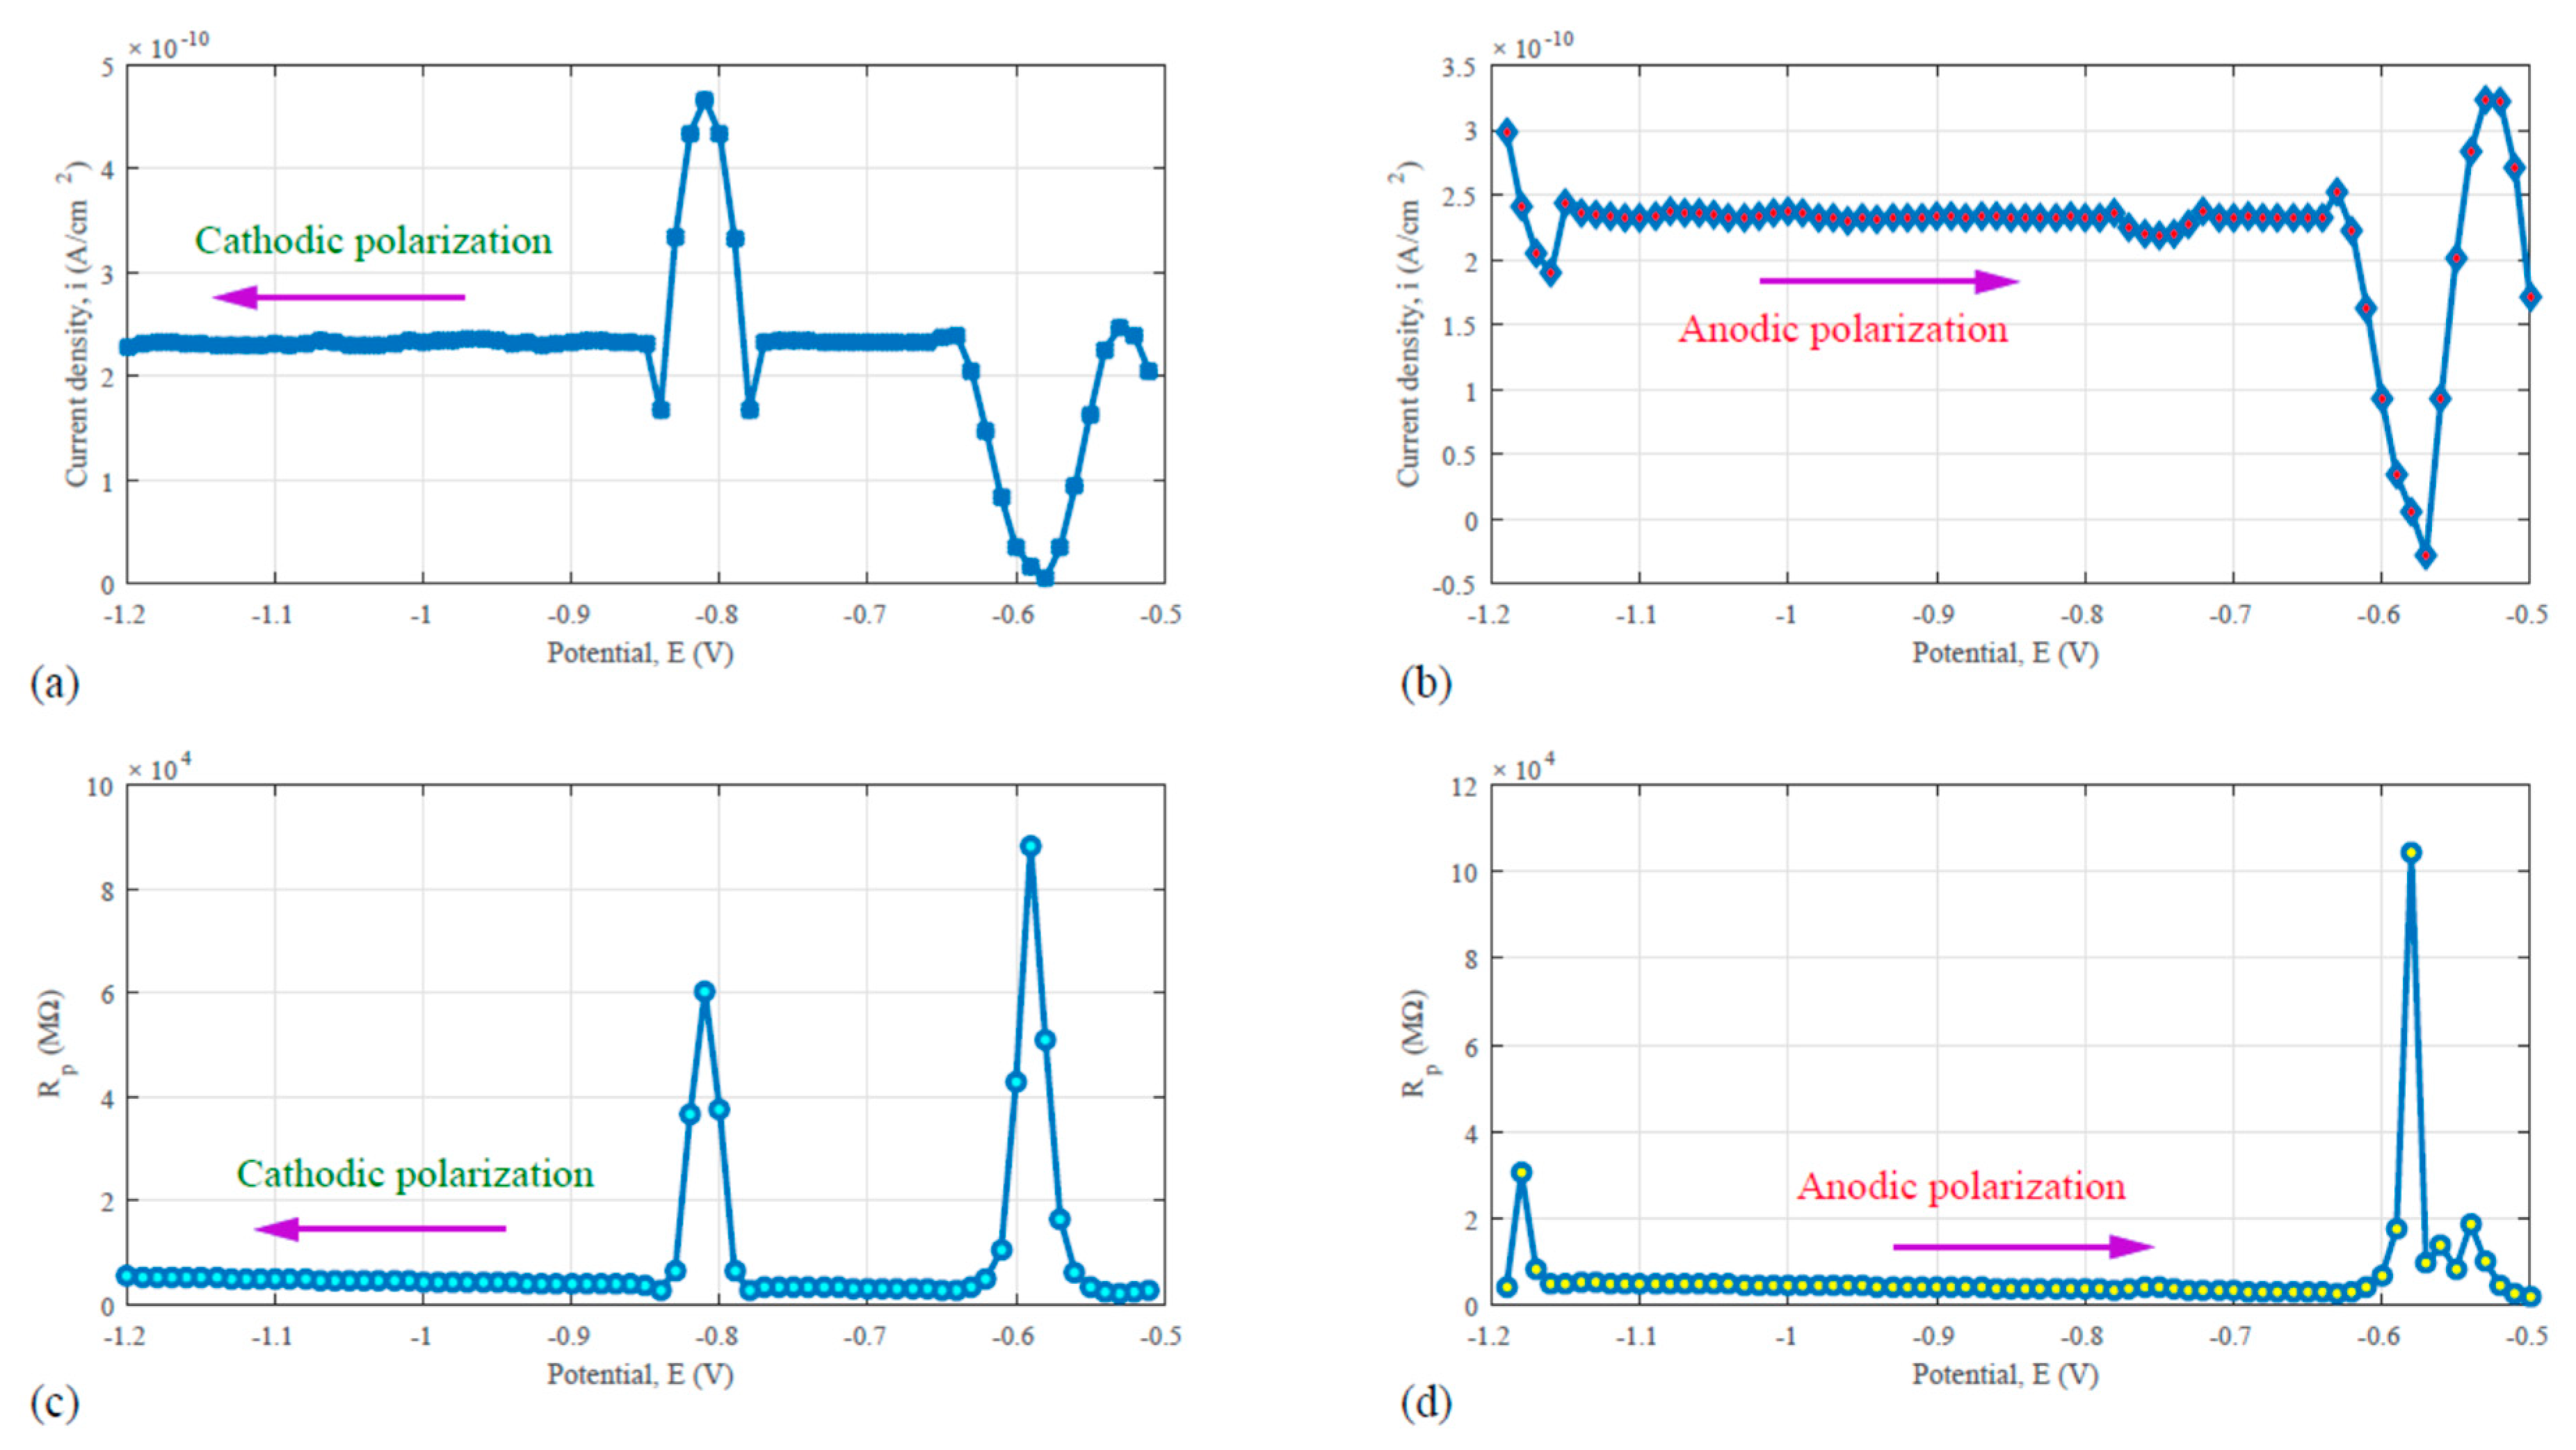
For the porous C/Al composite material in 0.1 N sulfuric acid, the similar AC voltammetry test as for the Al6061-T6 was performed also. The results are shown in
Figure 10. In
Figure 10a, the cathodic polarization or downward sweep curve reveals two peaks in the potential range from −1.2 to −0.5 V. In the reversed scan, anodic polarization (upward sweep), multiple peaks were also found, as illustrated by
Figure 10b. These peaks indicated the complexity of electrochemical reactions in the corrosion of the C/Al composite material. Aluminum dissolution is one of the major reactions. In addition, water oxidation and oxygen reduction at the carbon network surface could happen. Nevertheless, the exact reaction mechanisms and kinetics remain to be studied in more detail.
Figure 10c is a plot obtained by dividing the in-phase current from the scanning potential during the downward sweep or cathodic polarization cycle.
Figure 10d stand for the division of the scanning potential by the corresponding in-phase current during the upward sweep or anodic polarization cycle. The electrochemical impedance of the C/Al composite-0.1 N sulfuric acid system as obtained from
Figure 10c or d is much higher than that of the Al6061-T6-0.1 N sulfuric acid system, as shown in
Figure 9c or d. Such a difference in the impedance reflects that the electrochemical reaction resistance for the two materials is not the same when they are exposed to the acidic environment. The higher the electrochemical impedance, the higher the corrosion resistance. Obviously, the C/Al composite material has a better corrosion property than the Al6061-T6 alloy.
5. Conclusions
A carbon network/aluminum matrix porous composite material was analyzed for its susceptibility to corrosion using dynamic polarization testing and data of electrochemical kinetics. Pseudo
icorr values where taken as a means of inferring potential corrosion rate and as a mode of comparison between the composite, Al 1235 data, and 6061-T6 in seawater at 6% salt content and sulfuric acid at 0.2 N and 0.1 N. The Tafel coefficients
βc was also used to understand the influence of the carbon network on the disposition of the oxidizer H
+ to react with the porous composite surface. The instance of a larger
βc for the composite was found to be an effect generated by porous geometry and testing environment, but did not directly compare to pseudo
icorr. An evaluation of the pseudo
icorr data revealed that the composite exhibited the lowest value in all environments studied. From the relationship between this information and the material’s rate of oxidation, it was inferred that the C/Al composite’s corrosion rate was substantially lower than the other materials. This was attributed to the high intergranular carbon content created within the porous aluminum structure during its production process. The introduction of a carbon matrix induced a C/Al composite corrosion behavior similar to graphite even when exposed to acidic environments. This suggests that significantly reduced corrosion rates can be achieved for a porous aluminum and shows that the manufacturing approach of Reference [
2] can be utilized to produce a porous aluminum composite that is more corrosion resistant than its base aluminum matrix material.
The corrosion susceptibility of the C/Al material was also found to be dependent on the given carbon content. However, Ref. [
2] showed that variations in the Al: sugar ratio caused smaller pore size or material embrittlement. Consequently, the C/Al composite was not justified as a light-weight structural material. Although, with a behavior comparative to graphite, the material’s relevance to low energy absorption applications that include an inevitable exposure to deteriorative environments is noted.
Additionally, it was discovered that the electrochemical cells of this work’s experiments were characteristic of fundamentally high ohmic resistances. This produced a reasonable bias error that skewed the data and led to an unrepresentative presentation of the true corrosion kinetics for each electrochemical system. A reliable definition of each material’s corrosion behavior by corrosion rate is necessary before the results and conclusions can be verified.
