1. Introduction
Hydrogen is an attractive fuel for the future both for its ability to perform as an efficient energy carrier and its possible production from renewable sources. One of the large scale most promising processes for hydrogen production is represented by the sulfur-iodine thermochemical cycle, first proposed by the General Atomics [
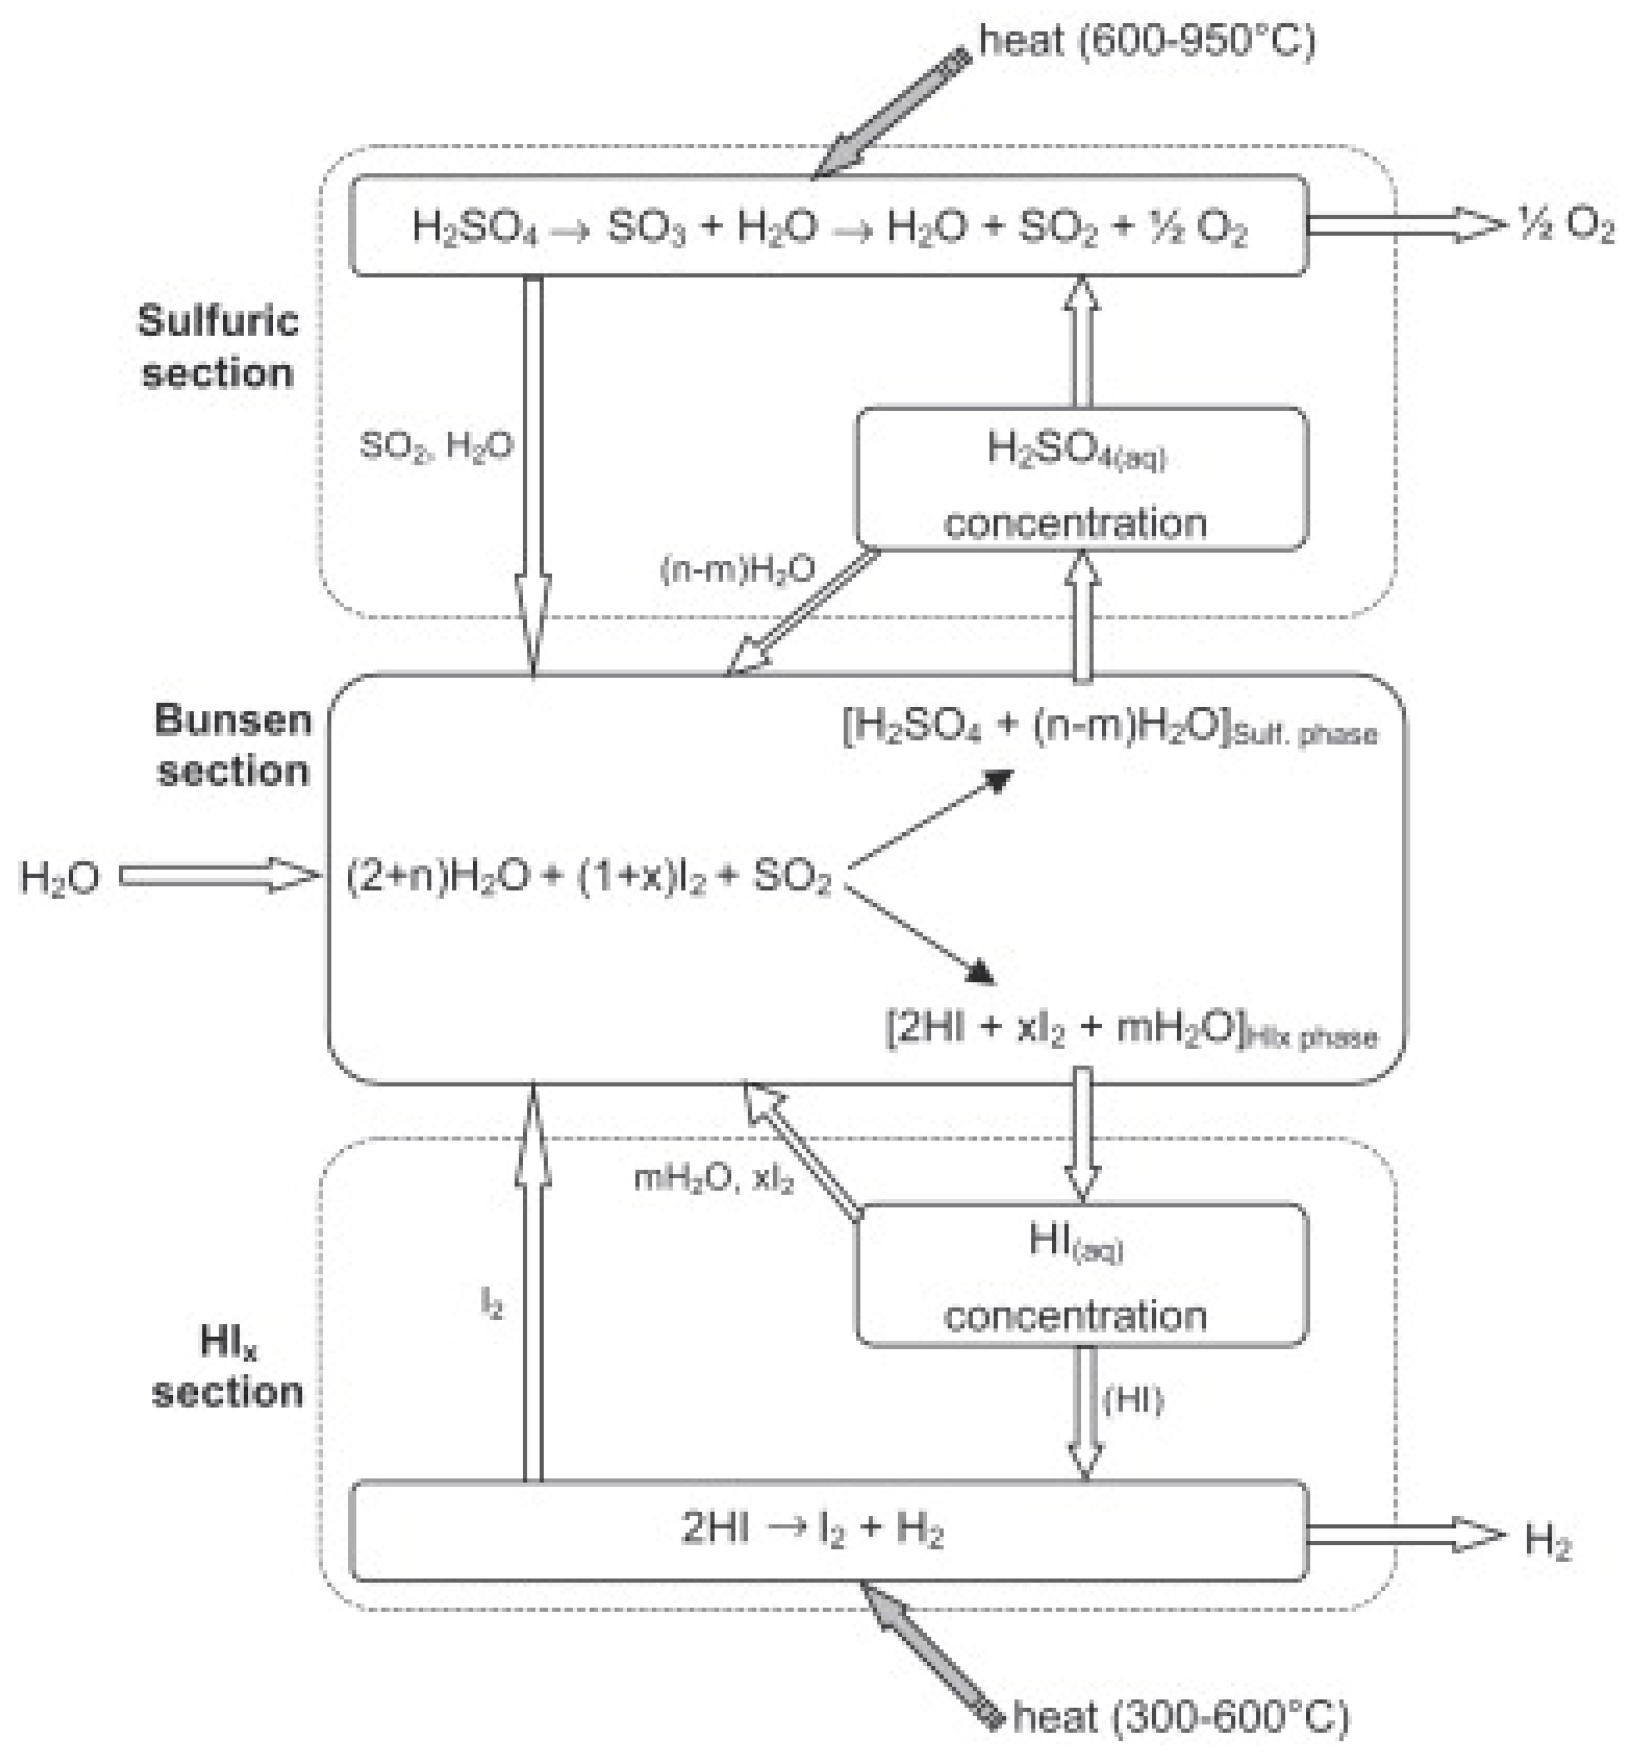
1], which consists of different steps, leading to water thermal decomposition into its former components, hydrogen and oxygen, see
Figure 1.
In particular, the cycle can be schematized with three different chemical reactions, each one represented by a section in
Figure 1:
The first reaction is also called “Bunsen reaction” and it is an exothermic process performed in liquid phase with the adsorption of sulfur dioxide; the reaction proceeds spontaneously in the 20–120 °C temperature range [
2].
The reaction products are composed of two immiscible liquid-phase systems which are the lighter one containing mostly sulfuric acid (H2SO4) and the heavier one presenting a mixture containing HIx species, i.e., chemical complexes of HI and I2 in aqueous solution.
A correct separation among these two phases is needed in order to obtain a substantial efficiency from the S-I cycle, and therefore it is necessary to use an excess of both water and iodine in the Bunsen reactor.
The decomposition of sulfuric acid (Equation (2)) is an endothermic reaction generally carried out by a two-stage catalytic reactor (H2SO4 is easily decomposed in H2O and SO3 at 400–450 °C and then SO3 is further catalytically decomposed in SO2 and O2 at 850 °C).
The section containing a mixture of iodine and iodides (HIx section), represents the most critical point of the cycle, regarding both energy consumption and global efficiency.
In fact, hydrogen iodide (HI), must be separated from the HI
x solution (HI/H
2O/I
2 mixture), exiting the Bunsen reaction, before being decomposed for hydrogen generation (3). A simple option would consist of a distillation process followed by HI thermal decomposition, however, due to the presence of an azeotropic composition in the HI/H
2O system (at about 57% w/w), distillation requires high pressures, consequently, a large thermal burden. Additionally, the low equilibrium conversion of HI decomposition (about 20% at suitable reaction temperatures) imposes a large HI recirculation rate, which results in a further increase of thermal burden and a decrease of the whole thermal efficiency. In order to overcome these problems, General Atomics studied an extractive distillation process using phosphoric acid [
1,
2,
3]. Alternatively, a reactive distillation configuration under pressurized conditions was also investigated [
4,
5,
6]. More recently, the use of electro-electrodialysis [
7,
8,
9,
10,
11,
12], pervaporation processes with cation exchange membranes [
13,
14] and membrane distillation [
15] was proposed to concentrate HI aqueous solutions. In all cases, iodine and water excess are removed from the main stream and recycled to the Bunsen reactor.
The HI/I2/H2O ternary mixture is an exceedingly complex system for the presence of different equilibrium of phases. The H2O/I2 liquid-liquid subsystem has a highly immiscible behavior with a strong tendency of the iodine to crystallize (iodine melting point is 113.6 °C). The HI/H2O subsystem, composed by strong electrolytes, shows an azeotrope at 57% in weight of HI. The decomposition reaction of HI is limited by the chemical equilibrium, and the conversion rate, at 500 °C, reaches only 22.4%. As reported, in order to obtain a proper separation of phases, an excess of iodine and water is required for the Bunsen section, consequently, a large amount of both these species, namely, 8 moles of I2 and 14 moles of H2O, is present in the HIx phase for each mole of H2 produced, leading to a significant value of energy demand. The electrodialysis process here described aims to reduce this thermal burden. More specifically, the purpose of the EED method is to concentrate the hydriodic acid above its azeotropic point (57 wt% and about 7.6 mol/L) in order to easy its separation, in gaseous state, by a post electrodialysis distillation column.
With this aim, an experimental campaign was carried out to obtain sensible data about this process, in order to show advantages and limitations of this technique, and to provide values for the EED process parameters, that is to say, the proton transport numbers and the osmosis coefficients, calculated at several voltages and temperatures. In particular, with respect to present literature, new types of electrodes were employed, which provide a similar efficiency of the ones previously proposed, made of glassy carbon [
7,
8,
9,
10,
11,
12], but do not present the problems related to iodine contamination [
15].
2. Experimental
2.1. Chemicals
The solutions used in the experimental tests were prepared using HI, 57% in weight, distilled and stabilized (Acros Organics) and iodine (Clean Consult International).
2.2. Analytical Instrumentation
For the cyclic voltammetry tests a Ecochemie-Autolab PGSTAT30 voltage generator was used, controlled by the GPES 4.7 software. With this system it was also possible to measure the electric current and the impedance using the Autolab frequency response analyser (FRA) module. The working electrode was a titanium (5 cm2) plate, previously degreased in a deionized aqueous/acetone solution under ultrasound irradiation. Platinum (8 cm2) and a saturated calomel electrode were the auxiliary and reference plates, respectively.
The SEM analysis was carried out using a FEI instrument, model Inspect S, equipped with a Genesis EDX probe.
For iodine determination and sodium hydroxide for HI quantification micro-titration (Methrom Titrando) was employed, using standardized solutions of thiosulfate and sodium hydroxide, respectively.
Regarding the measurement error, given the high precision provided by the automatic titration technique, the significant imprecision that was detected could be due to sampling and sample handling problems, especially considering the iodine’s volatility. From previous experience with the analysis of the HIx solution of the Bunsen reactor present in the S-I cycle [
16,
17], the relative error on the molar values can be roughly estimated as around 3% for HI and not less than 12% for iodine determination.
2.3. Development of the Electrodes and of the Experimental Setup for EED
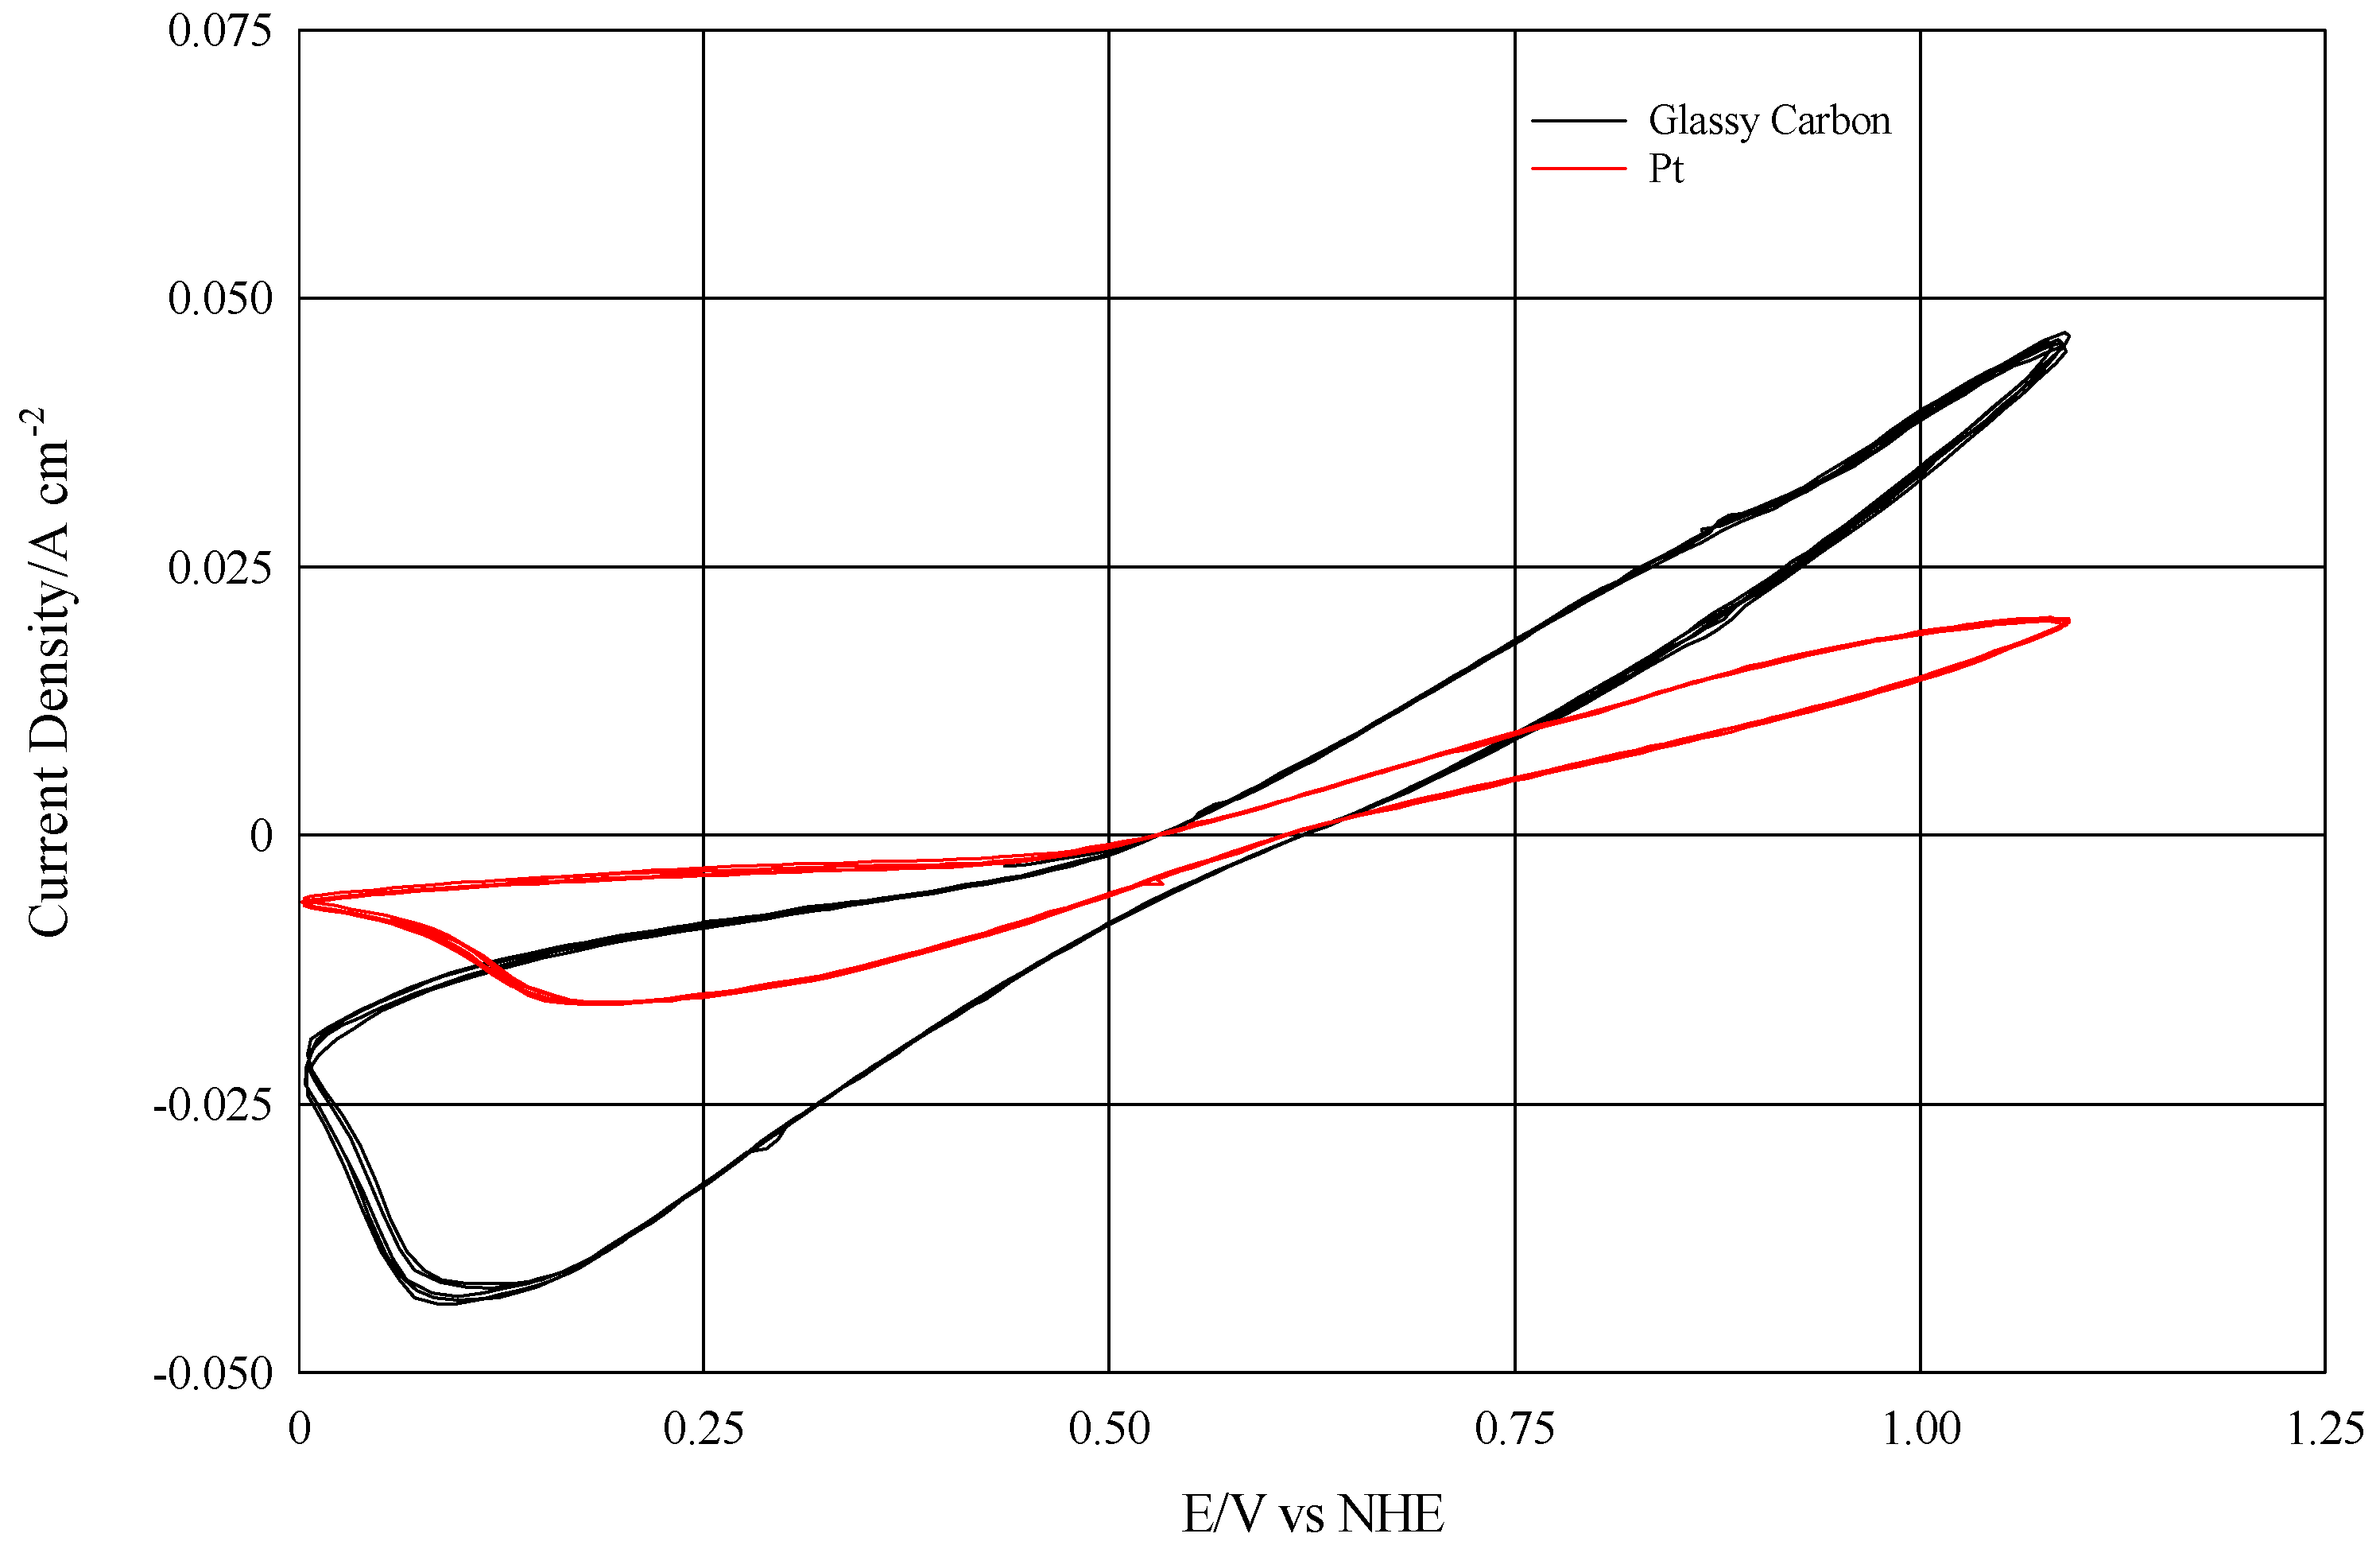
The experimental design was carried out using an electrodialysis cell mod. ED-64-002 (PCA Polymerchemie Altmeier Gmbh, Germany), whose original electrodes were replaced with home-made rhodium coated titanium electrodes. Regarding the electrode materials, the scientific literature shows that glassy carbon is catalytically active for the oxidation-reduction of the I
2/I
− pair [
7,
8,
9,
10,
11,
12], and therefore more efficient than platinum, as reported in
Figure 2.
However, it is also known that iodine has the property of intercalating within the parallel structure of the glassy carbon. This inclusion would cause an increase in volume and mechanical exfoliation of the electrode over time [
15].
A valid alternative to overcome this problem, and to maintain at the same time a good efficiency, is the deposition of a noble metal on titanium electrodes, in order to increase their kinetics, and therefore the current densities involved.
To minimize the quantity of noble metal avoiding the passivation phenomena of the electrode, a microporous titanium oxide film was produced and the noble metal was eventually deposited on it.
Titanium plates (Titania, Italy) with an area of 112 cm
2, were used to produce two electrodes similar to the ED-64-002 original ones. The electrodes were cleaned by an ultrasonic bath in ethyl alcohol. After 3 min of pickling in a HF (Carlo Erba)/HNO
3 (Carlo Erba) solution, in a volumetric ratio of 1:3, and diluted in deionized water until to 100 mL, each titanium electrode was oxidized using a two-electrode cell (the counter-electrode was a platinum gauge), containing a H
2SO
4 1 M solution (Carlo Erba) at 25 °C, and subjected to a prefixed and optimized density current (40 mA·cm
−2), generated by a potentiostat/galvanostat (Ecochemie). The oxidation current was applied to the titanium electrode until a voltage of 100 V was reached and a uniform and dense grey TiO
2 layer was deposited onto the surface.
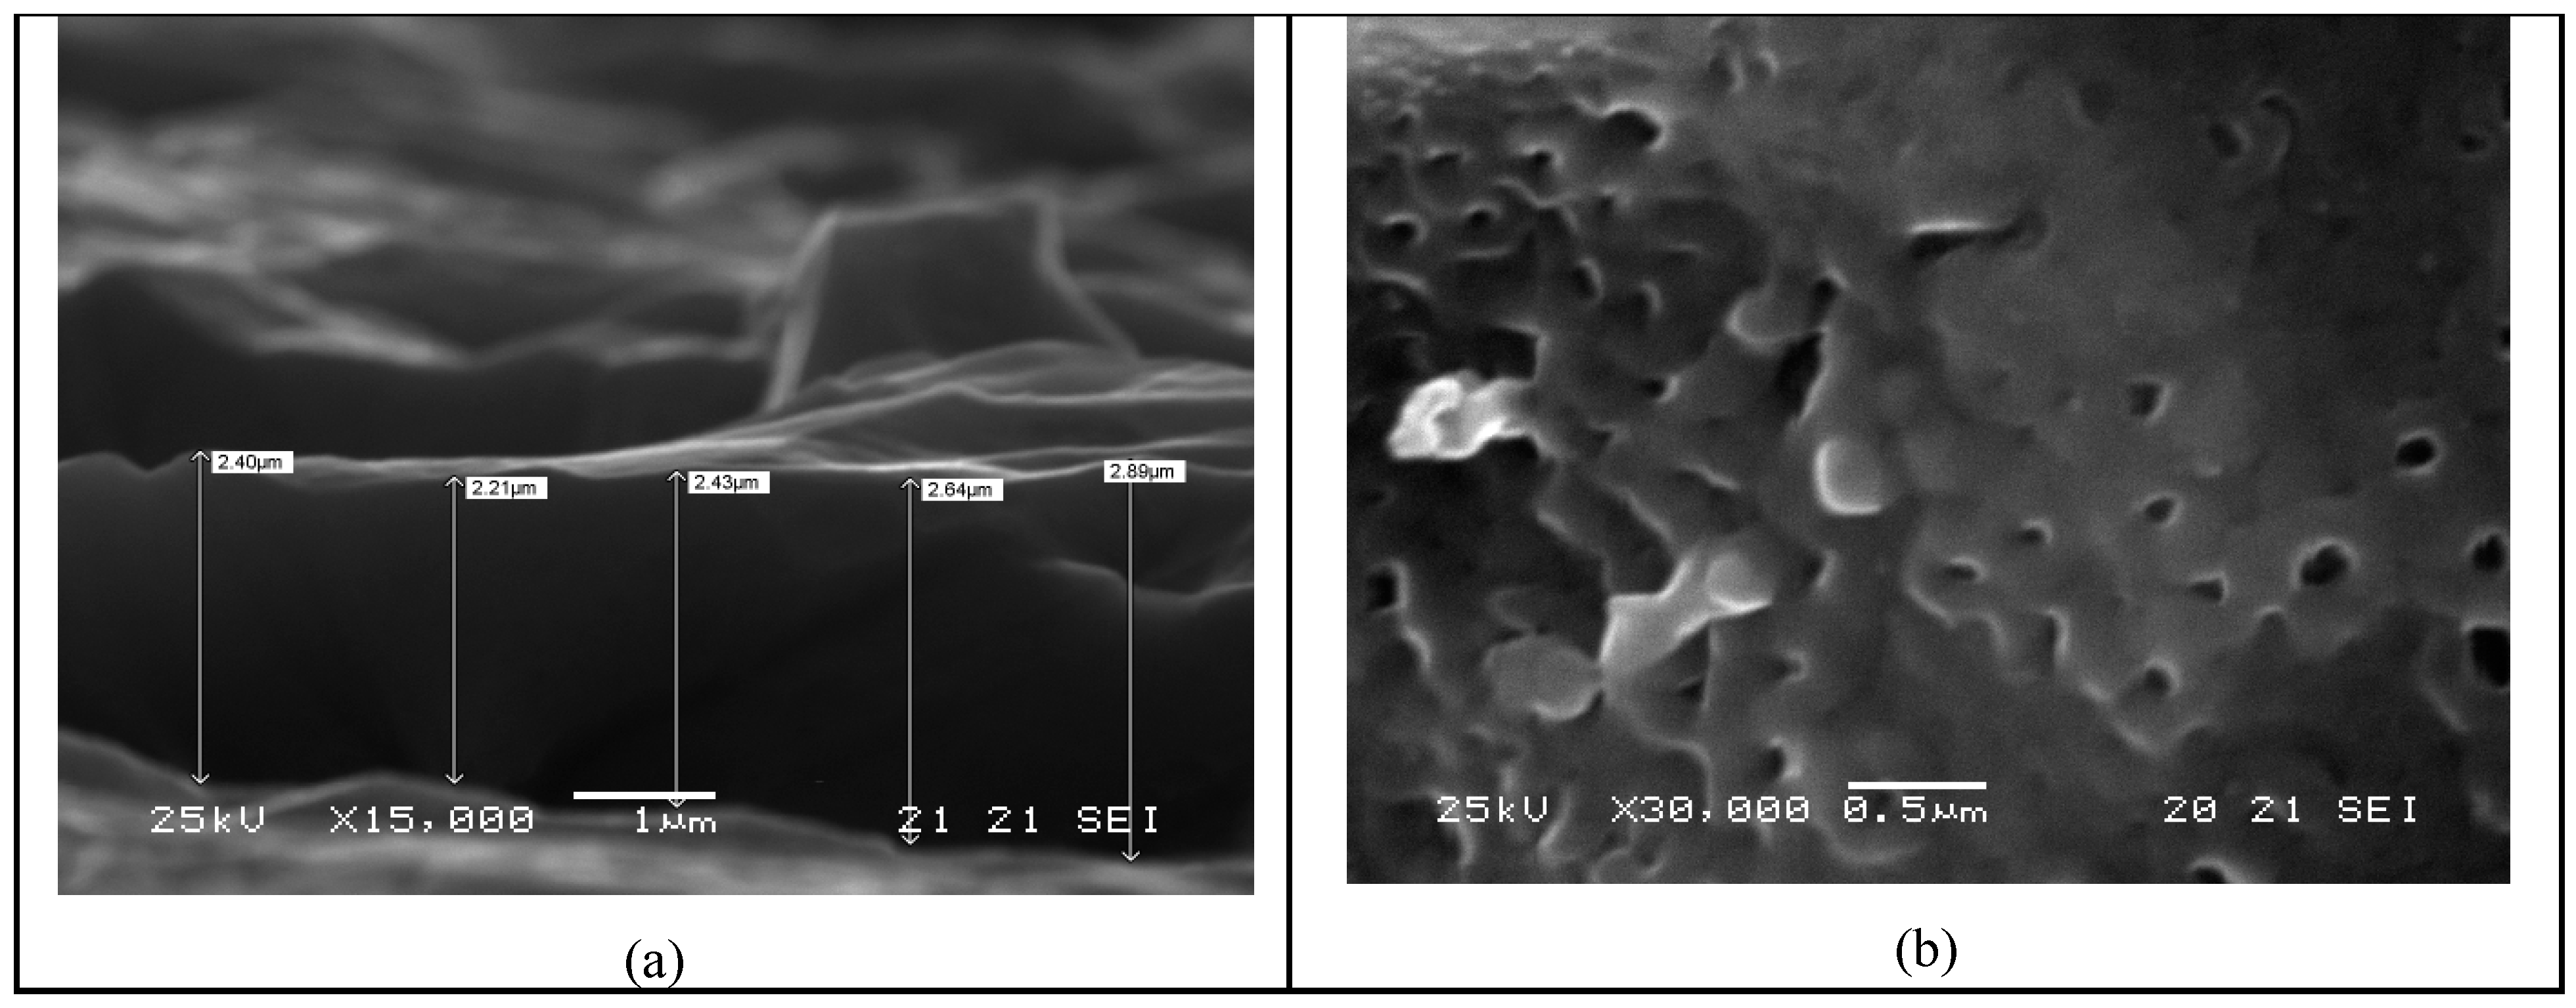
Figure 3 shows the SEM analysis of the produced Ti/TiO
2 material. After this anodization treatment, the electrodes were washed in water and carefully dried.
The rhodium coating took place similar to the above configuration, by multiple pulse galvanostatic electrodeposition. The electrodeposition bath was rhodium sulphate (Rh 5 g L−1) in H2SO4 1 M at 25 °C. A pulse current density of −2 mA cm–2 was applied for 0.25 s followed by a pause of 0.5 s. Three thousand pulses were applied in order to obtain a total charge equivalent to a rhodium loading of 0.53 mg cm−2. The final superficial area of the Ti/TiO2/Rh electrodes was 7.5 × 7.5 cm2.
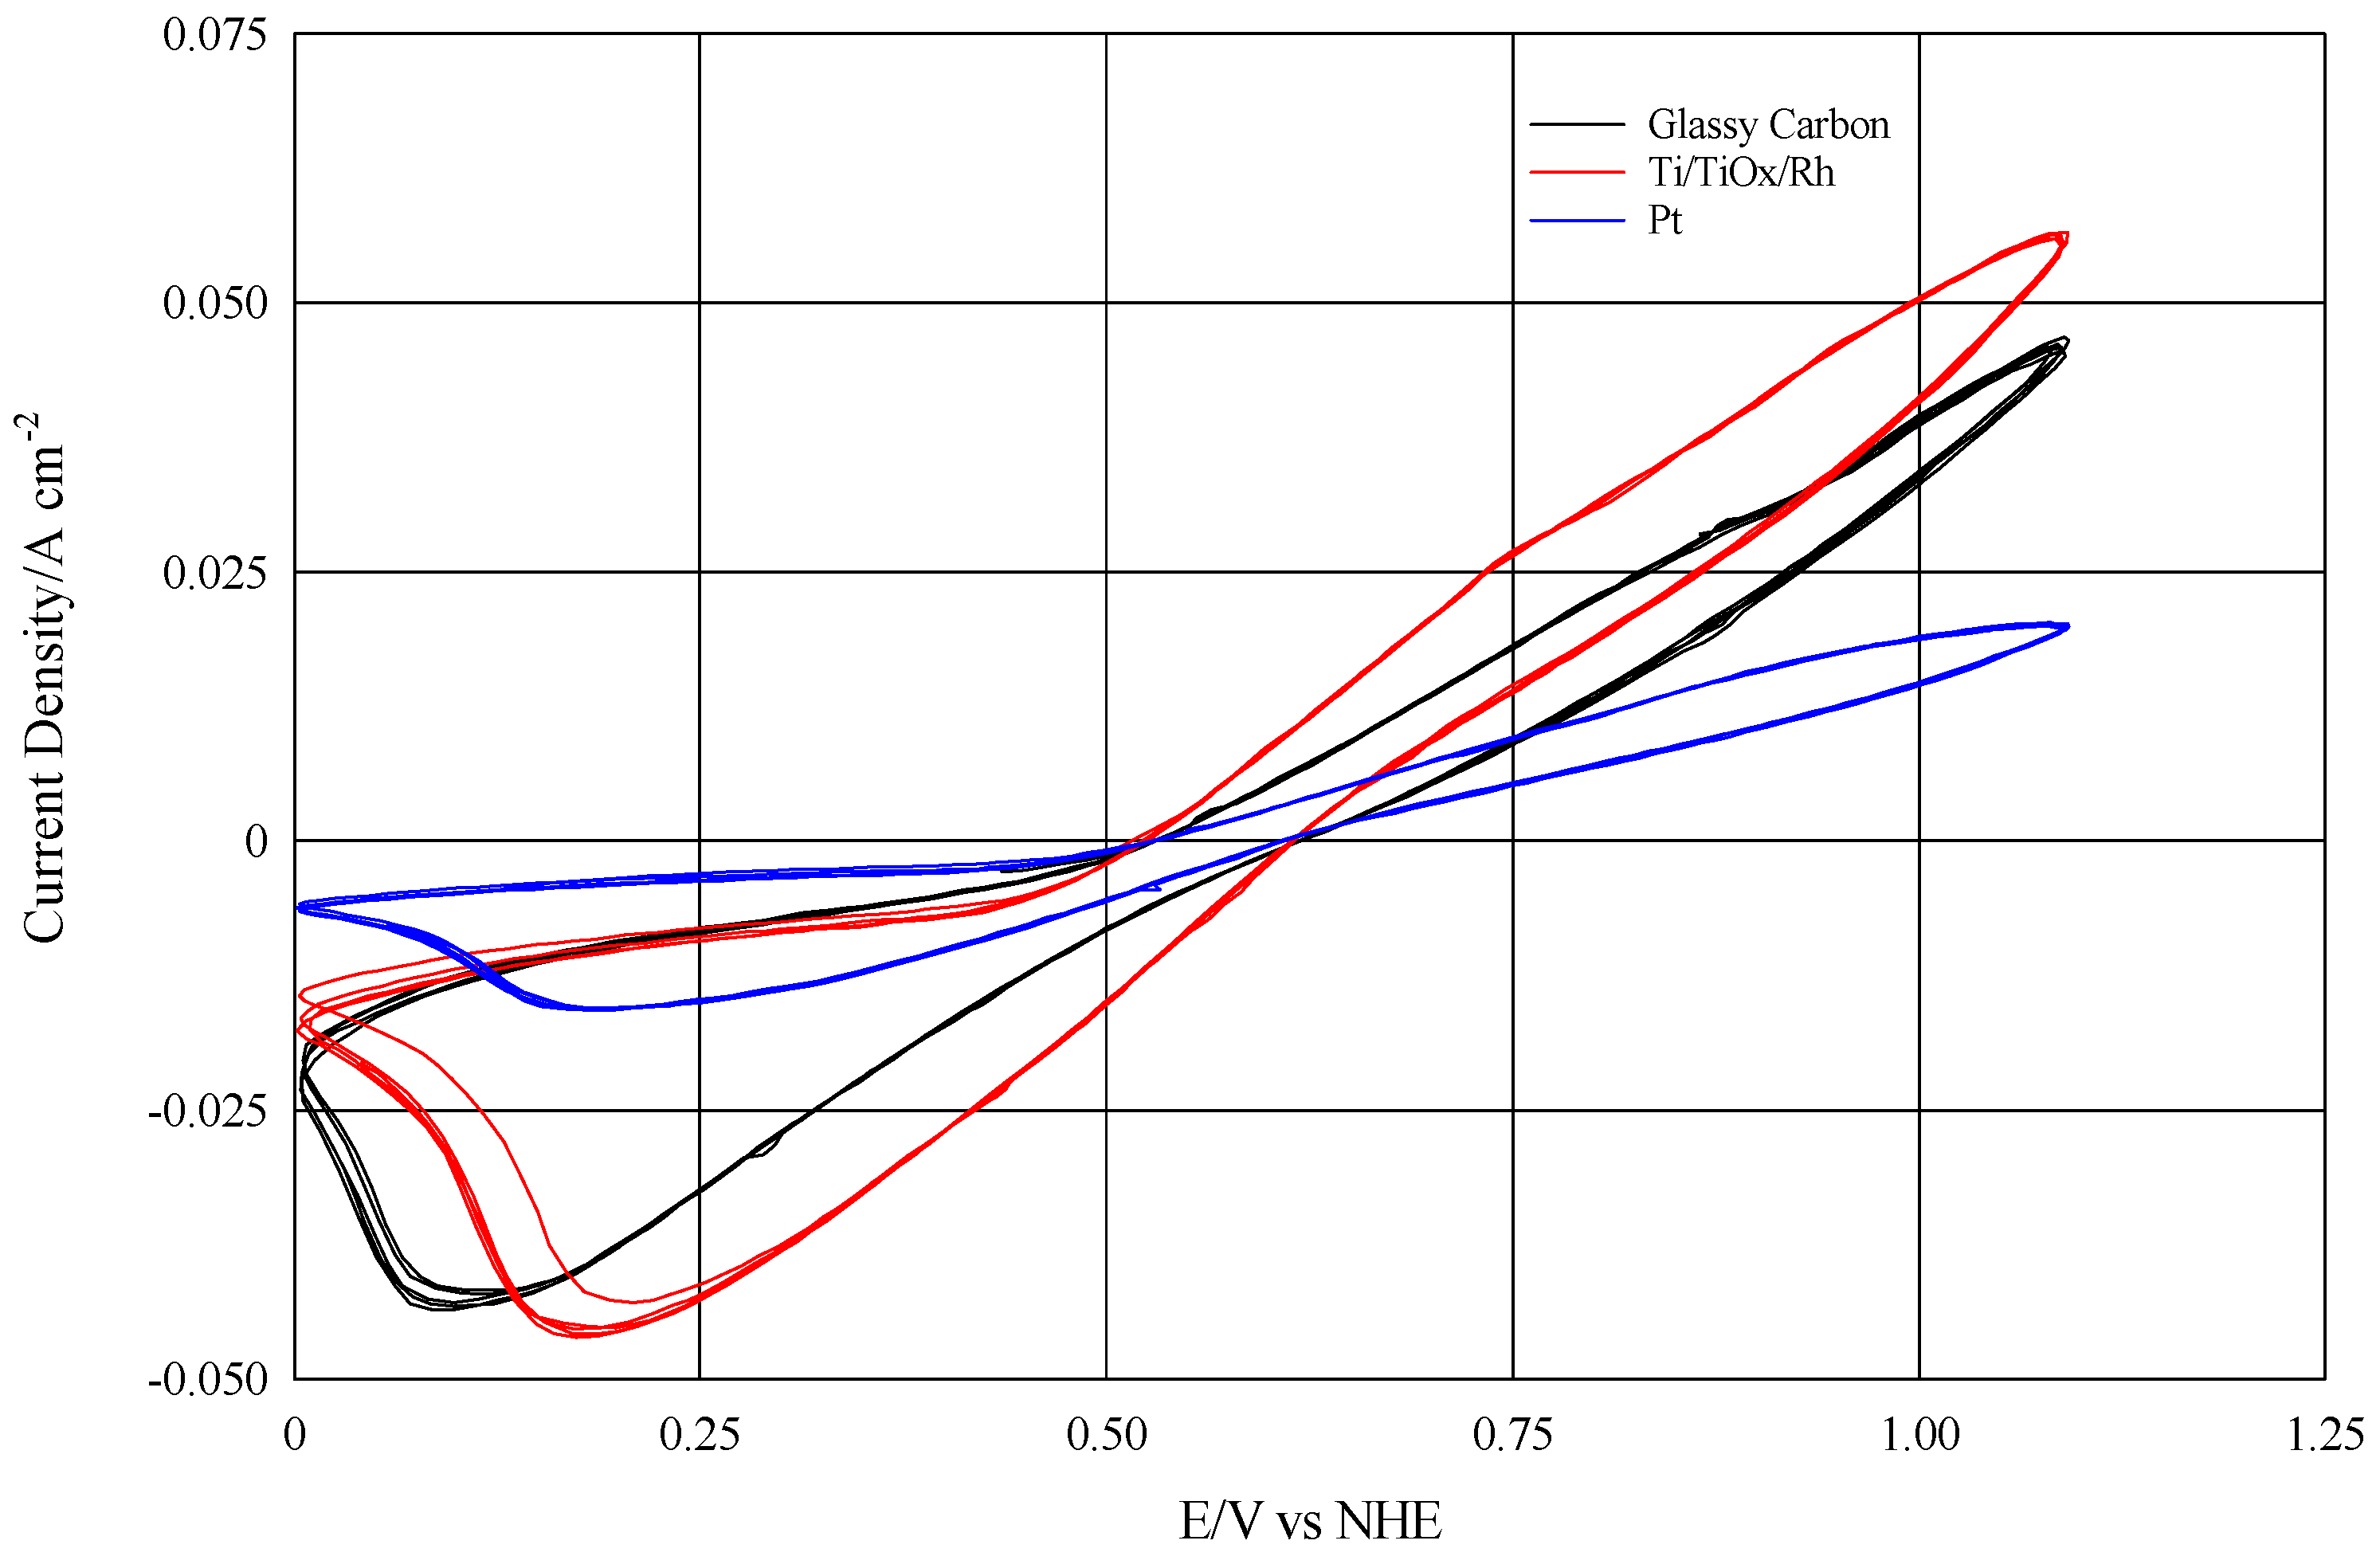
In order to verify the efficiency of the rhodiate titanium electrodes, a cyclic voltammetry test was carried out, comparing those plates with glassy carbon and flat platinum electrodes. The results shown in
Figure 4 clearly demonstrated that the current density with the Ti/Rh plate was even higher than the one presented by the glassy carbon electrode.
Table 1 summarizes the results, also highlighting the behavior of a Ti/TiO
2 electrode only partly rhodiated.
Therefore, it was shown that appropriately modified titanium electrodes coated with metallic rhodium are capable of optimally catalyzing the I2/I− reaction. In particular, with a pulsed electrodeposition technique it is possible to obtain current densities higher than those obtained on platinum electrodes even at very low rhodium deposited values.
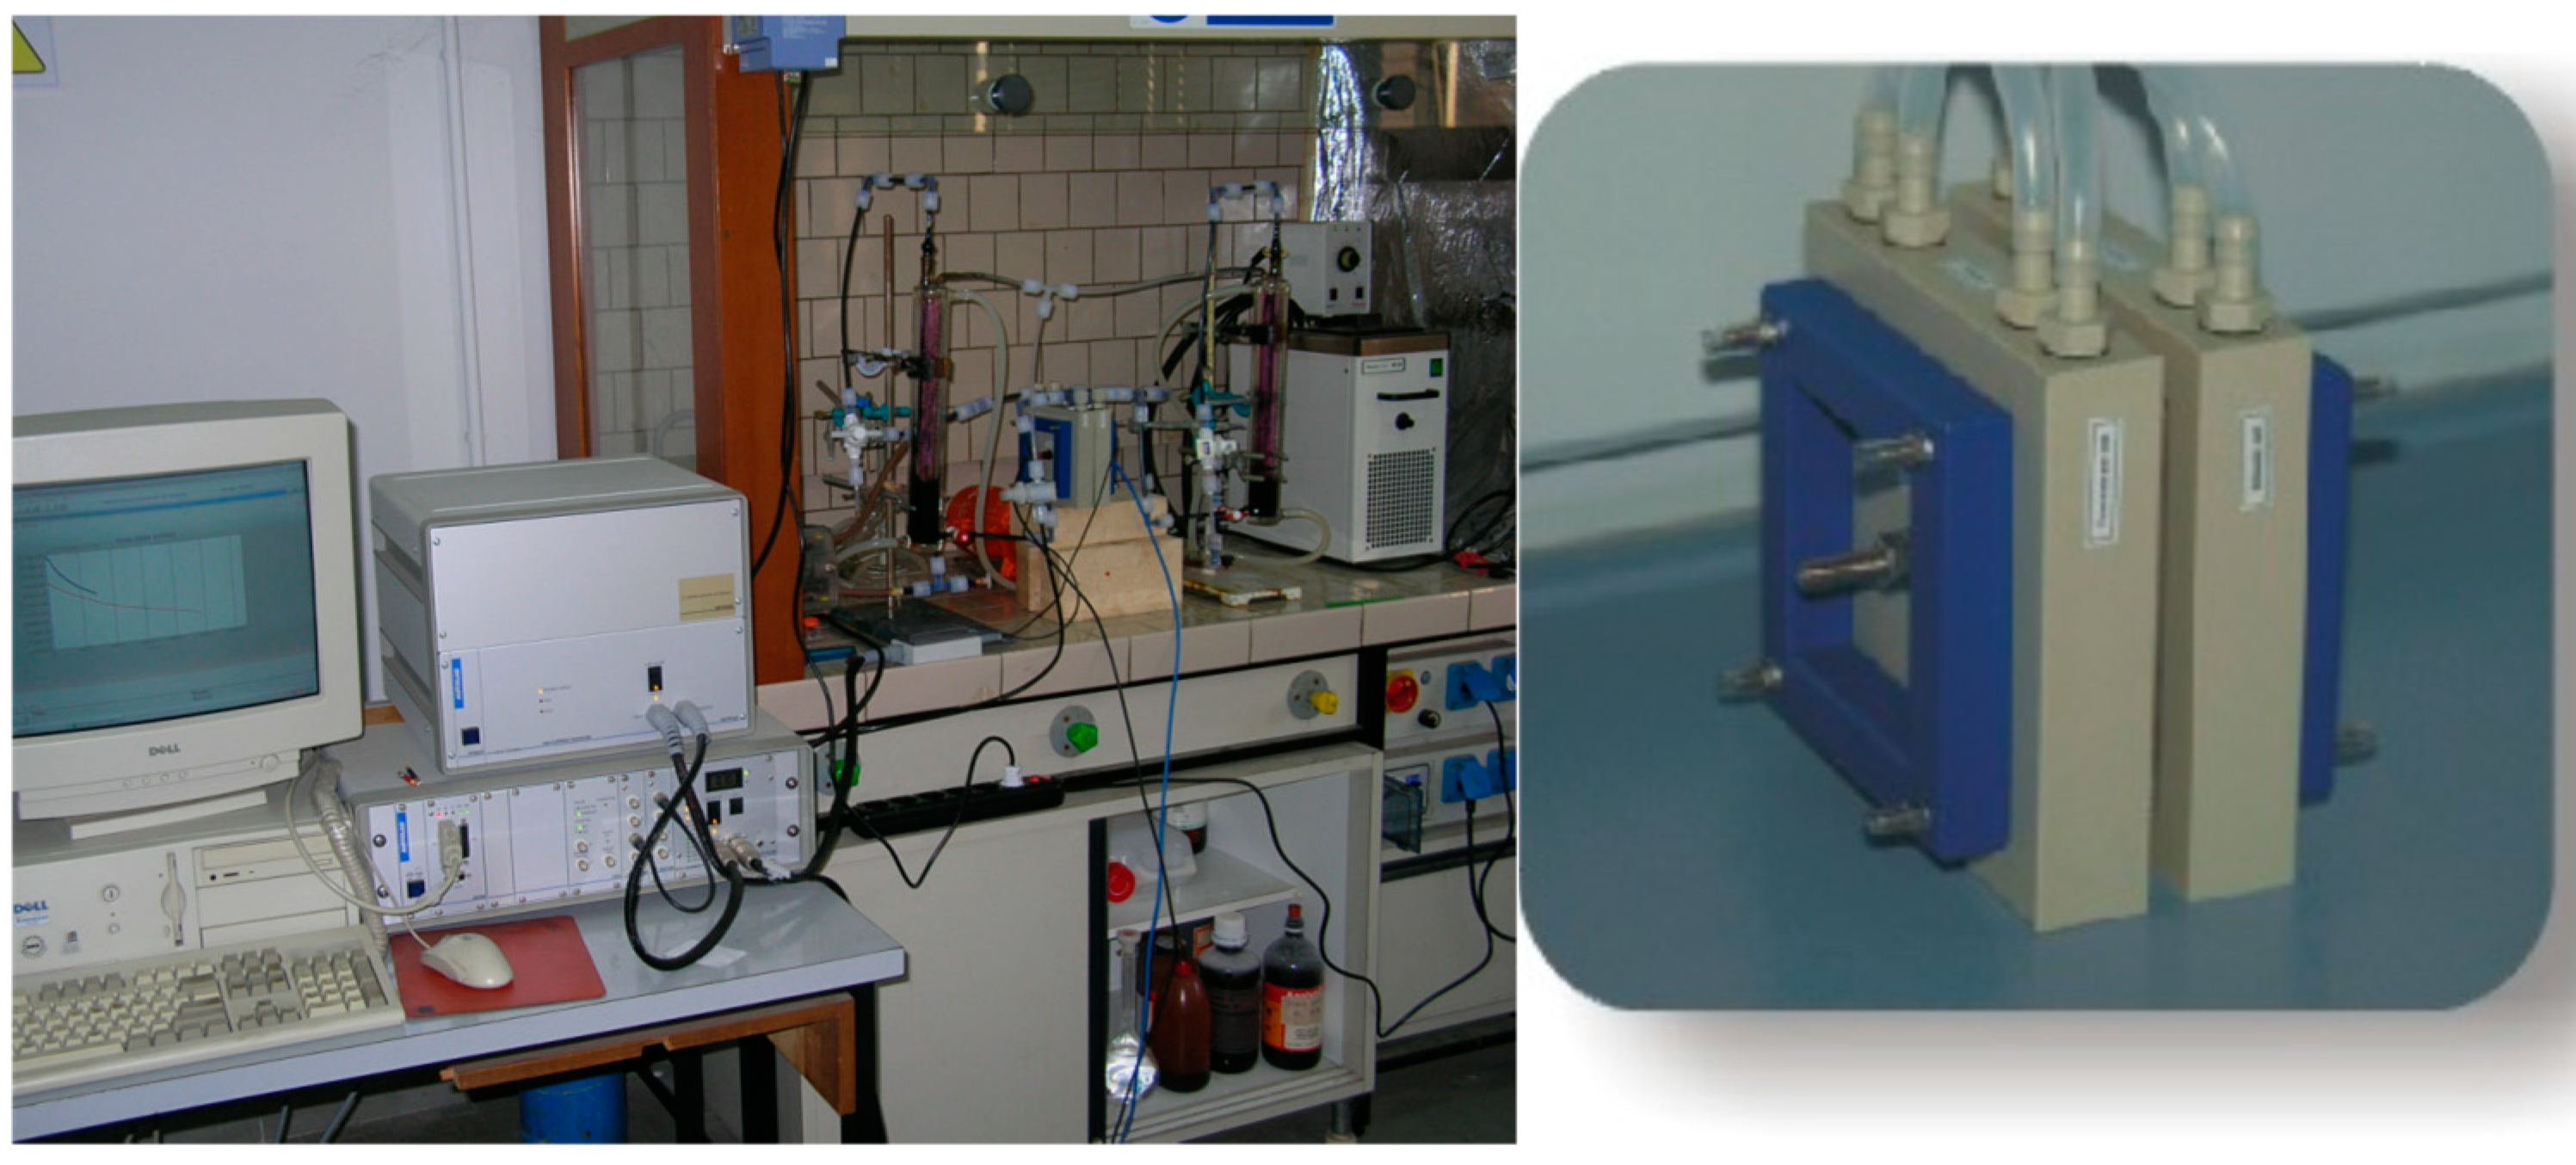
Electrodialysis measurements were performed using an Autolab Pgstat30 potentiostat (Ecochemie) interfaced with a current booster BSTR20A, necessary to work with electric currents up to 20 A employing a GPES 4.7 control software. Impedance measurements were performed at open circuit voltage (OCV) with an AC signal of 10 mV of 1–10,000 Hz using the FRA module.
A Nafion 117 (Du Pont’s) cation-exchange membrane with an active surface of 64 cm2 (8 cm × 8 cm) was used as electrolyte.
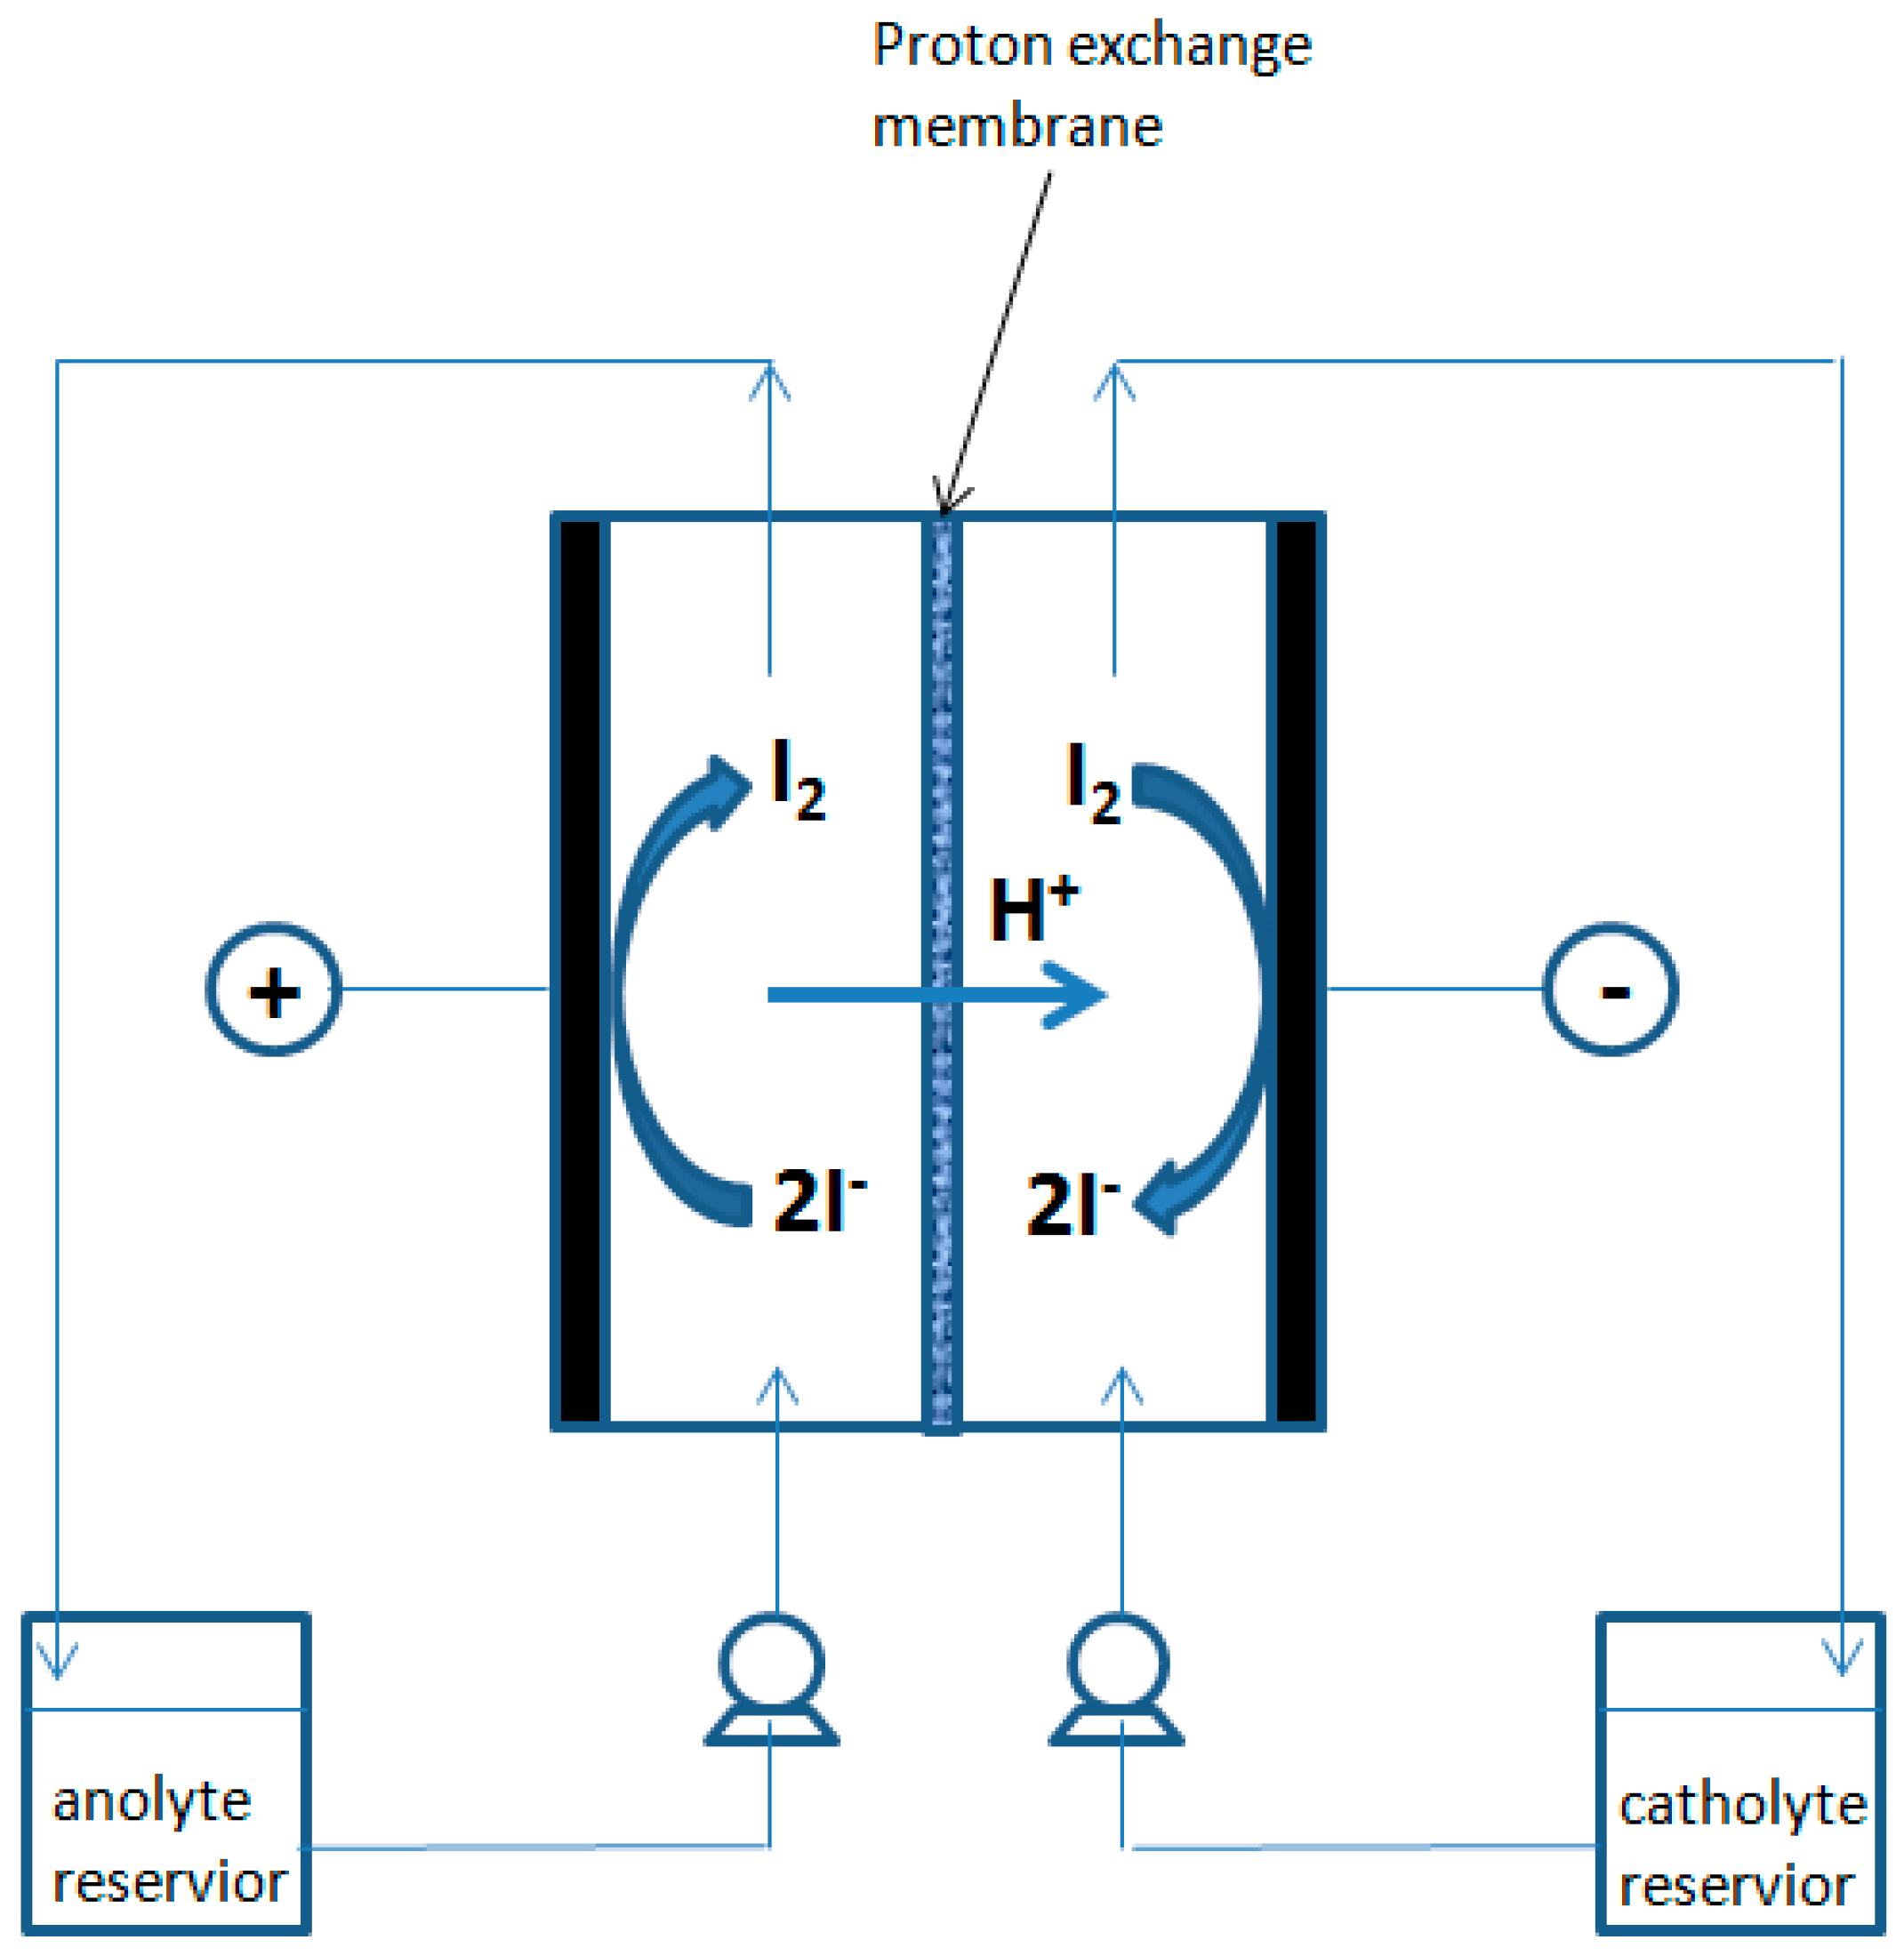
The mixtures subjected to electrodialysis were contained in two reservoirs, each having a volume of 300 mL, packed in a warming jacket as shown in
Figure 5 and
Figure 6. The mixture’s circulation were assured by two Watson Marlow peristaltic pumps and the circulation rate was controlled by changing the pump spinning rate (50 mL min
−1).
2.4. Concentration by EED
Experimental tests were performed at constant voltage. At the beginning of each test, 300 mL of hydriodic mixture were loaded in each reservoir.
Two kinds of iodidric mixture were employed: one called “simil-Bunsen mixture” (HI ≈ 3M, I2 ≈ 3.2 M), whose composition is very similar to the one obtained from the real Bunsen reactor and a second one called “mixture II” (HI ≈ 4.5 M, I2 ≈ 0.8 M) containing only one fraction of the HI and iodine present in the simil-Bunsen mixture.
Mixture II was used to overcome problems of bad circulation due to the presence of crystallized I2. Each test lasted 4 h, and each hour samples of both anolyte and catholyte were taken for analysis.
The composition of the samples was then determined by micro-titration.
2.5. TransportPproperties of the Membrane and Energy Consumption
The membrane characteristics were studied by the following two parameters: the apparent transport number of proton (t+) and the apparent coefficient of electro-osmosis (β).
The apparent transport number shows the ion amount passing through the membrane due to a given driving force.
The electro-osmosis coefficient indicates the water quantity passing through the membrane by means of the solvated ions.
The changes in the measured amounts of respective species, HI and H
2O, were used to calculate the apparent transport number of proton (t
+) and the apparent electro-osmosis coefficient (β), in the catholyte part. The transport properties were calculated by the following equations, derived from mass balance calculations in the catholyte section, taking into account the changes due to electrode reaction:
Here ΔM, t, I, and F indicates, respectively, the molar variation of HI and H2O amounts in the catholyte section, the EED process times (corresponding to a total of 4 h in the reported data), the electric current (in ampere), and the Faraday constant.
In order to obtain the values of t+ and ß, the weight changes, due to the EED process, of anolyte and catholyte solutions have to be measured, and this can only be done at the end of the experiments, by collecting the anolyte and catholyte solutions, the obtained t+ and β are average values representative of all the period of the EED experiment considered.
The electric power consumption of the EED cell depends on the potential drop across the cell (
V) and the current applied (
I) as shown in Equation (6), where t is the electrodialysis time:
The molarity variations of HI in the catholyte section and I2 in the anolyte section were reported in order to obtain trends for easy comparisons.
3. Results
3.1. Concentration by EED
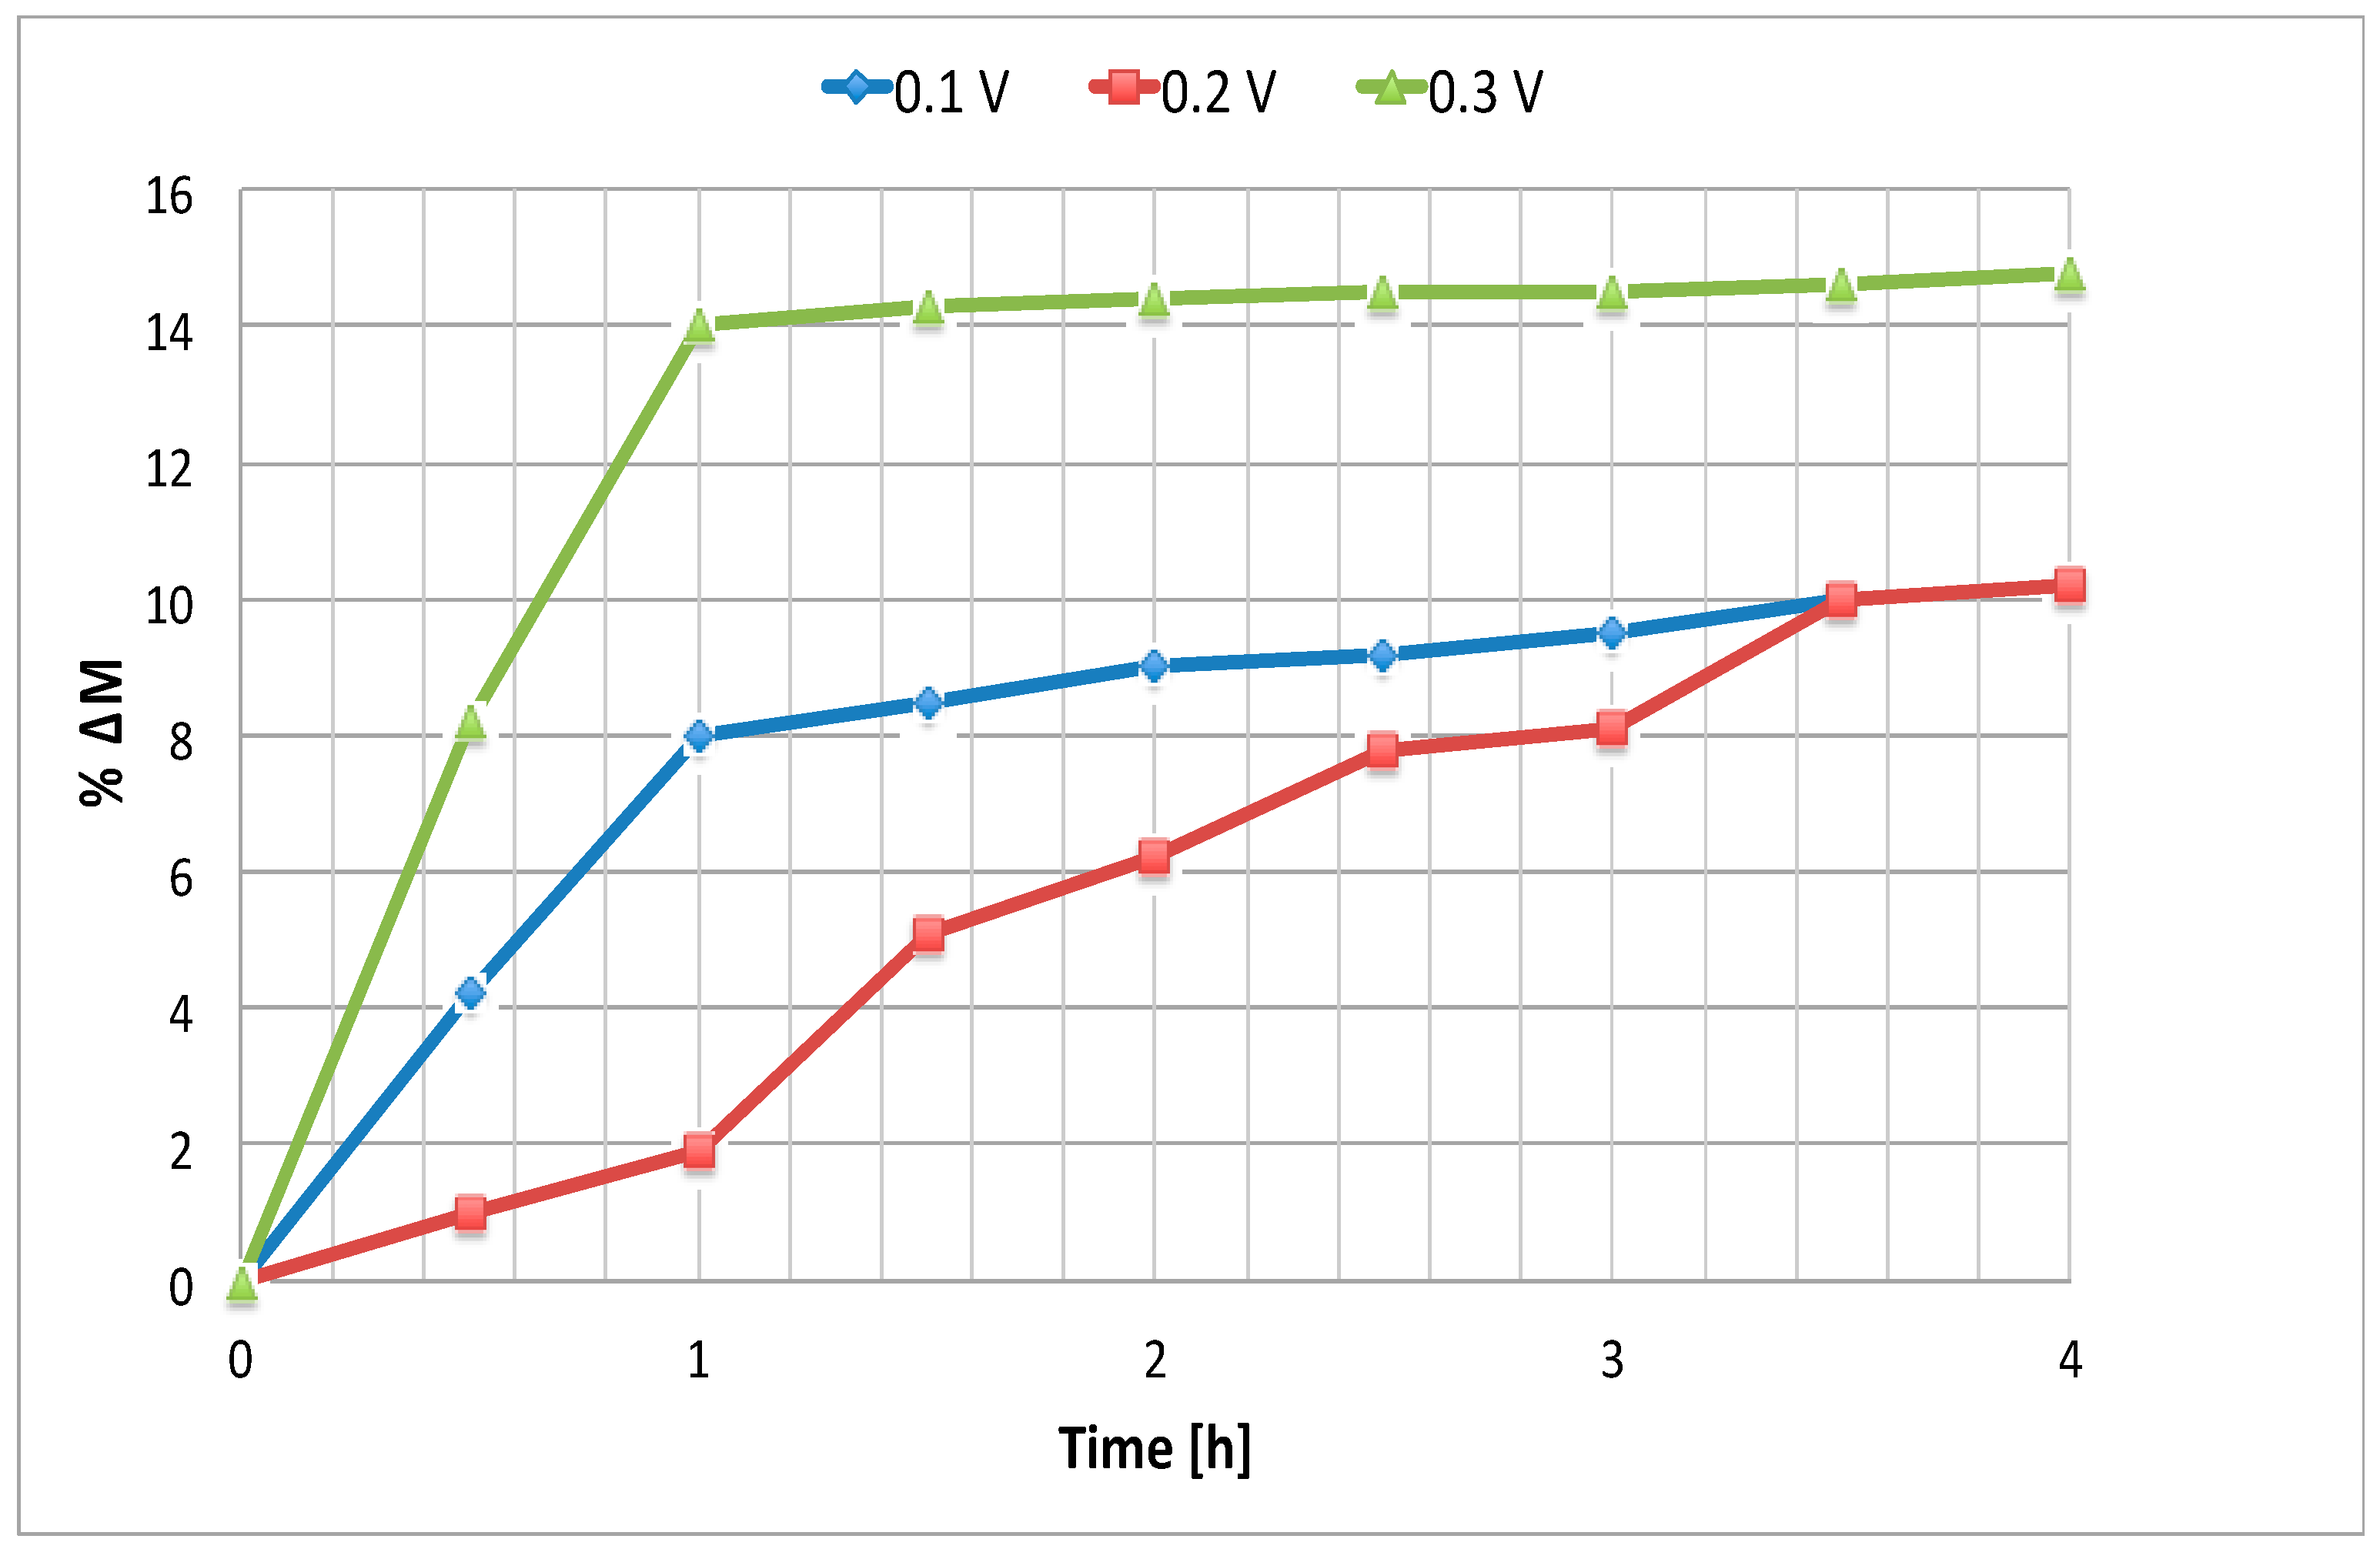
Electrodialysis tests were performed varying the electric voltage applied to cell and mixtures temperature. The following figures show the results obtained with the mixture II composition, i.e., with relatively low iodine concentration.
Figure 7 shows the trend of HI percentage increase with respect to the initial molarity versus time, applying three different voltage values at 25 °C. In
Figure 8 temperature was varied, maintaining the voltage at 0.1 V.
As shown in
Figure 7, the expected proportionality between the applied driving force and the separation rate measured by the change in HI molarity become significant at 0.3 V. A clearer way to appreciate the voltage effect on the separation process is to consider the apparent proton transport number, as shown below. It is interesting to note that at short periods of time the cathodic HI molarity increase is less at 0.2V than at 0.1 V. This is due to the increase of the electro-osmosis factor, which leads to HI. This effect is overcome at higher voltages, such as 0.3 V.
Concerning temperature, it is clear, also within the experimental error, that an increase of this parameter affects negatively the electrodialysis process, leading to the necessity to select room temperature for the separation.
The obtained experimental data were used to calculate the apparent transport number of proton (t+) and apparent electro-osmosis coefficient (β).
The water contained in each sample was obtained from the difference among the samples overall weight and the HI and I2 quantities obtained by means of titration.
For this reason, the calculated water amounts can be affected from a substantial experimental error, nevertheless, considering that the β parameter can be independently calculated using both the cathodic and anodic concentrations, it was possible to cross-check the two obtained values, and accept only the electro-osmosis coefficients resulting equal to each other.
The apparent transport number increased with the applied voltage from 0.76 to 0.81 and 0.86 (
Table 1), also it virtually did not change with temperature, remaining constant at a value around 0.75.
Regarding the electro-osmosis coefficient at 25 °C (
Table 1), β increased from 1.09 mol F
−1 (at 0.1 V) to 1.16 mol /F
−1 (at 0.3 V). At 0.1 V and in the temperature range 25–85 °C, it was possible to observe that increasing temperature influenced β marginally, which maintained a value of about 1.08 mol F
−1. The impact over the system performance was almost null, and as already reported, the trend of concentration was steady at every temperature level for both HI and the iodine.
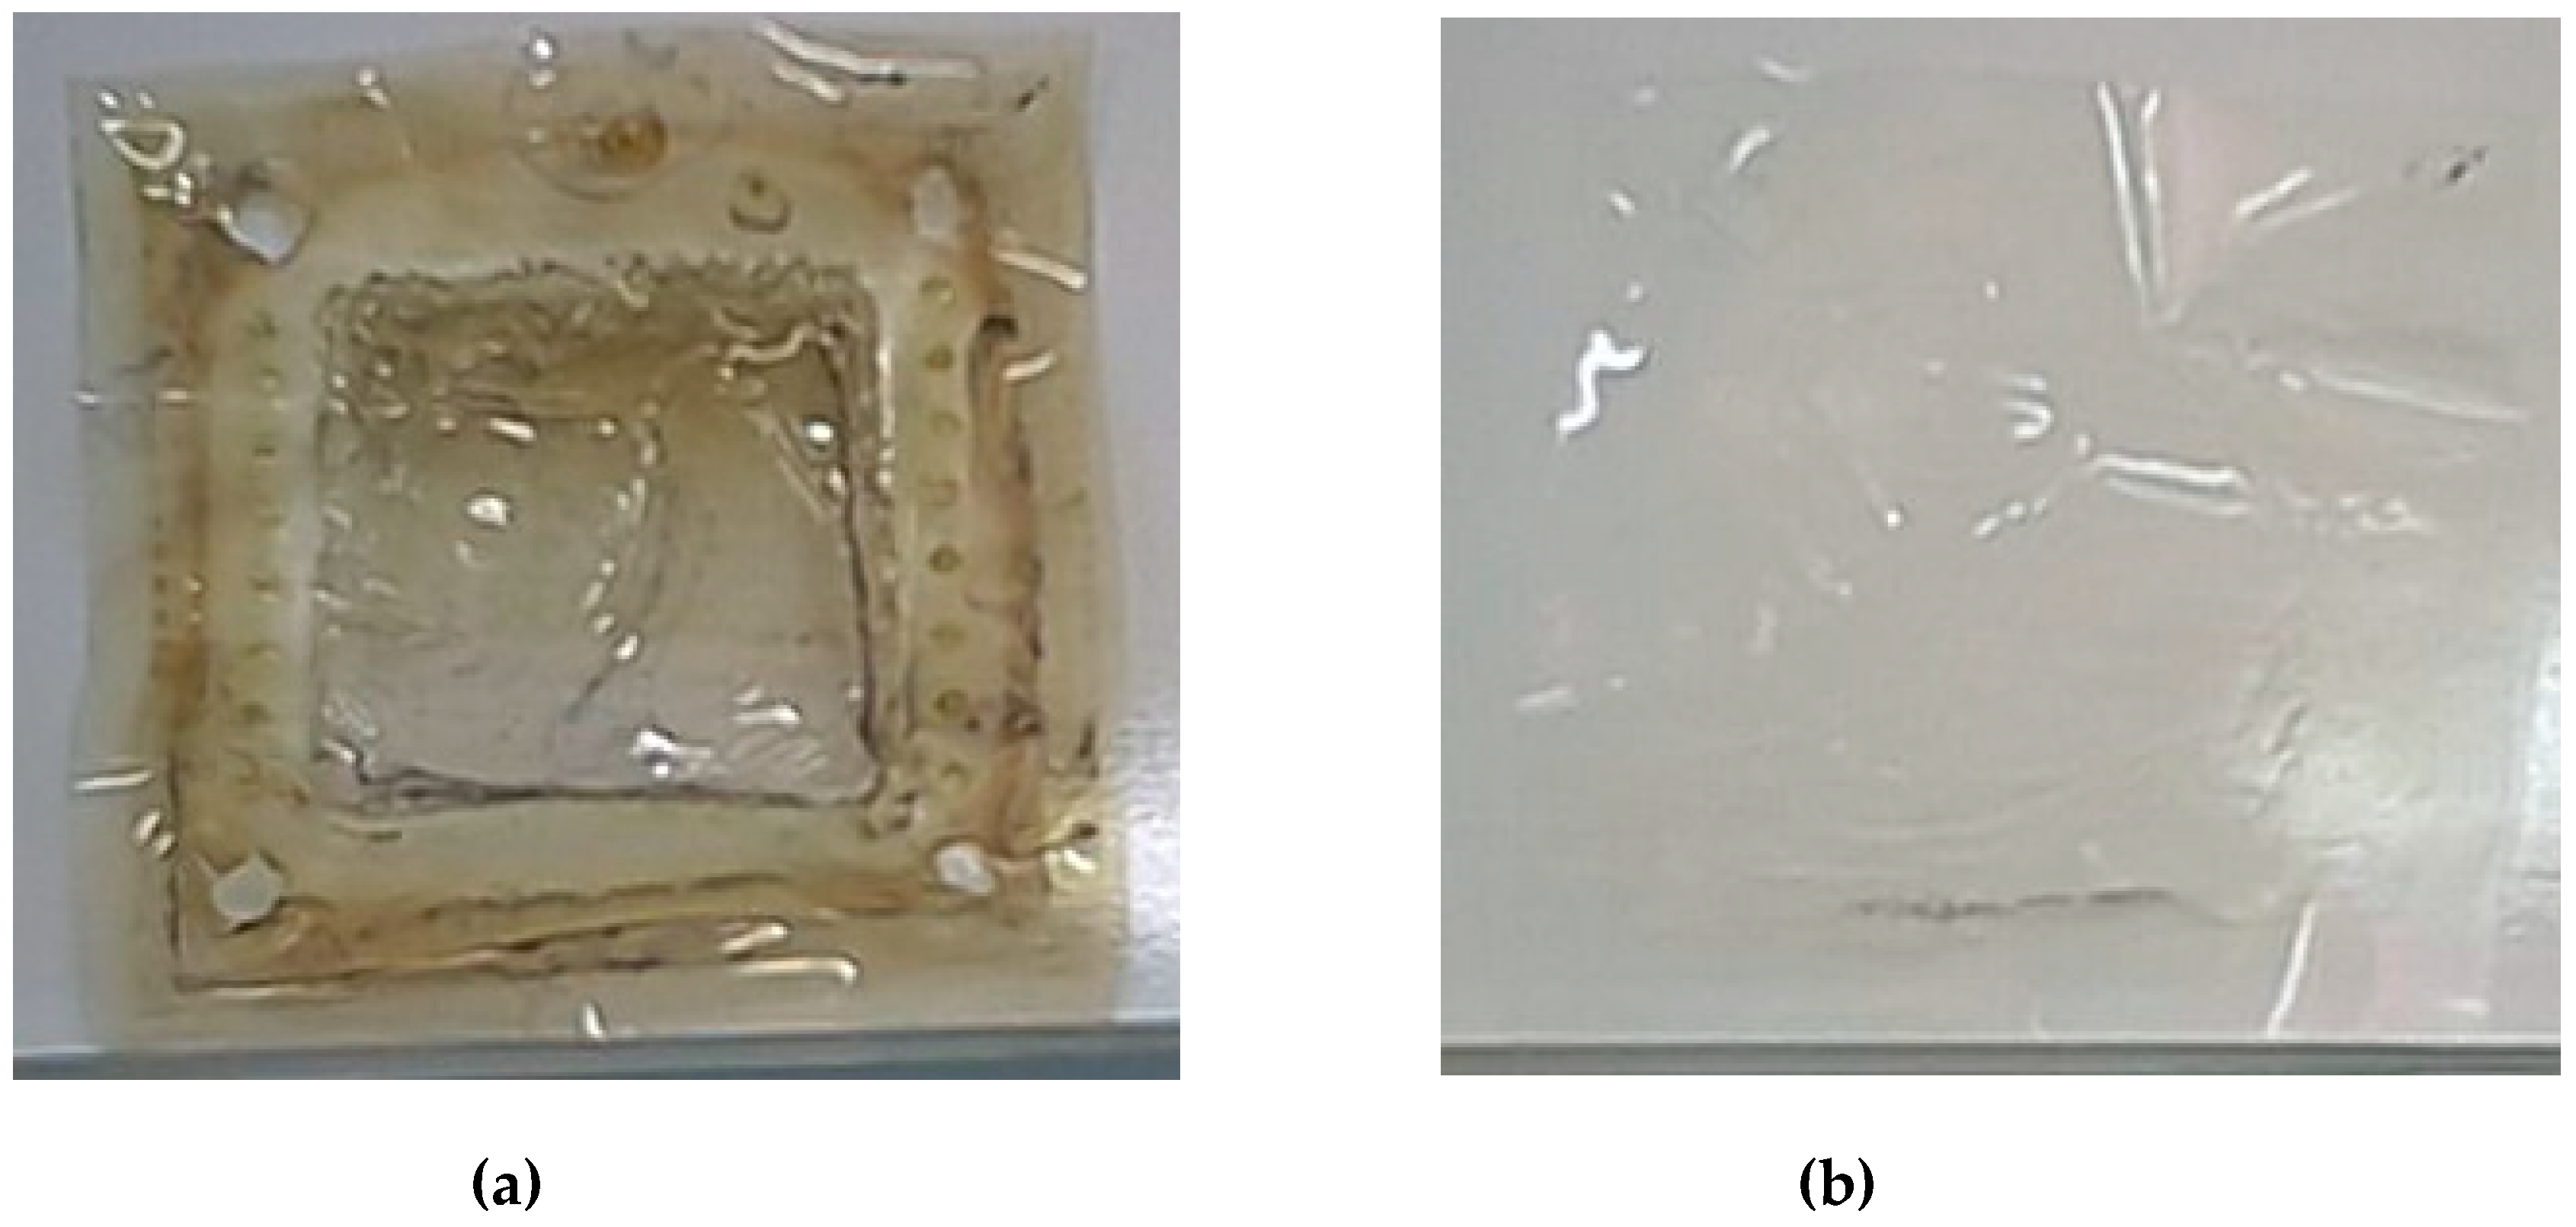
3.2. Durability of the Membrane and of the Electrodes in the HIx Solution
The impedance of the cell was measured before and after each test in order to verify the corrosion of electrodes and/or the membrane degradation through the iodidric mixtures. The Ohmic resistance of the cell was constant (4.5 Ohm/cm
2), therefore, evidencing the stability of the components. In addition, the examination of the titanium-rhodium electrodes and of the membrane (see
Figure 9) after the tests campaign showed the resilient behavior of both elements against the iodide mixture.
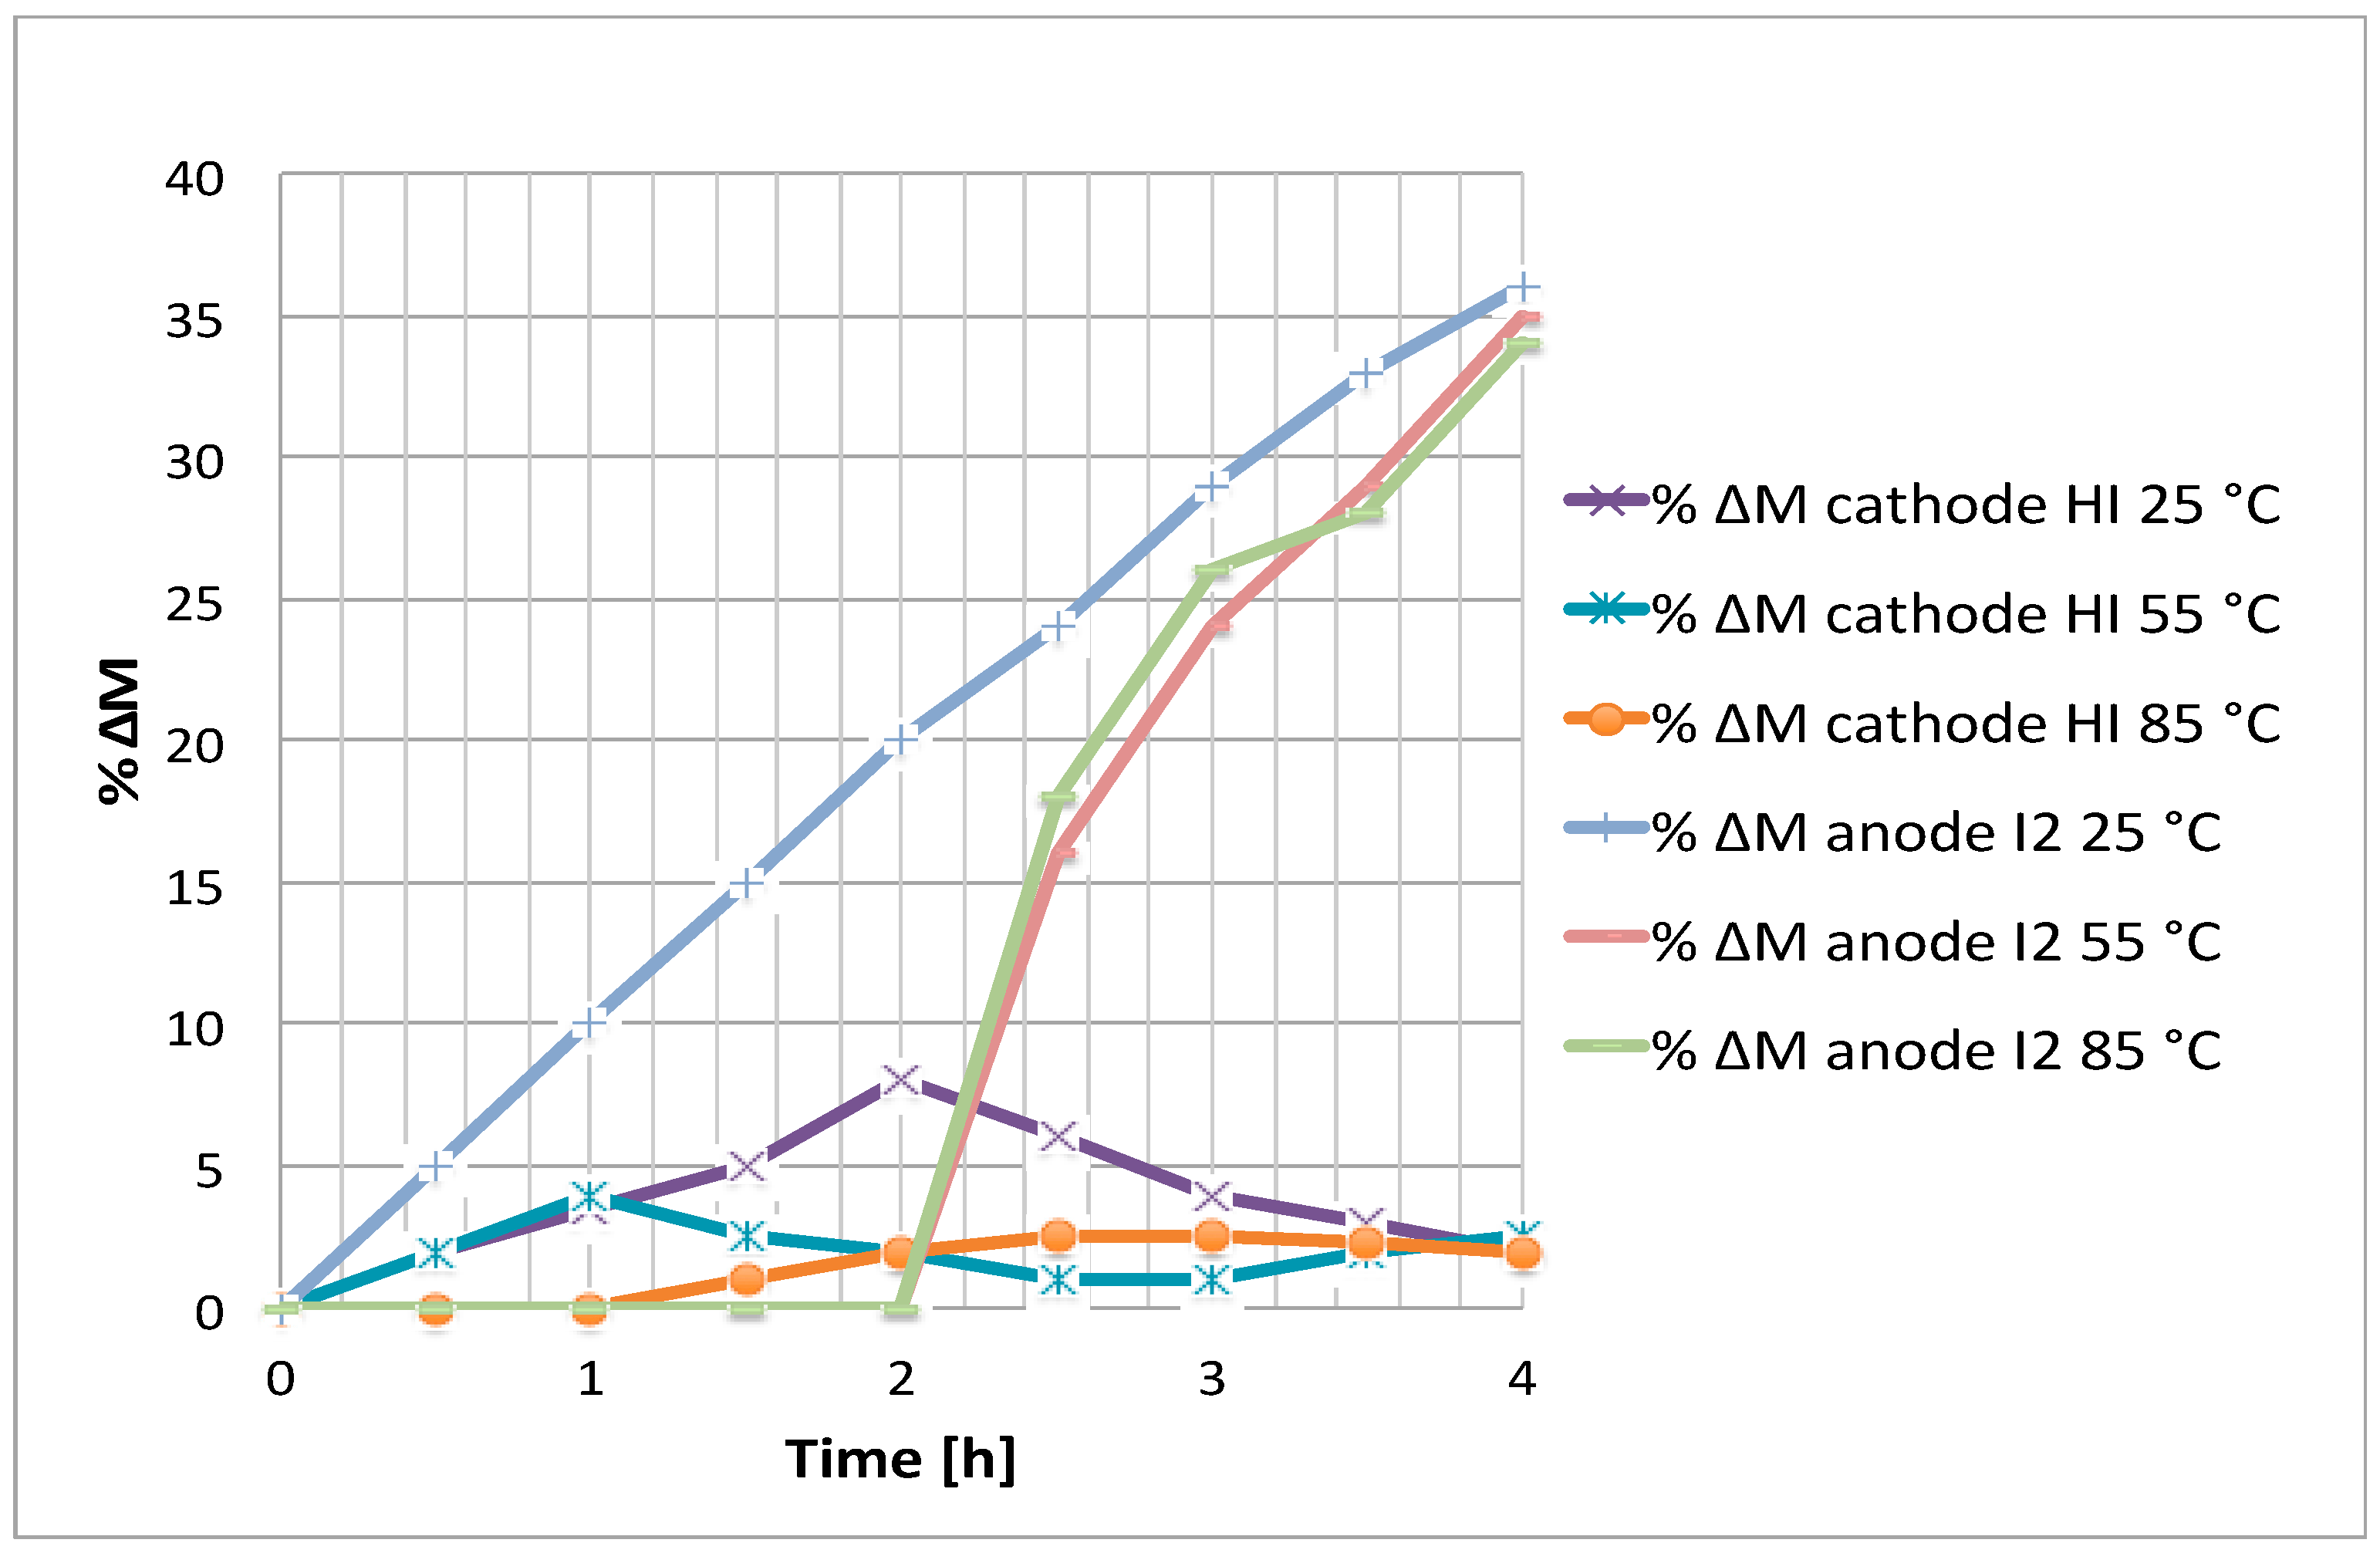
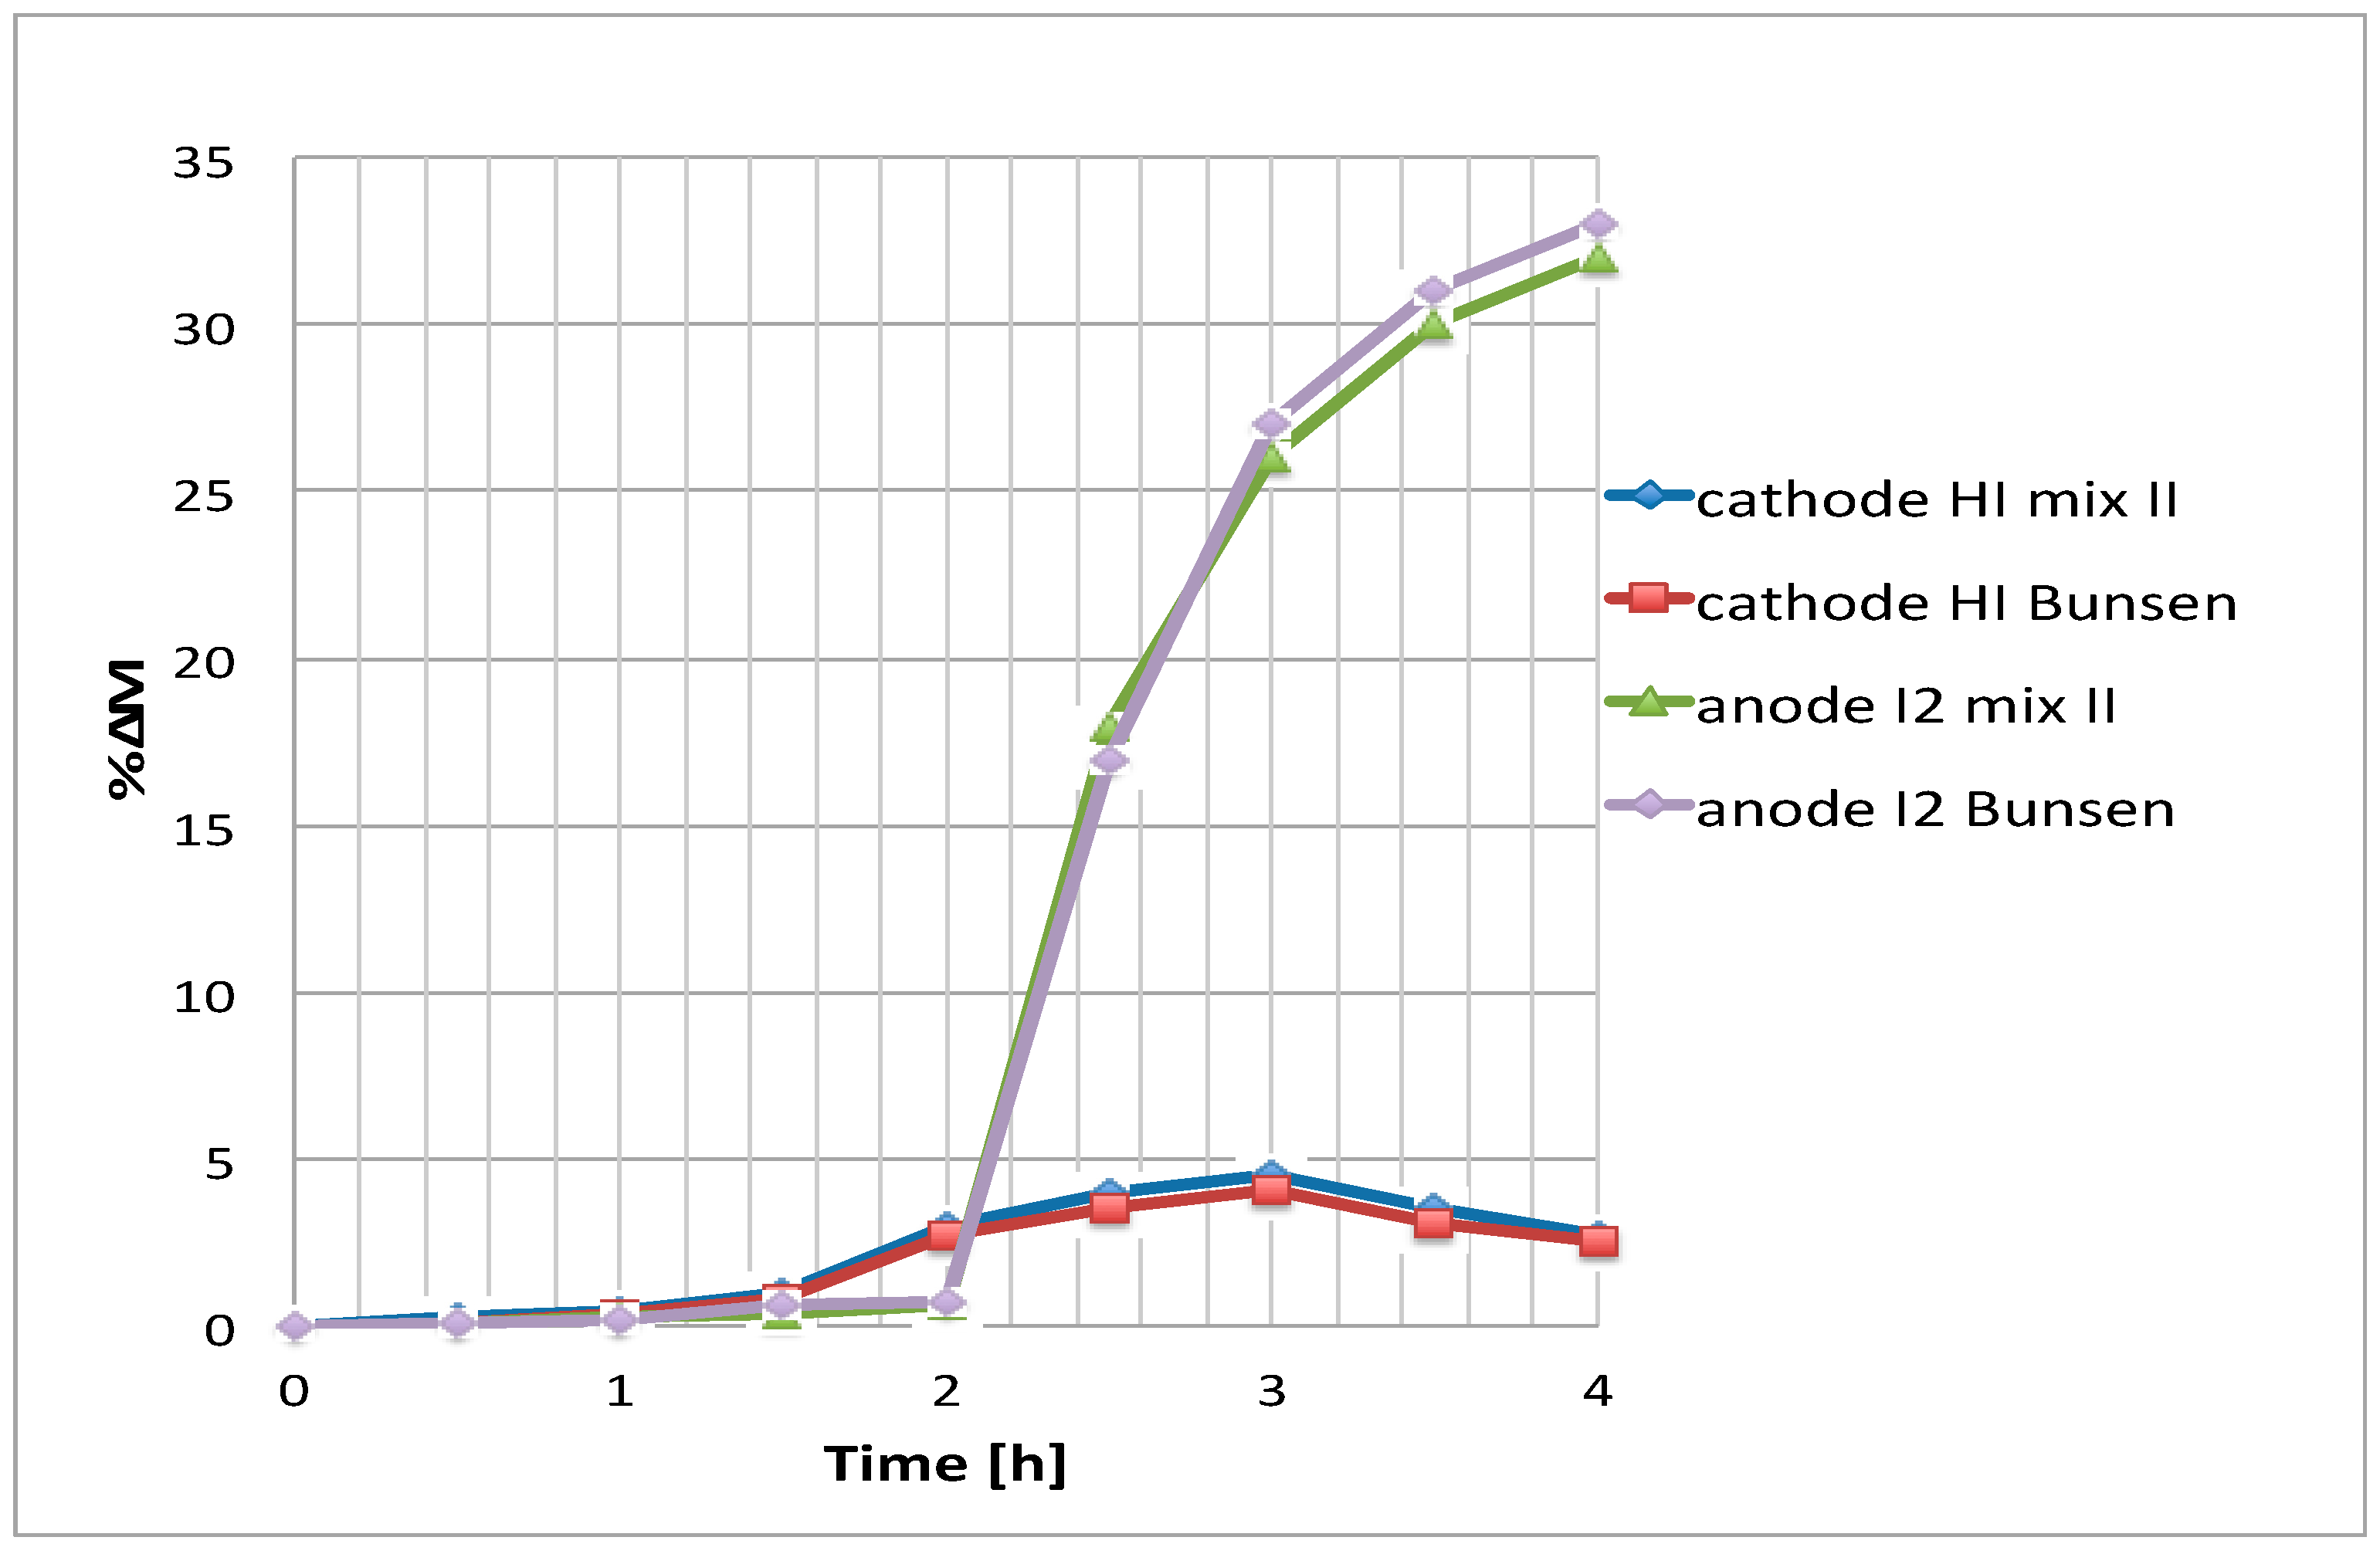
3.3. Comparison Between Bunsen-Like Mixture and Mixture II.
As previously said, the Bunsen-like mixture at low temperature, showed some circulation problems during the tests. Consequently, an experiment was carried out with the Bunsen mixture at 85 °C and 0.1 V (see
Figure 10).
Because of the sampling difficulty of a solution presenting high I2 contents at 85 °C, and considering a measurement error of 3%, only the increase of cathodic HI can be qualitatively verified. In any case, it appears that, after 4 h, about the same final HI concentration increase is reached both with the Bunsen and the mixture II.
Table 1 presents a comparison of the results with the ones for the mixture II composition. It can be noticed that considering the experimental error, the separation parameters are practically the same as compared to the ones obtained with the mixture II. The apparent transport number of the proton was almost constant varying from 0.74 (Bunsen-like test) to 0.76 (mixture II test).
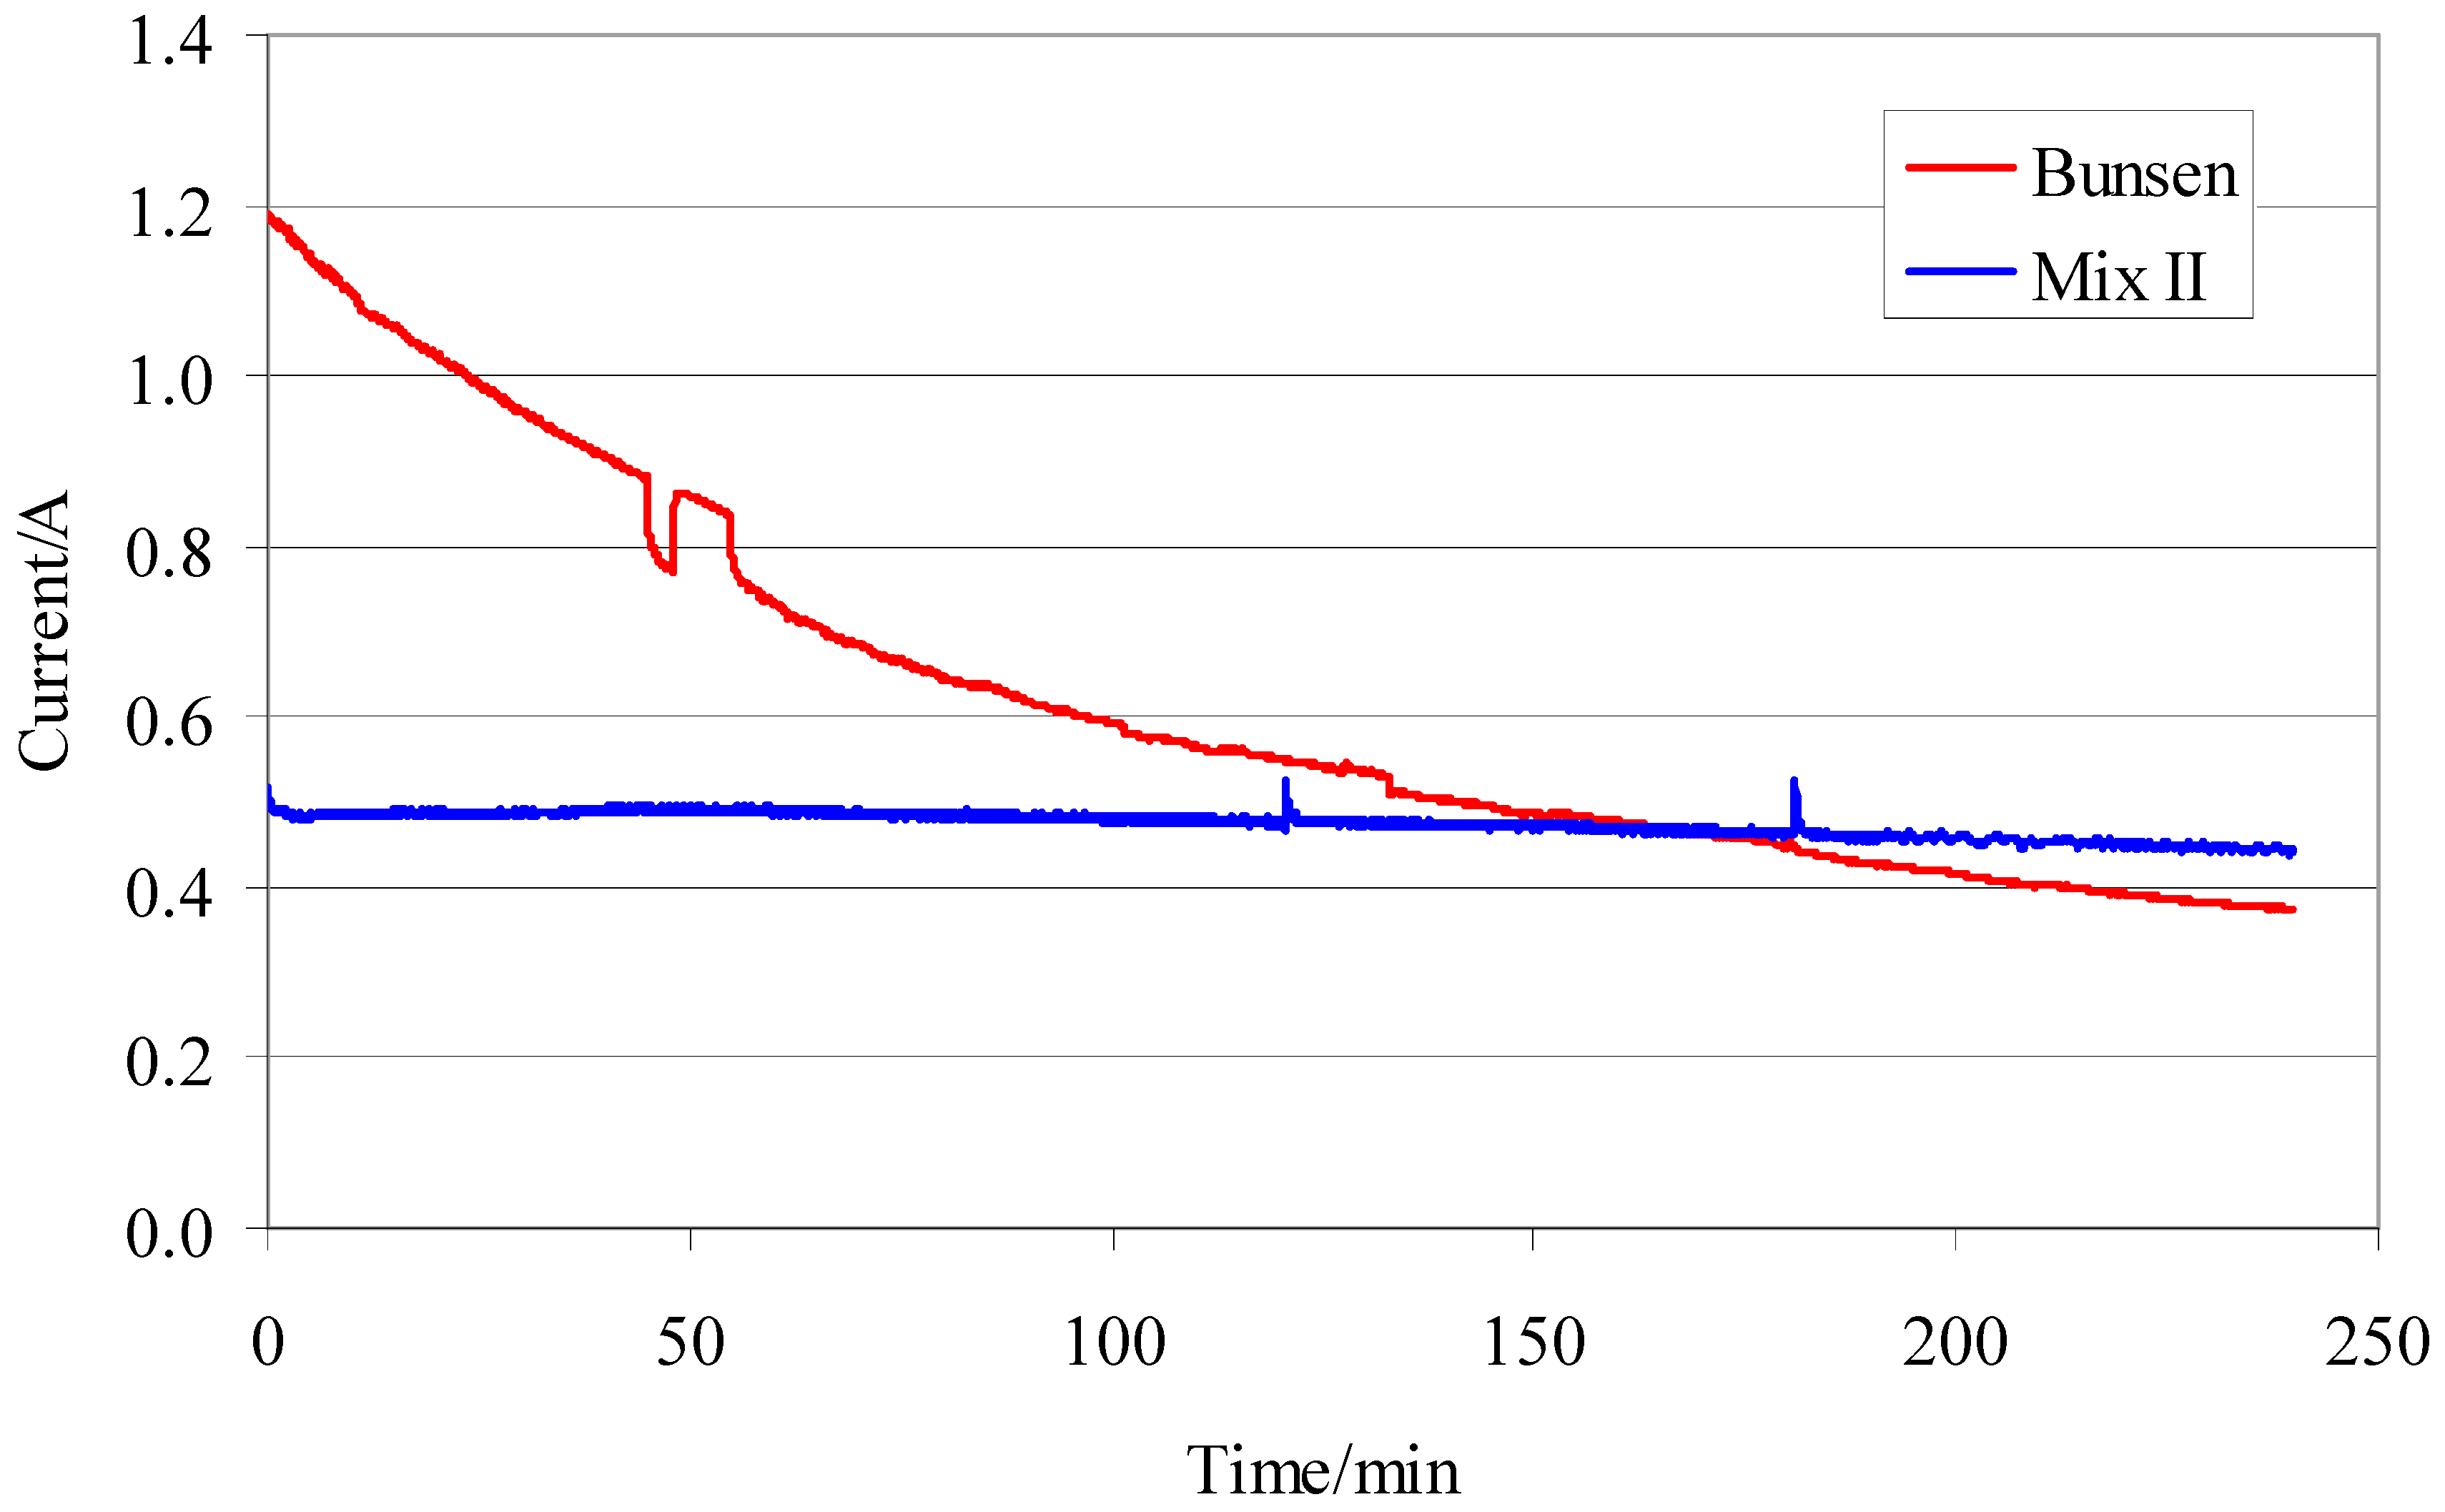
As expected, a real difference between the two tests is represented by the flow of the electric current in the cell (
Figure 11). The tests with mixture II, furnished a trend of the electric current constant independent from operative conditions. In contrast, the tests with the Bunsen-like mixture, showed a sharp decrease of the electric current in the time.
3.4. Energy Consumption
An energy consumption estimation (
Eeed) has been calculated starting from applied voltage, electricity, and concentration data taken from the various tests (
Table 2).
The electric current was integrated to calculate the charge developed in the cell. To be able to perform effective comparisons, the energy consumption value has been related with the variation of HI in each test. The results showed that the energy consumption increased with the growth of applied voltage, although we observed a simultaneous increase of the separation rate.
Working at higher temperatures, any increasing in the separation rate was not detected. Therefore, temperature cannot be considered as parameters to optimize EED efficiency. Tests performed with the Bunsen-like mixture showed a bigger energy consumption than the correspondent ones with mixture II.
Considering that, within the same time interval, the HI increase at the cathode is basically the same both in the Bunsen-like mixture and the mixture II, the higher energy consumption could be due to problems in the membrane separation capacity in the presence of high iodine concentration that cause partial reactions at the electrodes.
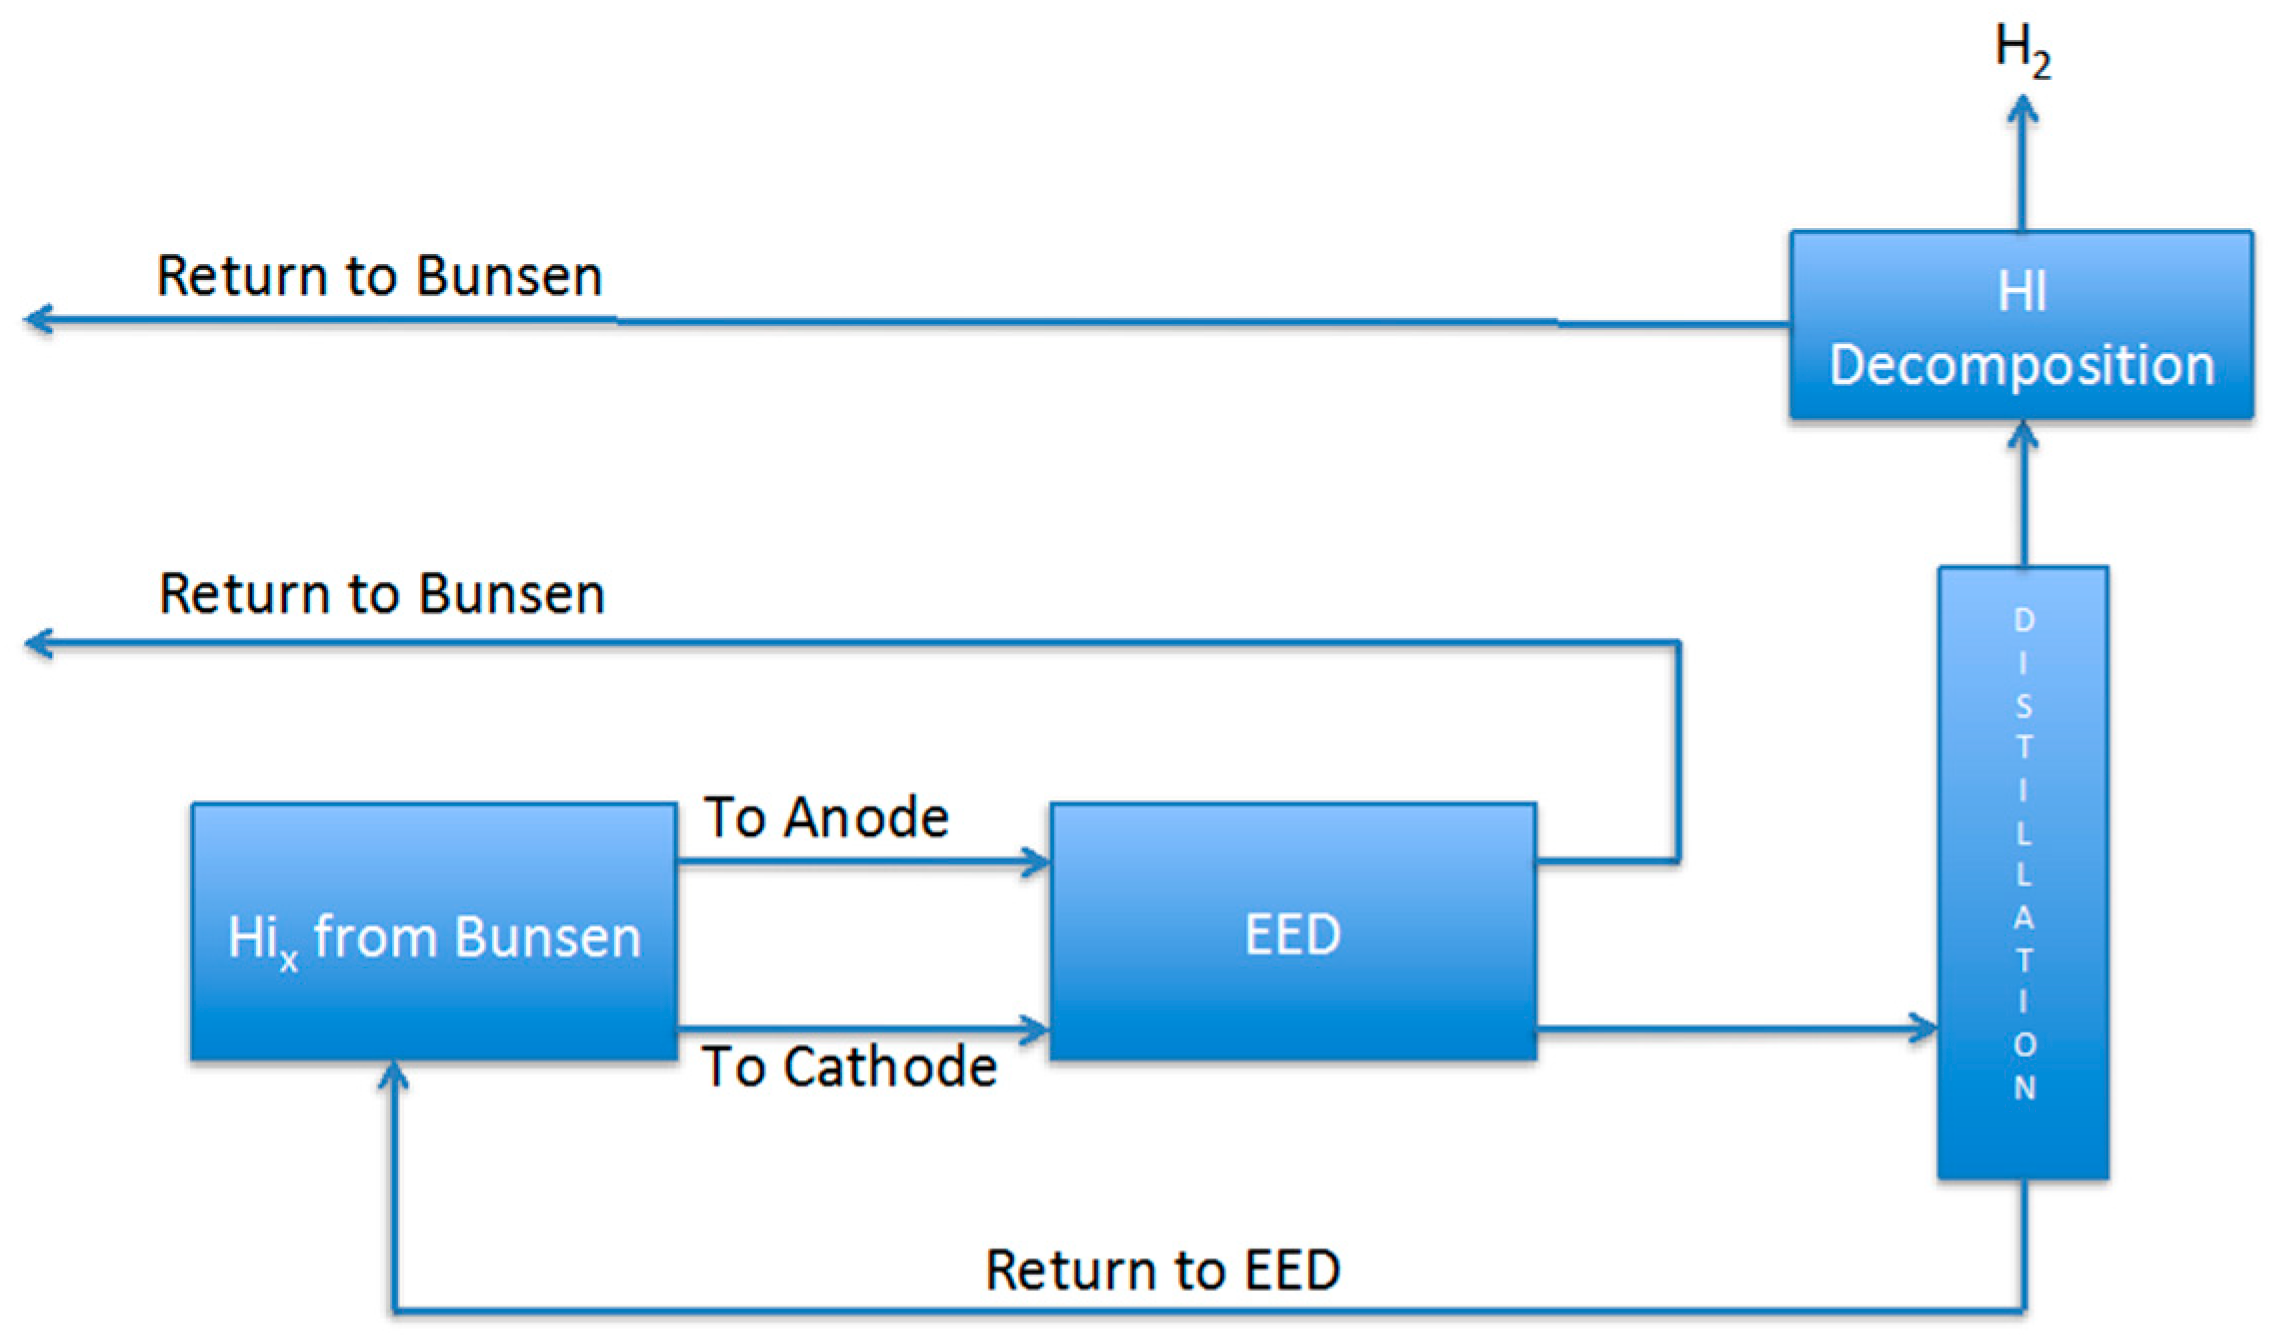
Finally, it is important to compare the HI separation methodology of this work. In order to do this it is necessary to calculate the duty of the entire HIx section when the electrodialysis described in this work is used coupled with a post distillation step, as schematized in
Figure 12. It is assumed, from data in the literature, that the energy requested for the HI decomposition subsection is 1.52 × 10
4 J/mol-H
2 [
15,
16], and that evidently 2 mol of HI are required to obtain 1 mol H
2. Hence, to calculate the heat duty it was considered the EED energy consumption at 0.1 V and 25 °C as reported in
Table 2. As shown in
Table 3, the calculated value for 1 mol hydrogen production resulted larger than those reported in the flow sheets employing extractive or reactive distillation [
1,
6,
17]. However, it is also important to note that those flow sheets are optimized with respect to the heat recovery steps, while this work was just focused on the analysis of the operating parameters and the calculation of the necessary energy duties for the electrodialysis section. Overall, the EED separation method seems competitive with the others, and a further flowsheet work will be required to demonstrate its validity.
4. Conclusions
The electric current, in tests performed with mixture II, decreases linearly with time and the electric current variation is enhanced in tests with Bunsen-like mixture.
The apparent proton transport number shows a linear dependence with the electrodes applied voltage, regardless of the mixture used.
The mixture temperature has little effects on the separation degree. Only the apparent electro-osmosis coefficient varies slightly and this is probably due to the increased thermal agitation of the molecules in the mixture.
The titanium-rhodium electrodes presented a good chemical resistance during tests. The surface and the membrane of the electrodes were shielded very well against the corrosive action of the solution and the ohmic resistance of the cell was constant during all of experimental campaign.
Energy consumption increases with increasing voltage applied to the cell, as well as separation rate. Energy consumption at higher temperatures, and at constant voltage does not increase significantly, showing once more how temperature is not a sensitive parameter for the separation. The tests carried out with the Bunsen-like mixture show a bigger energy consumption with respect to the correspondent tests performed with mixture II.
Experimental results showed that it is possible to concentrate HI at the cathode also starting from a Bunsen-like mixture, as a consequence, it is in principle possible to directly concentrate and separate the hydriodic acid from iodine using the EED system downstream of the lower phase of the sulphur-iodine Bunsen section, still having a high energy consumption. Alternatively, it can be possible to use the EED technique to concentrate at low voltages (and with a relatively low energy consumption) a solution where most of the iodine excess has been previously removed by a pre-distillation process.
These tests are been realized on a batch configuration, but the results can help to implement the electro-dialysis in a continuous operation.


