Novel Photocatalytic NH3 Synthesis by NO3− Reduction over CuAg/TiO2


Abstract
:
1. Introduction
2. Materials and Methods
2.1. Materials
2.2. Preparation of TiO2 Samples
2.3. Characterization
2.4. Photocatalytic Reduction of NO3− to NH3
3. Results and Discussion
3.1. Calculation of the NO3− Conversion and Selectivity
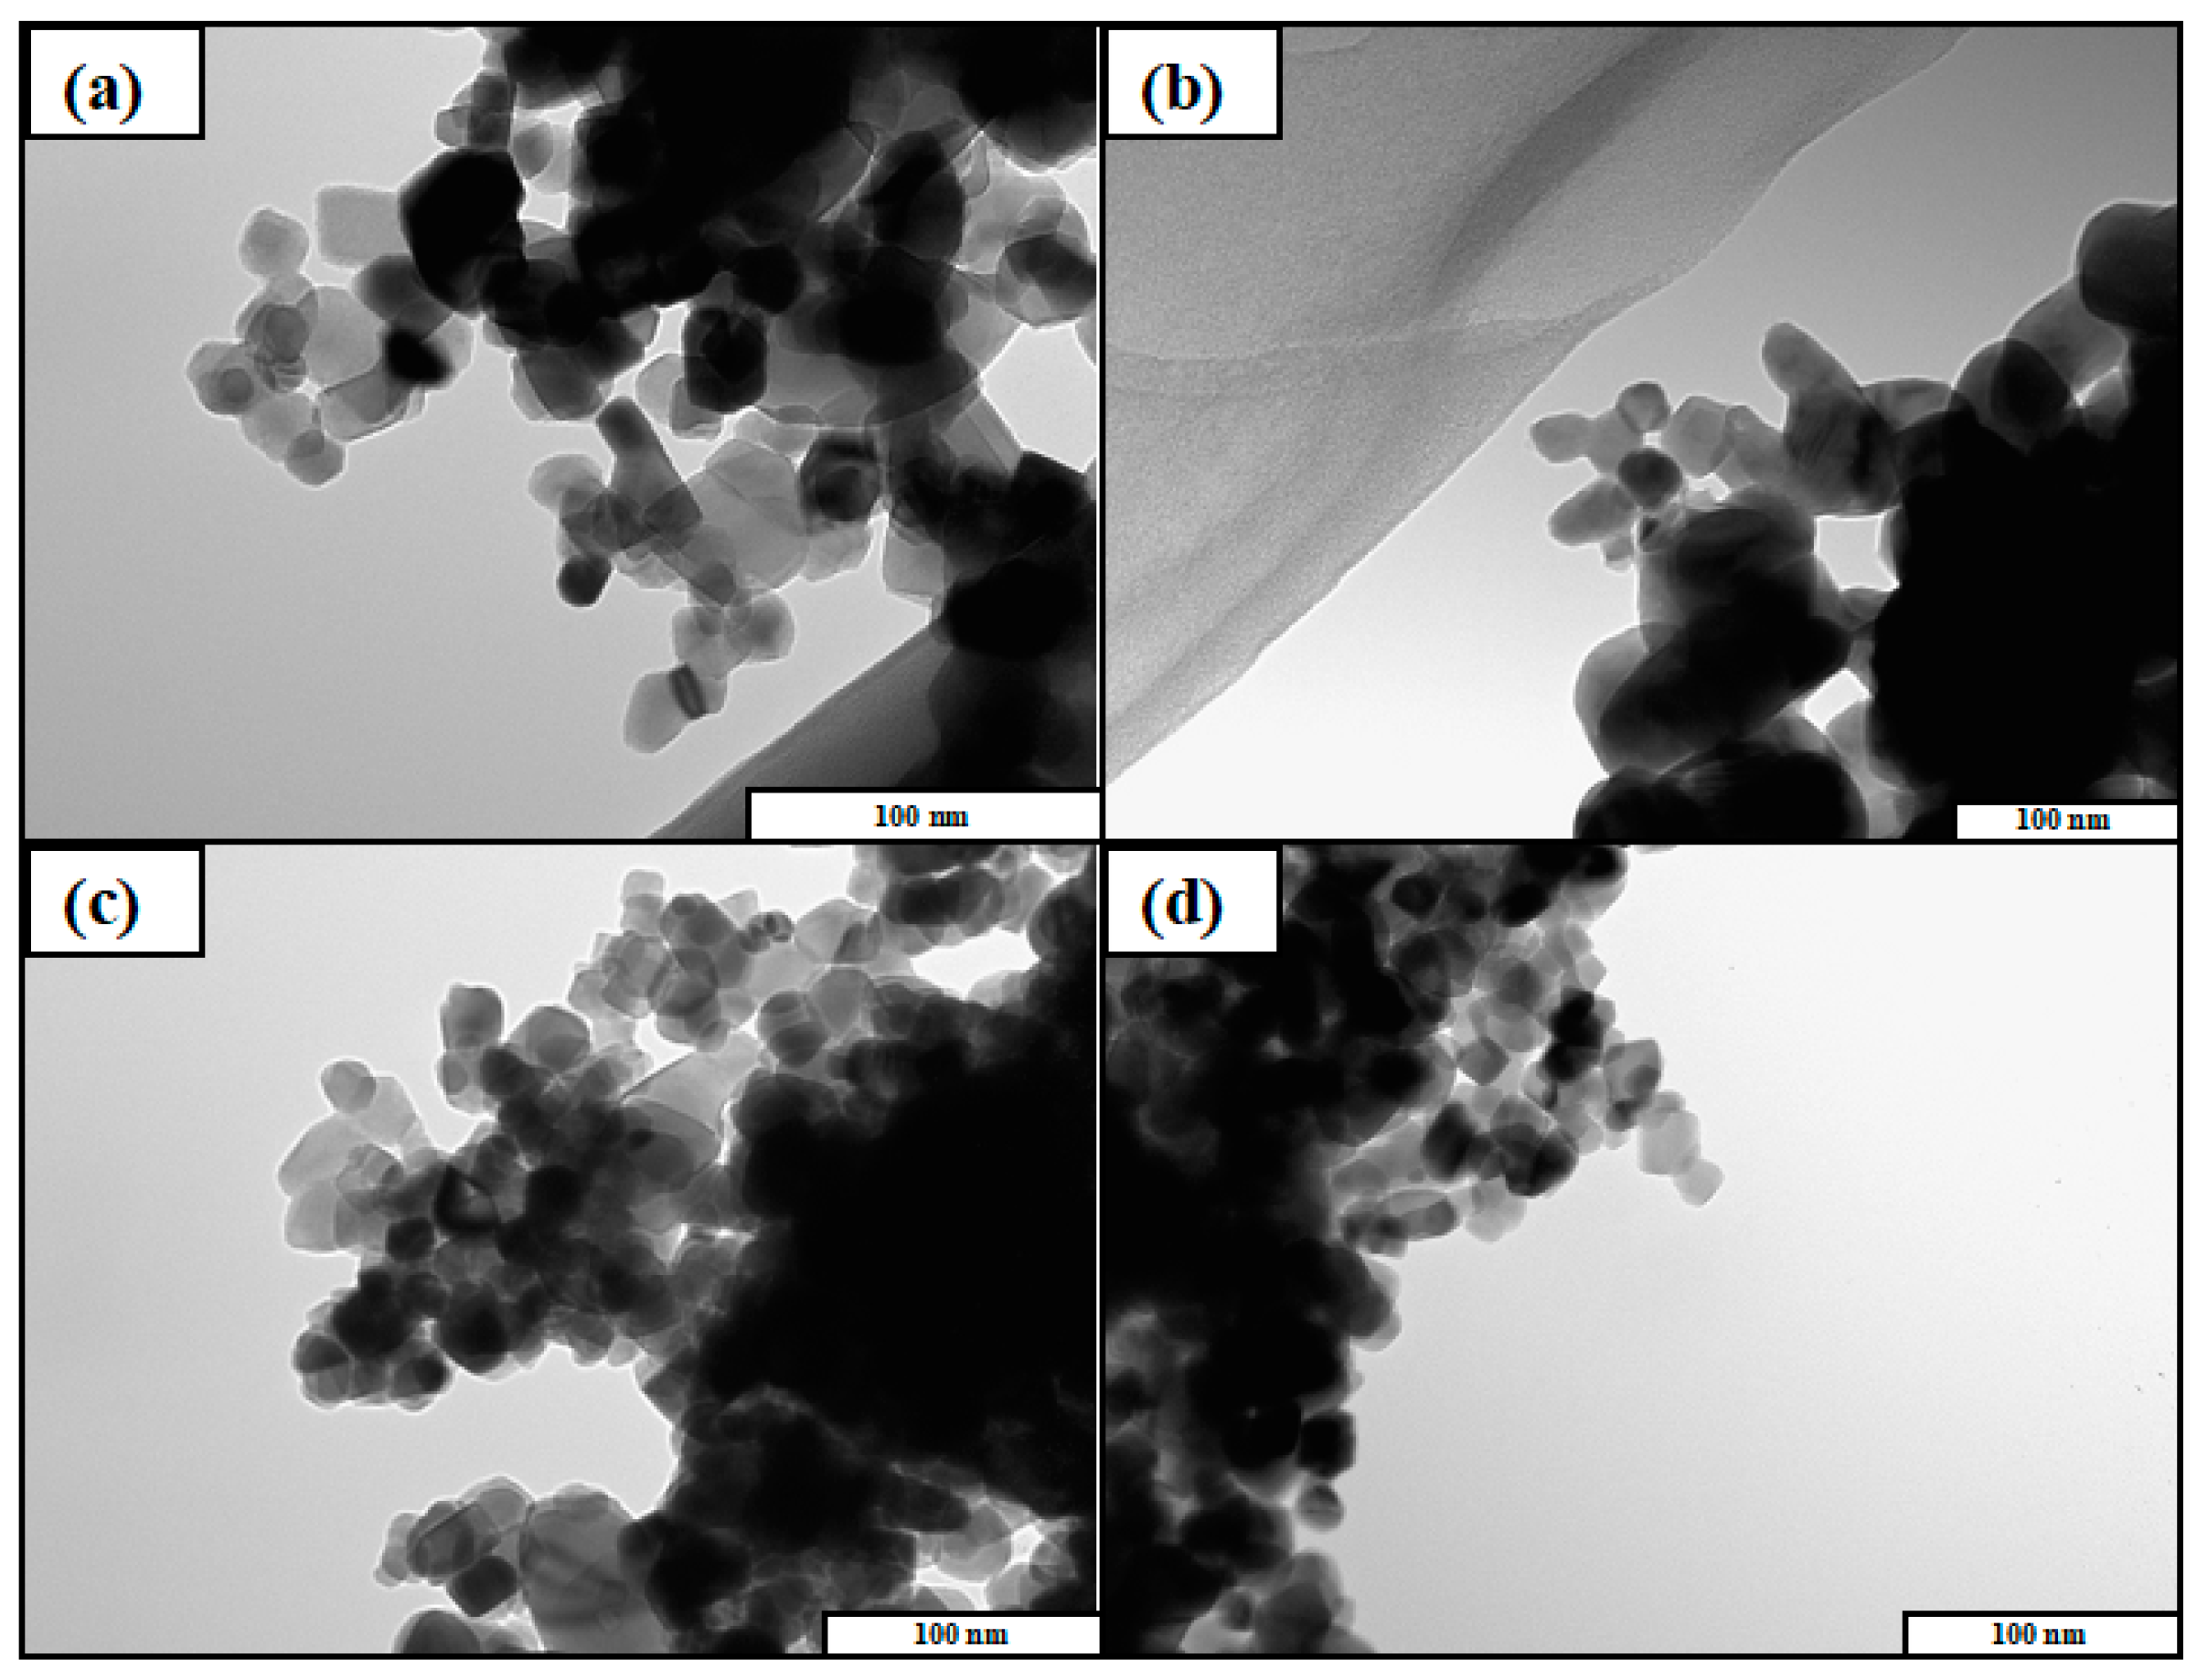
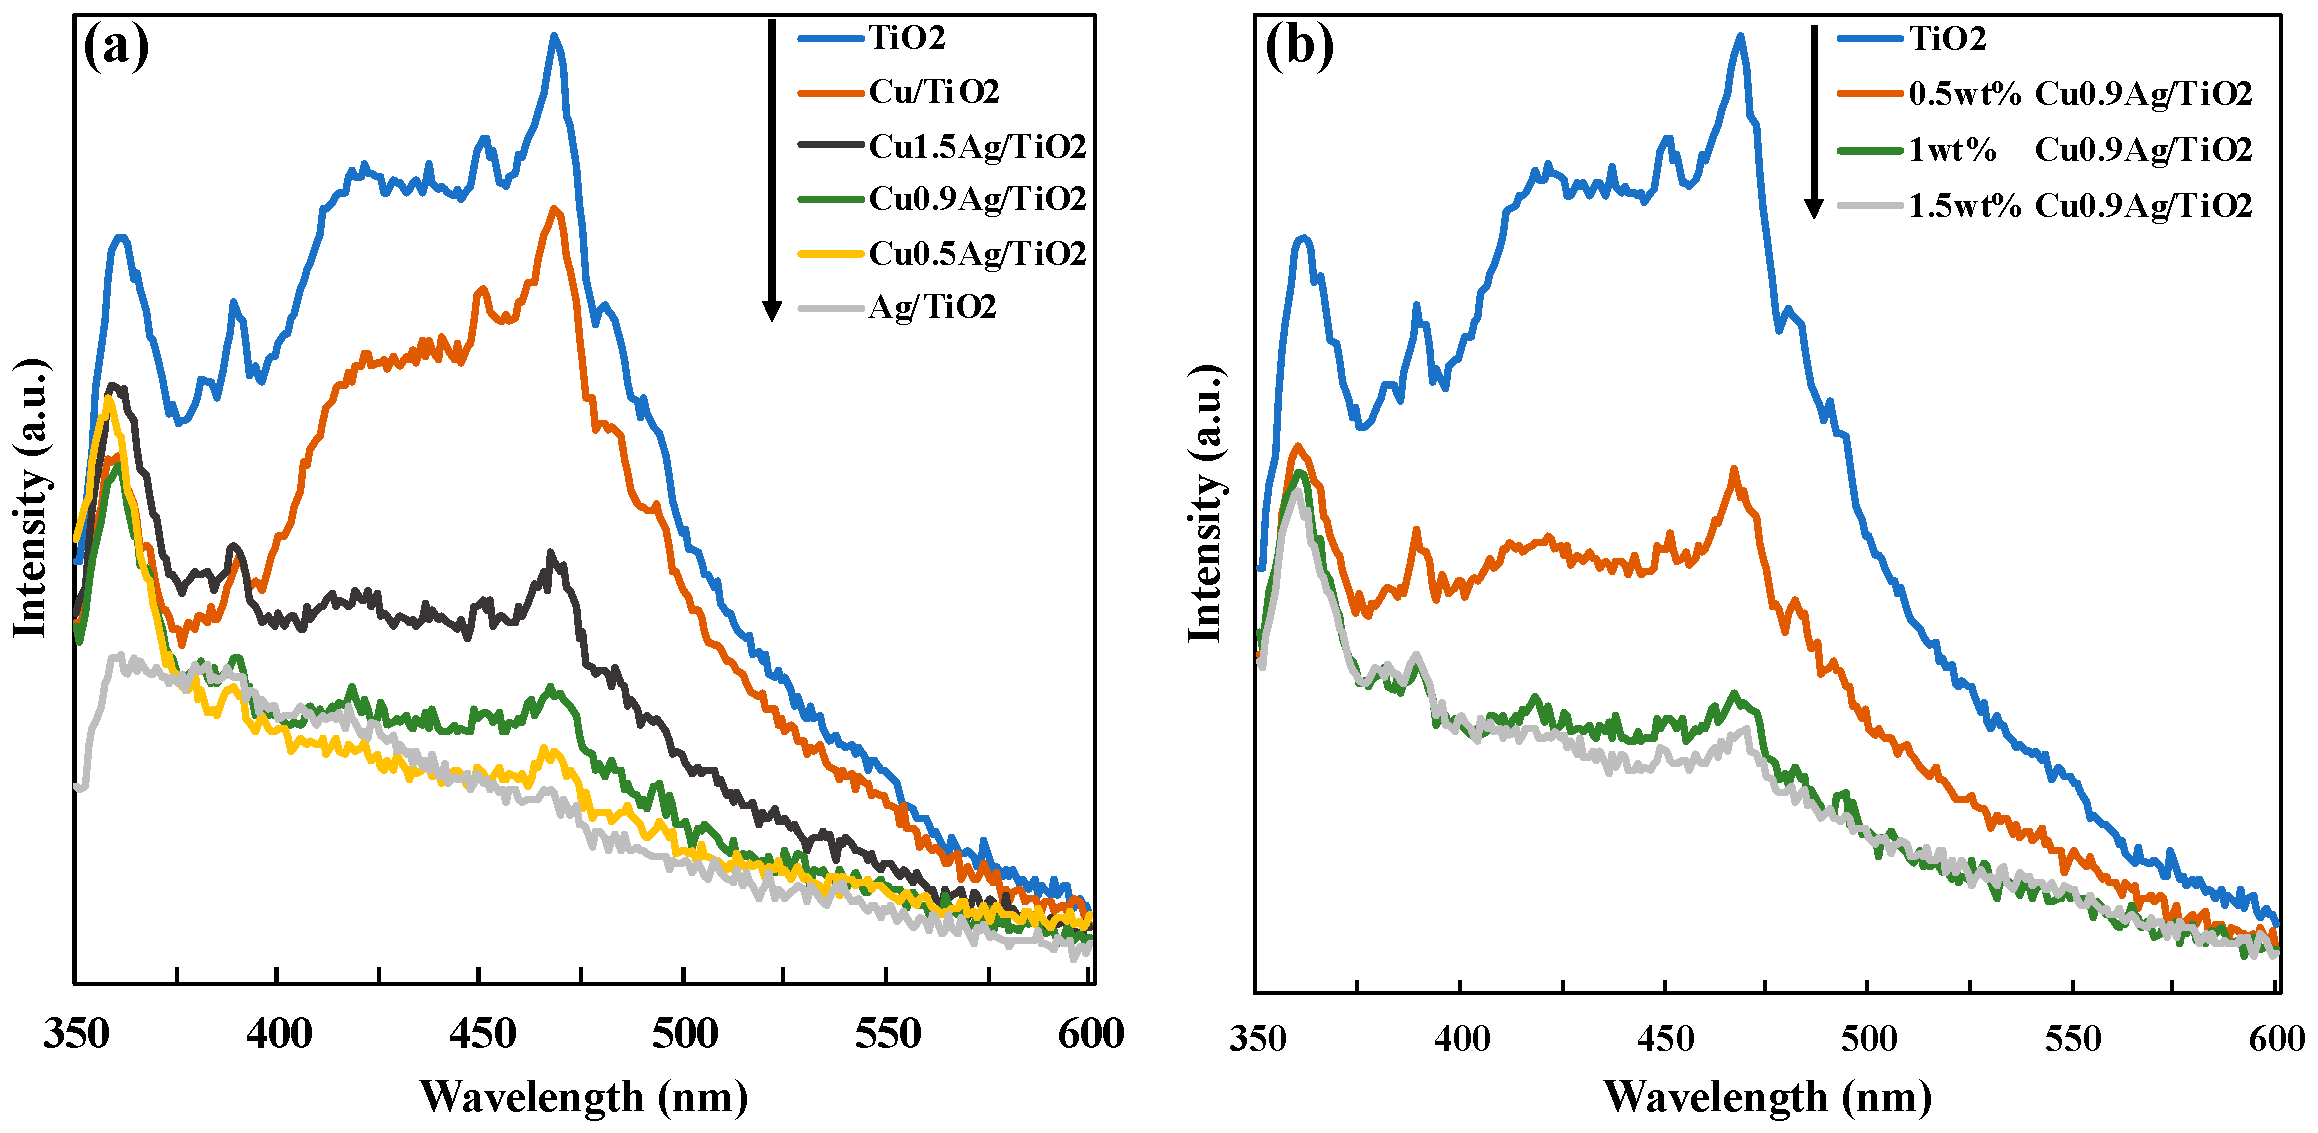
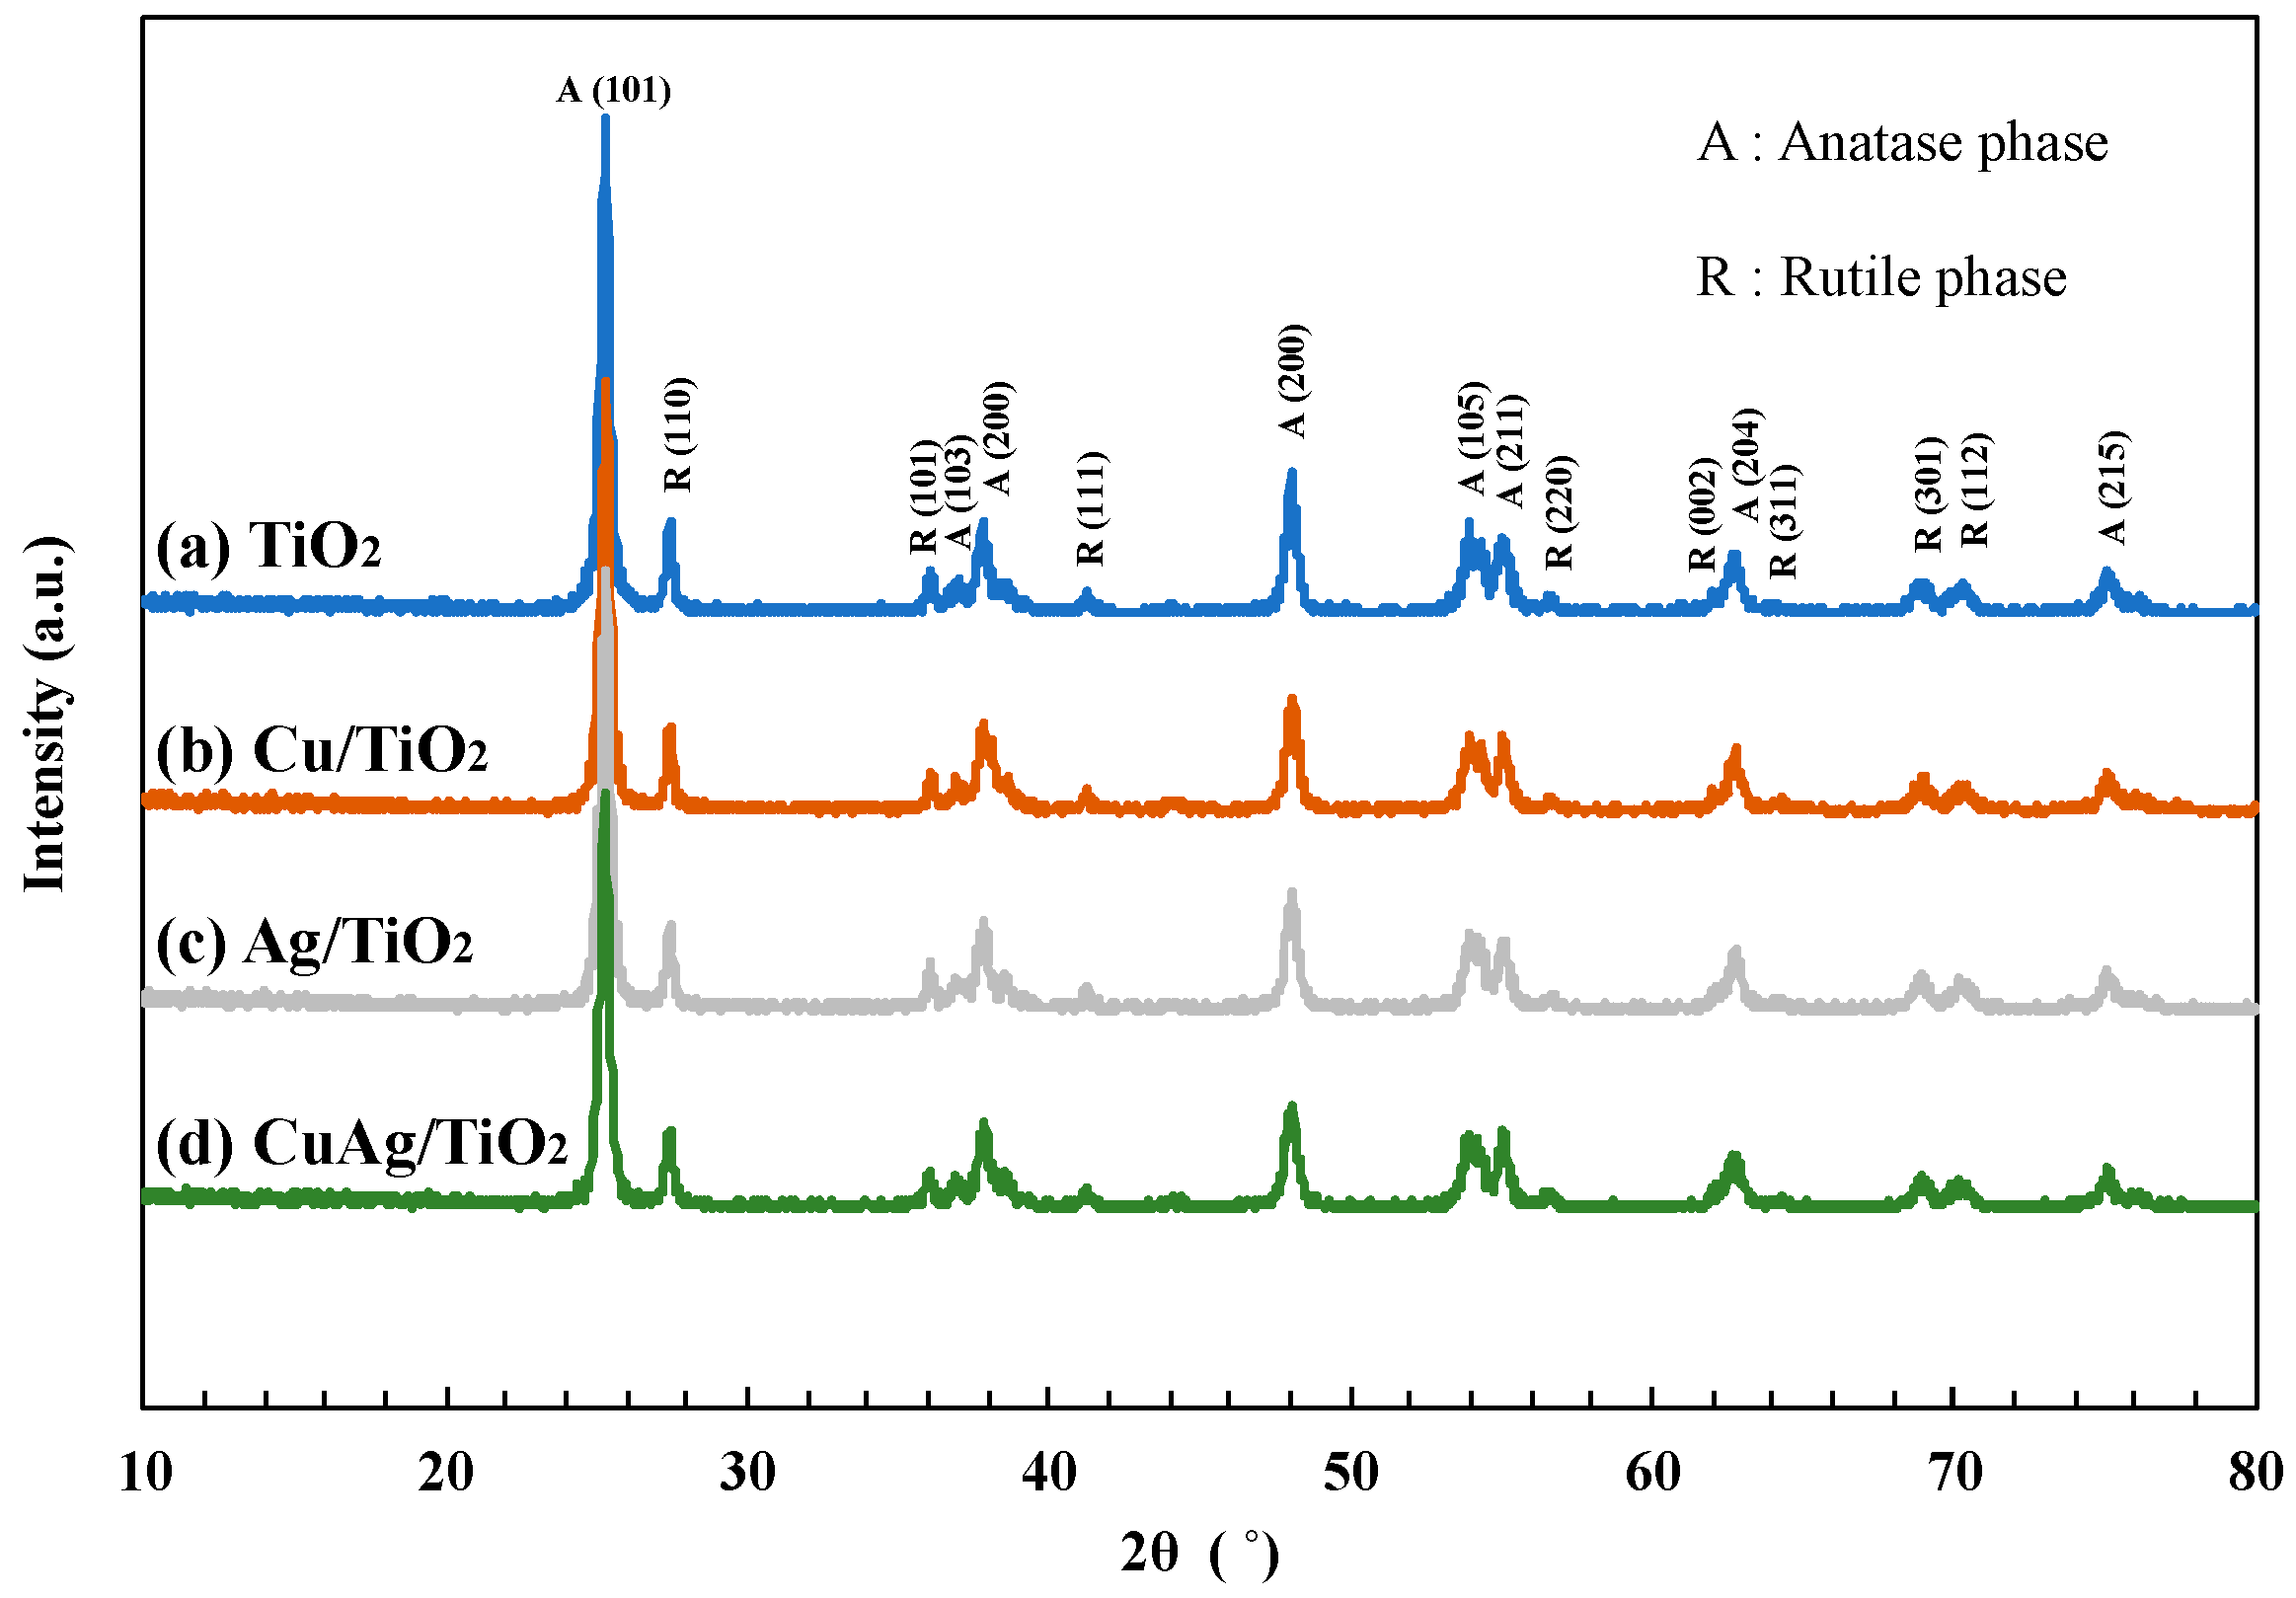
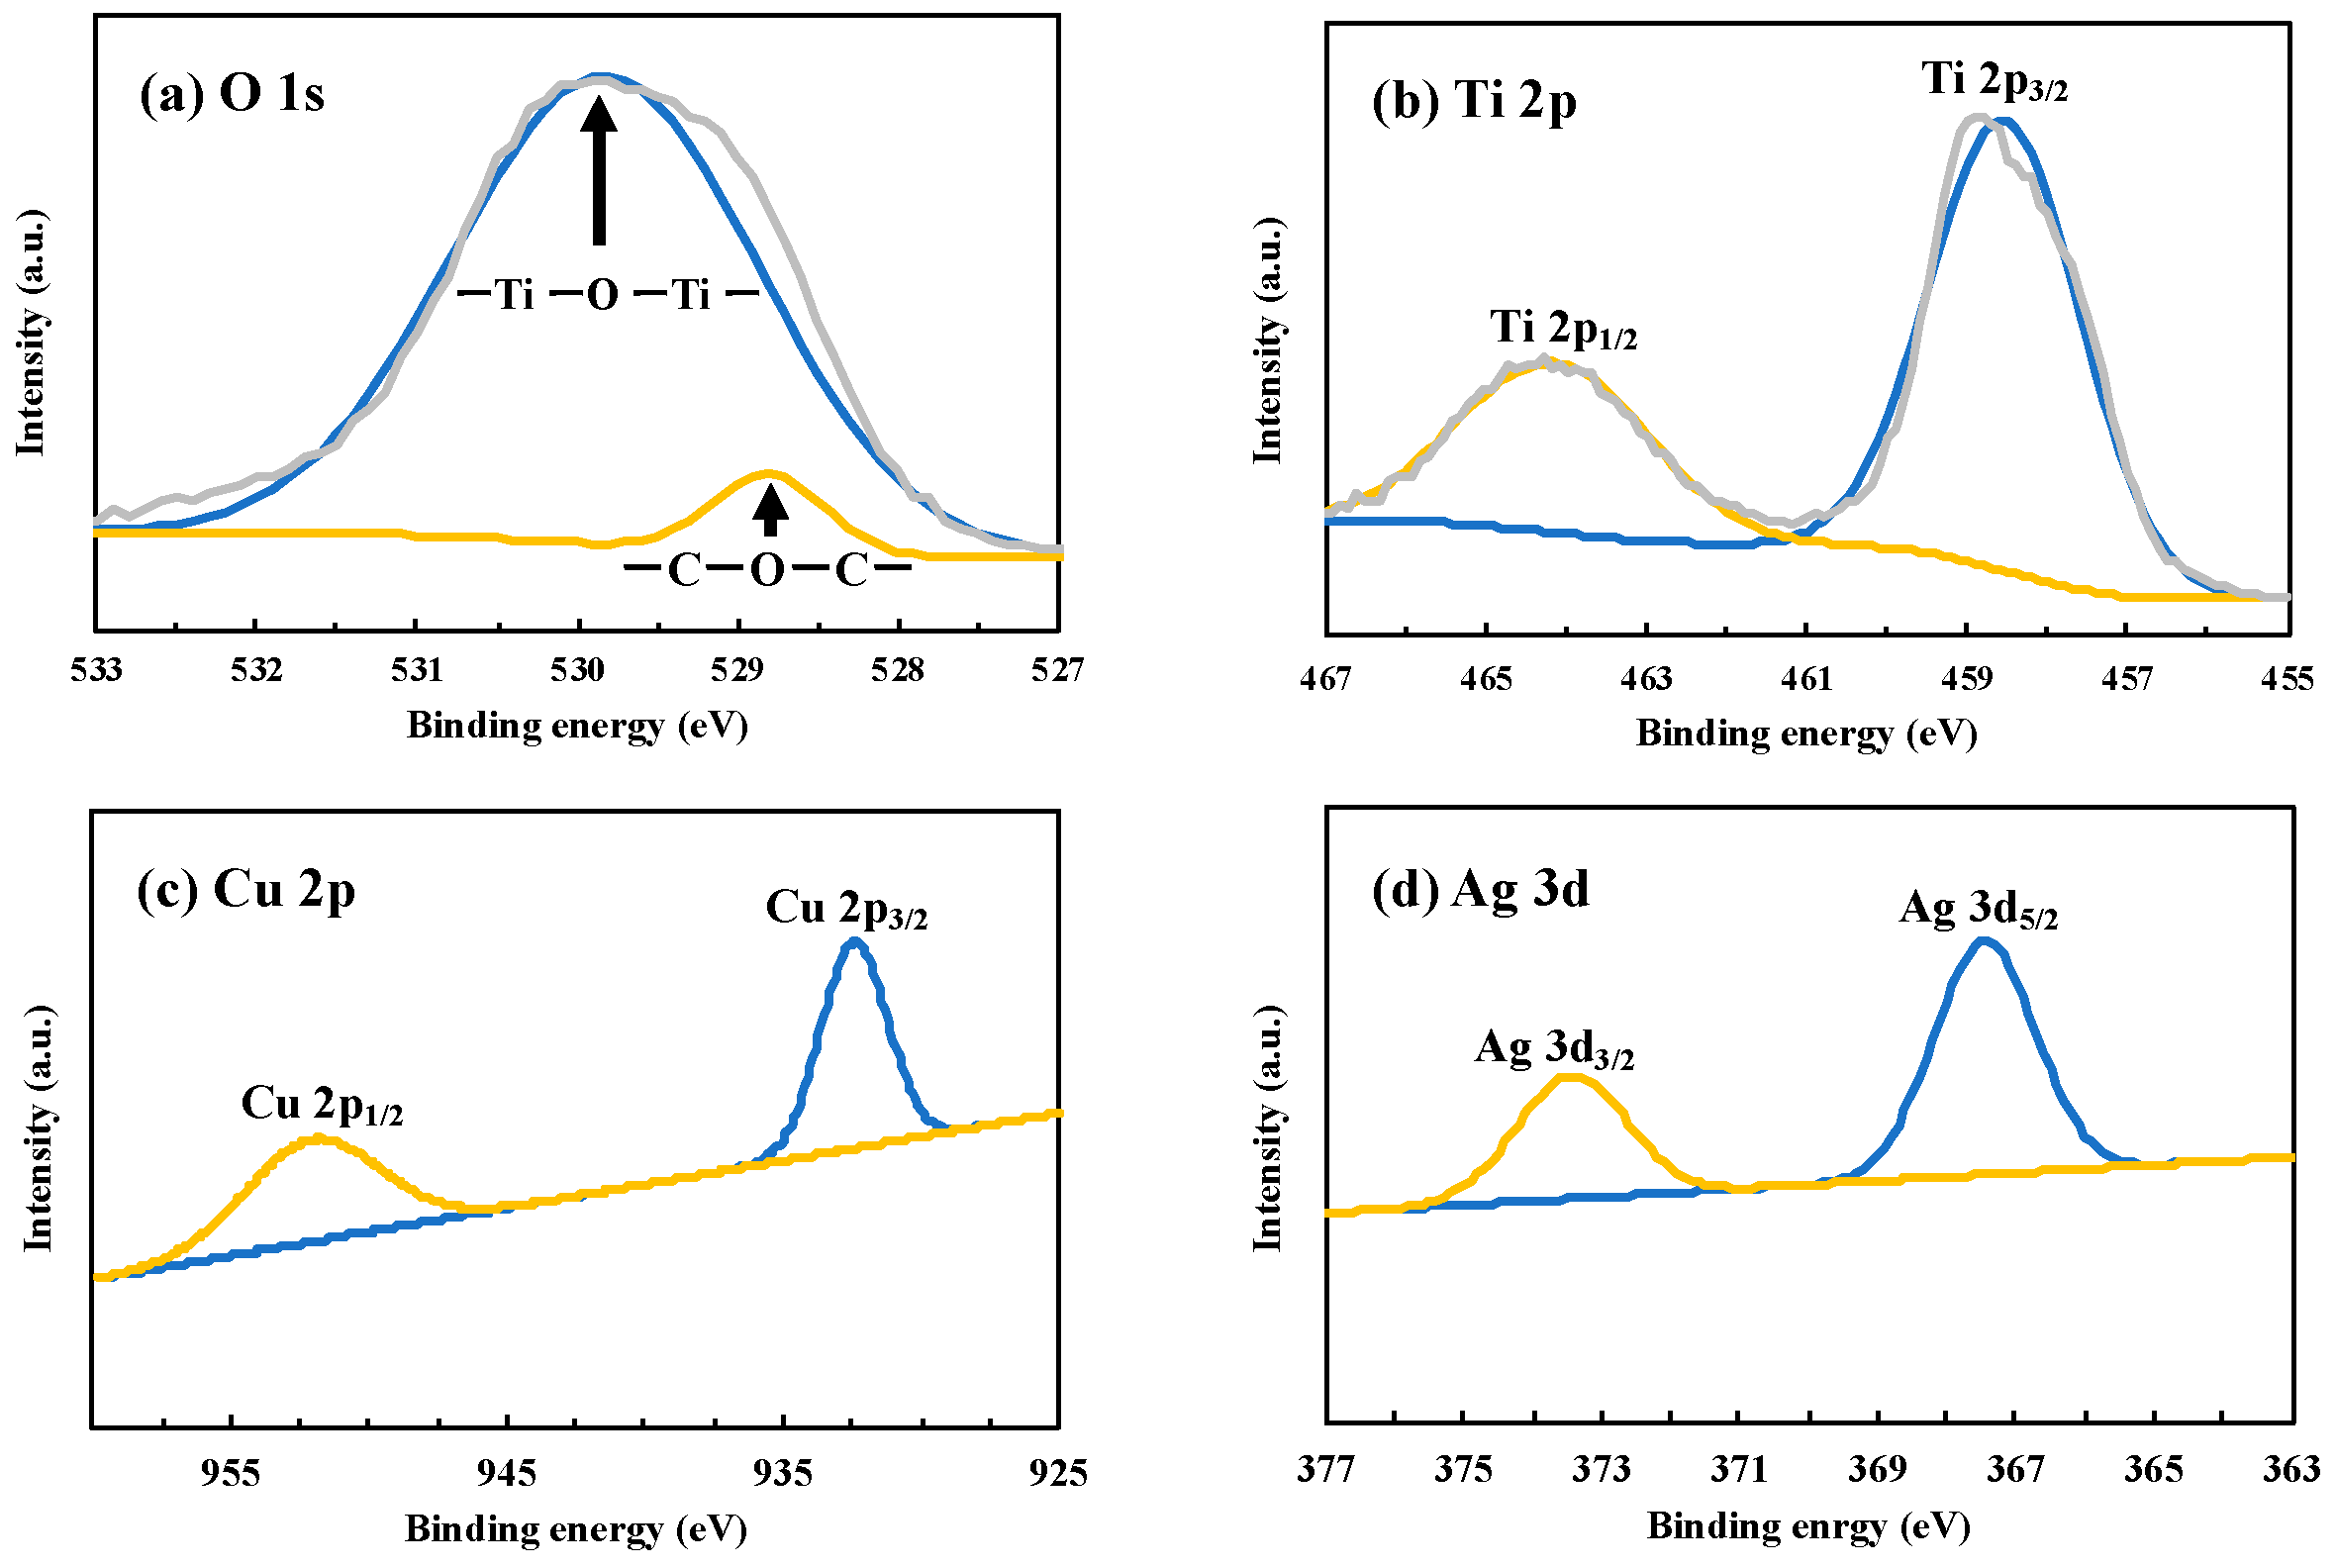
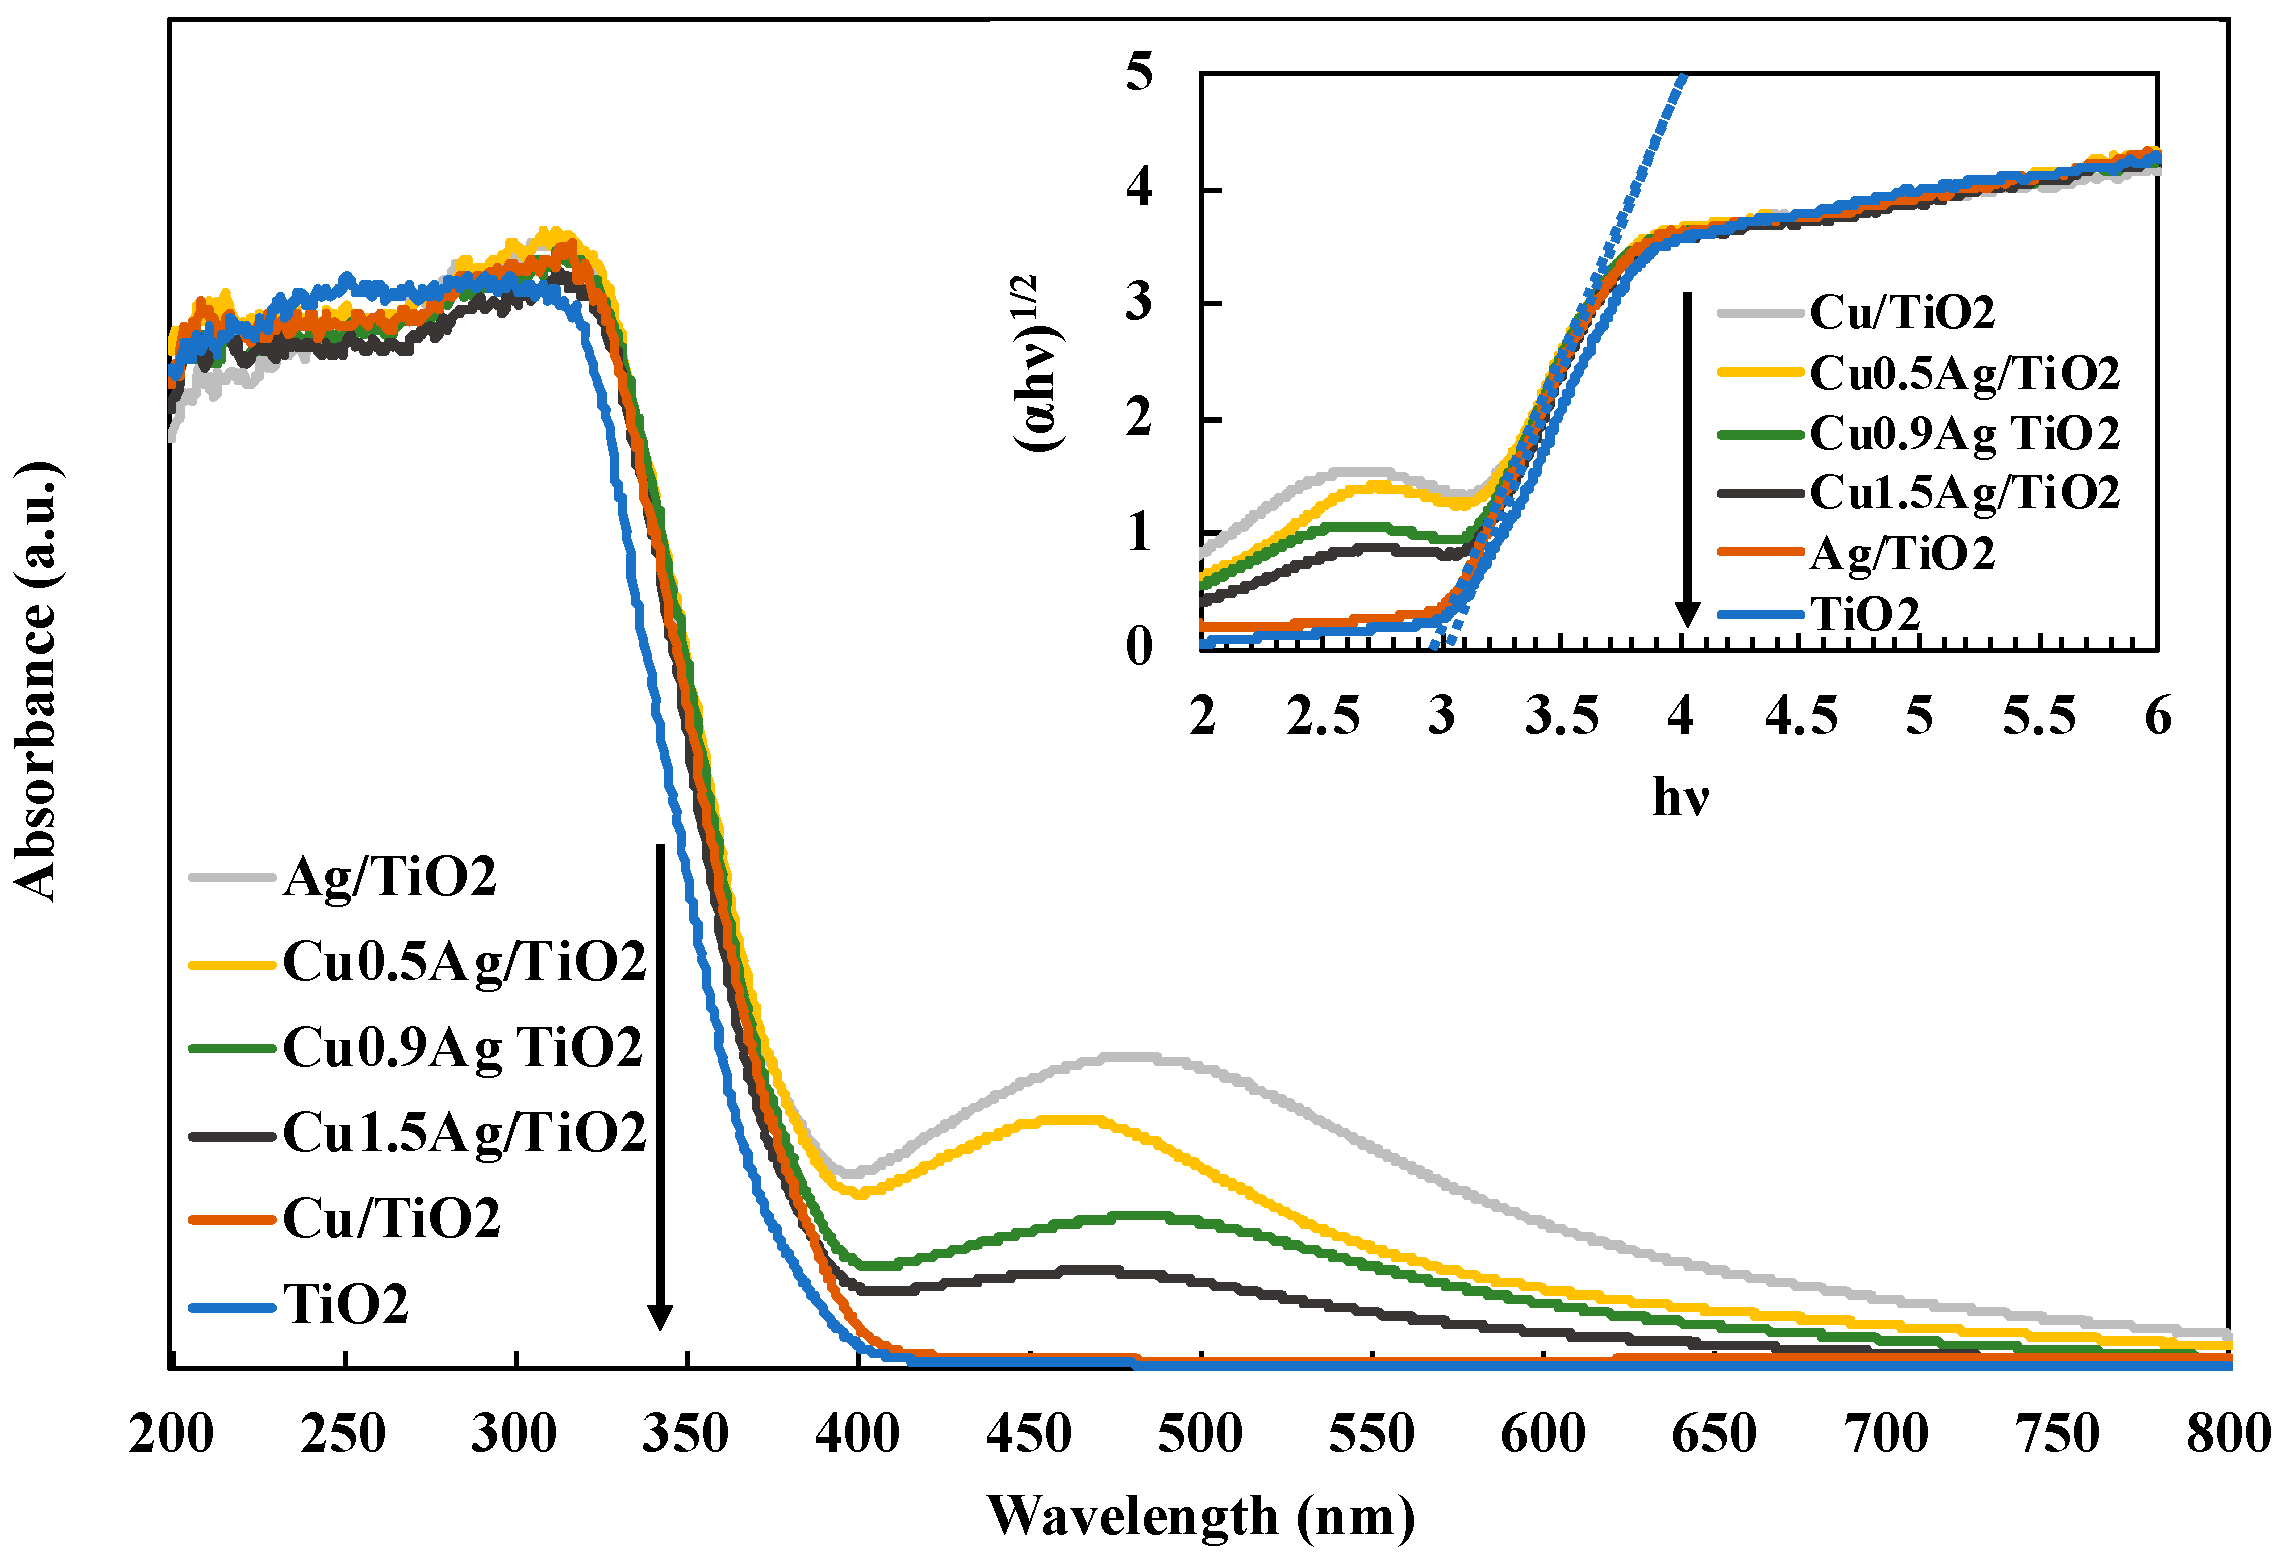
3.2. Characterization of Photocatalysts
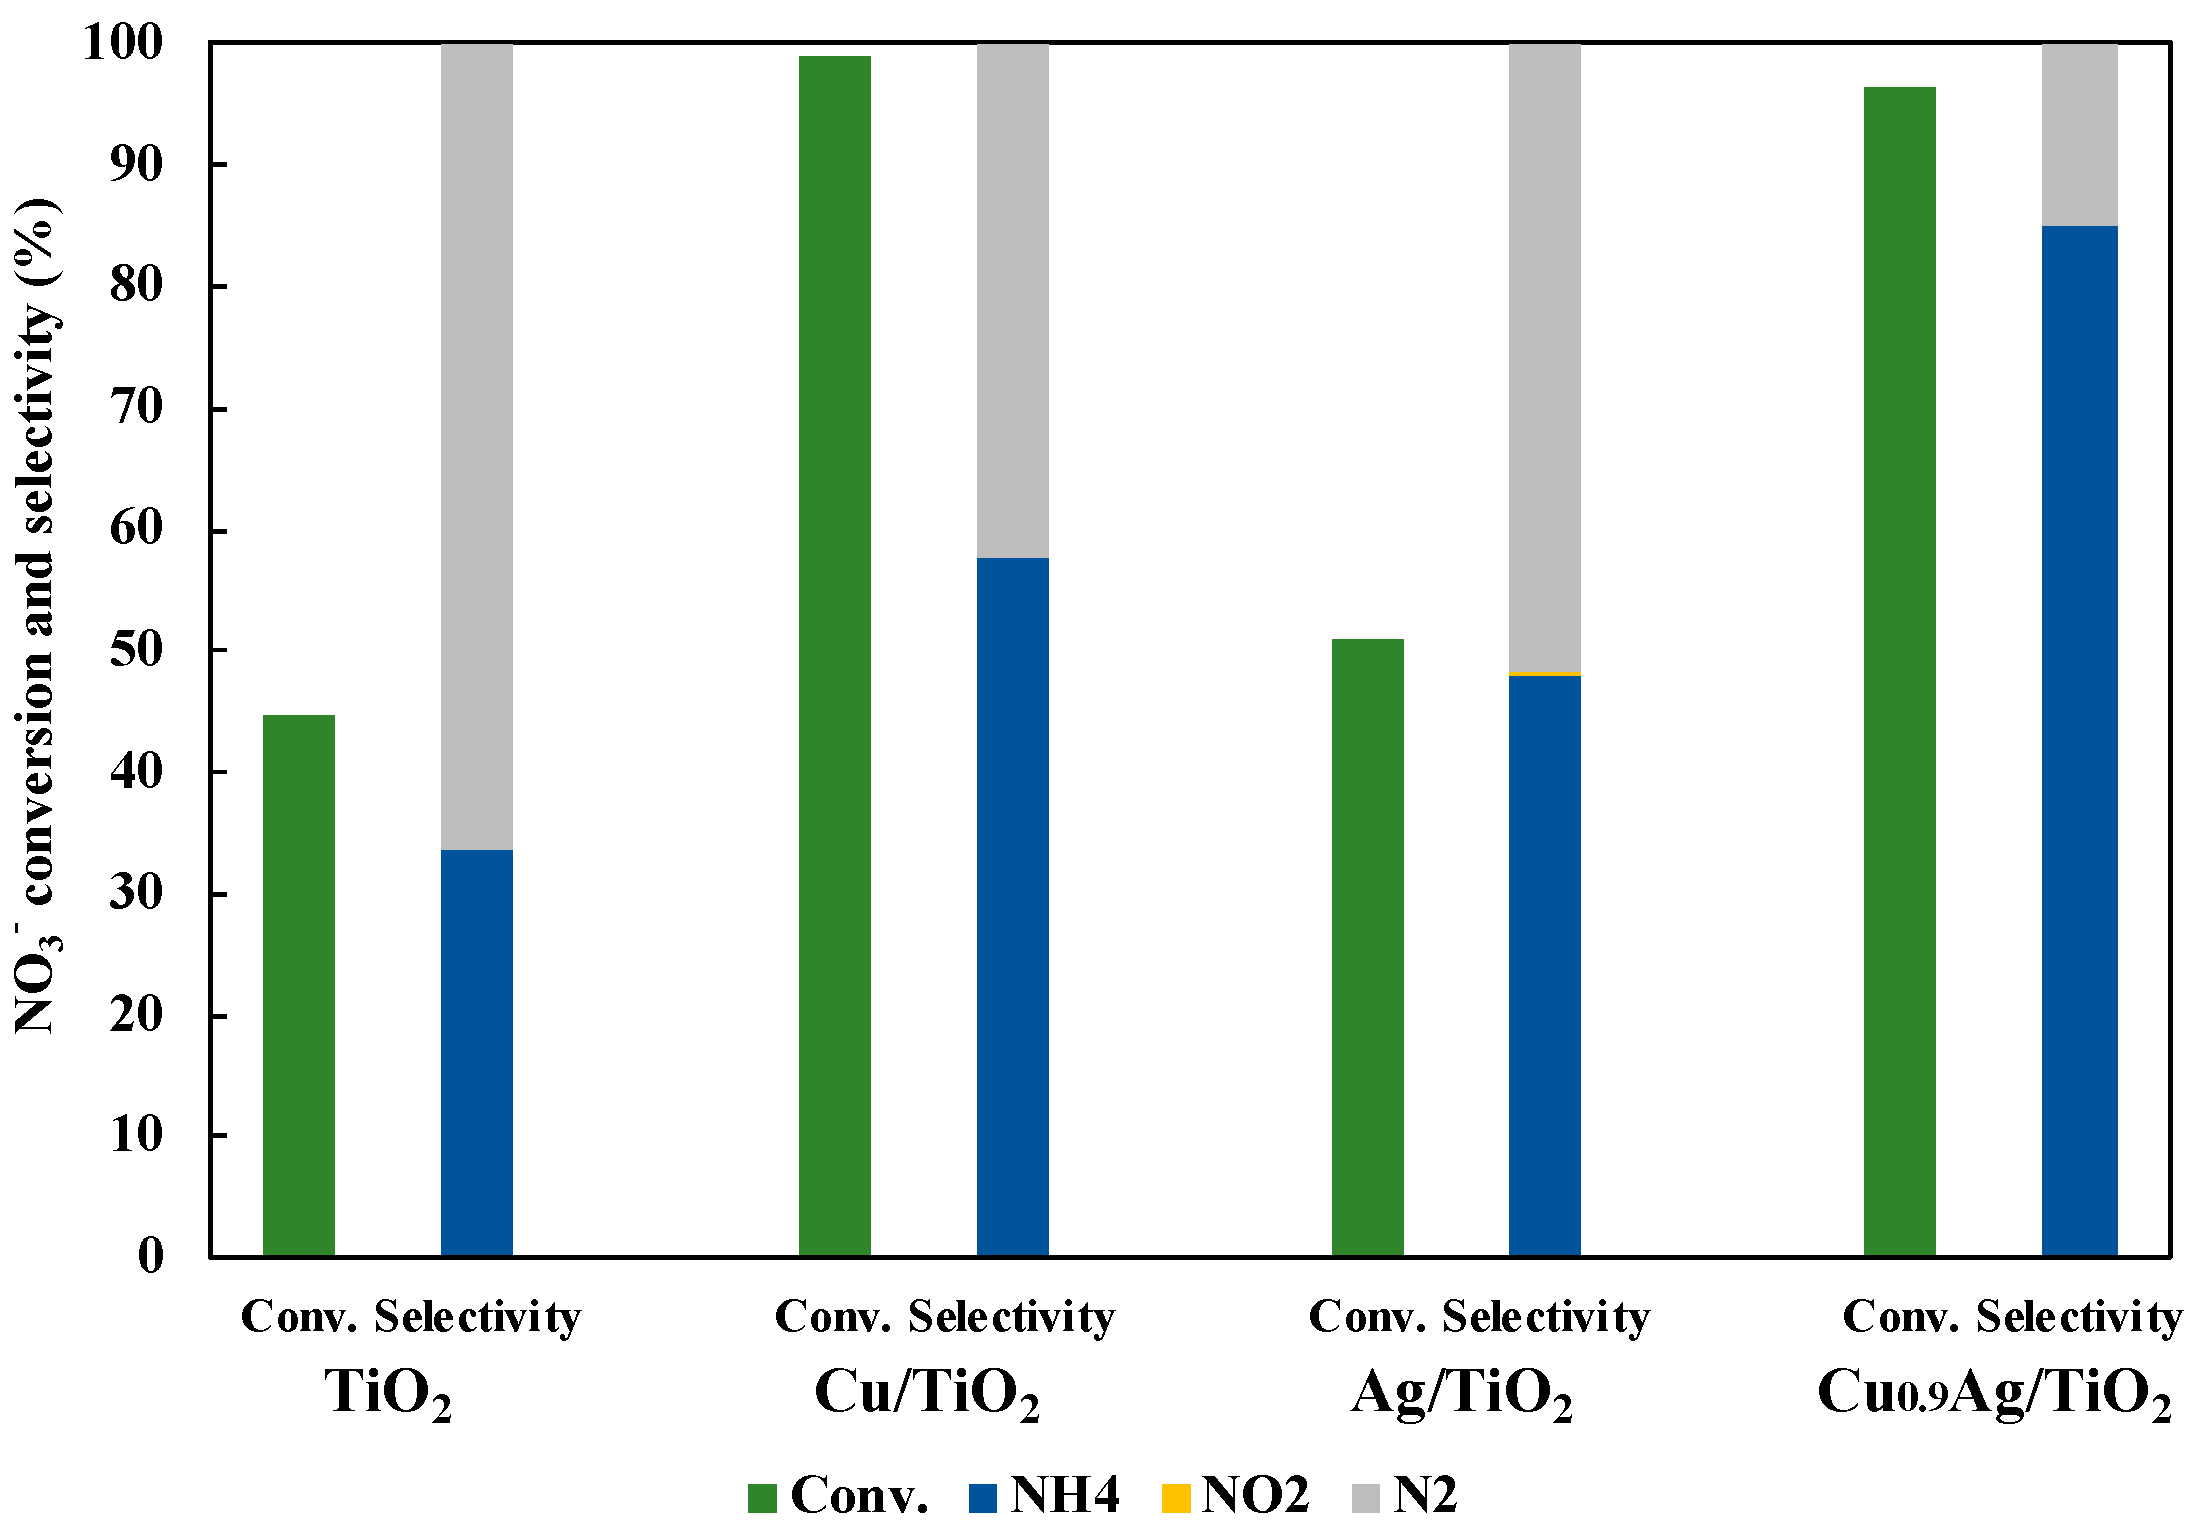
3.3. Photocatalytic Activity in NO3− Reduction to NH3
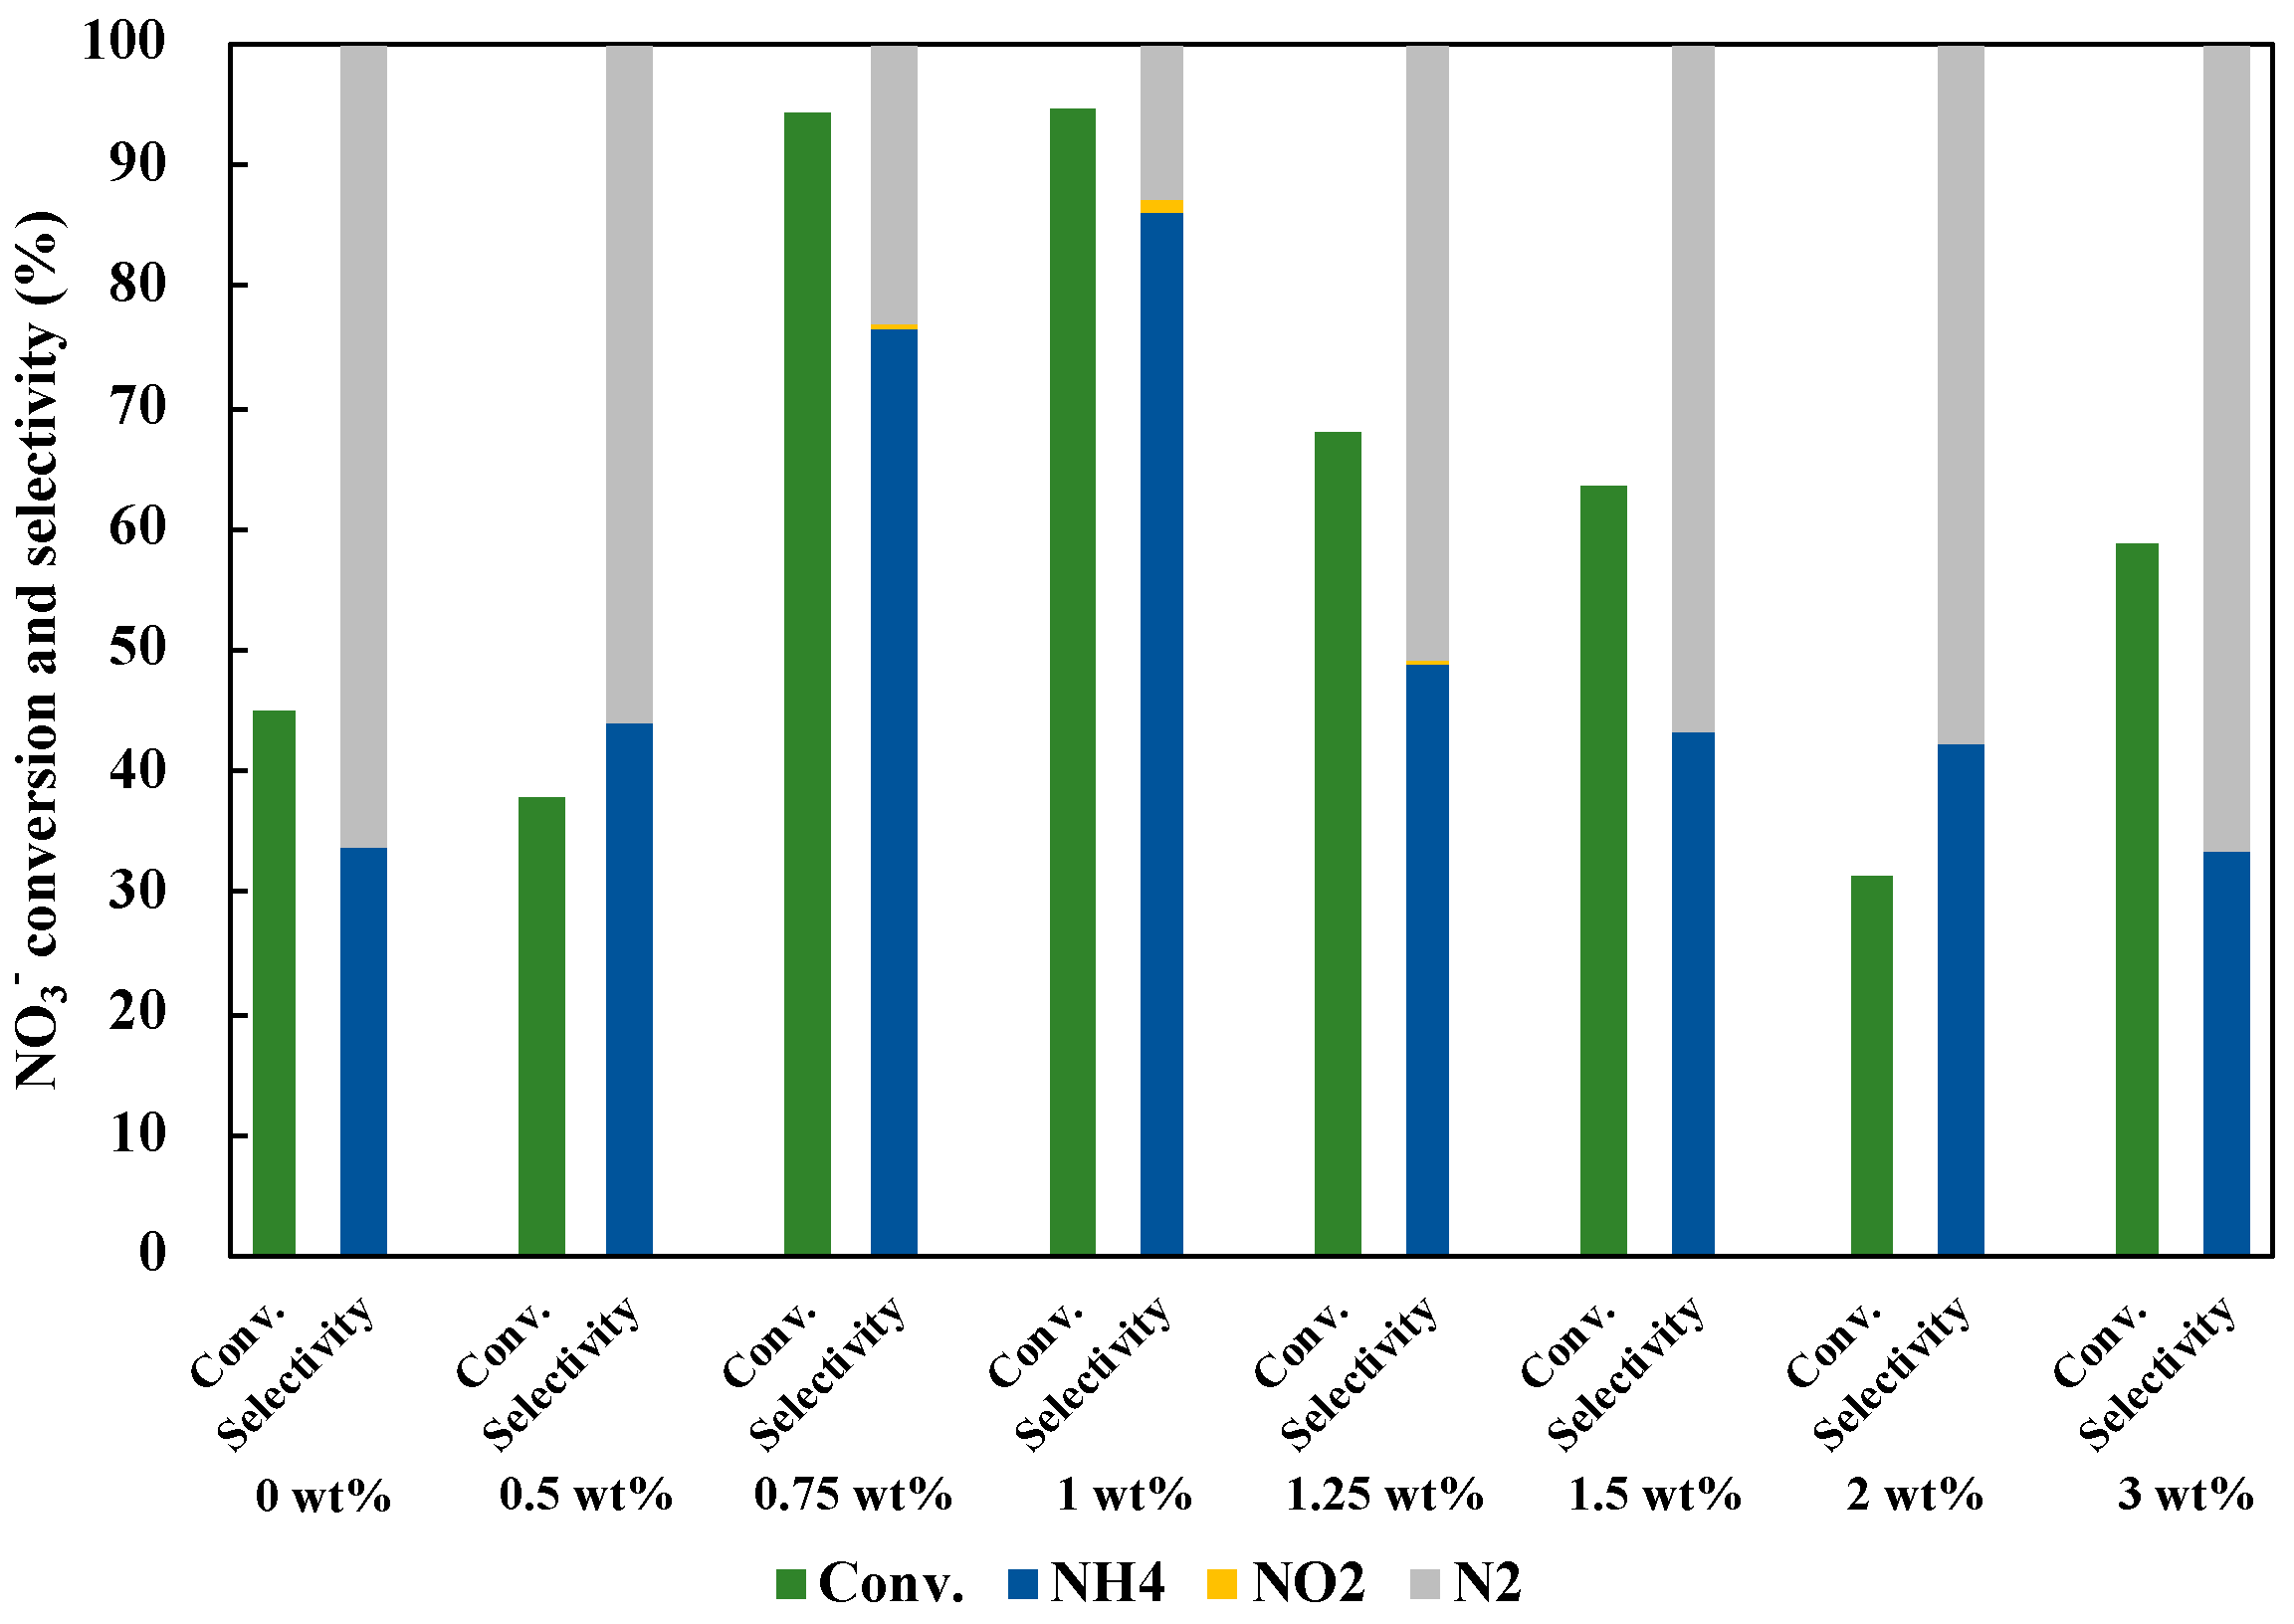
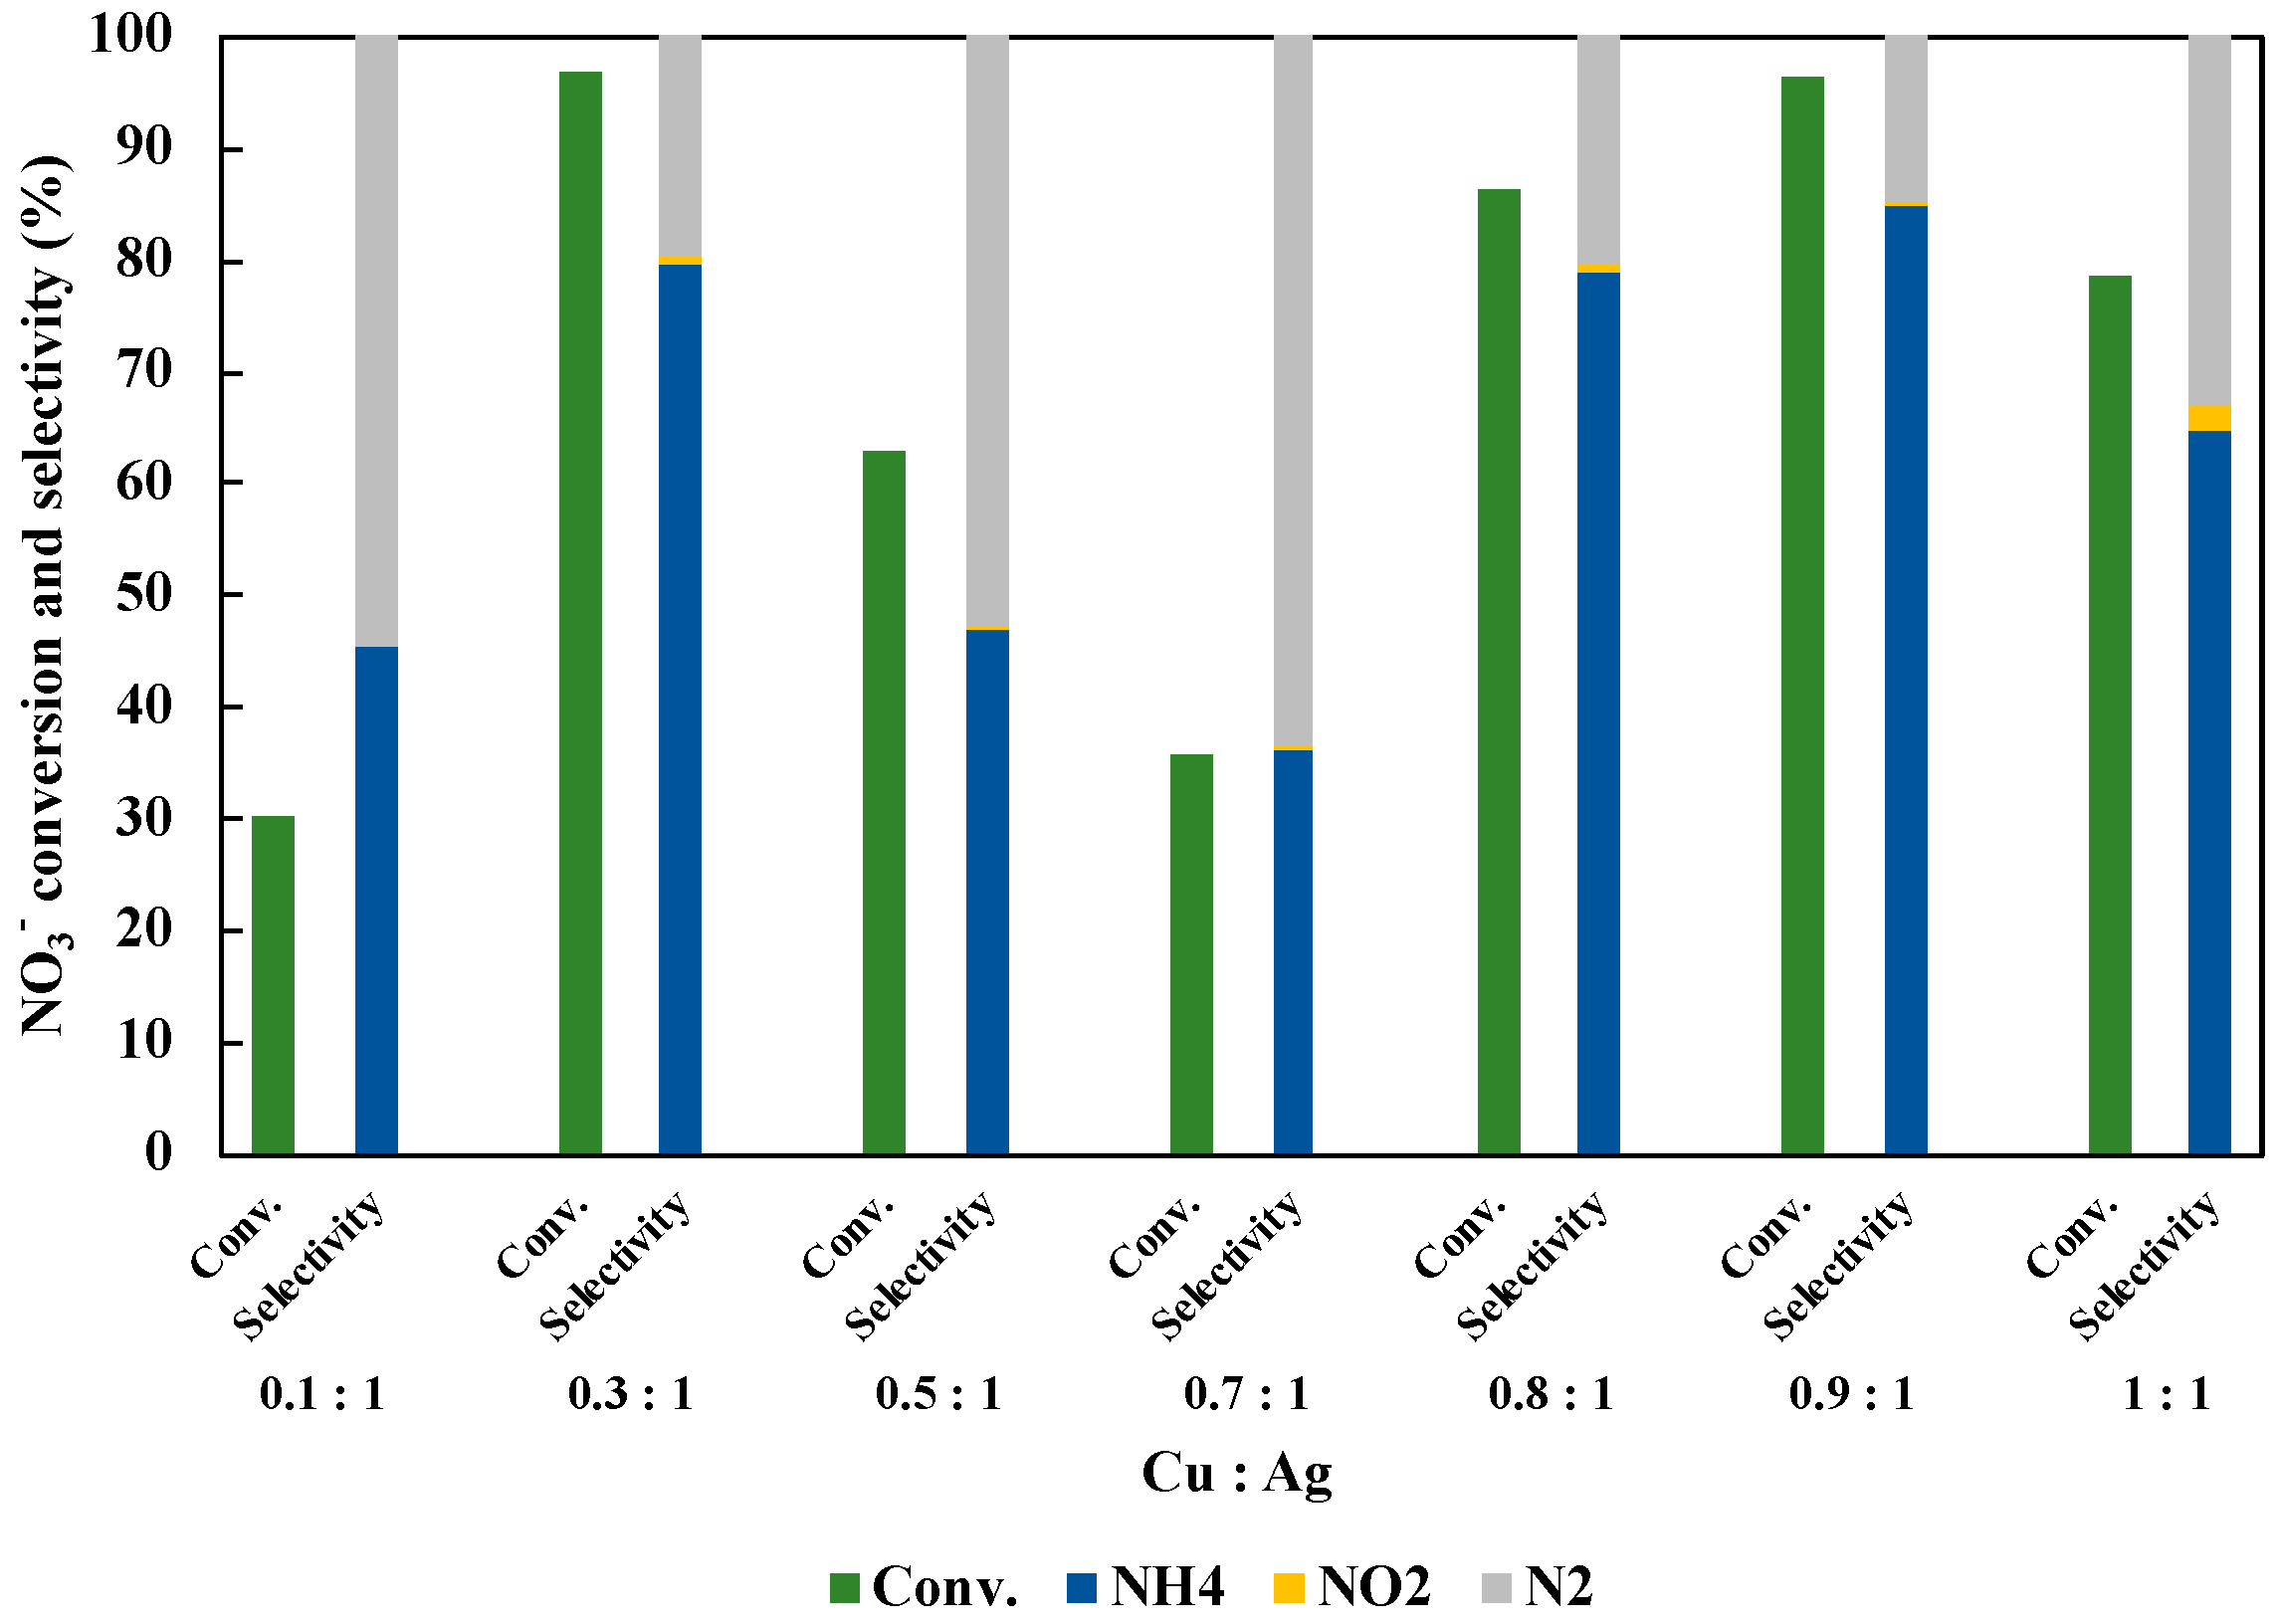
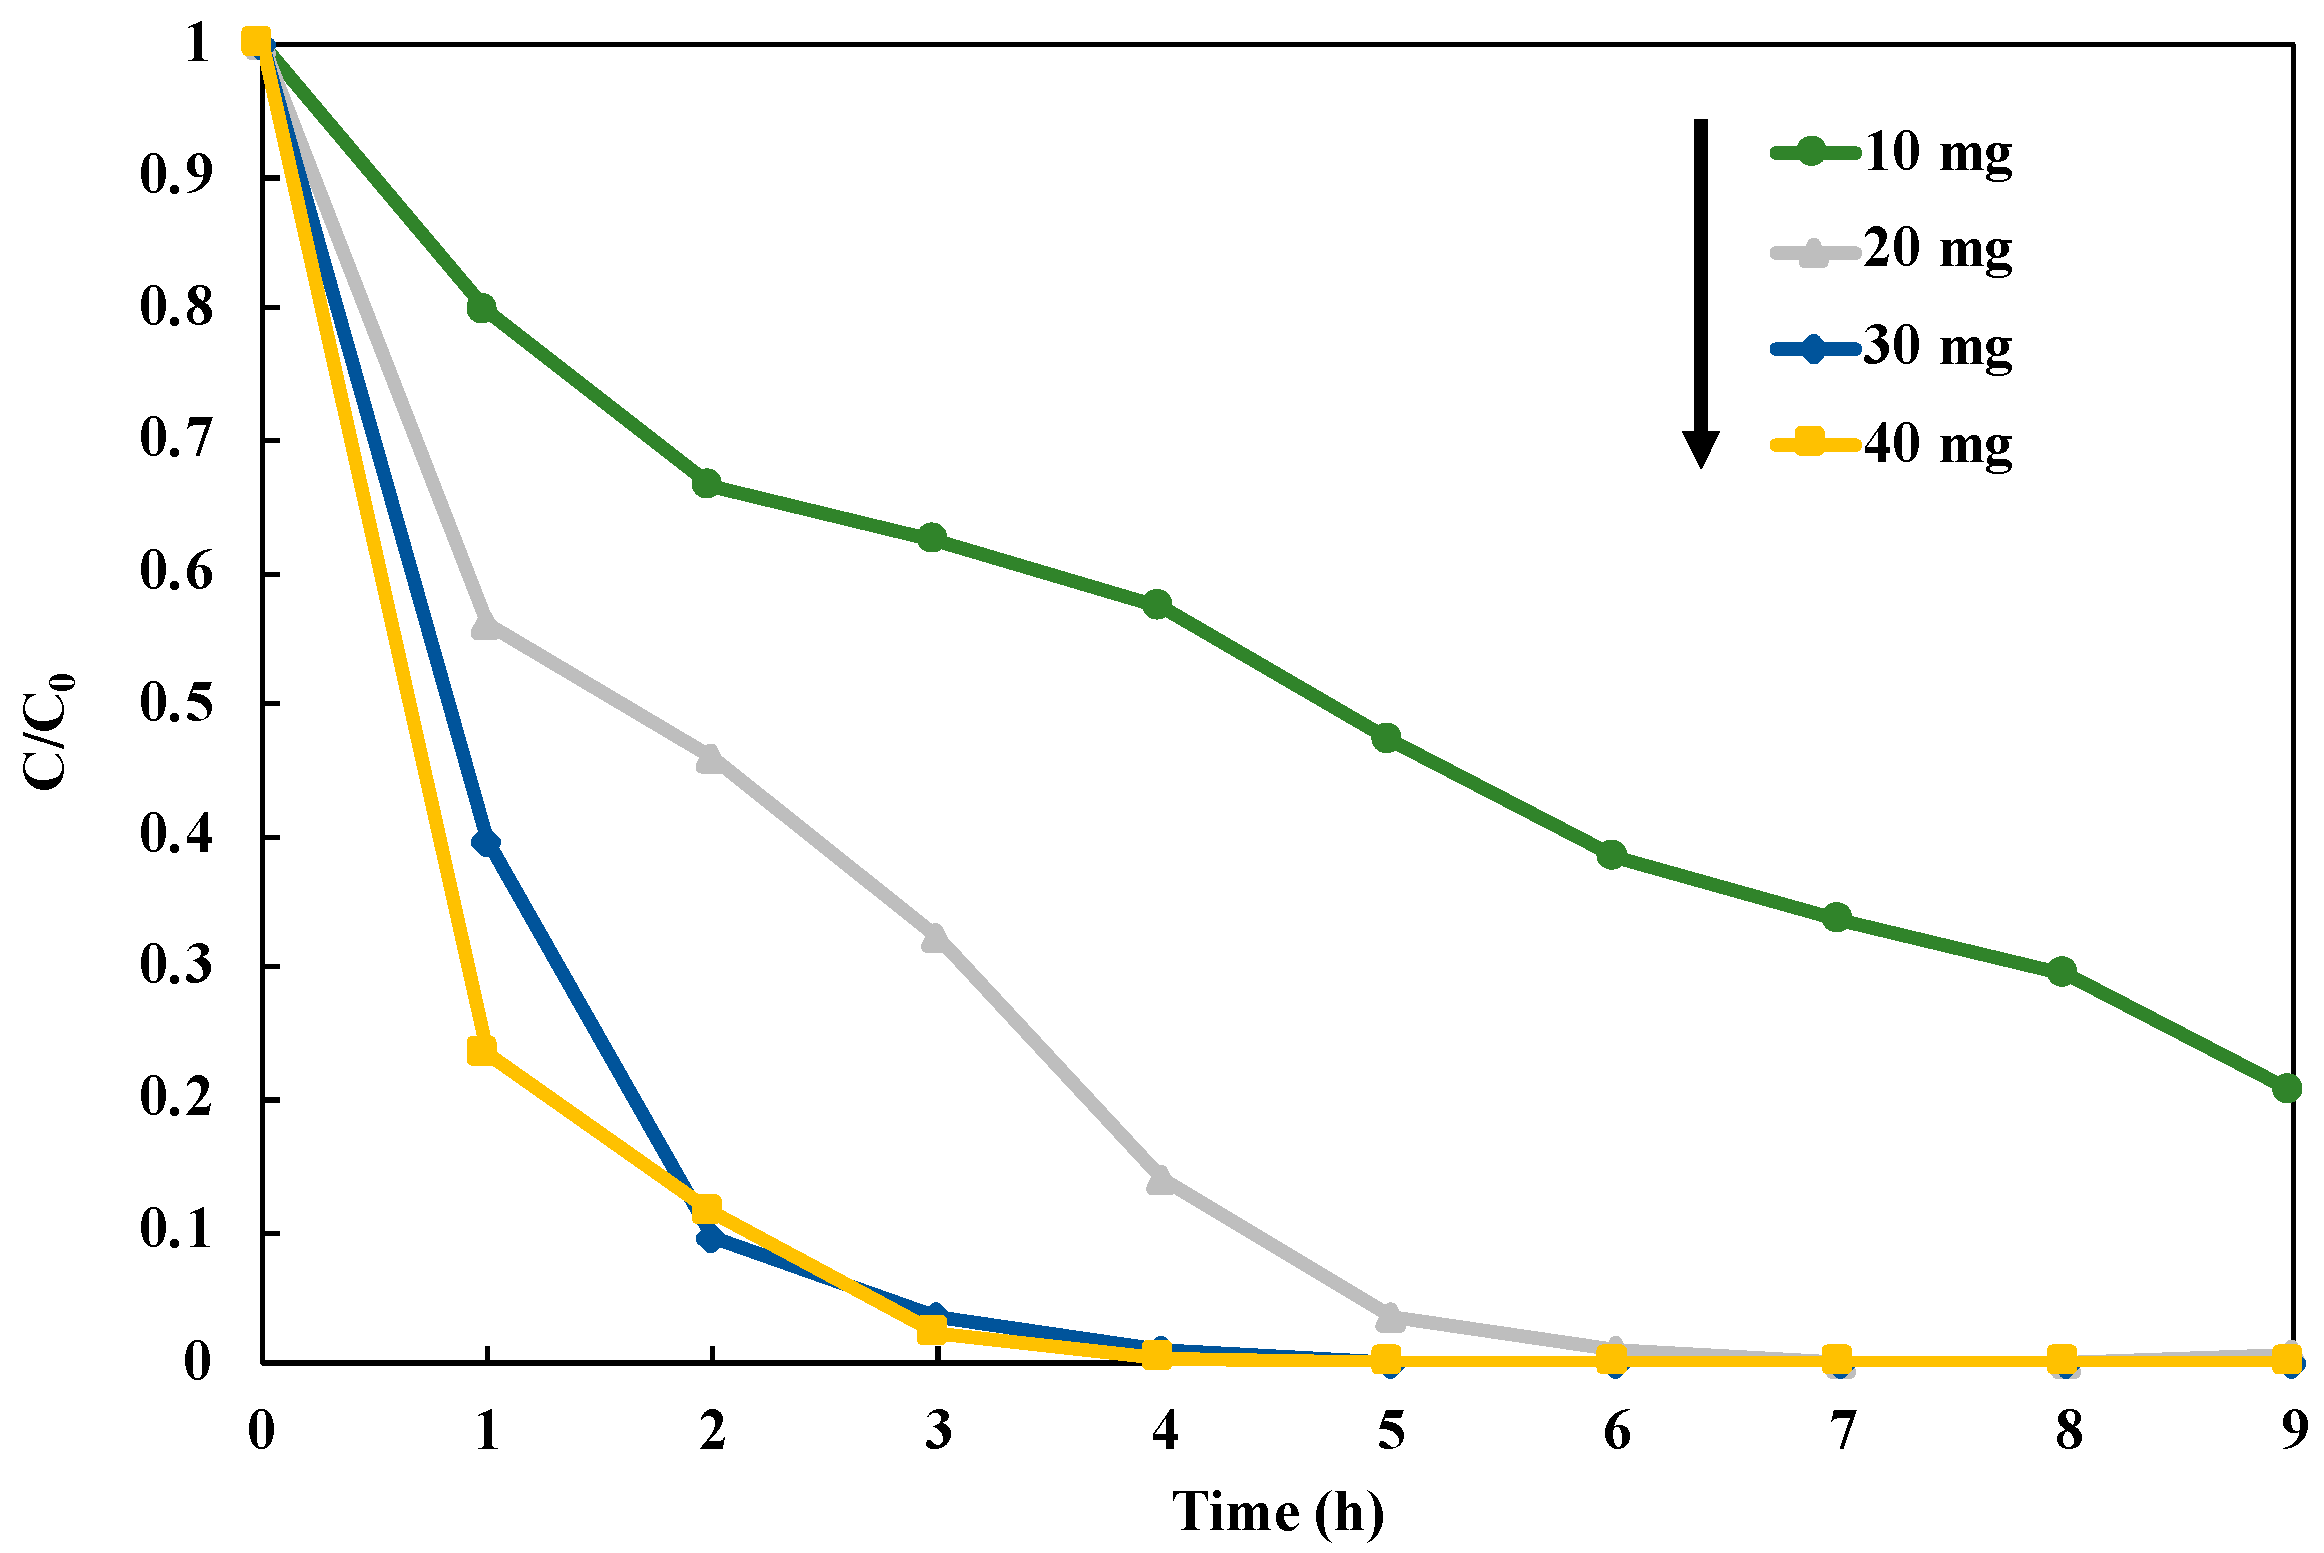
3.4. Optimization of Structure and Loading Amount of CuAg/TiO2
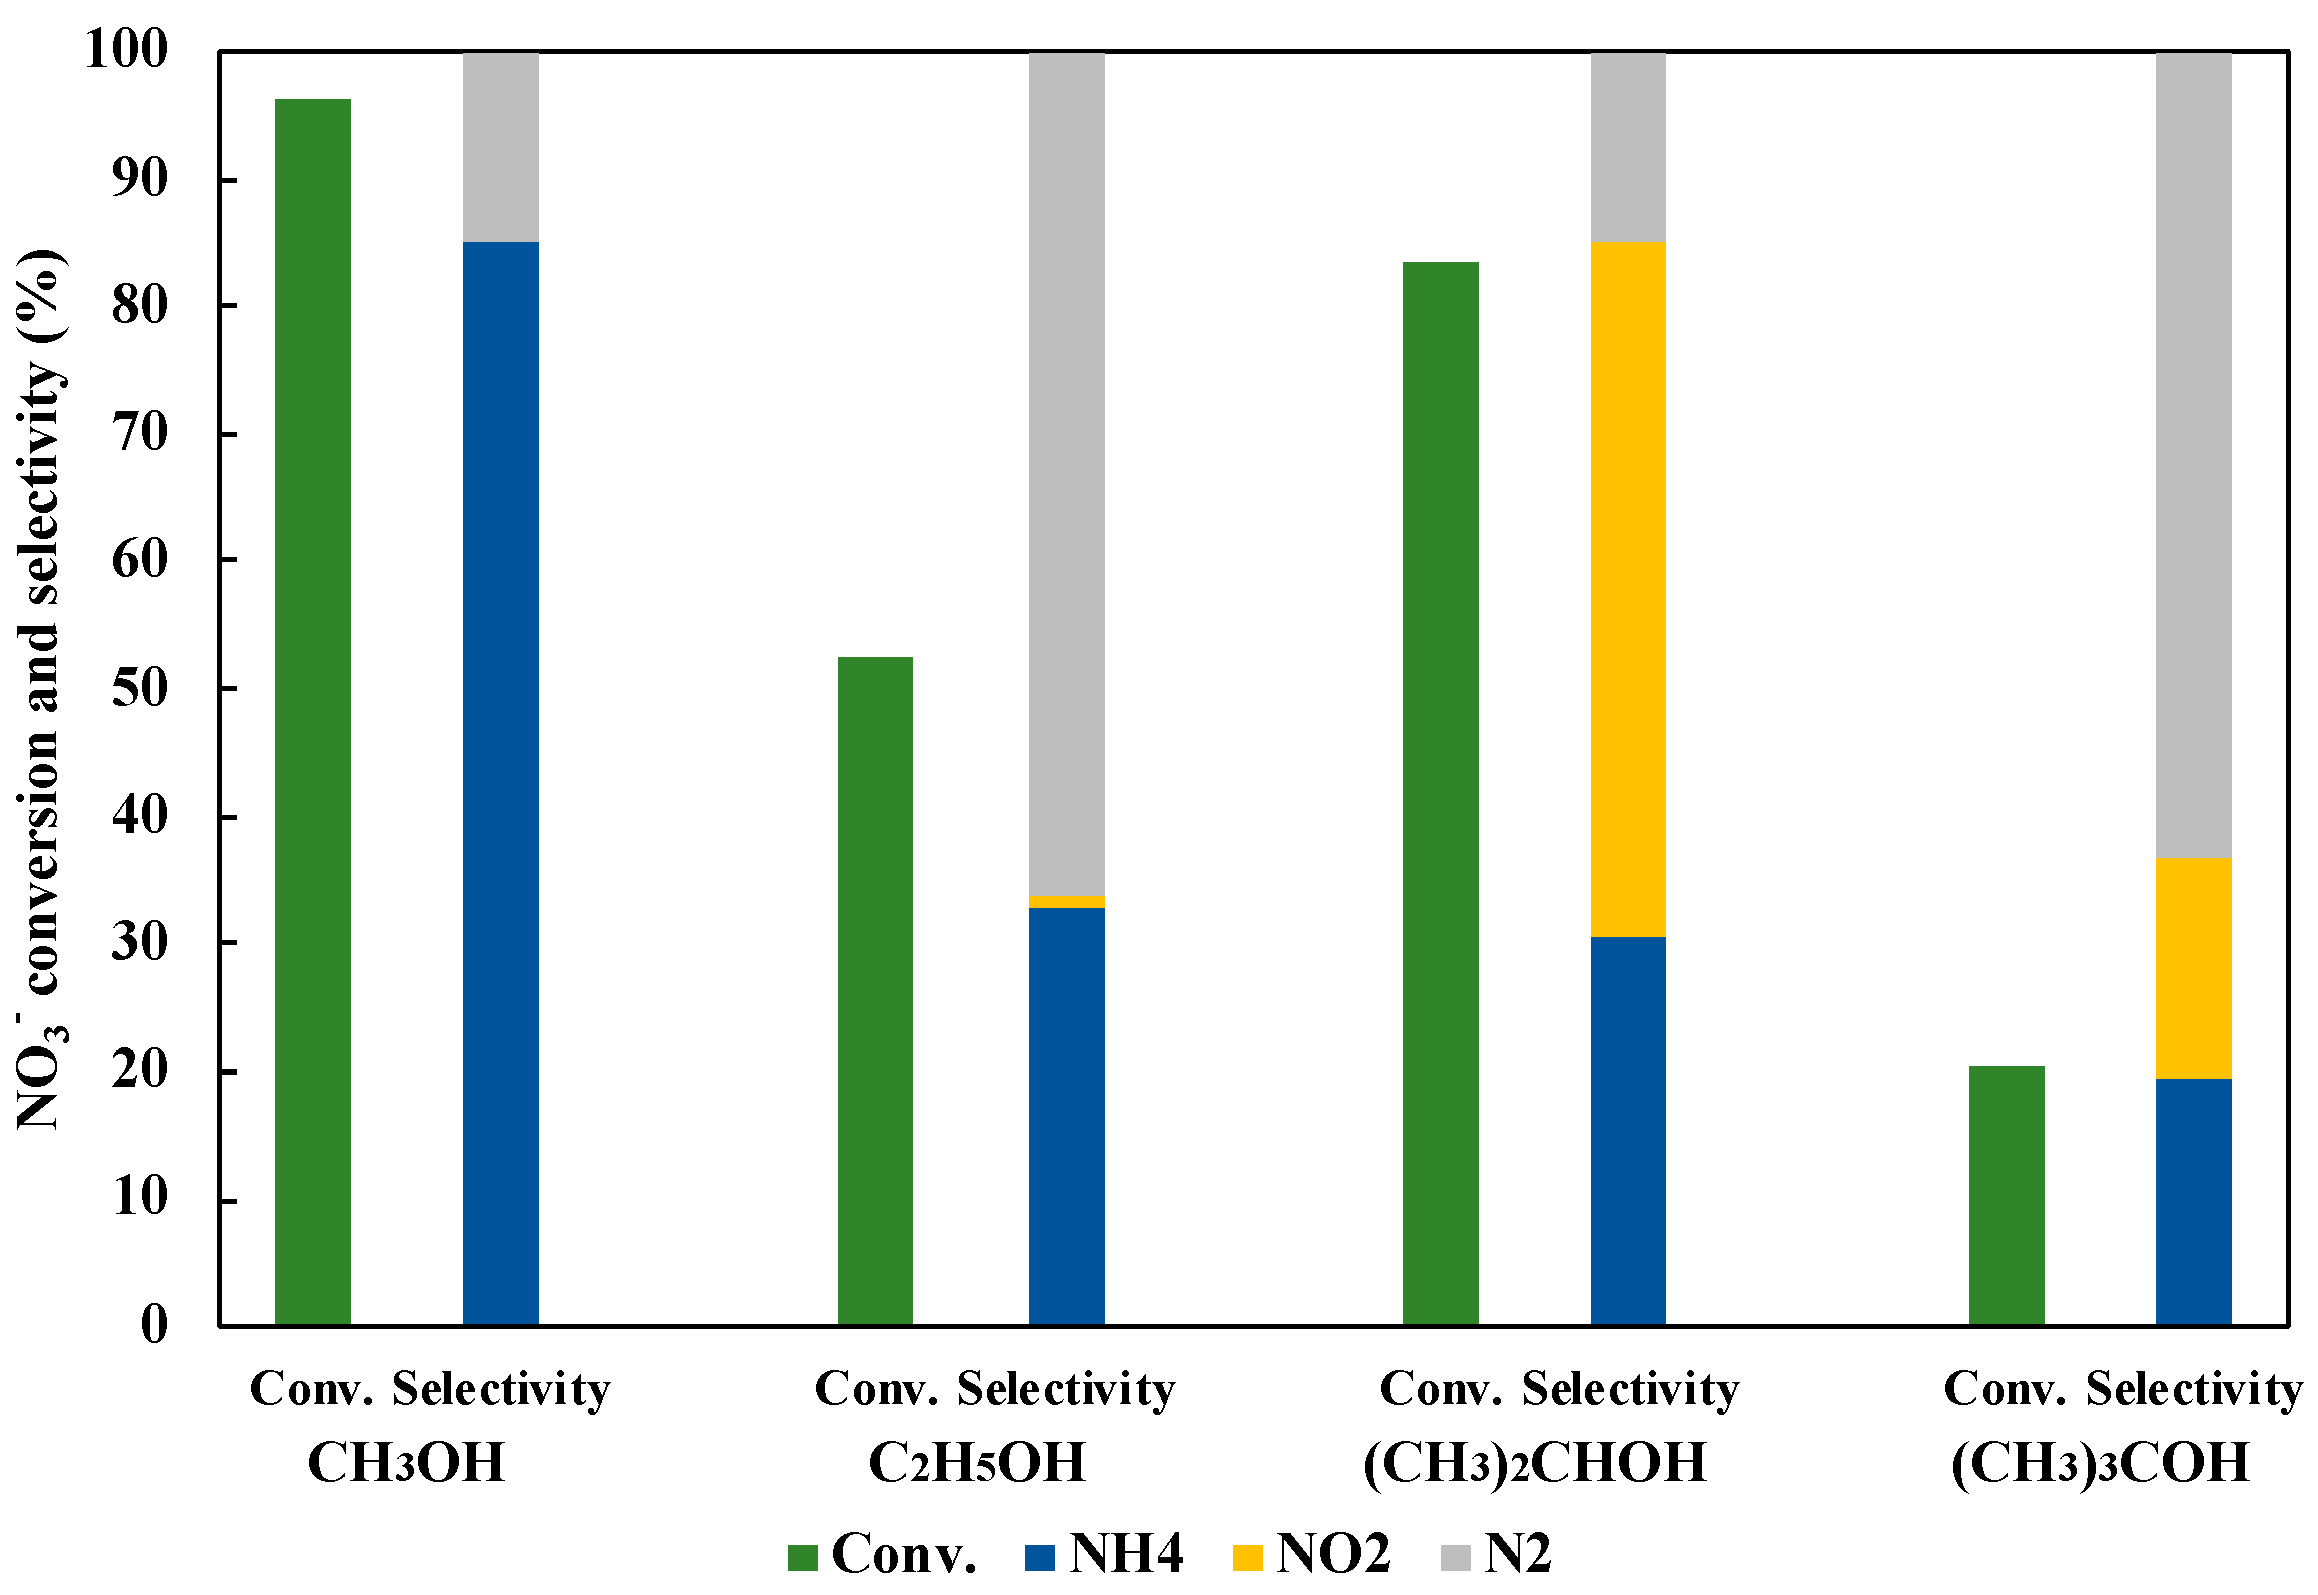
3.5. Effect of Hole Scavenger on NO3− Reduction to NH3
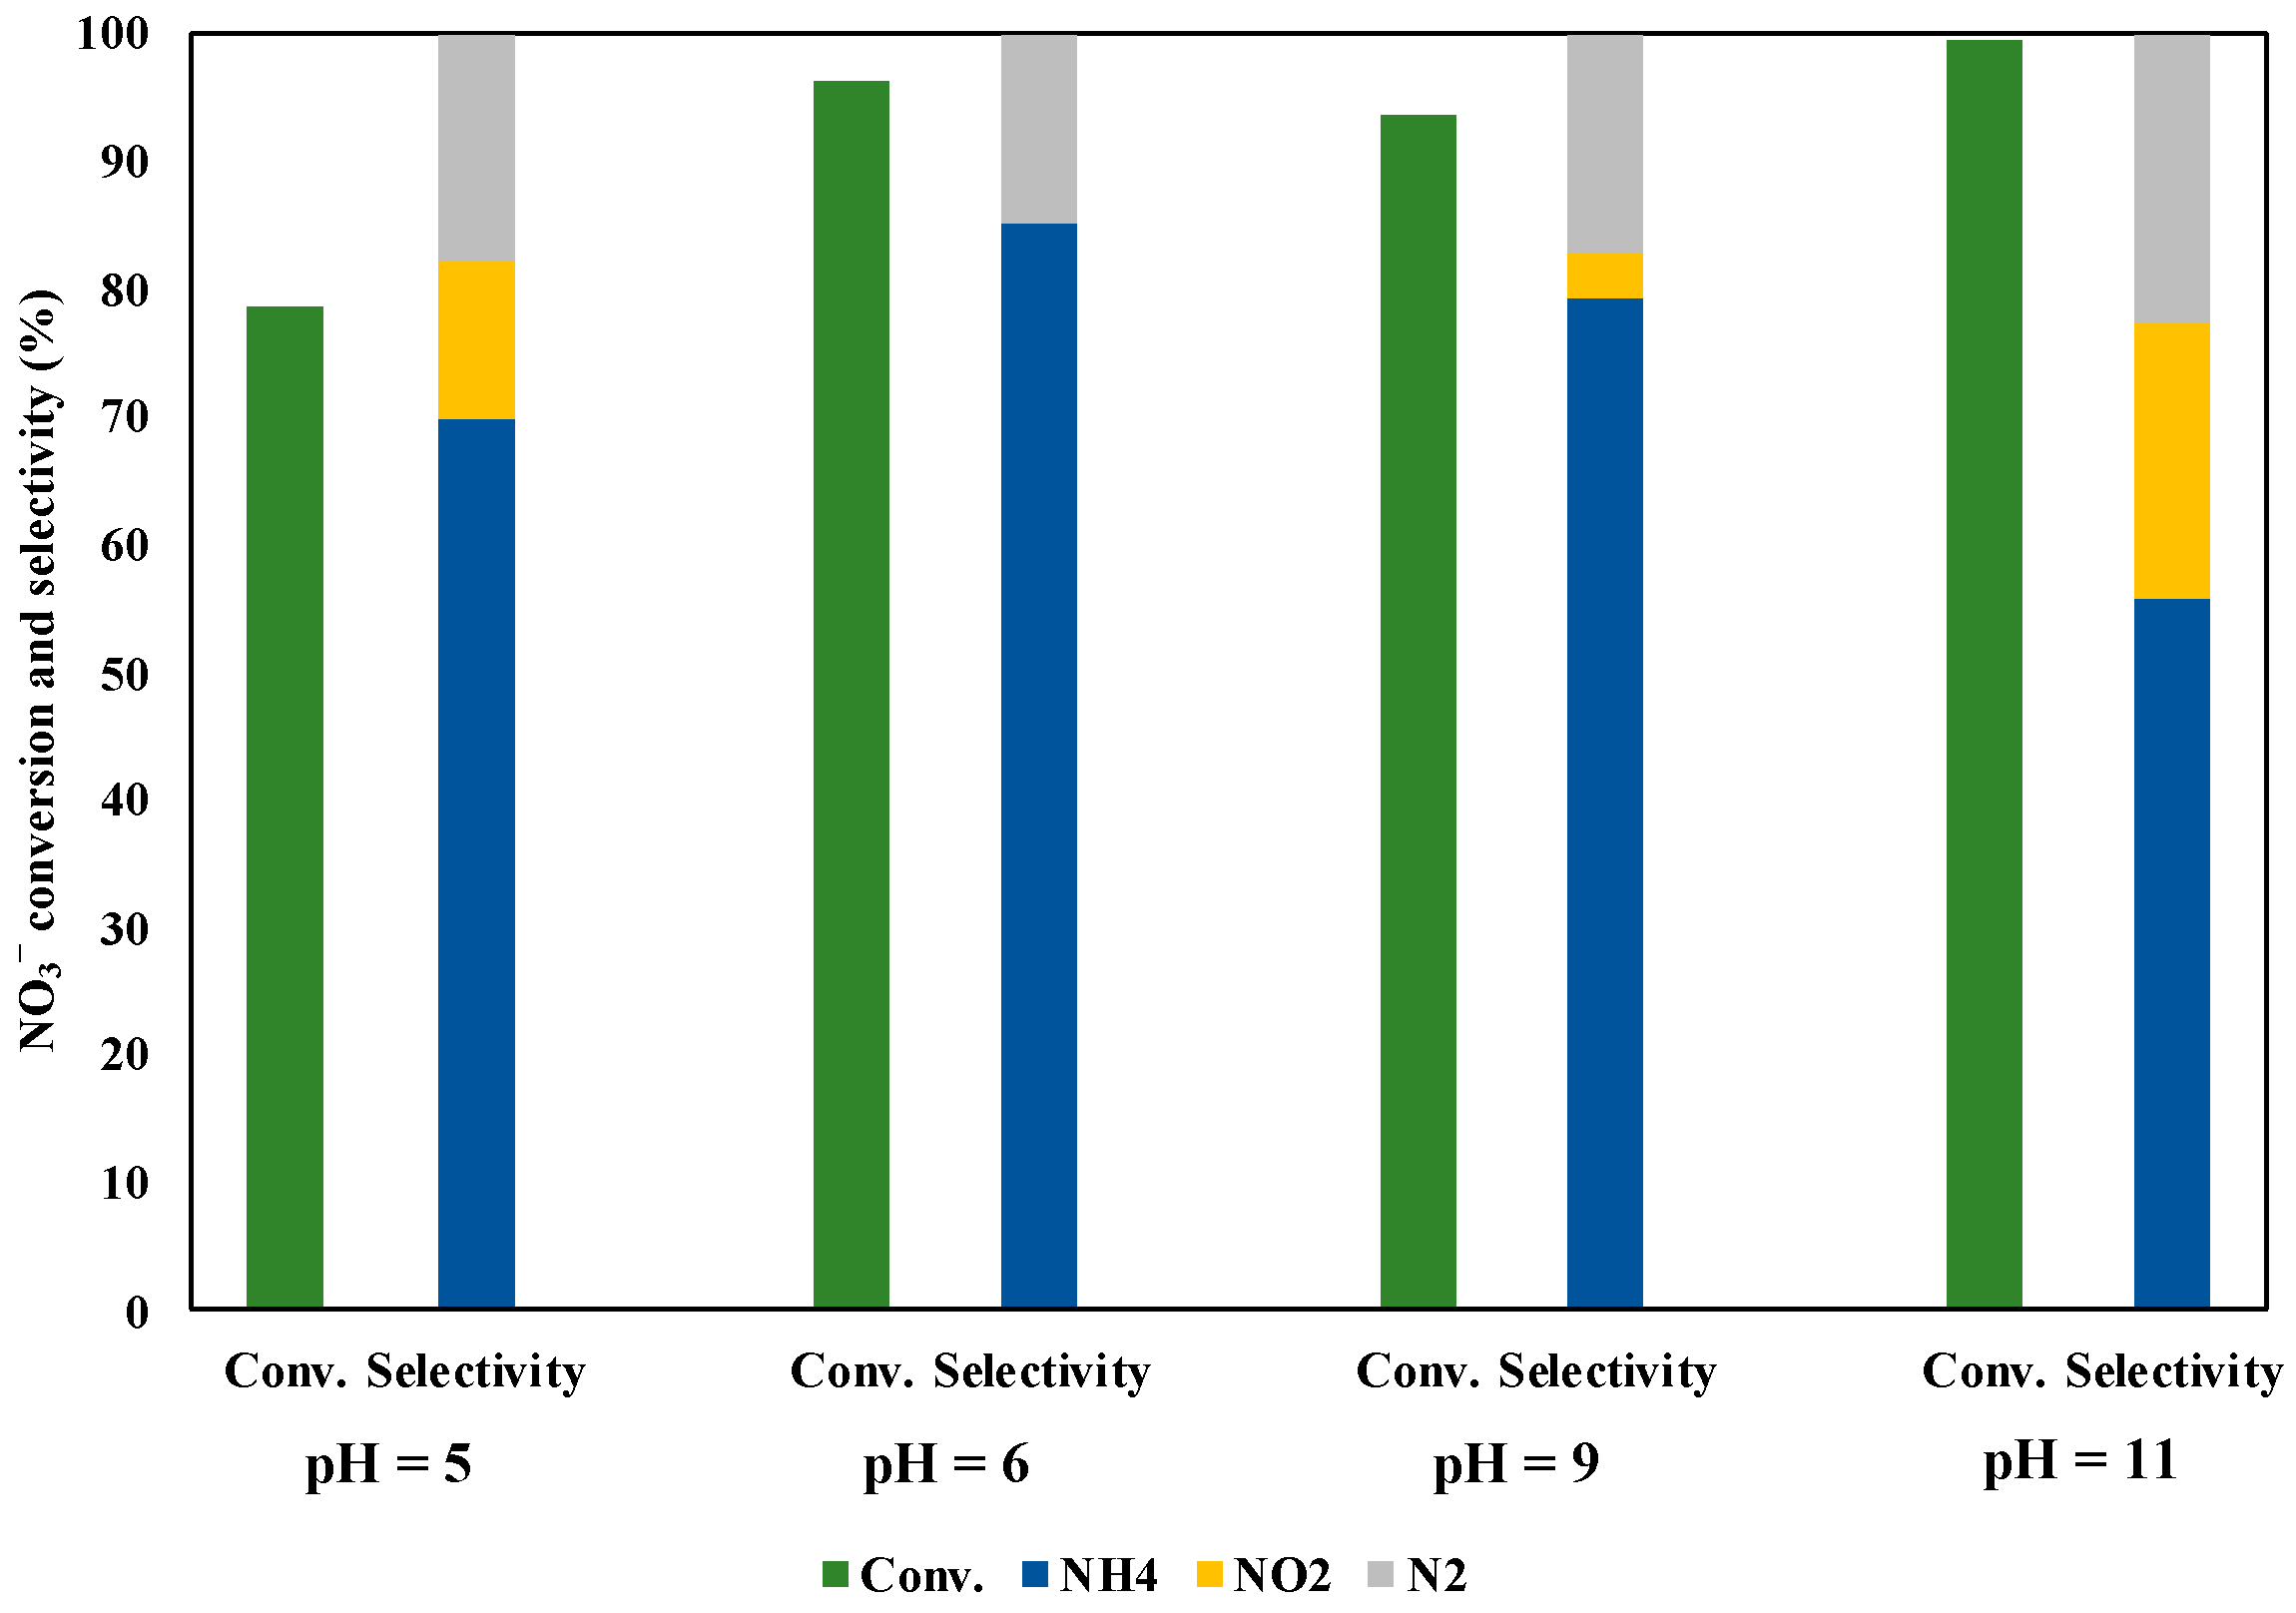
3.6. Effect of pH
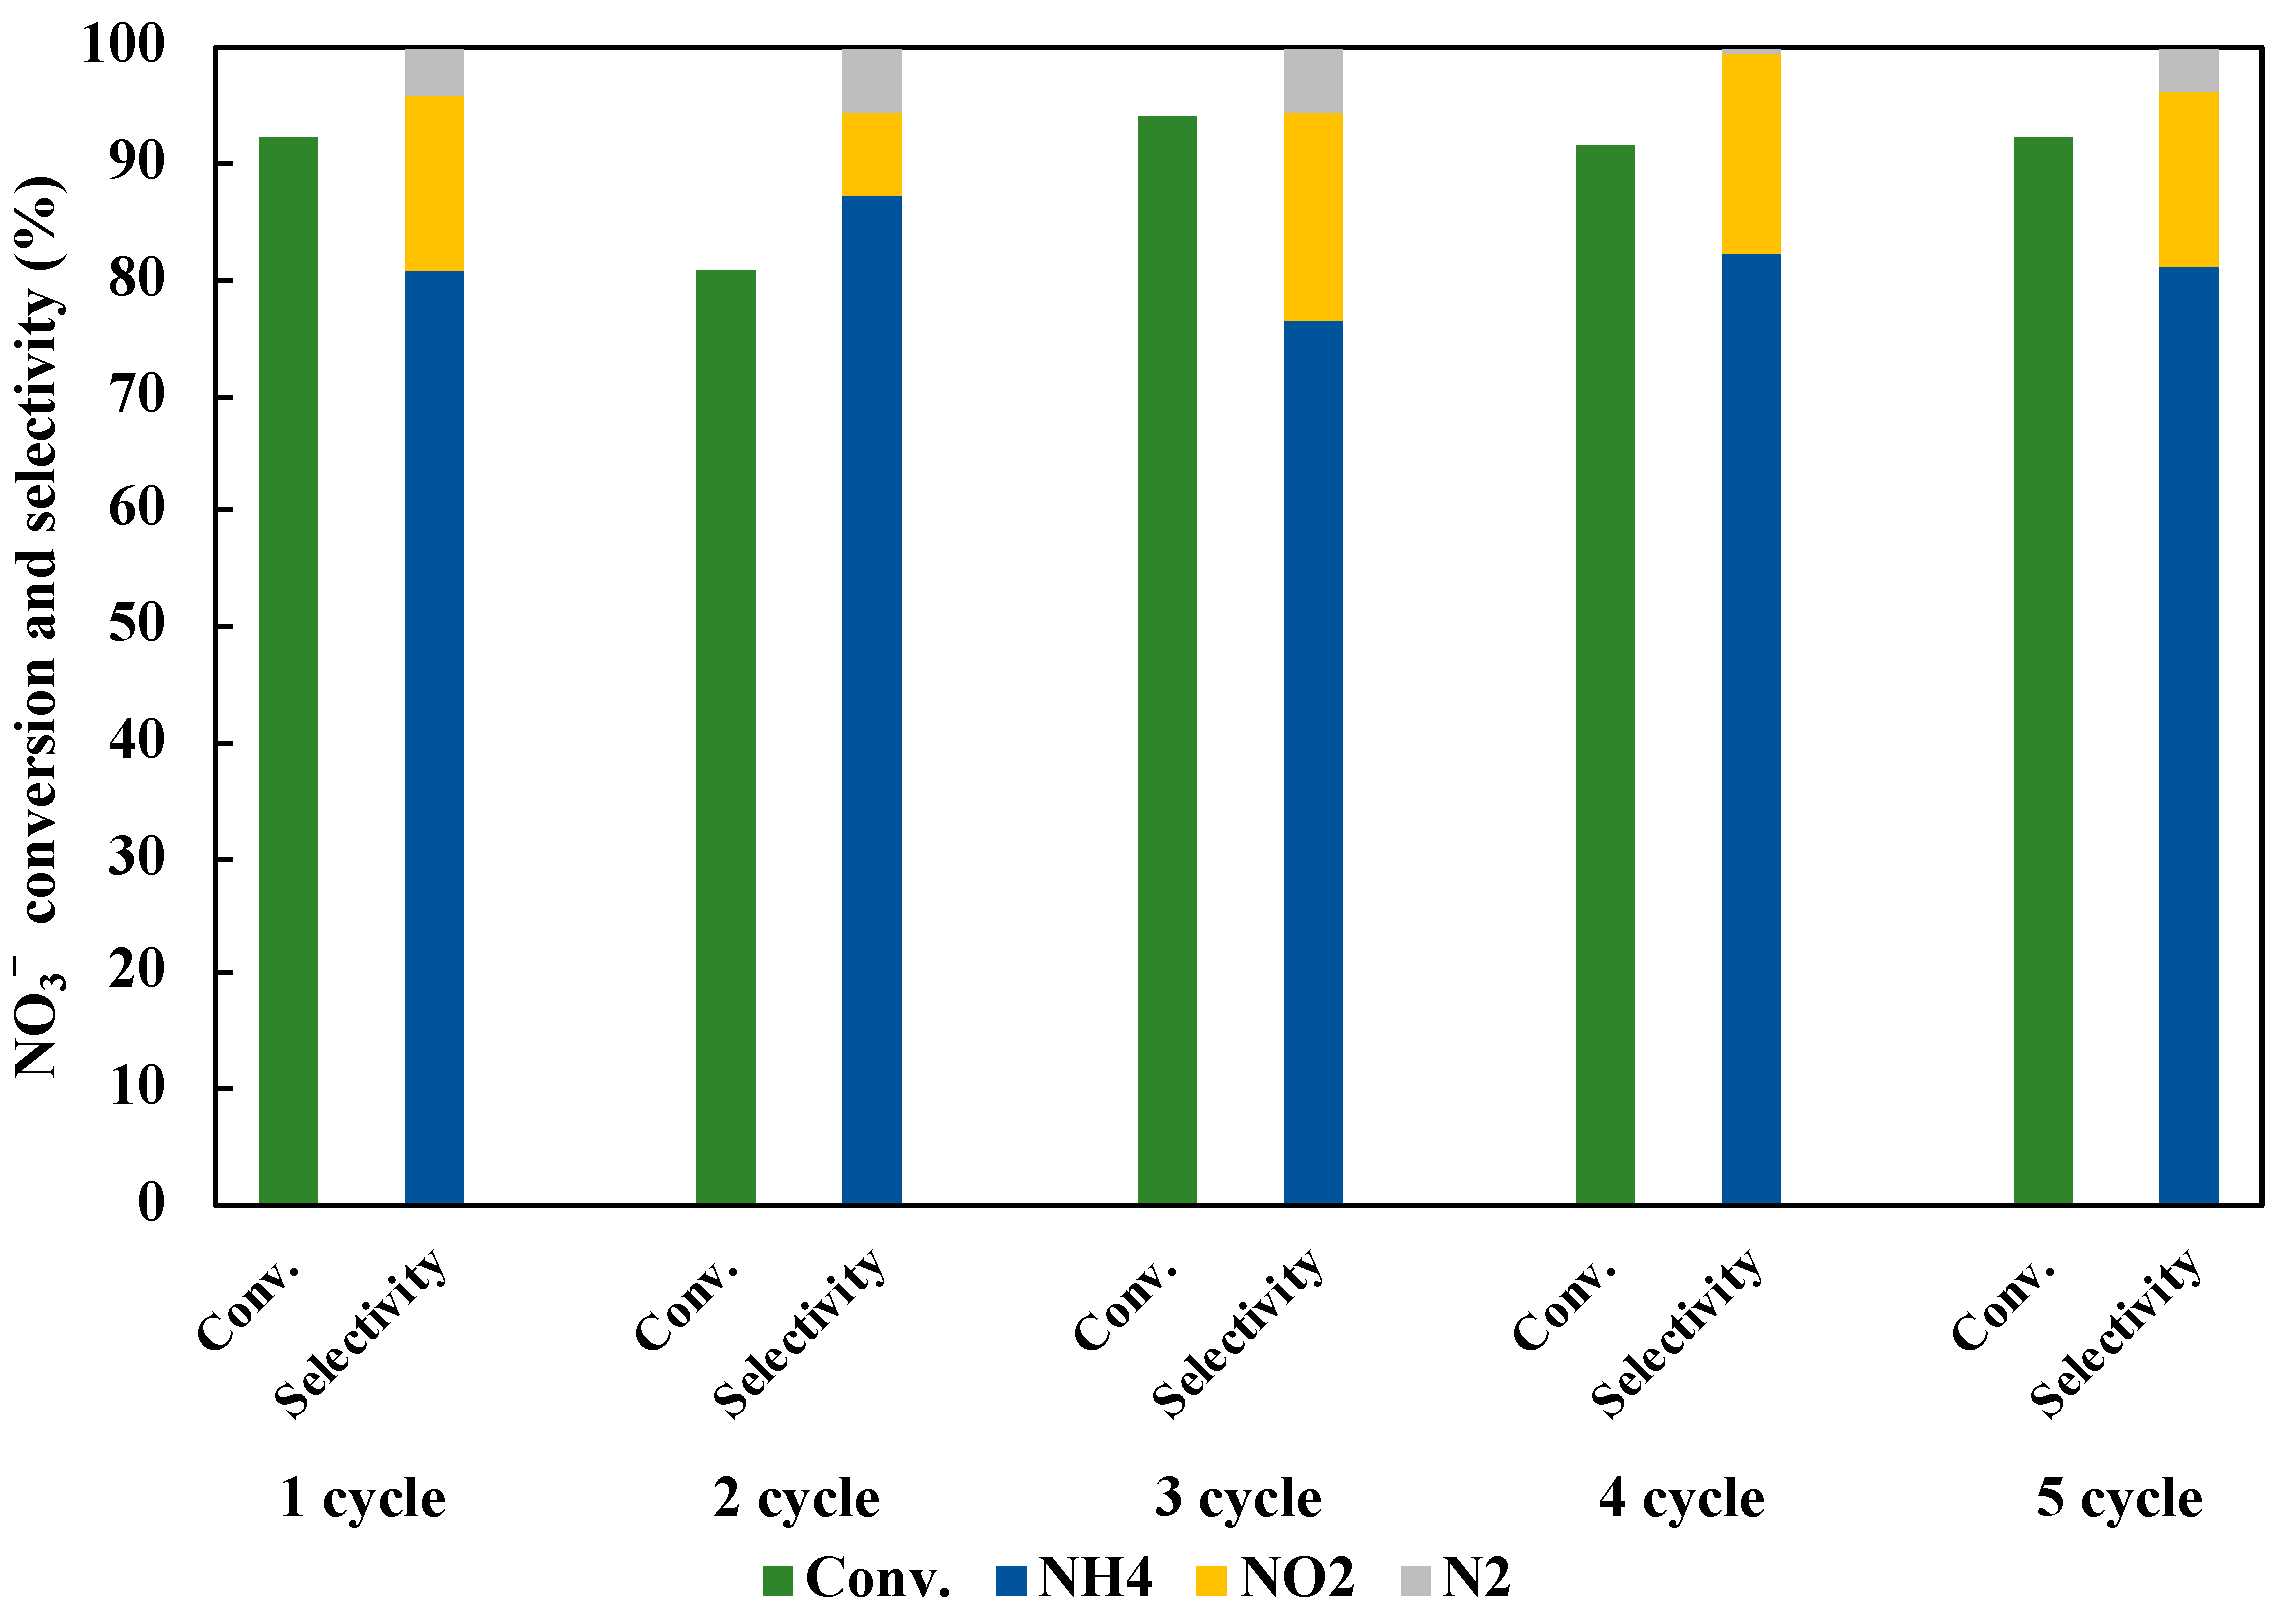
3.7. Reusability of Photocatalyst in NO3− Reduction to NH3
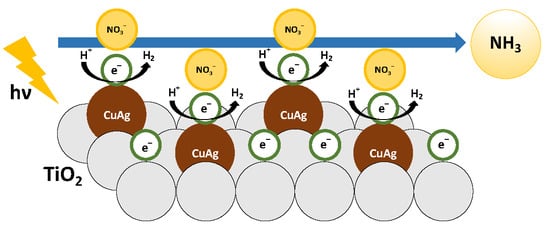
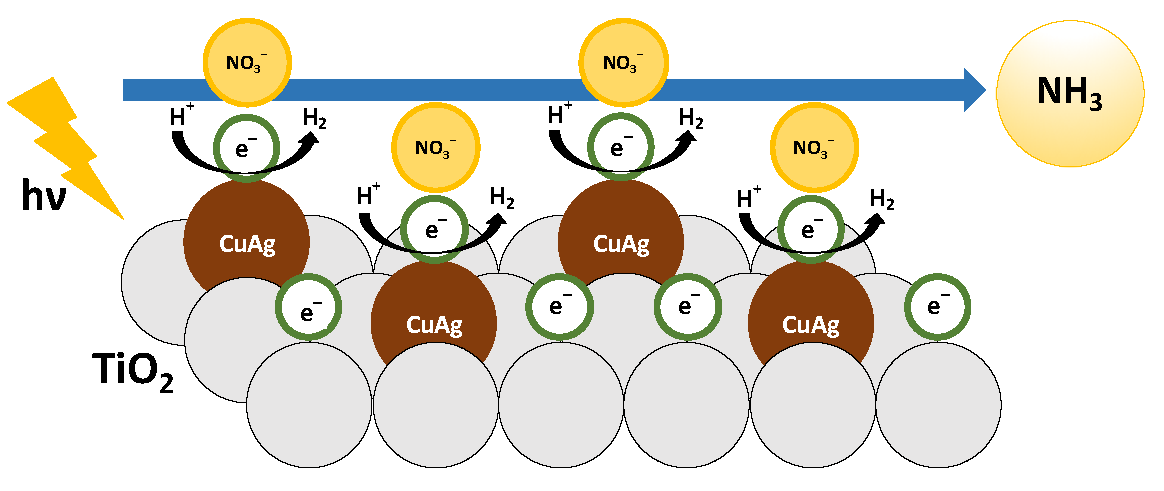
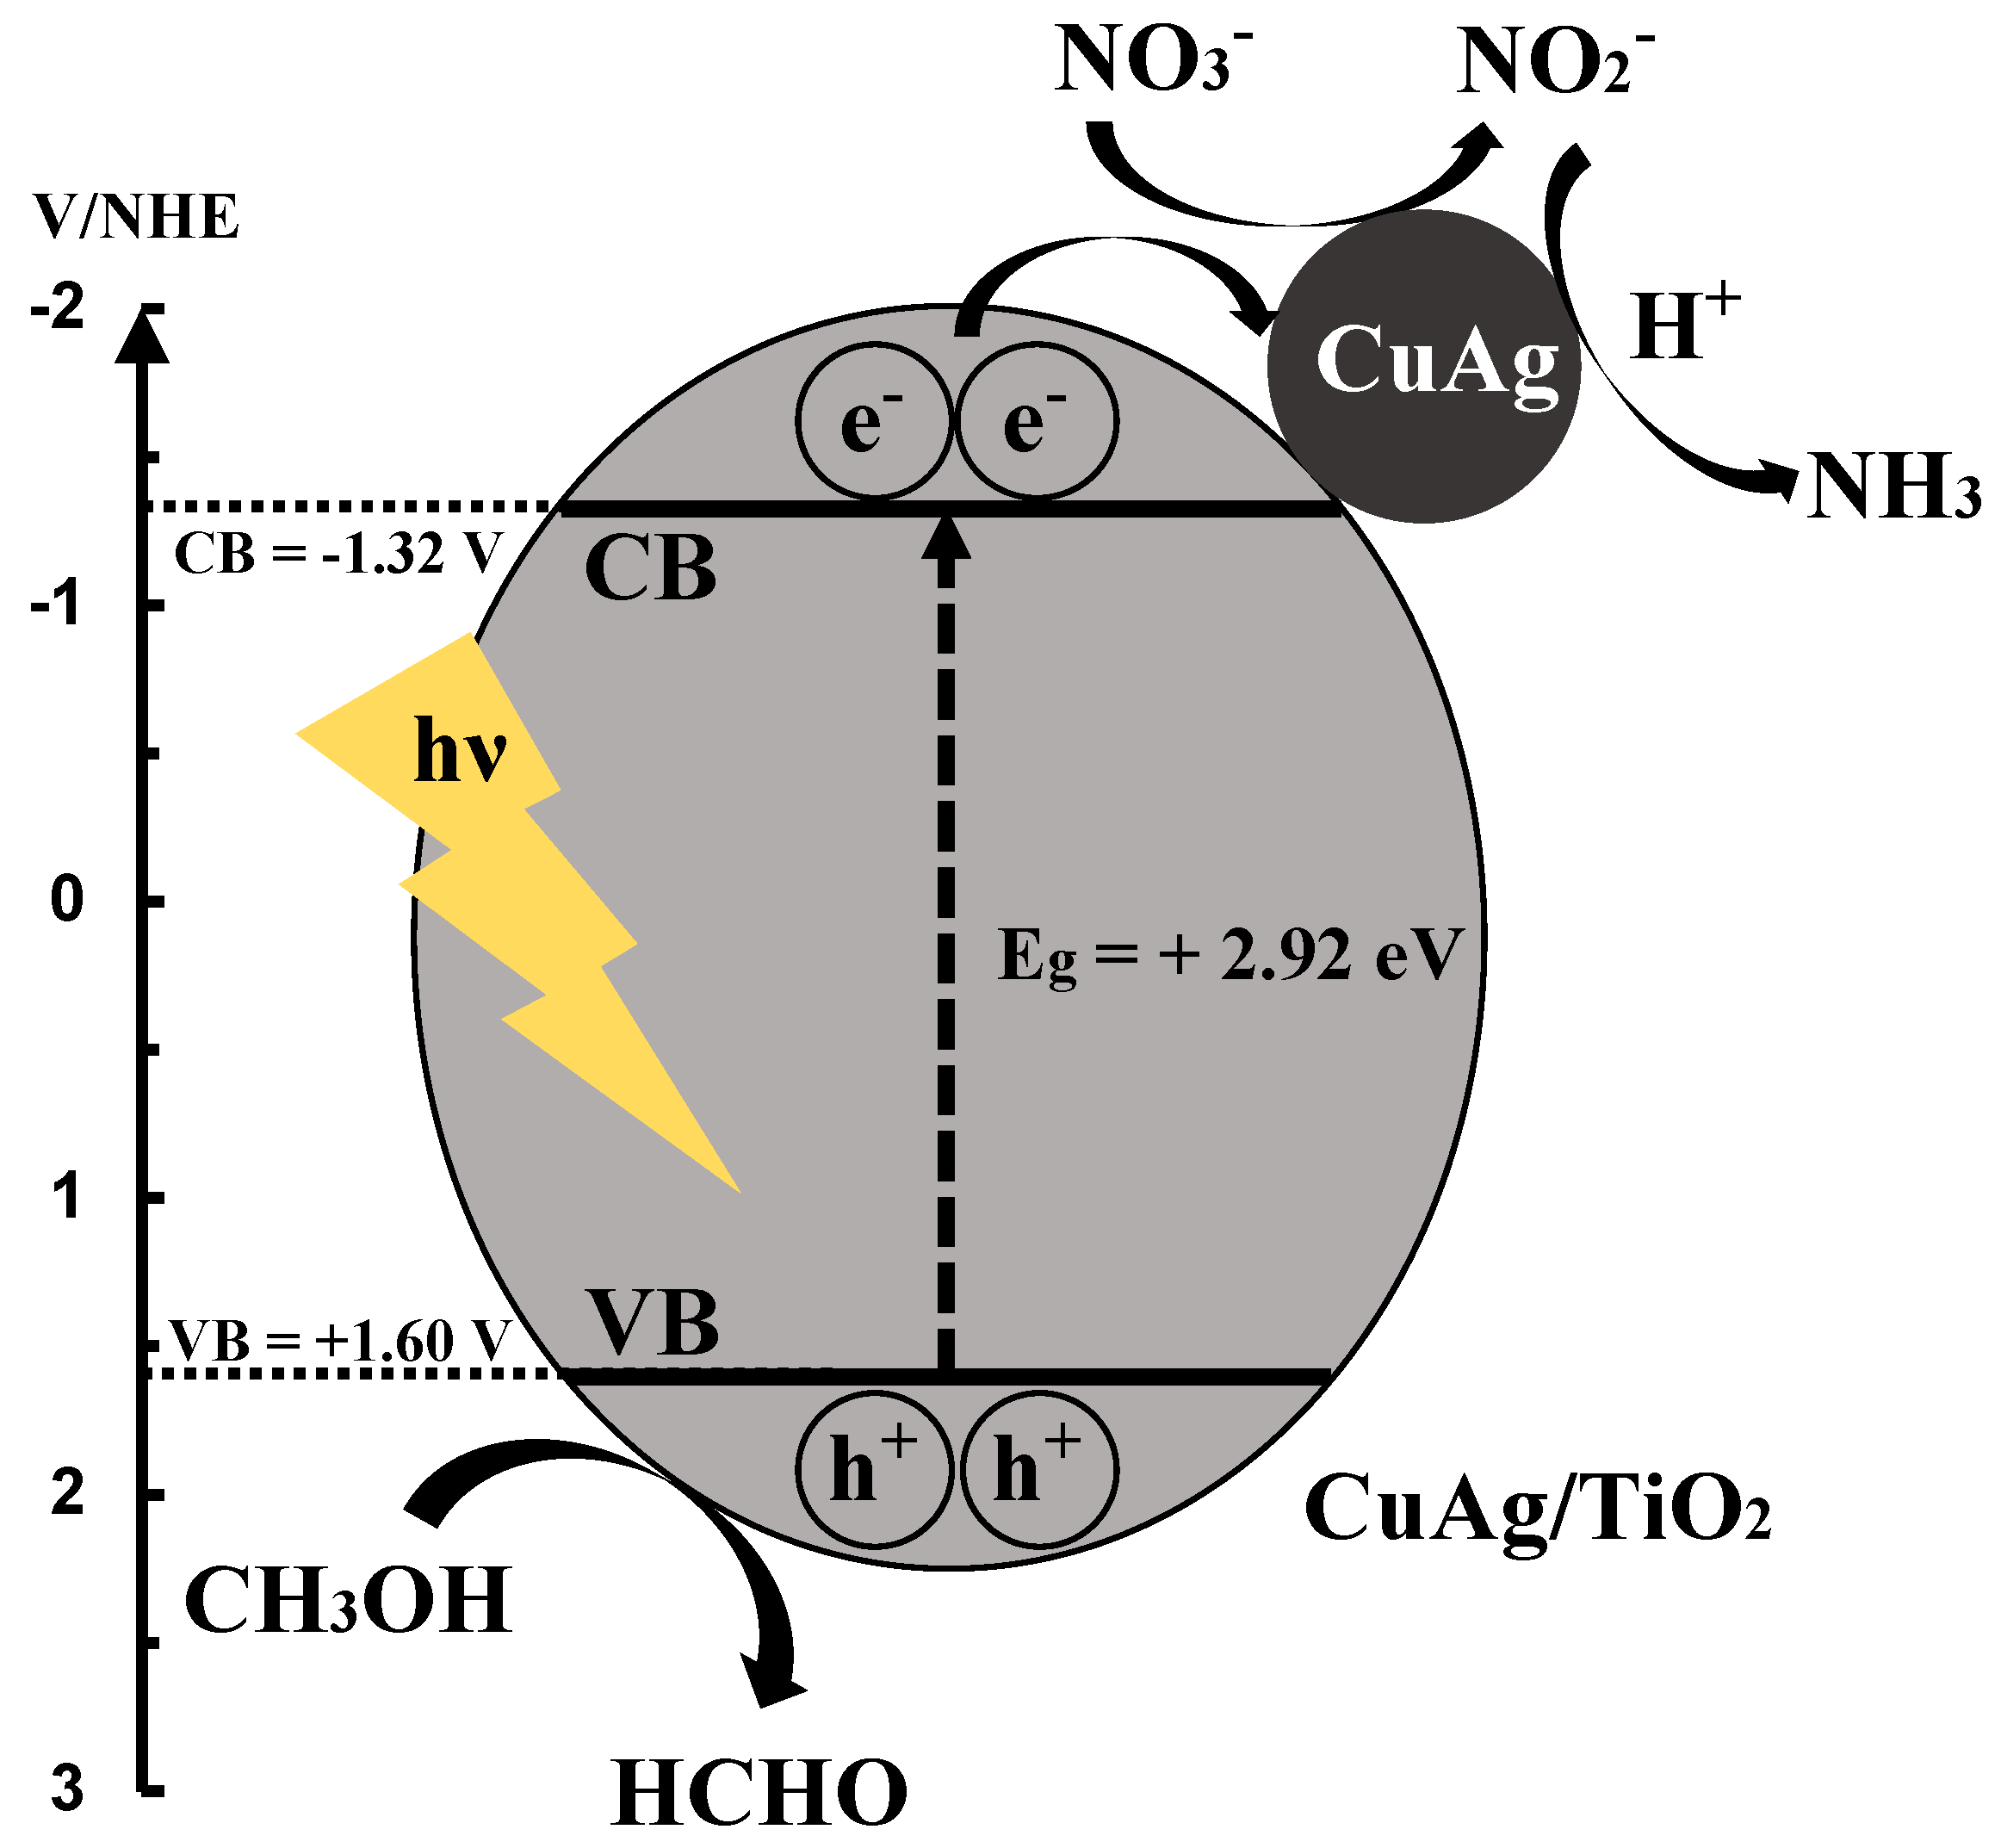
3.8. Reaction Mechanism of Photocatalytic NO3− Reduction to NH3
4. Conclusions
Supplementary Materials
Author Contributions
Funding
Acknowledgments
Conflicts of Interest
References
- Gruber, N.; Galloway, J.N. An earth-system perspective of the global nitrogen cycle. Nature 2008, 451, 293–296. [Google Scholar] [CrossRef] [PubMed]
- Giddey, S.; Badwal, S.P.S.; Kulkarni, A. Review of electrochemical ammonia production technologies and materials. Int. J. Hydrogen Energy 2013, 38, 14576–14594. [Google Scholar] [CrossRef]
- McEaney, J.M.; Singh, A.R.; Schwalbe, J.A.; Kibsgaard, J.; Lin, J.C.; Cargnello, M.; Jaramillo, T.F.; Nørscov, J.K. Ammonia synthesis from N2 and H2O using a lithium cycling electrification strategy at atmospheric pressure. Energy Environ. Sci. 2017, 10, 1621–1630. [Google Scholar] [CrossRef]
- Baltrusaitis, J. Sustainable ammonia production. ACS Sustain. Chem. Eng. 2017, 5, 9527. [Google Scholar] [CrossRef]
- Jungmi, H.; Steven, P.; Anthony, B.M. Plasma catalysis as an alternative route for ammonia production: status, mechanisms, and prospects for progress. ACS Sustain. Chem. Eng. 2018, 6, 15–31. [Google Scholar]
- Yusuf, B.; Ibrahim, D. Assessment of a sustainable electrochemical ammonia production system using photoelectrochemically produced hydrogen under concentrated sunlight. ACS Sustain. Chem. Eng. 2017, 5, 8035–8043. [Google Scholar]
- Pratham, A.; Andrew, F.A.H.; Sanjay, M.M.; Anuradda, G. Small-scale ammonia production from biomass: A techno-enviro-economic perspective. Ind. Eng. Chem. Res. 2016, 55, 6422–6434. [Google Scholar]
- Ranjit, K.T.; Varadarajan, T.K.; Viswanathan, B. Photocatalytic reduction of dinitrogen to ammonia over noble-metal-loaded TiO2. J. Photochem. Photobiol. A Chem. 1996, 96, 181–185. [Google Scholar] [CrossRef]
- Ozaki, A.; Aika, K. Catalytic activation of dinitrogen. Catal. Sci. Technol. 1981, 1, 87–158. [Google Scholar]
- Oshikiri, T.; Ueno, K.; Misawa, H. Plasmon-induced ammonia synthesis through nitrogen photofixation with visible light irradiation. Angew. Chem. Int. Ed. Engl. 2014, 53, 9802–9805. [Google Scholar] [CrossRef] [PubMed]
- Li, H.; Shang, J.; Shi, J.; Zhao, K.; Zhang, L. Facet-dependent solar ammonia synthesis of BiOCl nanosheets via a proton-assisted electron transfer pathway. Nanoscale 2016, 8, 1986–1993. [Google Scholar] [CrossRef] [PubMed]
- Koltsakidou, A.; Antonopoulou, M.; Evgenidou, E.; Konstantinou, I.; Gianakas, A.E.; Papadaki, M.; Bikiaris, D.; Lambropoulou, D.A. Photocatalytical removal of fluorouracil using TiO2-P25 and N/S doped TiO2 catalysts: A kinetic and mechanistic study. Sci. Total Environ. 2017, 578, 257–267. [Google Scholar] [CrossRef]
- Xue, Y.; Song, J.; Zhang, Y.; Kong, F.; Wen, M.; Zhang, G. Nitrate pollution and preliminary source identification of surface water in a semi-arid river basin, using isotopic and hydrochemical approaches. Water 2016, 8, 328. [Google Scholar] [CrossRef]
- Kato, H.; Kudo, A. Photocatalytic reduction of nitrate ions over tantalate photocatalysts. Phys. Chem. Chem. Phys. 2002, 4, 2833–2838. [Google Scholar] [CrossRef]
- Kotesh, K.M.; Bhavani, K.; Naresh, G.; Srinivas, B.; Venugopal, A. Plasmonic resonance nature of Ag-Cu/TiO2 photocatalyst under solar and artificial light: Synthesis, characterization and evaluation of H2O splitting activity. Appl. Catal. B 2016, 199, 282–291. [Google Scholar]
- Xuming, Z.; Yu, L.C.; Ru-Shi, L.; Din, P.T. Plasmonic photocatalysis. Rep. Prog. Phys. 2013, 76, 046401–046407. [Google Scholar]
- Stuart, H.R.; Hall, D.G. Island size effects in nanoparticle-enhanced photodetectors. Appl. Phys. Lett. 1998, 73, 3815–3817. [Google Scholar] [CrossRef]
- Yang, T.; Tetsu, T. Plasmon-induced photoelectrochemistry at metal nanoparticles supported on nanoporous TiO2. Chem. Commun. 2004, 16, 1810–1811. [Google Scholar]
- Syed, M.; Gerardo, H.; Daniel, M.; Joun, L.; Martin, M. Plasmonic photosensitization of a wide band gap semiconductor: Converting plasmons to charge carriers. Nano Lett. 2011, 11, 5548–5552. [Google Scholar]
- Nirmala, C.; Prashant, V.K. Improving the photoelectrochemical performance of nanostructured TiO2 Films by Adsorption of gold nanoparticles. J. Phys. Chem. B 2000, 104, 10851–10857. [Google Scholar]
- Azusa, T.; Prashant, V.K. Capture, store, and discharge. Shuttling photogenerated electrons across TiO2–silver interface. ACS Nano. 2011, 5, 7369–7376. [Google Scholar]
- Jian, L.; Fuyi, C. Plasmon enhanced photoelectrochemical activity of Ag-Cu nanoparticles on TiO2/Ti substrates. Int. J. Electrochem. Sci. 2012, 7, 9560–9572. [Google Scholar]
- Jhuang, Y.Y.; Cheng, W.T. Fabrication and characterization of silver/titanium dioxide composite nanoparticles in ethylene glycol with alkaline solution through sonochemical process. Ultrason. Sonochem. 2016, 28, 327–333. [Google Scholar] [CrossRef]
- Ning, S.; Ding, L.; Lin, Z.; Lin, Q.; Zhang, H.; Lin, H.; Long, J.; Wang, X. One-pot fabrication of Bi3O4Cl/BiOCl plate-on-plate heterojunction with enhanced visible-light photocatalytic activity. Appl. Catal. B Environ. 2016, 185, 203–212. [Google Scholar] [CrossRef]
- He, Z.; Shi, Y.; Gao, C.; Wen, L.; Chen, J.; Song, S. Fas-associated factor 1 plays a negative regulatory role in the antibacterial immunity of locusta migratoria. J. Phys. Chem. C 2013, 22, 389–398. [Google Scholar]
- Henrik, J.; Alexei, S.; Zheshen, L.; Erik, S. XPS and FTIR investigation of the surface properties of different prepared titania nano-powders. Appl. Surf. Sci. 2005, 246, 239–249. [Google Scholar]
- Lopez, T.; Cuevas, J.L.; Ilharco, L.; Ramírez, P.; Rodríguez-Reinoso, F.; Rodríguez-Castellón, E. XPS characterization and E. Coli DNA degradation using functionalized Cu/TiO2 nanobiocatalysts. Mol. Catal. 2018, 449, 62–71. [Google Scholar] [CrossRef]
- Mallikarjuna, K.; Kim, H. Synthesis of shape and size-dependent CuAg bimetallic dumbbell structures for organic pollutant hydrogenation. Phys. E Low-dimens. Syst. Nanostruct. 2018, 102, 44–49. [Google Scholar] [CrossRef]
- Méndezmedrano, M.G.; Kowalska, E.; Lehoux, A.; Herissan, A.; Ohtani, B.; Bahena, D.; Briois, V.; Colbeaujustin, C.; Rodríguezlópez, J.L.; Remita, H. Surface modification of TiO2 with Ag nanoparticles and CuO nanoclusters for application in photocatalysis. J. Phys. Chem. C 2016, 120, 5143–5154. [Google Scholar]
- He, Y.; Zhu, Y.; Wu, N. Synthesis of nanosized NaTaO3 in low temperature and its photocatalytic performance. J. Solid State Chem. 2004, 177, 3868–3872. [Google Scholar] [CrossRef]


© 2019 by the authors. Licensee MDPI, Basel, Switzerland. This article is an open access article distributed under the terms and conditions of the Creative Commons Attribution (CC BY) license (http://creativecommons.org/licenses/by/4.0/).
Share and Cite
Kato, R.; Furukawa, M.; Tateishi, I.; Katsumata, H.; Kaneco, S. Novel Photocatalytic NH3 Synthesis by NO3− Reduction over CuAg/TiO2. ChemEngineering 2019, 3, 49. https://doi.org/10.3390/chemengineering3020049
Kato R, Furukawa M, Tateishi I, Katsumata H, Kaneco S. Novel Photocatalytic NH3 Synthesis by NO3− Reduction over CuAg/TiO2. ChemEngineering. 2019; 3(2):49. https://doi.org/10.3390/chemengineering3020049
Chicago/Turabian StyleKato, Ryota, Mai Furukawa, Ikki Tateishi, Hideyuki Katsumata, and Satoshi Kaneco. 2019. "Novel Photocatalytic NH3 Synthesis by NO3− Reduction over CuAg/TiO2" ChemEngineering 3, no. 2: 49. https://doi.org/10.3390/chemengineering3020049
APA StyleKato, R., Furukawa, M., Tateishi, I., Katsumata, H., & Kaneco, S. (2019). Novel Photocatalytic NH3 Synthesis by NO3− Reduction over CuAg/TiO2. ChemEngineering, 3(2), 49. https://doi.org/10.3390/chemengineering3020049