Abstract
An agricultural residue, white yam (Dioscorea rotundata) tuber peel (YTBS), was used for the removal of Cd(II) ion from an aqueous solution using a batch method. The adsorbent was characterized using FTIR, TGA, SEM, EDX, N2 BET, XRD, and XRF. The optimization of sorption variables such as pH, contact time, adsorbent dose, and initial metal ion concentration at 25 °C were also carried out. The results indicated the dependence of sorption on the adsorbate pH and adsorbent dose, while the adsorption system reached equilibrium in 180 min. The sorption kinetics was fitted to three models (pseudo first order, pseudo second order, and Elovich) to validate the kinetics, and the pseudo first order was the best model for the description of Cd(II) uptake. Equilibrium isotherm modelling was also carried out using the Langmuir, Freundlich, and Temkin models, with the Langmuir isotherm giving the best fitting to the experimental results. The maximum loading capacity (qmax) of the adsorbent for Cd(II) obtained from the Langmuir isotherm model was 22.4 mg∙g−1 with an isotherm constant (KL) of 3.46 × 10⁻³ L·mg−1 and r2 value of 0.99. This result indicates that the YTBS residue was a good adsorbent for the removal of Cd(II) ion from aqueous system.
1. Introduction
Heavy metal pollution is one of the consequences of the industrial revolution that has had detrimental impacts on human life, as well as the environment, in a large number of regions around the world, especially in developing countries. The pollution of air, water, and land environments by toxic heavy metal ions such as mercury, cadmium, lead, and chromium, and their accumulation through the food chain has resulted in a number of diseases and disorders [1]. These pollution incidences and their implications for our environment has become a matter of huge global concern, especially in developing countries where advanced technologies, capital investment, and environmental regulatory enforcement are limited [2].
One of the prominent metal ions associated with heavy metal toxicity and pollution is cadmium. Its non-biodegradable and persistent characteristics in the environment has resulted in its classification by national and international regulatory authorities such as the World Health Organization’s International Agency for Research on Cancer (IARC) and the United States National Toxicity Program (USNTP) as a human carcinogen [3,4,5]. The maximum acceptable amount of cadmium in drinking water in the European Union regulations is 5 µg·L−1 (0.005mg∙L−1) [6,7]. Cadmium has an extremely long biological half-life and its toxic effects are known to manifest long after exposures [3]. It has been reported that the amount of cadmium absorbed in the body varies depending on the route of entry with about 3–10% of the metal ion absorbed from the gastrointestinal system and about 50% inhaled. This absorbed cadmium can be transported to different organs in the body by the blood, where its estimated half-life in humans is 15–20 years [8,9,10]. Prolonged exposure to cadmium has also been reported to cause several biological problems such as; kidney failure, anaemia, cardiovascular diseases, and growth impairment [11].
A number of industrial processes are sources of cadmium exposure to the environment as cadmium is used in electroplating, pigment, and paints manufacture. It is also used in the manufacture of Ni-Cd batteries [8,11]. Cadmium is also released into the environment from the corrosion of galvanized pipes, refineries, fertilizer, and pesticide manufacturing [12,13]. The contamination of water sources due to exposure to heavy metals such as cadmium is a major problem facing developing countries arising from the indiscriminate release of chemical waste and effluents into water bodies. For example, the “itai itai” heavy metal toxicity disaster was due to the contamination of the Jintsu River in Japan with cadmium arising from industrial effluent discharge [12,13].
Due to the environmental and health implications of heavy metal pollution, a number of techniques have been used to remove metal ions such as cadmium from aqueous systems and effluents. These include reverse osmosis, coagulation, electrochemical precipitation, ultrafiltration, ion-exchange, and nanofiltration [1,11,14]. However, these techniques suffer from a number of drawbacks especially if they are applied in developing countries due to technical and economic constraints; hence, they are mostly used in the developed countries. As a result, adsorption technology emerged as a promising technique for removing heavy metal ions from contaminated water streams due to its low cost based on the current exploitation of waste materials as adsorbents but high efficiency even at low metal ion concentrations and the ease of their application in different environments [14,15,16,17,18]. Low-cost materials have been reported as adsorbents for cadmium ion removal from aqueous systems in a number of studies such as teak leaf powder [19], cashew nut shell [20], saw dust meal [21], wheat barn [22]. These materials are mainly composed of lignocellulosic polymers and are effective as adsorbents for metal ions. This has led to an increasing use of agricultural residues as adsorbents for heavy metal pollution abatement from aqueous systems. This trend has been driven by the availability of these residues especially in the developing countries where environmental pollution challenges exist as a large number of diseases affecting the inhabitants of these countries are related to water contamination [12].
One category of agricultural produce that is cultivated in sub-Saharan Africa, Asia, and South America is yam (Dioscorea spp.), which is a tropical perennial plant with over 600 varieties of which about 50 are commercially cultivated for food globally [23,24]. It is mainly cultivated as a food crop and is an important tuber crop with over 37 million tons produced in the “yam belt” of West Africa of which 18.3 million tons is produced in Nigeria [25]. The most cultivated species of this crop in Nigeria are the Dioscorea rotundata (white yam), Dioscorea alata L. (water yam) and Dioscorea cayenesis Lam. (yellow yam) [26]. The cultivation and consumption of these tuber crops has led to the generation of large quantities of peel waste, which have no significant value, except as animal feed thereby constituting a waste disposal problem. This present practice also involves burning these residues or leaving them to decompose both of which lead to pollution of the environment [27,28]. This waste residue is rich in lignocellulosic polysaccharides that have been reported to be responsible for metal ion binding in lignocellulosic adsorbents used in wastewater treatment [2]. Thus, this work is designed to provide an environmentally friendly outlet for the utilization of these materials for pollution remediation targeting toxic heavy metal cadmium whose environmental exposure is increasing in Nigeria due to the Country’s drive for industrialization. For example, it has been reported in literature that industrial and domestic effluents have been discharged into River Delimi in Jos, Nigeria. This river is used for extensive irrigation in the area and these practices have been suspected as the reason for the reported increase in the concentrations of cadmium and copper ions. The values reported are above the limit recommended for irrigation water by the Food and Agricultural Organization (FAO) [29] thereby posing a significant health risk to the inhabitants of the area. Thus, the present work relates to the characteristics and sorption properties of white yam (Dioscorea rotundata) peel residue for Cd(II) ion removal from aqueous systems, which could serve as a candidate material for polluted water purification. It is aimed at studying the physicochemical properties of the residue using a number of characterization techniques to gain insight into the nature of the residue before and after application as an adsorbent for Cd(II) removal. Different experimental conditions will be used to assess the performance of the yam tuber peel residue (YTBS) adsorbent for Cd(II) ion removal.
2. Materials and Methods
2.1. Chemicals
A Standard stock solution of 1000 mg∙L−1 of Cd(II) ion was prepared from an analytical grade reagent [cadmium nitrate tetrahydrate-Cd (NO3)2·4H2O (Sigma-Aldrich, St. Louis, MO, USA) (99% assay)] in deionized water using a 1000 mL volumetric flask (±0.8 mL MBL Boro England). The stock solution was acidified to prevent hydrolysis by adding 5 mL HNO3 and the volume was made up to the 1000 mL mark. The content of the volumetric flask was agitated in a Heidolph Unimax instrument 1010 shaker at 300 rpm for 3 h to ensure complete dissolution at room temperature (25 °C).
2.2. Adsorbent Preparation
White yam tuber peels were obtained from two different sampling locations in Uyo, Akwa Ibom in Nigeria. The white yam residue was washed with hot deionized water to remove dirt and color and oven dried at 100 °C for 24 h. The dried residue was thereafter pulverized using a Coors porcelain mortar and pestle. Particle size separation of the residues was carried out by sequential sieving wherein 500 g each of the pulverized residue was sieved through a 7 tray laboratory test sieve shaker, model E.V.L.1. (Endecott’s Limited London, UK). After the sieving, the residues in the 140 µm sieve tray were taken off, stored in clean polypropylene bottles, labelled unmodified residues, and stored at room temperature for further use in the adsorption studies. This sample was labelled as the unmodified white yam peel residue (YTBS) and used for the removal of Cd(II) ion.
2.3. Instruments and Adsorbent Characterisation
The morphology of the YTBS adsorbent before and after Cd(II) ion adsorption as well as the chemical composition were analyzed by scanning electron microscopy (SEM) and energy dispersive X-ray analysis (EDX). The equipment used for the SEM and EDX analysis was a FEI Quanta 200 Environmental Scanning Electron Microscope and the procedure was based on the approach reported in Asuquo and Martin [30]. The inorganic chemical composition of the YTBS residue adsorbent was determined using a wavelength dispersive X-ray fluorescence spectroscopy (WDXRF) instrument, AXIOS model (Panalytical, The Netherlands). The surface area and porosity of the YTBS adsorbent was determined using a MicromeriticsTristar 3000 Surface Area and Porosity Analyzer, and the procedure was based on the approach reported in Asuquo and Martin [30]. The diffraction patterns of the YTBS residue adsorbent before and after Cd(II) sorption were determined using X-ray diffractometry. The equipment used was a Rigaku Miniflex X-ray powder diffractometer using a CuKα radiation (λ = 1.546 Å) at a power of 30 kV and a current of 15 mA. X-ray diffraction spectra were obtained using 5 mg of sample within the range of 2 to 60° at a scan speed of 1.5° min−1 with a step size of 0.03°.
A thermogravimetric analyzer (TGA Q5000-TA instrument, New Castle, DE, USA) determined the gravimetric change with temperature of the YTBS residue adsorbent and the procedure was based on the approach reported in Asuquo and Martin [30]. The density of the YTBS adsorbent was determined using helium pycnometry since helium is a very small particle with an atomic diameter of 1.7 Å. The instrument used for the analysis of the residues was the Accu Pyc 11 1340 Helium pycnometer (Micromeritics) and the procedure was based on the approach reported in Asuquo and Martin [30].The point of zero charge (pHpzc) of the YTBS adsorbent was determined using the Malvern Zetasizer. The equipment used was a Zetasizer 3000 HSA (Malvern Instruments, Malvern, UK) and the procedure was based on the approach reported in Asuquo et al. [31]. The samples were prepared using 0.1 g of sample into 20 mL of 0.01 M NaCl solution at pH range of 2–12 and agitating it in a shaker at 300 rpm for 24 h. An attenuated total reflectance fourier transform infrared spectroscopy (ATR-FT-IR) in transmittance mode with spectral resolution of 4 cm−1, background subtraction and spectral range of from 4000–400 cm−1 based on average of 32 co-added scans was used to characterize the functional groups on the YTBS adsorbent before and after Cd(II) ion sorption. The instrument used was a Smart Golden Gate Thermo Nicolet Avatar 360 FT-IR with ATR probe [30].
2.4. Batch Sorption Experiments
The working solutions for individual sorption experiments were prepared by serial dilution of aliquots of each stock solution. For the study of the effect of adsorbate pH on the removal of Cd(II) ion using the YTBS adsorbent, a pH range of 2 to 10 was used, while the other parameters used were: initial metal ion concentration of 500 mg∙L−1, temperature of 25 °C and a reaction volume of 0.1 L. The effect of the dose of the YTBS adsorbent on the sorption of Cd(II) ion was evaluated using: 0.5, 1.0, 1.5, 2.0, 2.5, and 3.0 g of YTBS adsorbent. Batch sorption experiments for the equilibrium adsorption experiments was carried out by agitating known weight of the YTBS adsorbent with 100 mL of adsorbate solutions of different initial concentrations (50, 100, 150, 200, 250, 300, 350, 400, 450, and 500 mg∙L−1) and from 5 min to 72 h. The pH 6.5 was used for the equilibrium, kinetics and adsorption studies investigating the effect of adsorbent dose and the pH for each experiment was modified using NaOH and HCl. The amount of adsorbent used was 2.0 g for the equilibrium, kinetics and pH studies. The effect of contact time on the sorption processes was studied from 5 min to 72 h and the time interval for the sorption studies investigating the effect of adsorbent dose and the pH was from 5 to 180 minutes. The reaction vessel for each adsorption experiment was a 250 mL conical flask and the sorption was carried out at a laboratory temperature of 25 °C. Each conical flask with the adsorbate and adsorbent was agitated for a specified contact time using a Heidolph MR 3001 magnetic stirrer with speed and temperature controls at a speed of 200 rpm. At the end of each experiment, the resulting solution was separated from the adsorbent using Whatman (541) filter paper (Whatman International, Maidstone, England) and the filtrate analysed by taking out 5 mL of each filtrate using a Volac high precision micropipette (Poulten & Graf GmbH, Wertheim, Germany) and diluting it to 50 mL with deionized H2O. Thereafter, 10 mL of the resulting metal ion solution was taken out using a micropipette into a sample analysis tube for metal ion determination. The metal ion concentrations of the adsorbate solution were determined spectrophotometrically using ICP-OES.
For the determination of metal ion loading after sorption, the amount of metal ion adsorbed at time t was calculated using Equation (1).
where Ct (mg∙L−1) is the metal ion concentration at time t, qt (mg∙g−1) is the loading of the metal ion at time t, Ci is the initial metal ion concentration, w is the weight of the adsorbent, and V is the volume of the aqueous system.
2.5. Data Quality Evaluation
All adsorption experiments were carried out in triplicates to ensure reproducibility and accuracy of results. The relative standard deviation was used as the error parameter for all analysis and the value for each set of measurements was <5%. Each experimental set was carried out using blanks in order to ensure the elimination of errors associated with experimental conditions. For each experimental analysis procedure, blanks were prepared, using deionized H2O, and were subjected to the same treatment process using the same type of experimental vessel [30,31].
3. Equilibrium Isotherm Models
The experimental sorption data were modelled using isotherms characterize the equilibrium process. The adsorption equilibrium shows the relationship between the amount of the adsorbate sorbed per unit mass of adsorbent (qe) and the adsorbate concentration for the solution at equilibrium Ce [32]. Three sets of equilibrium isotherm models were used to characterize the removal of Cd(II) and ion from aqueous solution using the YTBS adsorbent. These were three 2-parameter isotherms- Langmuir, Freundlich and Temkin isotherms.
The Langmuir isotherm model has been successfully applied to pollutant biosorption processes and is one of the most widely used isotherms [17,33]. The model can be written in its non-linear format as Equation (2):
where qe is the equilibrium metal ion concentration on the adsorbent (mg·g−1),
Ce is the equilibrium metal ion concentration in the solution (mg·L−1),
qm is the monolayer adsorption capacity of the adsorbent (mg·g−1) also known as qmax
KL is the Langmuir adsorption constant (L·mg−1) related with the free energy of adsorption [34].
The Freundlich isotherm assumes a heterogeneous adsorption surface and active sites with different energy based on multilayer adsorption. The model estimates the adsorption intensity of the adsorbate on an adsorbent [35,36]. The model in its non-linear form is given as Equation (3):
where KF is a constant relating to the adsorption capacity (mg∙g−1),
Ce is the concentration of metal ions at equilibrium (mg·L−1) (L·mg−1)1/n and 1/n is an empirical parameter relating to the adsorption intensity which varies with the heterogeneity of the material [34].
The Temkin isotherm model contains a factor that explicitly takes into account the adsorbent–adsorbate interactions. It is based on the assumption that the heat of adsorption of all the molecules in the layer would decrease linearly with coverage due to adsorbent–adsorbate interactions [37,38]. The adsorption is characterized by a uniform distribution of binding energies, up to some maximum binding energy. The Temkin adsorption isotherm in its non-linear form in Equation (4) as reported by Temkin and Pyzhev [37,39].
where B = (RT/bT) is Temkin constant related to heat of adsorption (kJ·mol−1), AT (L·mg−1) is the equilibrium binding constant related to maximum binding energy, Ce (mg·L−1) is the equilibrium concentration of cadmium ions, R (8.314 J·mol·K−1) is the universal gas constant, and T (K) is the absolute solution temperature (298 K).
3.1. Kinetic Models
Adsorption kinetics can be modelled using a number of equations and information obtained can be used to explain the mechanism of metal ion sorption. The mechanism of a sorption system may be influenced by the physicochemical characteristics of the adsorbent in addition to the mass transfer process [40]. This (discrimination) can be carried out based on shapes and fitting of kinetic plots. These kinetic plots were designed with assumptions that can be extrapolated to the system under investigation. Insights from the kinetic modelling is used to differentiate the type of transport mechanism and the description of the sorption process [41,42,43]. In this study, three kinetic models (pseudo-first order (PFO), pseudo-second order (PSO), and Elovich) were applied to investigate the kinetics of Cd(II) ion adsorption onto the YTBS adsorbent.
3.1.1. Pseudo First Order Model
In 1898, Lagergren presented the first order rate equation for the adsorption of ocalic acid and malonic acid onto charcoal to explain the kinetics of adsorption on solid surfaces. In order to distinguish the kinetic processes based on concentration of solution and adsorption capacity of solid, this Lagergren equation called the pseudo-first order equation [44,45], was the first rate equation developed for sorption in liquid/solid systems and it is based on solid capacity [46]. It is one of the most widely used rate equations reported in adsorption kinetic literature. Assuming that in a solid/liquid adsorption system, the adsorption rate was proportional to the number of effective adsorption sites, then the rate of adsorption would be expressed as Equation (5):
Equation (5) is the linear form of the equation and the most common form of the pseudo-first order (PFO) equation reported in literature for the description of sorption. Xuan et al. [47] used the linear pseudo-first order equation to describe the kinetics of Pb(II) biosorption onto pre-treated chemically modified orange peel. Ho et al. [46] has also reported on the sorption of Pb(II) from aqueous solutions using tree fern adsorbent in which the linear form of the PFO equation was used. However, a number of studies have reported that the linear form of the PFO equation may lead to error propagation in the results by linearizing the PFO equation, which is non-linear, thereby implicitly altering the error structure in the determination of the model parameters [30,31,48,49]. The non-linear form of the PFO is given as Equation (6):
The non-linear form of the PFO will be used to model the kinetics of sorption of Cd(II) onto the YTBS adsorbent used in this study and Equation (6), represents the reversible interaction between the adsorbate and adsorbent and is used for the prediction of the physisorption of the adsorbates onto the adsorbents in the system under consideration [30,31].
3.1.2. Pseudo-Second Order Model
The reaction kinetics of adsorption is the basis of the adsorption reaction models used in kinetic modelling and one of the most commonly used reaction models for the description of the kinetics of adsorption is the pseudo-second order model proposed by Ho [50]. This model was proposed in an attempt to present the equation that represents the adsorption of divalent metals onto sphagnum moss peat during agitation. An assumption was made that the process may be second-order and that sorption depends on the adsorption capacity of the adsorbent that is associated with the number of available active sites. This pseudo-second order kinetics is presumed to proceed via chemisorption, which involves valence forces through the sharing or exchange of electrons between the peat and the divalent metal ion as covalent forces [30,31,50]. The equation has the linear form:
where h (mg·g−1·min−1) can be regarded as initial sorption rate as qt/t→0, hence:
Equation (8) can be written as:
Equation (9) is the linear form of the pseudo-second order (PSO) equation that is commonly reported in literature. This linear form causes distortion in the error structure when used to plot the PSO model and leads to differences in model data between the non-linear and linear techniques in modelling the (PSO) equation [48,51]. Hence, the better option is the use of the non-linear method, as the PSO equation is a non-linear equation. Furthermore, the numerical optimization used to determine parameters will provide a more accurate representation of the model, and the parameters within it, than a linearization plot which often leads to propagation of errors in a model, [51]. This non-linear approach will be applied for the modelling of the sorption kinetics of Cd(II) ion sorption onto the YTBS adsorbent and the non-linear PSO equation that will be used for the kinetic modelling is given by Lin and Wang, [49] as Equation (10):
Thus, Equation (10) will be used to model the non-linear PSO kinetics for the sorption reported in this work and assumes a stronger interaction between the adsorbate and adsorbent based on the chemisorption of the adsorbates onto the adsorbents in the system under consideration. One advantage of using the PSO equation for the modelling of adsorption kinetics is that there is no need to know the equilibrium capacity from the experiments, as this value, the PSO rate constant and the initial adsorption rate can be calculated from the model [30,31,50].
3.1.3. Elovich Kinetic Model
The Elovich equation was previously used for the description of reactions involving chemisorption of gases on a solid surface [52]. It has also been proven to be valid for the description of the kinetics of systems in which the adsorbing surface is heterogeneous and therefore have different activation energies for chemisorption [43,53]. Recently, it has been used by in number of studies to examining the kinetics of sorption in the liquid phase [54,55]. The Elovich kinetic equation is generally expressed as [52,56] as Equation (11):
where is the initial adsorption rate (mg·g−1∙min−1) and related to extent of surface coverage and activation energy for chemisorption (g·mg−1) [57].
To simplify the Elovich equation Chien and Clayton [52] assumed that when t >> t and by applying the boundary conditions qt = 0 at t = 0 and qt = qt at t = t, the equation becomes Equation (20) [56,58].
This non-linear kinetic modelling approach will also be applied for the modelling of the kinetics of Cd(II) ion sorption using the Elovich equation in Equation (12) [59,60]. From the Elovich equation plot, the kinetic parameters will be obtained for Cd(II) ion sorption onto the YTBS adsorbent using the solver add-in program in Microsoft Excel 2010 software.
3.2. Error Functions
The experimental equilibrium and kinetic data for the sorption of Cd(II) ions onto the YTBS adsorbent were modelled using the equilibrium and kinetic models described in this study. To determine the model which best describes the sorption, a number of fitting parameters were used to correlate the experimental data based on the magnitude of the determination coefficient [30,31]. Hence, the model with an r2 value closest to unity is deemed the best fit [61]. The fitting of these models with experimental data have been reported in a number of studies using a linearization of the different equilibrium and kinetic models for the sorption of various adsorbates onto different adsorbents [40,62,63]. However, this approach has been observed to be limited as it has an inherent bias resulting from the linearization, as such, data transformations implicitly alters the error structure and may result in a violation of the error equality of variance and normality hypotheses for standard least squares [61,64,65,66]. The use of non-linear optimization has been reported as a better approach for the determination of model fitting to experimental data, and of isotherm parameter values as it most commonly uses algorithms for the determination of the parameters [61,64,67,68,69]. The utilization of the non-linear approach requires the definition of error function to enable the optimization process determine and evaluate the fitting of the models to the experimental data [61]. For the characterization of the equilibrium and kinetic models for the sorption of Cd(II) using the YTBS adsorbent, three different error parameters and the coefficient of determination (r2) were determined using the solver add-in in Microsoft excel 2010 software [30,31].
The error parameters used were:
1-The sum of the squares of the errors (ERRSQ)
2-The Chi-square test (χ2)
3-The root mean square error (RMSE)
4-The determination coefficient (r2)
where: qe,model is the equilibrium capacity obtained from the isotherm model;
qe,exp. is the equilibrium capacity obtained from experiment
qe,av. is the average qe,exp..
qe and qm are the measured and model amount of cadmium(II) ion adsorbed at time t respectively
m is the number of data points evaluated
p is the number of parameters in the regression model
Thus the model that best predicts the experimental data is that which returns the smallest values for the error parameters (ERRSQ,RMSE and χ2) and the highest r2 value [17,30,31].
4. Results and Discussion
4.1. Adsorbent Characterisation
The characteristics of the YTBS adsorbent are presented in Table 1 and indicate that the material is mainly composed of organic constituents and some inorganic constituents as well. The carbon content of the adsorbent is about 41%, based on the ultimate analysis, of which 21% was fixed carbon according to proximate analysis. The proximate analysis of the adsorbent also indicates that 66% of the adsorbent was composed of volatile matter thereby indicating that the YTBS adsorbent was mainly organic in nature with some inorganic constituents as shown by the ash content composition in Table 1. The helium density of the YTBS residue presented in Table 1 was obtained based on the helium pycnometry method. Consequently, the YTBS adsorbent is observed to have a low density (0.32), which implies that the material has poor mechanical strength. It has been reported that the density of residues also has implications on the mechanical strength of adsorbents prepared from them especially those used for the synthesis of activated carbon type adsorbents [70,71].

Table 1.
Physical and chemical characteristics of white yam tuber peel (YTBS) adsorbent.
The pH point of zero charge (pHpzc) is defined as the pH of the suspension at which the surface acidic (or basic) functional groups of an adsorbent no longer contributes to the pH of the solution. It indicates the two regions on which an adsorbent can be used for the adsorption of positive or negative species [73]. The plot of the pH versus zeta potential was used to obtain the pHpzc for the YTBS adsorbent presented in Table 1. The pHpzc of the YTBS adsorbent was 5.9, while the pH of the YTBS adsorbate system was 6.4. These two parameters indicate that the surface of the YTBS adsorbent is mildly acidic. Thus, to facilitate the sorption of Cd(II) ions by the YTBS adsorbent, a pH higher than the pHpzc, which provides the adsorbent surface with more negative ions to interact with the target Cd(II) ion, thereby making adsorption onto the adsorbent surface more feasible, has to be chosen [73]. Hence, the pH 6.5 was chosen as the pH for Cd(II) sorption studies onto the surface of the YTBS adsorbent. Similar results for the pHpzc of lignocellulosic adsorbents have been reported in literature. A pHpzc of 6.6 was reported for African white star apple (Chrysophyllum albidium) shell by Onwu and Ogah [74] in their studies on the effect of pH on the sorption of Cd(II), nickel(II) and chromium(VI) from aqueous solution. Prola et al. [75] has also reported a pHpzc of 5.85 for Jatropha curcas shell used as a biosorbent for the removal of Reactive Red 120 textile dye from aqueous solution.
4.1.1. BET Surface Area and Porosity
The BET surface area, total, micropore and mesopore volume as well as the pore diameter of the YTBS adsorbent, obtained using nitrogen adsorption-desorption shown in Figure 1, are presented in Table 2. The result indicates that the surface area of the YTBS adsorbent was low (0.5 m2∙g−1) with a total pore volume of 2.70 × 10⁻³ cm3∙g−1, implying that the adsorbent had a low surface area. This observation is similar to previous reports on the BET surface area of lignocellulosic adsorbents that are of agricultural origin. The BET surface area of 1.2 m2∙g−1 and total pore volume of 0.02 cm3∙g−1 of a date stone adsorbent has been reported by Khelaifia et al. [76] in their study of the valorization biomaterial for Cr(VI) adsorption. In another study reported by Setiabudi et al. [77], BET surface area and total pore volume of 2.59 m2∙g−1 and 2.0 × 10⁻³ cm3∙g−1 were obtained for an agricultural residue-Elaeis guineesis leaves used for the adsorption of methylene blue.
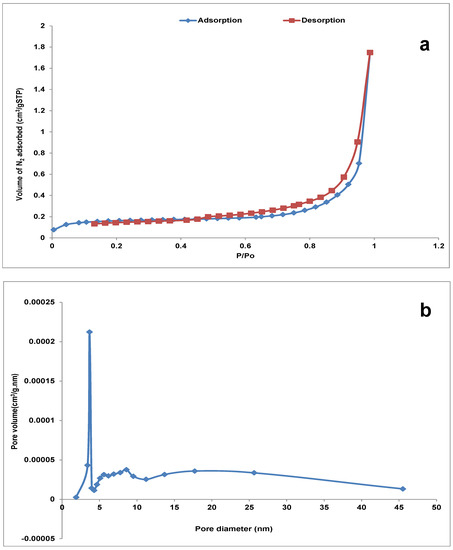
Figure 1.
N2 adsorption-desorption isotherm (a) and BJH pore size (b) plot of YTBS adsorbent.
Table 2.
Pore characteristics of YTBS adsorbent.
The classification of nitrogen adsorption-desorption isotherm according to the Brunauer, Deming, Deming, and Teller (BDDT) method [78,79] has been used to characterize the nitrogen isotherm plot of the YTBS adsorbent. From Figure 1a, it can be observed that at low relative pressures (0.1–0.5), the adsorption and desorption branches of the isotherm are nearly horizontal to each other. However, at intermediate to high relative pressures (0.6–0.9), the amount absorbed increases leading to a characteristic type IV isotherm with a hysteresis loop, which is associated with the presence of larger pores in the mesoporous range [80].The presence of this hysteresis has been associated with a number of processes and properties of mesoporous materials. Wickramaratne et al. [81] associates the hysteresis loop in mesoporous materials to the effects of voids created within the adsorbent particles which influence the nature of the nitrogen adsorption and desorption processes. Banerjee et al. [82] and Li et al. [83], on the other hand, attribute this hysteresis loop to the effect of capillary condensation in non-uniform or disordered pore arrangements.
The presence of the larger pores in the mesoporous range of the adsorbent is shown in the pore size distribution (PSD) plot in Figure 1b and Table 2, which indicates that the YTBS adsorbent was mainly composed of mesopores (93% mesopores and 7% micropores). Figure 1b also shows that the YTBS adsorbent had a narrow pore size distribution, with a distinct peak at 3.5 nm, and a wider pore size distribution of mesopores between 4–9 nm. This trend in pore size distribution has also been observed in some activated carbon adsorbents obtained from a lignocellulosic precursor (horse chestnut shell) [84]. Furthermore, from the desorption branch of the N2 adsorption-desorption isotherm plot (Figure 1b), the average pore size of the YTBS adsorbent was 21.1 nm implying that the adsorbent is mesoporous according to the IUPAC classification of porous materials [78,79].
4.1.2. Adsorbent Morphology
The yam peel residue photograph and that of the pulverized and dried YTBS adsorbent are shown in Figure 2. The surface characteristic of the YTBS adsorbent was examined using scanning electron microscopy (SEM). The SEM micrograph of the YTBS adsorbent is shown in Figure 3a and indicates the non-porous structure of the material. This also shows the irregular crevices and rough surface on the adsorbent which may serve as transport and attachment sites for metal ions [80,85,86].The results of the SEM of the YTBS adsorbent after Cd(II) ion sorption (Figure 3b) indicates that the morphology of the adsorbent was not altered after sorption implying that the adsorbent was stable and there was no aggregation of adsorbent particles during sorption.
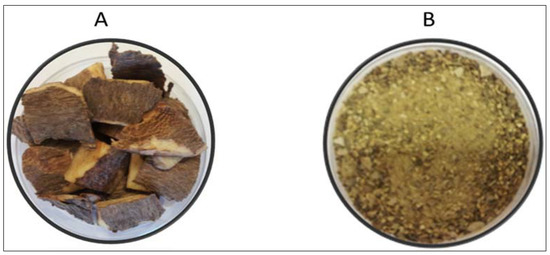
Figure 2.
Photograph of raw residue (A) and pulverized residue adsorbent-YTBS (B).
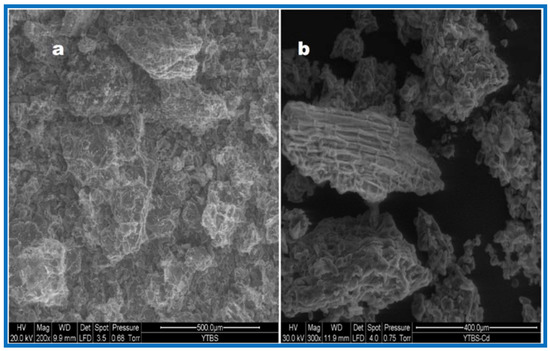
Figure 3.
Electron micrograph of YTBS before (a) after (b) Cd(II) ion adsorption.
4.1.3. Adsorbent Chemical Composition
The carbons, hydrogen, nitrogen, sulphur, and oxygen contents of the YTBS adsorbent were determined using the CHNS elemental analyzer and the results are presented in Table 1. This result indicates that the residue adsorbent had high carbon and oxygen contents as is the nature of lignocellulosic residues, thereby confirming the results obtained from the proximate and ultimate analyses of the adsorbent. The inorganic composition of the YTBS adsorbent was determined using X-ray fluorescence spectrometry (XRF) and the results are shown in Table 3.
Table 3.
X-ray fluorescence spectrometry (XRF) of YTBS residue adsorbent.
From Table 3, it can be observed that the adsorbent had high amounts of silica (SiO2) and potassium (K2O) which may account for its high ash content (Table 1), while the other elements such as sodium (Na2O), iron (Fe2O3), calcium (CaO), magnesium (MgO), alumina (Al2O3) chloride (Cl), and sulphur (SO3) where in trace quantities. The inorganic constituents of the YTBS adsorbent contributed to its ash composition and may also play an important role in metal ion sorption via ion-exchange mechanism [87]. Furthermore, the chemical composition of the YTBS adsorbent was also evaluated using energy dispersive X-ray analysis (EDX) which was coupled to the scanning electron microscope (SEM) used for examination of the morphology of the adsorbent. This technique was used to measure the chemical species on the adsorbent surface before and after Cd(II) ion sorption. The EDX analysis of the fresh YTBS (Figure 4) gives a description of the elemental composition of the residue which complements the results obtained using the proximate, elemental, XRF analysis of the adsorbent.
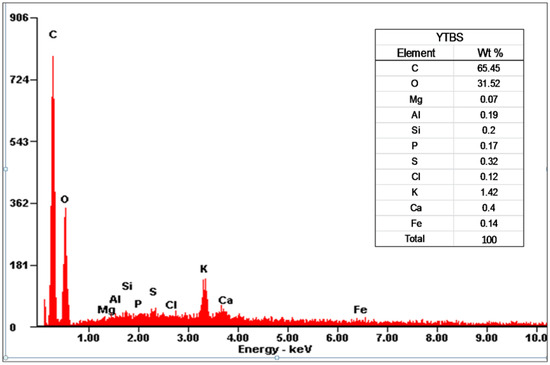
Figure 4.
Energy dispersive X-ray analysis (EDX) spectrum of YTBS residue adsorbent.
The results obtained from Figure 4 indicates that carbon (65%) and oxygen (31%) were the major constituents of fresh YTBS, while potassium (K), calcium (Ca), and sulphur (S) were the most abundant inorganic constituents at 1.4%, 0.4%, and 0.3%, respectively. Other elements with trace composition were; iron (Fe), chloride (Cl), sulphur (S), aluminum (Al), manganese (Mg), and silicon (Si). The EDX spectrum (Figure 5) of the YTBS adsorbent after Cd(II) ion sorption (YTBS-Cd) was also obtained to determine the effect of sorption on the elemental content of the adsorbent.
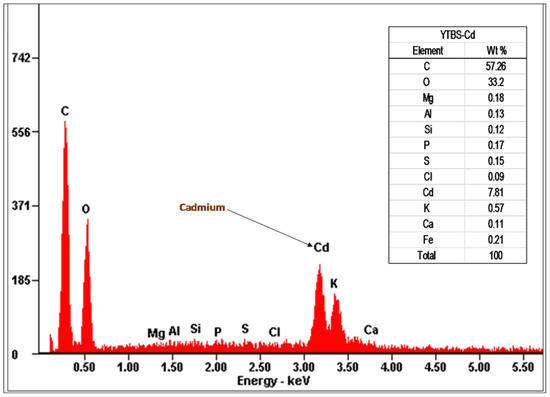
Figure 5.
EDX spectrum of YTBS residue adsorbent after Cd(II) sorption.
From Figure 5, it was observed that there was a decrease in the inorganic constituents and the presence of elemental cadmium on the YTBS-Cd adsorbent thereby confirming the sorption of Cd(II) onto the adsorbent surface [88]. The EDX spectra (Figure 4 and Figure 5) also shows that there was decrease in the potassium and calcium contents of the YTBS adsorbent, before and after sorption. This may be associated to the nature of uptake of the Cd(II) ions from the aqueous solutions onto the adsorbent matrix as reported by Iqbal et al. [89]. The utilization of EDX characterization of adsorbents before and after metal ion sorption has also been reported in literature to infer evidence of adsorbent sorption and indirectly deduce mechanism of adsorption (ion-exchange). Kamari et al. [90] has reported on the use of EDX spectra of coconut dregs residue, before and after adsorption of Pb(II) ion, to confirm the sorption onto the adsorbent and also infer the mechanism of ion-exchange.
4.1.4. Thermogravimetric Analysis
Thermal degradation of lignocellulosic biomass involves a complex reaction system which includes a number of different reactions occurring simultaneously such as; dehydration, depolymerisation, fragmentation, rearrangement, condensation and combustion [91,92]. Thus for the YTBS residue under consideration an understanding of its thermal degradation profile is necessary to identify its major components. Thermogravimetry (TG) and derivative thermogravimetry (DTG) were used to evaluate the weight loss and thermal characteristics of the YTBS residue adsorbent with the plots are shown in Figure 6 while the results are presented in Table 1.
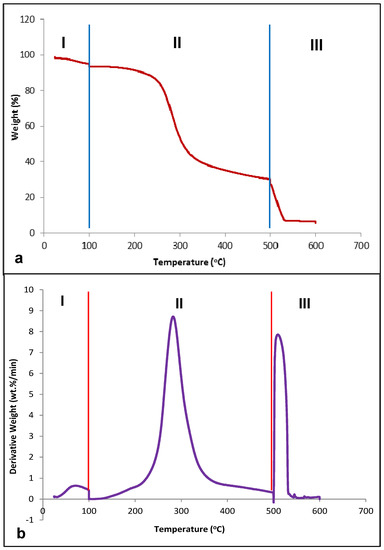
Figure 6.
Thermogravimetric (a) and derivative thermogravimetric (b) analysis of YTBS in N2(I-II) and air (III) environments.
Thermogravimetric pyrolysis (under nitrogen) and combustion (in air) was set to operate concurrently from 20–500 °C and 500–600 °C, respectively. The TG curve (Figure 6a) shows three regions (I, II & III) which describe the major stages in the decomposition of the residue adsorbent. The DTG curve (Figure 6b) shows three exothermic peaks at a maximum of 71 °C, 281 °C, and 509 °C. The first region (I) occurred during the temperature ramp from 20–100 °C, and the subsequent hold at 100 °C, and corresponds to the elimination of non-dissociative, physically absorbed, hydrogen bonded water molecules on the residue surface [93,94]. Complete moisture removal in this region, which accounted for 5% weight loss was ensured by holding the temperature at 100 °C for 60 min.
The second stage (II) with a weight loss of 66% indicates the elimination of the volatile components in the lignocellulosic adsorbent and this can be associated to the removal of the three major constituents; cellulose, hemicellulose and lignin [94]. These three components also have varying ranges of decomposition temperatures (hemicellulose, 150–350 °C; cellulose, 275–380 °C; and lignin, 300–500 °C) and this can be related to their degree of thermal stability [95]. This stage is characteristic of the thermal decomposition of lignocellulosic biomass with a high rate of mass loss and has maxima in the DTG curve (Figure 6b) between 270–310 °C which indicates the simultaneous thermal depolymerization of residual hemicellulose and cellulose components [12,93,96]
Lignin is the most stable component of the lignocellulosic biomass due to its aromatic content. Thus, its thermal decomposition proceeds slowly and gradually to the end of the pyrolysis section of the TG curve at 500 °C making it an important contributor to the fixed carbon content of the residue [97]. At the end of this regime (II), the fixed carbon content of the YTBS adsorbent was 21%, which shows its carbon content that is intrinsic in the chars. The third region (III) in the TG curve (Figure 6a) shows the carbonization of the resulting chars from the pyrolysis regime (20–500 °C) to obtain the residual ash composition of the YTBS adsorbent. This region is characterized by a maxima in the DTG curve (Figure 6b) between 503–530 °C which corresponds to the decomposition of the chars in air. The resulting residue from the char carbonization gives the ash content of the YTBS adsorbent (5%) which was comparable to the ash content obtained via the AOAC [72] method (8%) as shown in Table 1. The thermal degradation profile of the YTBS adsorbent is similar to the profile of orange and almond peels reported by Boumediene et al. [98] in their study on the characterization of two cellulosic waste materials for use in removal of methylene blue from aqueous solutions. A three-stage thermogravimetric analysis (TGA) and differential thermal analysis (DTA) profile for ryegrass leaves (Lolium the perenne) showing the different stages of weight loss associated with the different components of a lignocellulosic polysaccharide has also been reported by Liu et al. [96].
4.1.5. X-ray Diffraction
The XRD technique is used for the analysis of unknown materials based on a phase evaluation to determine their nature (i.e., crystalline or amorphous) [40]. The XRD pattern obtained for the unloaded adsorbent (YTBS) and the Cd(II) ion loaded adsorbent (YTBS-Cd) are shown in Figure 7. The pattern of the fresh adsorbent (YTBS) shows the presence of few well-defined diffraction peaks and a broad peak which indicates that the YTBS adsorbent is mainly amorphous. The well-defined diffraction peaks in the XRD pattern is due to highly ordered areas in the structure and indicates the presence of crystalline cellulose I phases and silica (SiO2). The broad peak which is due to less ordering in the lignocellulosic structure confirms the presence of amorphous lignocellulosic material such as amorphous cellulose, hemicellulose and lignin [99]. For the YTBS adsorbent, the main diffraction signals at 2θ values of 15.5°, 17.2°, 21.0°, and 36.7° can be indexed to the (101), (10ḹ), (002) and (040) diffraction planes of cellulose I respectively [99,100]. The diffractogram peak at 2θ = 26.7°, which indicates the presence of silica (SiO2) on the adsorbent matrix, confirms the results of the chemical analysis of the residues reported previously using XRF. For the YTBS–Cd adsorbent the diffraction signals observed were at 2θ = 16.9° and 26.8° which were assigned to the (10ḹ) diffraction plane of cellulose I and silica respectively. The peaks for cellulose I(10ḹ) and silica (SiO2) were observed to decrease after Cd(II) sorption in the YTBS-Cd diffractogram, which reveals that there was a change in the crystallinity of the YTBS adsorbent after sorption [32].
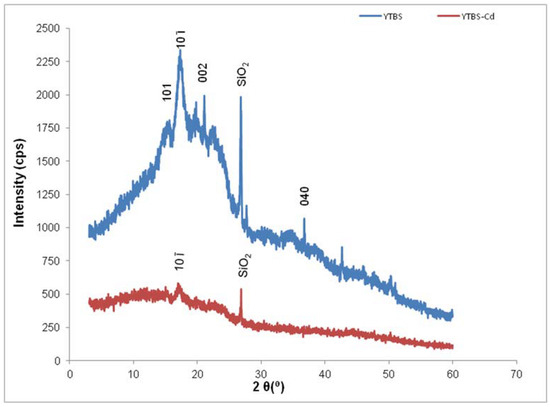
Figure 7.
XRD of YTBS residue adsorbent before and after Cd(II) sorption.
The cellulose crystallinity index (CrI) of the YTBS adsorbent was calculated using the peak height method based on Equation (17) [101,102,103] as follows:
where, I002 is the intensity of the crystalline region in the residue at 2θ about 21.0°.
Iam is the intensity of the amorphous region (cellulose, hemicellulose and lignin) at a baseline at 2θ about 16.0°.
From Equation (25), the cellulose crystallinity index (CrI) of the YTBS adsorbent was found to be 19.2% implying low crystalline cellulose content. However, it was not possible to determine CrI of the adsorbent after sorption (YTBS-Cd) as the peak for the (002) phase was not well defined due to the amorphous nature of the adsorbent. The crystallinity index of the YTBS residue adsorbent is lower than that reported for Teff straw adsorbent (52.0%) by Wassie and Srivastava [104] in their study on chromium removal from wastewater using Teff straw. The diffractogram obtained after sorption (YTBS-Cd) also indicates the absence of some other crystalline cellulose I phases previously observed in the YTBS adsorbent. This implies that the sorption process may affect the structure of the adsorbent thereby making it more amorphous. The exhibition of irregular patterns in diffractograms is a manifestation of materials that are mainly amorphous in nature and this observation can be made regarding the YTBS adsorbent. Similar results to that of the YTBS adsorbent have been reported for the different peaks of cellulose I and for cellulose crystallinity index from the XRD characterization of Lespedeza crytobotrya stalks [100].
4.1.6. Fourier Transform Infrared (FTIR) Spectroscopy
Infrared spectroscopy was used to obtain information on the nature and possible interactions between the functional groups on the YTBS and the Cd(II) ion. The FT-IR spectra of the unloaded YTBS adsorbent and the Cd(II) loaded YTBS adsorbent are shown in Figure 8. These spectra show a broad peak at 3280 cm−1 which is assigned to the (O–H) stretching vibration in hydroxyl groups (commonly appearing between 3550 cm−1 and 3200 cm−1) [62]. The groups with this functionality found in the lignocellulosic structure of the YTBS are as follows: absorbed water, aliphatic primary and secondary alcohols found in cellulose, hemicellulose, lignin, extractives, phenols with intermolecular hydrogen bonds, and carboxylic acid groups in the extractives [105,106]. This peak is broad due to the complex vibrational modes arising from a mixture of stretching vibrational bands of –OH groups in hydrogen bonded and chemisorbed water as well as the inter and intramolecular hydrogen bonding vibrations [94,107]. The peak at 2937 cm−1 can be attributed to the symmetric or asymmetric stretching vibrations of the CH2 and CH3 groups of side chains and aromatic methoxy groups in the different lignocellulosic structures in the YTBS adsorbent [105,108].
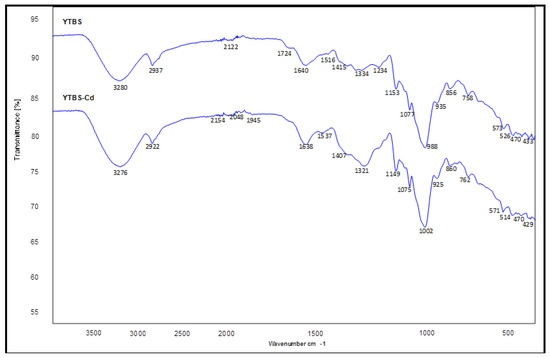
Figure 8.
Fourier Transform Infrared (FTIR) spectra of YTBS before (YTBS) and after Cd(II) adsorption (YTBS-Cd).
The bands at 1724 cm−1and 1640 cm−1 are due to carbonyl-group (C=O) stretching, which are characteristics of aldehydes, ketones, esters, amides, and carboxylic acid in the lignin and extractives components of the adsorbent [109]. These groups could exist as non-conjugated (1724 cm−1) in lignin/carboxylic acid ester groups [110] or conjugated (1640 cm−1) moieties such as amides linked to other aromatic rings within the lignocellulosic structure of the YTBS adsorbent [105,108,111,112,113]. The peak at 1640 cm−1 can also be associated with the bending vibrations in amide (N-H) groups in the lignocellulosic structure of the adsorbent [114]. The peak at 1516 cm−1 corresponds to the skeletal mode stretching of the aromatic ring for the symmetrical C=C vibration of the phenylpropane skeleton in the lignin component of the YTBS structure [63,105,114]. C-H stretching deformation and aromatic ring vibrations in lignin structures are features of the peak observed at 1415cm−1 on the spectrum of the lignocellulosic YTBS adsorbent [63,106,110]. The peak at 1415 cm−1can also be associated to the symmetric stretching vibrations of the carboxylate ion (COO−) in the pectin component of the lignocellulosic adsorbent [41,115].
The observed peak at 1334 cm−1 indicates the presence of C-H vibration associated with cellulose and the axial deformation of the C-O bond of the carboxylic acid [62], as well as the C1–O vibration in syringyl derivatives rings in lignin [110,116]. The peak at 1234 cm−1 corresponds to the syringyl ring and C–O stretching in lignin and xylan (hemicellulose) components of the YTBS adsorbent [105,106,109,110]. The peak at 1077 cm−1 is attributed to the anti-symmetric bridge stretching of the ether bonds on the C-O-C groups (pyranose ring skeletal vibration) in cellulose and hemicelluloses [108,110,114,116], while the sharp shoulder at 1153 cm−1 is representative of the aromatic C–H in plane deformation of the guaiacyl-lignin [109].The peak at 935 cm−1 arises from the vibration associated with the C-O-C stretching at the β-(1→4)glycosidic linkages that is a characteristic peak associated with cellulosic polymers [96,117,118] and the peak at 988 cm−1 is due to the vibrations of the out-of-plane C=C aromatic functional groups in the lignin [119].The bands at 758 cm−1 and 856 cm−1 can also be attributed to the aromatic C-H out of plane deformations of the meta and para benzene groups of the phenolic structures in the lignocellulosic biomass of the YTBS adsorbent [105,116].
After Cd(II) sorption, there were variations in a number of peaks in the YTBS-Cd spectrum when compared to the unloaded YTBS adsorbents suggesting the participation of the functional groups on the adsorbent in the sorption of Cd(II) ion [43]. The non-conjugated carbonyl group at 1724 cm−1 associated with the carboxylic acid/ester(-COO) groups was not observed in the YTBS-Cd spectrum. This decrease in wavenumber of the peak that is a characteristic for the C=O group from the carboxylic acid, aldehydes and ketone moieties on the adsorbent and the disappearance of the peak at 1724 cm−1 indicates that there may be interactions between the Cd(II) ion and these functional groups during adsorption [2,106,109]. Also, there was a shift in the hydroxyl group peak from 3280 cm−1 to 3276 cm−1 after Cd(II) sorption which may indicate that the hydroxyl group is involved in the biosorption process [114,120]. Furthermore, the overall spectra of the YTBS adsorbent indicates that the functional groups present in cellulose, hemicellulose, lignin, and extractives components of the adsorbent did present shifts in wavenumbers at 1153 cm−1 to 1149 cm−1, 1334 cm−1 to 1321 cm−1, and 1077 cm−1 to 1075 cm−1 . These shifts in wavelengths of functional groups suggesting that the cellulose, lignin and hemicellulose polysaccharides in the different chemical environments in the lignocellulosic structure had interactions with the Cd(II) ions during sorption [120]. Shifts in peaks in the functional groups after Cd(II) ion sorption has also been reported in a number of studies in literature. Wang et al. [120] observed that the vibrations for the carbonyl, amine and hydroxyl groups in Phylolacca americana L. biomass did shift due to their participation in the biosorption of Pb(II) ion. Peak shifts have also been reported for the sorption of Cu(II) ion from aqueous solution using a lignocellulosic based adsorbent- chemically treated potato (Solanum tuberosum) leaf powder. In their study, the peaks for hydroxyl and amino groups were observed to have shifted from both hydroxyl (3428 cm−1 to 3416 cm−1) and amino groups (1612 cm−1 to 1614 cm−1) thus indicating that both amino and hydroxyl groups on the adsorbent might be involved in Cu(II) sorption [114].
4.2. Metal Ion Sorption Studies
Cd(II) ion sorption was carried out and some parameters used for adsorption were obtained from the YTBS characterization that has been discussed. Based on the zeta potential and pHpzc characterization of the YTBS adsorbent, the pH of 6.5 was chosen for Cd(II) ion sorption studies. The effect of a number of parameters on the sorption of Cd(II) ion by the YTBS adsorbent were studied. These were adsorbate pH, contact time and adsorbent dose. Equilibrium sorption of Cd(II) ion was also evaluated to determine the uptake capacity of the YTBS adsorbent. The determination of Cd(II) ion loading on the YTBS adsorbent was based on Equation (1).
4.2.1. Effect of Adsorbate pH
The effect of adsorbate pH on the sorption Cd(II) ions was also studied in this work. The adsorbate pH is a crucial parameter in sorption as it influences the speciation of ions in the adsorbate by determining both the nature of the species and the charge on the adsorbent surface and hence the probability of adsorption [121,122,123]. The effect of pH on Cd(II) ion sorption by the YTBS adsorbent is presented in Figure 9. From Figure 9, it can be observed that the amount of Cd(II) ions adsorbed was initially low between the pH 2–4. The low loading observed for Cd(II) at pH 2 is presumed to be associated with the influence of protons in solution at the low pH which leads to the protonation of the adsorbent surface (positively charged). Protonation of the adsorbent surface causes repulsion of the positive Cd(II) ions thereby leading to the reduction in the binding ability of the adsorbent for the metal ion. As the adsorbate pH increases, there is a gradual increase in the uptake of the Cd(II) ions due to the increase in the amount of negatively charged ions that exist on the adsorbent surface. This increase leads to the highest loading at pH 7.0 for Cd(II), and subsequently there is a decrease in uptake as the pH increased from 8–10. The increased sorption of Cd(II) ions at pH 5–7 may be due to the interaction of the species that are dominant at pH < 8, such as Cd2+ and Cd(OH)+ with the functional groups on the YTBS adsorbent surface [124]. Since these species are positively charged, there is more likelihood of interactions with the anions on the adsorbent surface leading to increase in uptake especially beyond the pHpzc (6.4) when the surface of the adsorbent is negatively charged. This is evident in Figure 9 where the highest loading is observed at pH 7 above the pHpzc, thereby confirming that at this pH the proportion of active sites for sorption of the positive Cd(II) ions are greatest. The increase in the species on the YTBS adsorbent that can interact with the Cd(II) ions as the pH enters the alkaline region improves the probability of metal ion removal. Thus due to the multiple-ion-binding sites on the adsorbent surfaces and the variety of metal ion species {Cd(OH)+ and Cd2+} in the adsorbate, a number of metal adsorbent complexes are formed during sorption process. This can be represented according to Equation (18) [19,125,126]:
where M = metal; A − XH (Adsorbent surface); [X = S, O, COO, NH]; M(A − X)n—metal adsorbent complex and H+—Displaced proton.
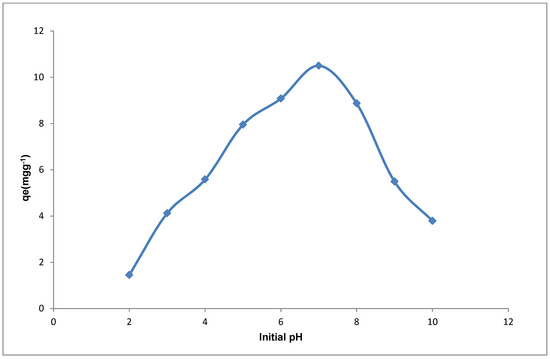
Figure 9.
Effect of pH on Cd(II) ion sorption onto YTBS adsorbent.
Hence, the sorption of Cd(II) by the YTBS adsorbent may occur by ion exchange where the metal ion displaces the proton (H+) from the adsorption site and becomes attached to the adsorbent forming an adsorbent metal complex. This mechanism may account for the decrease in the pH of the adsorbate after sorption between the pH 6–8 where there was substantial Cd(II) sorption which reduces as the pH further increases up till pH 10 as shown in Table 4 and Figure 9. The reduction in the uptake of Cd(II) ions from pH 8–10 indicates the effect of precipitation of the metal hydroxides species such as-Cd(OH)2 thereby leading to low amounts of the metal ion adsorbed by the YTBS adsorbent. This effect has also been reported by Dalali and Hagghi [127] in their study on the removal of cadmium from aqueous solution using walnut green husk. Pehlivan et al. [128] has also observed the decrease in sorption of Cd(II) by sugar beet pulp adsorbent with increasing pH and in their study, this was also attributed to the effect of hydrolysis accompanying precipitation of metal hydroxides.
Table 4.
Initial and final pH of adsorbate for YTBS sorption of Cd(II).
However, it should be noted that ion-exchange is not the only mechanism of sorption that might occur between the Cd(II) ions and the active sites/functional groups on the YTBS adsorbent surface. According to Sari et al. [34], metal ion removal by sorbents often involves complex mechanism such as ion exchange, chelation, adsorption by physical forces, ion entrapment in the intrafibrillar capillaries and spaces of the adsorbents and since the adsorbent surface is composed of functional groups such as carbonyl, hydroxyl, and amine these group will be involved in all potential metal ion binding mechanism. The maximum sorption of Cd(II) ion has also been reported in a number of previous studies. Feizi and Jalali [129] in their study on the removal of some heavy metal from aqueous solution using sunflower, potato, canola and walnut shell residues observed that the maximum uptake of Cd(II) by these residues were observed at pH 7, 6, 6, and 7 for sunflower, potato, canola, and walnut shell residues, respectively.
4.2.2. Effect of Adsorbent Dose
The amount of an adsorbent used for sorption is an important parameter as it gives information on the effectiveness of the adsorbent. The dependency of Cd(II) ion sorption on the YTBS adsorbent dosage was studied at pH 6.5, with initial metal ion concentration of 500 mg∙L−1, a temperature of 25 °C, and a reaction volume of 0.1 L. The amounts of adsorbent used were 0.5, 1.0, 1.5, 2.0, 2.5, and 3.0 g. The effect of adsorbent quantity on the efficiency of uptake of Cd(II) ions from the adsorbate is shown in Figure 10. From Figure 10, it is observed that the increase in adsorbent dosage from 0.5 to 3.0 g resulted in an increase of about 30% in the adsorption of Cd(II) ions. This trend in uptake is attributed to the increasing number of active sites and surface area for Cd(II) binding on the adsorbent as the weight of the adsorbent increases from 0.53 g due to the availability of larger surface area and more adsorption sites.
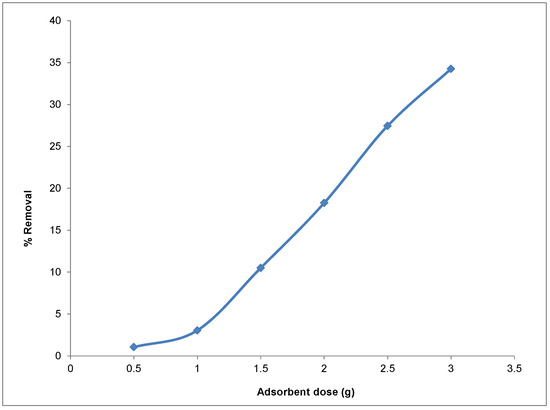
Figure 10.
Effect of adsorbent dose on the sorption of Cd(II) ion onto YTBS adsorbent.
This observation of the effect of adsorbent dose has also been reported by Shahidi et al. [130] in their study on the adsorption of cadmium ions from aqueous solution using Luffa cylindrica adsorbent. There was an increase in the percentage removal from 48-94% when the adsorbent dosage was increased from 2.1 to 8.4 g∙L−1. Barka et al. [131] has also reported a similar finding in their study of Cd(II) ion sorption onto dried cactus (opuntia ficus indica) cladodes. In their observation, there was an enhancement of metal ion loading from 10% to 36% when the biosorbent dosage was increased from 0.5 to 4.0 g∙L−1.
4.2.3. Sorption Kinetics
The kinetics of metal ion sorption provides information on the description of an adsorption process as the kinetics governs the rate which in turn determines the residence time of sorption, thus making it an essential characteristic that is used to define the efficiency of an adsorbent system [132]. Since, the rate at which sorption takes place provides analysis data that is useful for the design batch sorption systems, it is therefore pertinent to establish the time dependency of such systems for various pollutant removal processes [133]. The sorption kinetics also provides information on the minimum time required for considerable adsorption to take place and the can be used to predict the possible diffusion control mechanism between the metal ions as it migrates from the adsorbate towards the adsorbent surface [134].
The effect of contact time on Cd(II) ion uptake using the YTBS adsorbent was studied at pH 6.5 with initial metal ion concentration of 500 mg·L−1, temperature of 25 °C, and a volume of 0.1 L. The amount of the YTBS adsorbent used was 2.0 g and the duration of kinetic studies was from 5 to 1440 minutes (72 h). From the experiment, the kinetic profile of Cd(II) sorption was obtained and is presented in Figure 11.
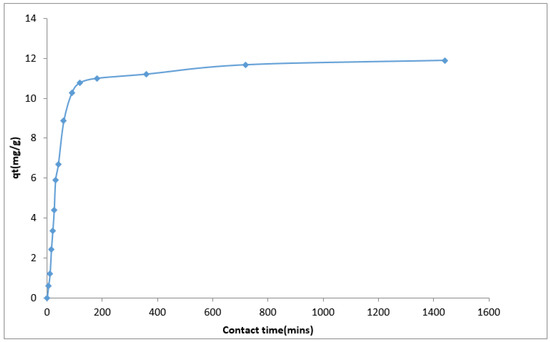
Figure 11.
Effect of contact time on Cd(II) ion sorption on YTBS adsorbent.
From Figure 11, Cd(II) ion uptake by the YTBS adsorbent increased with time up till 1440 min. The sorption process was slow due to the textural characteristics of the biosorbent (low surface area, low pore volume) with maximum uptake at 180 min and thereafter there was a gradual loading of Cd(II) ion on the YTBS adsorbent up till the attainment of pseudo-equilibrium loading of 11.89 mg∙g−1 after 1440 min. The two stage process of the uptake of Cd(II) by the YTBS adsorbent can be explained based on the availability of active sites on the YTBS adsorbent for Cd(II) ion loading. At inception of the metal ion-adsorbent contact, there are a number of readily accessible active sites on the adsorbent surface making the uptake of the Cd(II) ions at the initial instance faster than the process after 180 min. According to Sarada et al. [32] during metal ion uptake as a function of time, as contact time increases the vacant sites on the adsorbent surface become occupied and the number of sites available for uptake by incoming metal ions decreases thereby making the process slow. In addition, as more metal ions adsorb onto the surface of the adsorbents, there is a repulsive interaction between the metal ions in solution and those on the surface of the adsorbent due charge similarity thereby hindering the rapid uptake of metal ions, since surface of the adsorbent are now predominantly positive [32,129]. The trend of the metal ion kinetics reported in this study is similar to those reported in literature for example in a study by Guo et al. [135] on the sorption of Cd(II) by a chemically modified maize straw adsorbent; the two stages of uptake were reported: the initial rapid stage of metal ion uptake was associated with the activation energy and the subsequent slow stage linked with the rearrangement of the adsorbed ions (Cd(II)) on the surface of the adsorbent which leads to a more thorough utilization of the adsorption sites on the adsorbent. These effects are presumed to contribute to the gradual metal ions uptake noticed until equilibrium is attained. The two stage variation in the uptake profile of the Cd(II) ions onto the surface of the YTBS adsorbent has also been observed in other studies. Ding et al. [135] has also reported on the two stages in their description of the sorption kinetics of aquatic Cd(II) ions using unmodified rice straw. Shahidi et al. [130] has also observed this two stage profile in their study on the adsorption of cadmium (II) ions from aqueous solution using Luffa cylindica adsorbent and this was attributed to the presence of vacant sites at the inception of sorption.
4.2.4. Kinetic Modelling
A number of models have been used to describe the rate and extent of sorption of an adsorbate onto an adsorbent and these models have assumptions for the prediction of these interactions [136]. To determine the potential rate-controlling step for Cd(II) sorption by the YTBS adsorbent three diffusion-based kinetic models were used to test the experimental data. The applicability of different kinetic models is often tested based on their ability to describe the experimental kinetic data using some optimization parameters. For the sorption of Cd(II) ions onto the YTBS adsorbent, three kinetic models were evaluated and these are the pseudo-first order (PFO), pseudo second order (PSO), and Elovich. To determine the goodness of fit of the kinetic models to the experimental data using non-linear regression, the optimization procedure requires that error functions be defined to enable the fitting of the model parameters with the experimental values. In this study, the coefficient of determination (r2), the root mean square error (RMSE), sum of square error (ERRSQ), and the Chi square test (χ2) were used as error parameters for each model and these were determined based on Equations (13)–(16) which have been previously described in this study. The kinetic modelling plot of Cd(II) ion sorption onto the YTBS adsorbent is presented in Figure 12. From these models, the kinetic parameters and their respective error functions obtained are presented in Table 5. From Table 5, the results indicate that all the three kinetic models could be used to predict the kinetics of Cd(II) ion uptake onto the YTBS adsorbent. For the pseudo-first order (PFO) & pseudo-second order (PSO) models, the prediction of each model of the kinetic parameter (qe,model) is close to the result obtained from the experimental analysis of Cd(II) ion sorption (11.89 mg∙g−1). The Elovich equation on the other hand also gave estimation of the initial adsorption rate (α) and which relates to the extent of surface coverage and activation energy for chemisorption.
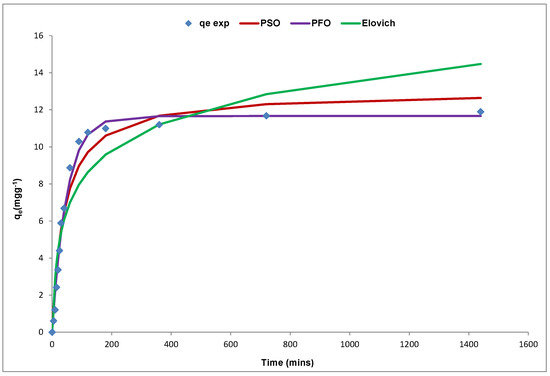
Figure 12.
Plot for pseudo first order (PFO), pseudo second order (PSO), and Elovich kinetic models.
Table 5.
Kinetic modelling parameters for cadmium sorption on YTBS.
From Table 5, the rate constant (k1) of the pseudo first order (PFO) model was 2.05 × 10⁻² min−1 and this result is similar to what has been reported in previous studies for some lignocellulosic adsorbents used for Cd(II) adsorption. Feizi and Jalali [129] have reported on the kinetics of Cd(II) sorption using sunflower, potato, canola, and walnut shell adsorbents and in their study, the values of k1 for the PFO model were; 2.0 × 10⁻² min−1, 8.0 × 10⁻² min−1, 1.0 × 10⁻² min−1 and 1.0 × 10⁻² min−1 for sunflower, potato, canola, and walnut shell adsorbents, respectively. In another study by Ding et al. [137], the rate constant (k1) of the pseudo first order (PFO) model obtained for Cd(II) sorption by unmodified rice straw was reported as 1.1 × 10⁻¹ min−1. A k1 value of 1.6 × 10⁻¹ min−1 for the PFO model has also been reported for the sorption of Cd(II) from aqueous solution by Alhaji maurorum seed adsorbent [138]. For the pseudo second order (PSO) model, the rate constant (k2) obtained for Cd(II) sorption by the YTBS adsorbent was 1.9 × 10⁻³ g∙mg−1·min−1 and this value indicates that the rate of uptake as described by the PSO model was faster than that of the PFO model. Similar values for the PSO rate constant have been reported by Feizi and Jalali [129] for the sorption of Cd(II) by potato (9.0 × 10⁻³ g∙mg−1·min−1) and canola (7.0 × 10⁻³ g∙mg−1·min−1) residue adsorbents. Iqbal et al. [139] has also reported a pseudo second order rate conatant of 1.0 × 10⁻³ g∙mg−1·min−1 in their study of Cd(II) sorption by mango peels. For the PSO model, the initial adsorption rate “h” obtained from the model as presented in Table 5 is 3.2 × 10⁻¹ mg∙g−1·min−1, and this is observed from Table 5 to be lower than 7.7 × 10⁻¹ mg∙g−1·min−1 obtained for initial adsorption rate (α) obtained based on the Elovich equation. Both the pseudo second order model and the Elovich equation are based on fundamental assumptions of chemisorption mechanism for adsorbate uptake, and the value of the initial adsorption rate from both models indicates that the Elovich equation has a faster rate than that the PSO. The Elovich equation parameter which relates to the extent of heterogeneous surface coverage was 0.43g mg−1 and this indicates the extent of Cd(II) loading on the YTBS surface based on this model. The surface loading obtained for the PFO and PSO models were 11.7 mg∙g−1 and 12.9 mg∙g−1, respectively, and these values indicate that the (qe,cal) value obtained for the PFO model was closer to the experimental value (11.9 mg∙g−1).
To determine which kinetic model best describes the sorption of Cd(II) onto the YTBS adsorbent, further evaluation of the values for error parameters (χ2, ERRSQ and RMSE) and determination coefficient (r2) in Table 5 for the three models indicates that the PFO model had the lowest values for the three error parameters and the highest r2 value (0.99). Thus, it can be said that the PFO model gave the best approximation of the kinetics of Cd(II) sorption by the YTBS adsorbent than the PSO and Elovich model. This implies that the kinetics supports the assumption that the rate limiting step of Cd(II) ion sorption onto the YTBS adsorbent is dependent on the concentration of the Cd(II) ions in the adsorbate [46,140,141].
4.2.5. Equilibrium Isotherm Modelling
Analysis of equilibrium data is known to be important for the evaluation of the efficiency of an adsorbent for the adsorbate under consideration. It is also used to generate isotherm modelling parameters that can be used to compare different adsorbents as well as for the design and optimization the sorption procedure [142]. The plot of the experimental and isotherm plots for Cd(II) ion removal using the YTBS adsorbent is shown in Figure 13 and this figure indicates that the adsorption of the Cd(II) ion was concentration dependent with loading (qe,exp) increasing from 1.32 mg∙g−1 to 11.28 mg·g−1 with increase in initial metal ion concentration from 50 to 500 mg∙L−1. This increase can be associated with the increase in availability of Cd(II) ions in the adsorbate system as the initial metal ion concentration increased from 50 to 500 mg∙L−1. This leads to an increase in the driving force afforded the system by the increasing metal ion concentration making it possible to overcome the mass transfer resistance that exist between the Cd(II) ions in the adsorbate and the YTBS adsorbent [17]. Based on the classification of equilibrium adsorption isotherms according to Giles [143,144,145], the equilibrium isotherm for YTBS sorption of Cd(II) ions can grouped as an “L” isotherm. From these experimental values, three isotherm models (Langmuir, Freundlich and Temkin) were used to further characterize the sorption equilibrium between the adsorbent (YTBS) and the adsorbate. In this study, the coefficient of determination (r2), the root mean square error (RMSE), sum of square error (ERRSQ), and the Chi square test (χ2) were used as error parameters for each model and these were determined based on Equations (13)–(16) which have been previously described in this study in addition with the fundamental assumptions of these kinetic models theoretical models for fitting experimental data section of this study.
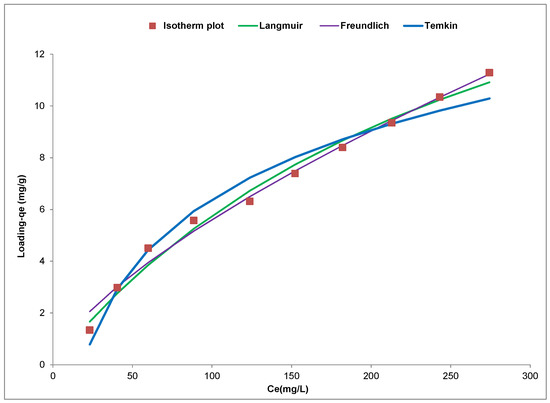
Figure 13.
Langmuir, Freundlich, and Temkin equilibrium isotherm models for Cd(II) sorption on YTBS residue.
From this isotherm plot, the Langmuir, Freundlich and Temkin isotherm parameters and errors parameters (RMSE, χ2 and ERRSQ), as well as the coefficient of determination (r2) for the YTBS adsorbent sorption of Cd(II) ions were obtained and are presented in Table 6. From the Langmuir isotherm plot in Figure 13, the qmax is the parameter that is used to characterize the adsorbent loading capacity; it is attributable to the maximum metal uptake upon complete saturation of the adsorbent, while the parameter KL is a coefficient that describes the affinity between the adsorbent and the adsorbate [17,33,142].
Table 6.
Isotherm model parameters for sorption of Cd(II) onto YTBS adsorbent.
This model also assumes that there exist a monolayer coverage of the surface of the YTBS adsorbent with Cd(II) ions which is indicated by the qmax parameter [35]. From this model, the value of Langmuir constant KL obtained was 3.46 × 10⁻³ L·mg−1 for the YTBS adsorbent indicating the level of adsorbent-adsorbate affinity as presented in Table 6. The value of the Langmuir isotherm constant qmax (22.4 mg·g−1) is also indicated in Table 6, and this implies that the maximum saturation capacity of the YTBS adsorbent for the Cd(II) is 22.4 mg·g−1. The value obtained for the Cd(II) ion maximum monolayer loading capacity qmax for the YTBS adsorbent was compared to those of some adsorbents reported in literature as seen in Table 6. From the Table, it is observed that the adsorbent in this study had a qmax value that was comparable to those reported in literature indicating that this residue can be a promising adsorbent for the removal of cadmium from aqueous solutions and effluent systems.
For the Freundlich isotherm in Figure 13, the parameters “n” and “KF” are used to describe the multilayer nature of sorption on heterogeneous surfaces [35,36]. For the sorption of Cd(II) ions onto the YTBS adsorbent, the value of the parameter KF, which relates to adsorption capacity was 2.37 × 10⁻¹ (mg·g−1) (L·mg−1)1/n as presented in Table 7, thereby indicating a low multilayer adsorption capacity.
Table 7.
Cd(II) Langmuir constant qmax of this study with those reported in literature.
The Freundlich constant “n” which relates to the adsorption intensity and varies with the heterogeneity of the adsorbent surface is used to indicate how favorable the multilayer sorption process is based on this model. The range of “n” from 1–10 indicates a favorable adsorption process [17,32,34,146]. From Table 6, it is observed that the value of the parameter “n” for the sorption of Cd(II) ions onto the surface of the YTBS adsorbent was 1.46, which confirms that the sorption process was favorable.
A number of studies have reported values for the Freundlich isotherm modeling of Cd(II) sorption that are similar to those obtained in this study. Vazquez et al. [161] in their study on the equilibrium and kinetic modelling of the adsorption of Cd2+ ions onto chestnut shell reported KF value of 1.07 mg1−1/n g−1 L1/n and the value of “n” obtained was 2.7. Similarly, in another study by Perez-Marin et al. [43] on the removal of cadmium from aqueous solution by adsorption onto orange waste, the Freundlich isotherm parameters obtained were KF (0.317) and n (3.38). The Temkin isotherm in Figure 13 was used to obtain the constants of the Temkin equation presented in Table 6. From Table 6, can be observed that the value of the Temkin constant “B” is 3.84 kJ∙mol−1, this parameter relates to the heat of adsorption gives an indication of the heat associated with the adsorption of the Cd(II) ions onto the surface of the YTBS adsorbent [37]. The second constant of the Temkin isotherm “AT” is the equilibrium constant and it indicates the loading of the adsorbate onto the adsorbent for the sorption process based on the Temkin model. From Table 6, the value of AT for the sorption of Cd(II) ions onto the YTBS adsorbent is 5.29 × 10⁻² L·mg−1 and implies a very low loading based on the Temkin model. The results obtained for the sorption of the YTBS adsorbent for the Temkin model is similar to what has been reported in literature. Vashantha et al. [162] in their study on the adsorption of Cadmium(II) ions from simulated wastewater using raw Luffa husk have reported parameters for the Temkin model of 2.41 (BT) and 1.00 (KT).
Furthermore, from Table 6, a comparison of the three isotherm models can be made based on the value of their respective error parameters used to characterize the non-linear modelling. It was observed that the high r2 values and low root mean square error (RMSE), Chi square (χ2) and sum of error squared (ERRSQ) values for the three isotherm models implies that these models can be used to described the sorption of Cd(II)ions onto the YTBS residue adsorbent. However, the Langmuir model was the best model that described the uptake of Cd(II) ions onto the YTBS adsorbent as its r2 value (0.99) was higher than that of the Freundlich (0.98) and Temkin models (0.98). In addition, the values of the three error parameters (ERRSQ, RMSE and χ2) were lowest for the Langmuir model when compared with those of the Temkin and Freundlich models.
4.3. Mechanism of Cd(II) Ion Sorption Onto YTBS Adsorbent
The identification of the mechanism that governs metal ion sorption on sorbents is a challenge as a number of different processes may operate in a sorbent-sorbate system. The YTBS adsorbent is lignocellulosic biomass, and these types of adsorbents which are composed of cellulose, lignin, and hemicellulose as major components and to a lesser extent fatty acid bearing functional groups such as alcohol, ketone, and carboxylic acids have been reported as possible sites for complexation reactions with metallic cations during sorption. Ion-exchange is another mechanism that has been reported in literature as a mechanism of metal ion sorption [7,163].
In this study, the sorption mechanism via which Cd(II) ions were sorbed onto the YTBS adsorbent was examined using EDX and FT-IR spectroscopy as previously discussed in adsorbent characterization. Uptake mechanism can proceed via ion-exchange due to the interaction of the metal ions on the YTBS surface with the Cd(II) ions in the adsorbate and the examination of the EDX spectra (Figure 4 and Figure 5) indicates that there was a decrease in the percentage composition of some alkali metal ions potassium (K) and calcium (Ca) present in the residue adsorbent (Figure 4) when compared to those of the Cd(II) loaded adsorbent (Figure 5) after sorption. This may imply that there was ion-exchange between these alkali- metal ions with Cd(II) on the adsorbent surface, thereby making this a possible mechanism for metal ion uptake. This approach has also been reported by Iqbal et al. [89] on the use of the EDX analysis of grapefruit peel to confirm the mechanism of ion-exchange for the removal of Zn (II) from aqueous solutions. The study observed that the calcium (Ca) and potassium (K) ions identified in the EDX spectrum of the fresh grapefruit peel were absent in the peel used for Zn(II) ion adsorption, thus suggesting that these ions (Ca, K) may be involved in the ion-exchange with the Zn(II) ions.
A number of functional groups such as hydroxyl, sulfhydryl, sulfonate, carboxylate have been proposed to be responsible for sorption related metal ion binding in adsorbents. The ability of these groups also called active sites to bind metal ions during adsorption have been suggested by El-Kamash et al. [164] to depend on a number of factor such as the quantity of sites, accessibility of sites, chemical state of sites, and affinity between metal ion and active sites [17]. For the YTBS adsorbent the data obtained from FTIR studies before and after Cd(II) sorption (Figure 8) shows that a number of carbonyl (–CO), carboxylic acid/esters(–COO) amide (–N–H) and hydroxyl (–O–H) groups may be active sites for metal ion interaction. These functional groups were observed to have decreased intensity or disappeared in the spectrum of the YTBS adsorbent after Cd(II) sorption (YTBS-Cd). Cd(II) belongs to the transition group metal which has a greater tendency for interaction via coordination bonding. This can be achieved through the coordination bonding using the vacant d-orbital by dative bonding with lone pair of oxygen or nitrogen containing groups and these functional group contain lone pairs of electrons [2,165]. Hence the Cd(II) ions could bond with the amide, carboxyl and carboxylic acid/ester groups by coordinating bonding as suggested by Vaghetti et al. [166]. This observation of coordination bonding between Cd(II) ion and electron rich nitrogen and oxygen functional groups has also been reported by Chand et al. [2] in their study on the sorption of Cd(II) ions from aqueous solution using chemically modified apple pomace. In their study the metal ion uptake by the adsorbent was proposed to occur via coordinating to amine (-NH2) and carbonyl (-CO) groups.
5. Conclusions
An agricultural by-product (YTBS) was studied for the capacity to remove Cd(II) ion from aqueous solution using a batch process. From the study, the following conclusions can be drawn from the results:
- Cd(II) ion sorption by the YTBS adsorbent was pH-dependent and the maximum uptake was observed in the pH range 6.5–7.0.
- Metal ion loading was found to increase with increasing amounts of adsorbent up to a maximum at 3 g.
- The kinetics of Cd(II) ion sorption indicated that metal ion loading showed a two stage uptake- an initial quick uptake up to 180 min, which was followed by a gradual metal ion removal up till 1440 min. The sorption kinetics was modelled using three equations (pseudo first order, pseudo second order, and Elovich) to determine which gives the best description of Cd(II) uptake. This was found to be the pseudo first order based on the value of qe,cal, error parameters and the r2 (0.99).
- Equilibrium isotherm modelling on the effect of initial metal ion concentration on metal ion removal was carried out using the Langmuir, Freundlich, and Temkin isotherms, with the Langmuir isotherm giving the best fit for the description of experimental Cd(II) ion loading. From the Langmuir isotherm modelling, the maximum loading capacity (qmax) of Cd(II) on the YTBS adsorbent was 23.4 mg∙g−1 indicating a high uptake capacity for an agricultural residue.
- The mechanism of Cd(II) ion removal from aqueous solution by the adsorbents were presumed to be via ion-exchange and adsorption-complexation and these were elucidated from the EDAX and ATR-FTIR characterization of the adsorbents before and after sorption.
- The residue adsorbent was found to be effective in removal the heavy metal ion, and hence can be a good resource for pollution control that can be utilized in developing countries to reduce the effect of heavy metal pollution.
Author Contributions
Conceptualization, E.D.A. and A.D.M.; Methodology, E.D.A., A.D.M. and P.N.; Software, E.D.A., A.D.M. and P.N.; Validation, E.D.A., A.D.M. and P.N.; Formal Analysis, E.D.A., A.D.M. and P.N.; Investigation, E.D.A. and P.N.; Resources, E.D.A., A.D.M. and P.N.; Data Curation, E.D.A.; Writing-Original Draft Preparation, E.D.A.; Writing-Review & Editing, E.D.A. and P.N.; Visualization, E.D.A.; Supervision, A.D.M.; Project Administration, E.D.A.; Funding Acquisition, E.D.A.
Funding
This research received no external funding.
Conflicts of Interest
The authors declare no conflict of interest
Abbreviations
| Ci | Initial metal ion concentration (mg∙L−1) |
| Ct | Metal ion concentration at time t (mg∙L−1) |
| SEM | Scanning electron microscopy |
| qmax | Langmuir isotherm maximum adsorption capacity (mg∙g−1) |
| qt | Metal ion loading at time t (mg∙g−1) |
| AT | Temkin isotherm constant (L·mg−1) |
| r2 | Co-efficient of determination |
| B | Temkin constant related to heat of adsorption (J∙mol−1) |
| w | weight of adsorbent (g) |
| ERRSQ | Sum of the squares of the errors |
| k1 | Pseudo first order rate constant (L·min−1) |
| k2 | Pseudo second order rate constant (g∙mg−1∙min−1) |
| R | Universal gas constant (8.314 J∙mol∙K−1) |
| YTBS | White yam tuber peel |
| β | Elovich parameter-surface coverage and activation energy |
| h | Pseudo second order initial adsorption rate (mg·g−1·min−1) |
| qe | Equilibrium adsorption loading (mg∙g−1) |
| χ2 | Chi-square test |
| RMSE | Root mean square error |
| α | Elovich initial adsorption rate (mg·g−1∙min−1) |
| Ce | Equilibrium metal ion concentration in the solution (mg∙L−1) |
| EDS | Energy dispersive X-ray analysis |
| pHpzc | pH point of zero charge |
| n | Freundlich isotherm parameter |
| KF | Freundlich isotherm constant (mg∙g−1) |
| KL | Langmuir isotherm constant (L·mg−1) |
| ATR-FTIR | Attenuated total reflectance Fourier transform infrared |
References
- Bailey, S.E.; Olin, T.J.; Bricka, M.R.; Adrian, D.D. A review of potentially low-cost sorbents for heavy metals. Water Res. 1999, 3, 2469–2479. [Google Scholar] [CrossRef]
- Chand, P.; Shil, A.K.; Sharma, M.; Pakade, Y.B. Improved adsorption of cadmium ions from aqueous solution using chemically modified apple pomace: Mechanism, kinetics and thermodynamics. Int. Biodeterior. Biodegrad. 2014, 90, 8–16. [Google Scholar] [CrossRef]
- Waalkes, M.P. Cadmium Carcinogenesis.-Review. Mutat. Res. 2003, 533, 107–120. [Google Scholar] [CrossRef] [PubMed]
- IARC. Beryllium, Cadmium, Mercury and Exposures in Glass Industry; International Agency for Research on Cancer Monographs: Lyon, France, 1993; Volume 58, pp. 119–238. [Google Scholar]
- USNTP. United States National Toxicity Programme, 10th Report on Carcinogens; Department of Health and Human Services: Research Triangle Park, NC, USA, 2000; pp. III-42–III-44. [Google Scholar]
- European Council. Council Directive 98/83/EC on the quality of water intended for human consumption. The Council of the European Union, 3 November 1998. Off. J. Eur. Union 1998, 330, L330-32-54. [Google Scholar]
- Nurchi, V.M.; Villaescusa, I. Agricultural biomass as sorbents of some trace metals. Coord. Chem. Rev. 2008, 252, 1178–1188. [Google Scholar] [CrossRef]
- Joseph, P. Mechanism of cadmium carcinogenesis. Toxicol. Appl. Pharmacol. 2009, 238, 272–279. [Google Scholar] [CrossRef] [PubMed]
- Sahmoun, A.E.; Case, L.D.; Jackson, S.A.; Schwartz, G.G. Cadmium and prostate cancer: A critical epidemiologic analysis. Cancer Investig. 2005, 23, 256–263. [Google Scholar] [CrossRef]
- Jin, T.; Lu, J.; Nordberg, M. Toxicokinetics and biochemistry of cadmium with special emphasis on the role of metallothionein. Neurotoxicology 1988, 19, 529–535. [Google Scholar]
- Lam, K.F.; Yeung, K.L.; McKay, G. Efficient approach for Cd2+ and Ni2+ removal and recovery using mesoporous adsorbent with tunable selectivity. Environ. Sci. Technol. 2007, 41, 3329–3334. [Google Scholar] [CrossRef] [PubMed]
- Unuabonah, E.I.; Gunter, C.; Weber, J.; Lubahn, S.; Taubert, A. Hybrid clay: A new highly efficient adsorbent for water treatment. ACS Sustain. Chem. Eng. 2013, 1, 966–973. [Google Scholar] [CrossRef]
- Rao, K.S.; Anand, S.; Venkateswarlu, P. Adsorption of cadmium (II) ions from aqueous by Tectona grandis L. F. (Teak leaves powder). BioResources 2010, 5, 438–454. [Google Scholar]
- Nguyen, T.A.H.; Ngo, H.H.; Guo, W.S.; Zhang, J.; Liang, S.; Yue, Q.Y.; Li, Q.; Nguyen, T.V. Applicability of agricultural waste and by-products for adsorptive removal of heavy metals from wastewater. Bioresour. Technol. 2013, 148, 574–583. [Google Scholar] [CrossRef] [PubMed]
- Ahluwalia, S.S. Waste biomaterials for removal of heavy metals- An overview. Dyn. Biochem. Process Biotechnol. Mol. Biol. 2002, 6, 62–67. [Google Scholar]
- Unuabonah, E.I.; Olu-Owolabi, B.I.; Fasuyi, E.I.; Adebowale, K.O. Modelling of fixed-bed column studies for the adsorption of cadmium onto novel polymer-clay composite adsorbent. J. Hazard. Mater. 2010, 179, 415–423. [Google Scholar] [CrossRef] [PubMed]
- Basha, S.; Murthy, Z.V.P.; Jha, B. Sorption of Hg(II) onto Carica papaya; Experimental studies and design of batch sorber. Chem. Eng. J. 2009, 147, 226–234. [Google Scholar] [CrossRef]
- Pollard, T.J.S.; Fowler, D.G.; Sollars, J.C.; Perry, R. Low-cost adsorbents for waste and wastewater treatment; a review. Sci. Total Environ. 1992, 116, 31–52. [Google Scholar] [CrossRef]
- Rao, K.S.; Mahapatra, M.; Anand, S.; Venkateswarlu, P. Review on Cadmium Removal from Aqueous Solutions. Int. J. Eng. Sci. Technol. 2010, 2, 81–103. [Google Scholar] [CrossRef]
- Kumar, P.S.; Ramalingam, S.; Sathyaselvabala, V.; Kirupha, S.D.; Murugesan, A.; Sivanesan, S. Removal of cadmium from aqueous solution by agricultural waste cashew nut shell. Korean J. Chem. Eng. 2012, 29, 756–768. [Google Scholar] [CrossRef]
- Igwe, J.C.; Abia, A.A.; Asuquo, E.D. Studies on the influence of counter ions and modifications of adsorbent on the kinetics of Hg(II), As(III) and Pb(II) ions removal from aqueous solutions using sawdust meal. J. Chem. Soc. Niger. 2012, 37, 73–79. [Google Scholar]
- Nouri, L.; Ghodbane, I.; Hamdaoui, O.; Chiha, M. Batch sorption dynamics and equilibrium for the removal of cadmium ions from aqueous phase using wheat barn. J. Hazard. Mater. 2007, 149, 115–125. [Google Scholar] [CrossRef] [PubMed]
- Falade, K.O.; Ayetigbo, E.O. Effects of annealing, acid hydrolysis and citric acid modifications on the physical and functional properties of starches from four yam (Dioscorea spp.) cultivars. Food Hydrocoll. 2015, 43, 529–539. [Google Scholar] [CrossRef]
- Hahn, S.K. Yam (Dioscorea spp.) Dioscoreaceae. In Evolution of Crop Plants, 2nd ed.; Smatt, J., Simmonds, N.W., Eds.; Longman Scientific and Technical: Harlow, UK, 1995; pp. 112–120. [Google Scholar]
- Okeoghene, E.S.; John, E.; Ose, O.O. Profitability Analysis of Yam Production in Ika South Local Government Area of Delta State, Nigeria. J. Biol. Agric. Healthc. 2013, 3, 118–129. [Google Scholar]
- Amusa, N.A.; Adegbite, A.A.; Muhammed, S.; Baiyewu, R.A. Yam Diseases and its Management in Nigeria. Afr. J. Biotechnol. 2003, 2, 497–502. [Google Scholar] [CrossRef]
- Oladeji, J.T. Agricultural and forestry wastes and opportunities for their use as an energy source in Nigeria- An overview. World Rural Obs. 2011, 3, 107–112. [Google Scholar]
- Jekayinfa, S.; Omisakin, O. The Energy potentials of some agricultural wastes as local fuel materials in Nigeria. Int. Comm. Agric. Eng. (CIGR Comm. Int. Genie Rural) 2005, 7. Available online: https://ecommons.cornell.edu/bitstream/handle/1813/10436/EE%2005%20003%20Jekayinfa%20final%20Oct2005.pdf?sequence=1&isAllowed=y (accessed on 6 October 2016).
- Sabo, A.; Gani, A.; Ibrahim, A.Q. Pollution status of heavy metals in water and bottom sediments of River Delimi in Jos, Nigeria. Am. J. Environ. Prot. 2013, 1, 47–53. [Google Scholar]
- Asuquo, E.D.; Martin, A.D. Sorption of cadmium (II) ion from aqueous solution onto sweet potato (Ipomoea batatas L.) peel adsorbent: Characterisation, kinetic and isotherm studies. J. Environ. Chem. Eng. 2016, 4, 4207–4228. [Google Scholar] [CrossRef]
- Asuquo, E.; Martin, A.; Nzerem, P.; Siperstein, F.; Fan, X. Adsorption of Cd(II) and Pb(II) ions from aqueous solutions using mesoporous activated carbon adsorbent: Equilibrium, kinetics and characterisation studies. J. Environ. Chem. Eng. 2017, 5, 679–698. [Google Scholar] [CrossRef]
- Sarada, B.; Prasad, M.K.; Kumar, K.K.; Murthy, C.V.R. Cadmium removal by macro algae Caulerpa fastigiata: Characterization, kinetic, isotherm and thermodynamic studies. J. Environ. Chem. Eng. 2014, 2, 1533–1542. [Google Scholar] [CrossRef]
- Langmuir, I. The adsorption of gases on plane surfaces of glass, mica and platinum. J. Am. Chem. Soc. 1918, 40, 1361–1403. [Google Scholar] [CrossRef]
- Sari, A.; Mendil, D.; Tuzen, M.; Soulak, M. Biosorption of Cd(II) and Cr(III) from aqueous solution by moss (Hylocomium splendens) biomass: Equilibrium, kinetic and thermodynamic studies. Chem. Eng. J. 2008, 144, 1–9. [Google Scholar] [CrossRef]
- Athar, M.; Farooq, V.; Aslam, M.; Salam, M. Adsorption of Pb(II) ions onto biomass from Trifolium resupinatum: Equilibrium and kinetic studies. Appl. Water Sci. 2013, 3, 665–672. [Google Scholar] [CrossRef]
- Freundlich, H.M.F. Over the Adsorption in Solution. J. Phys. Chem. 1906, 57, 385–471. [Google Scholar]
- Yousef, R.I.; El-Eswed, B.; Al-Muhtaseb, A.H. Adsorption characteristics of natural zeolites as solid adsorbents for phenol removal from aqueous solutions: Kinetics, mechanism, and thermodynamics studies. Chem. Eng. J. 2011, 171, 1143–1149. [Google Scholar] [CrossRef]
- Ho, Y.S.; Porter, J.F.; McKay, G. Equilibrium isotherm studies for the sorption of divalent metal ions onto peat: Copper, Nickel, and Lead single component systems. Water Air Soil Pollut. 2002, 141, 1–33. [Google Scholar] [CrossRef]
- Temkin, M.I.; Pyzhev, V. Kinetics of ammonia synthesis on promoted iron catalyst. Acta Physiochim. 1940, 12, 327–356. [Google Scholar]
- Kumar, P.; Singh, H.; Kapur, M.; Mondal, M.K. Comparative study of Malathion removal from aqueous solution by agricultural and commercial adsorbents. J. Water Process Eng. 2014, 3, 67–73. [Google Scholar] [CrossRef]
- Kakalanga, S.J.; Jabulani, X.B.; Olutoyin, O.B.; Uteiyin, O.O. Screening of agricultural waste for Ni(II) adsorption: Kinetics, equilibrium and thermodynamic studies. Int. J. Phys. Sci. 2012, 7, 2525–2538. [Google Scholar]
- Farooq, U.; Khan, M.A; Athar, M.; Kozinski, J.A. Effect of modification of environmentally friendly adsorbent wheat (Triticum aestivum) on the biosorption removal of cadmium(II) ions from aqueous solution. Chem. Eng. J. 2011, 171, 400–410. [Google Scholar] [CrossRef]
- Perez-Marin, A.B.; Zapata, V.M.; Ortuno, J.F.; Aguilar, M.; Saez, J.; Llorens, M. Removal of cadmium from aqueous solutions by adsorption onto orange waste. J. Hazard. Mater. B 2007, 139, 122–131. [Google Scholar] [CrossRef] [PubMed]
- Ho, Y.S. Citation review of Lagergren kinetic rate equation on adsorption reactions. Scientometrics 2004, 59, 171–177. [Google Scholar]
- Lagergren, S. About the theory of so-called adsorption of soluble substances. Kungliga Svenska Vetenskapsakademiens. Handlingar 1898, 24, 1–39. [Google Scholar]
- Ho, Y.S.; Chiu, W.T.; Hsu, C.S.; Huang, C.T. Sorption of lead ions form aqueous solution using tree fern as a sorbent. Hydrometallurgy 2004, 73, 55–61. [Google Scholar] [CrossRef]
- Xuan, Z.; Tang, Y.; Li, X.; Liu, Y.; Luo, F. Study on the equilibrium, kinetics and isotherm of Biosorption of lead ions onto presented chemically modified orange peel. Biochem. Eng. J. 2006, 31, 160–164. [Google Scholar] [CrossRef]
- Ho, Y.S. Selection of optimum sorption isotherm. Carbon 2004, 42, 2115–2116. [Google Scholar] [CrossRef]
- Lin, J.; Wang, L. Comparison between linear and non- linear forms of first-order and pseudo-second order adsorption kinetic models for the removal of methylene blue by activated carbon. Front. Environ. Sci. Eng. China 2009, 3, 320–324. [Google Scholar] [CrossRef]
- Ho, Y.S. Review of second-order models for adsorption systems. J. Hazard. Mater. B 2006, 136, 681–689. [Google Scholar] [CrossRef] [PubMed]
- El-Khaiary, M.I.; Malash, G.F.; Ho, Y.S. On the use of linearized pseudo-second-order kinetic equations for modeling adsorption systems. Desalination 2010, 257, 93–101. [Google Scholar] [CrossRef]
- Chien, S.H.; Clayton, W.R. Application of Elovich equation to the kinetics of phosphate release and sorption on soils. Soil Sci. Soc. Am. J. 1980, 44, 265–268. [Google Scholar] [CrossRef]
- Cheung, C.W.; Porter, J.F.; McKay, G. Elovich equation and modified second order equation for adsorption of cadmium ions onto bone char. J. Chem. Technol. Biotechnol. 2000, 75, 963–970. [Google Scholar] [CrossRef]
- Alomá, I.; Martín-Lara, M.A.; Rodríguez, I.L.; Blázquez, G.; Calero, M. Removal of nickel (II) ions from aqueous solutions by biosorption on sugarcane bagasse. J. Taiwan Inst. Chem. Eng. 2012, 43, 75–281. [Google Scholar] [CrossRef]
- Cheung, C.W.; Porter, J.F.; McKay, G. Sorption kinetic analysis for the removal of cadmium ions from effluents using bone char. Water Res. 2001, 37, 3079–3086. [Google Scholar] [CrossRef]
- Sparks, D.L. Kinetics of Reaction in Pure and Mixed Systems; Sparks, D.L., Ed.; Soil Physical Chemistry, CRC Press: Boca Raton, FL, USA, 1986; pp. 83–145. [Google Scholar]
- Sengil, I.A.; Ozacar, M.; Turkmenler, H. Kinetic and isotherm studies of Cu(II) biosorption on valonia tannin resin. J. Hazard. Mater. 2009, 162, 1046–1052. [Google Scholar] [CrossRef] [PubMed]
- Ho, Y.S.; McKay, G. Sorption of Copper(II) from aqueous solution by peat. Water Air Soil Pollut. 2004, 158, 77–97. [Google Scholar] [CrossRef]
- Abia, A.A.; Asuquo, E.D.; Igwe, J.C. Nickel(II) ion desorption kinetic modelling from unmodified and chemically modified oil palm (Elaeis guineesis) fruit fibre adsorbent. J. Appl. Sci. Eng. Technol. 2007, 7, 22–41. [Google Scholar]
- Demirbas, E.; Kobja, M.; Senturk, E.; Ozkan, T. Adsorption kinetics for the removal of chromium (VI) from aqueous solution on the activated carbons prepared from agricultural wastes. Water SA 2004, 30, 533–540. [Google Scholar] [CrossRef]
- Gimbert, F.; Morin-Crini, N.; Renault, F.; Badot, P.; Crini, G. Adsorption isotherm models for dye removal by cationized starch-based material in a single component system: Error analysis. J. Hazard. Mater. 2008, 157, 34–46. [Google Scholar] [CrossRef] [PubMed]
- Gurses, A.; Hassani, A.; Kıransan, M.; Acıslı, O.; Karaca, S. Removal of methylene blue from aqueous solution using by untreated lignite as potential low-cost adsorbent: Kinetic, thermodynamic and equilibrium approach. J. Water Process Eng. 2014, 2, 10–21. [Google Scholar] [CrossRef]
- Ibrahim, M.N.M.; Ngah, W.S.W.; Norliyana, M.S.; Daud, W.R.W.; Rafatullah, M.; Sulaiman, O.; Hashim, R. A novel agricultural waste adsorbent for the removal of lead (II) ions from aqueous solutions. J. Hazard. Mater. 2010, 182, 377–385. [Google Scholar] [CrossRef] [PubMed]
- Wong, Y.C.; Szeto, V.S.; Cheung, W.H.; McKay, G. Adsorption of acid dyes on Chitosan-equilibrium isotherm analysis. Process Biochem. 2004, 39, 693–702. [Google Scholar] [CrossRef]
- Myers, R.H. Classical and modern regression with applications. PWSKENT 1990, 444–445, 297–298. [Google Scholar]
- Ratkowski, D.A. Handbook of Nonlinear Regression Models; Marcel Dekker: New York, NY, USA, 1990. [Google Scholar]
- Cassol, G.O.; Gallo, R.; Schwaab, M.; Barbosa-Coutinho, E.; Severo Jnr, J.B.; Pinto, J.C. Statistical evaluation of non-linear parameter estimation procedures for adsorption equilibrium models. Adsorpt. Sci. Technol. 2014, 32, 257–273. [Google Scholar] [CrossRef]
- Osmari, T.A.; Gallon, R.; Schwaab, M.; Barbosa-Coutinho, E.; Severo Jnr, J.B.; Pinto, J.C. Statistical analysis of linear and non-linear regression for the estimation of adsorption isotherm parameters. Adsorpt. Sci. Technol. 2013, 31, 433–458. [Google Scholar] [CrossRef]
- El-Khaiary, M.I. Least-squares regression of adsorption equilibrium data: Comparing options. J. Hazard. Mater. 2008, 158, 73–87. [Google Scholar] [CrossRef] [PubMed]
- Wan, S.; Ma, Z.; Xue, Y.; Ma, M.; Xu, S.; Qian, L.; Zhang, Q. Sorption of Lead (II), cadmium and Copper (II) ions from aqueous solution using tea waste. Ind. Eng. Chem. Res. 2014, 53, 3629–3635. [Google Scholar] [CrossRef]
- Guo, J.; Lua, A.C. Characterization of adsorbent prepared from oil-palm shell by CO2 activation for removal of gaseous pollutants. Mater. Lett. 2002, 55, 334–339. [Google Scholar] [CrossRef]
- AOAC. Official Methods of Analysis, 17th ed.; Horwitz, W., Ed.; Association of Official Analytical Chemist: Gaithersburg, MD, USA, 2000. [Google Scholar]
- Nomanbhay, S.M.; Palanisamy, K. Removal of Heavy Metal from industrial Wastewater using chitosan coated oil palm shell charcoal. Electron. J. Biotechnol. 2005, 8, 43–53. [Google Scholar] [CrossRef]
- Onwu, F.K.; Ogah, S.P.I. Studies on the effect of pH on the sorption of cadmium(II), nickel(II), lead(II) and chromium(VI) from aqueous solutions by African white star apple (Chrysophyllum albidium) shell. Afr. J. Biotechnol. 2010, 9, 7086–7093. [Google Scholar]
- Prola, L.D.T.; Acayanka, E.; Lima, E.C.; Umpierres, C.S.; Vaghetti, J.C.P.; Santos, W.O.; Laminsi, S.; Djifon, P.T. Comparison of Jatropha curcas shells in natural form and treated by non-thermal plasma as biosorbents for removal of Reactive Red 120 textile dye from aqueous solution. Ind. Crops Prod. 2013, 46, 328–340. [Google Scholar] [CrossRef]
- Khelaifia, F.Z.; Hazourli, S.; Nouacer, S.; Rahima, H. Valorization of raw biomaterial waste-date stones for Cr(VI) adsorption in aqueous solution: Thermodynamics, kinetics and regeneration studies. Int. Biodeterior. Biodegrad. 2016, 114, 76–86. [Google Scholar] [CrossRef]
- Setiabudi, H.D.; Jusoh, R.; Suhaimi, S.F.R.M.; Masrur, S.F. Adsorption of methylene blue onto oil palm (Elaeis guineensis) leaves: Process optimization, isotherm, kinetics and thermodynamic studies. J. Taiwan Inst. Chem. Eng. 2016, 63, 363–370. [Google Scholar] [CrossRef]
- Sing, K. The use of nitrogen adsorption for the characterisation of porous materials. A Physicochem. Eng. Asp. 2001, 187–188, 3–9. [Google Scholar] [CrossRef]
- Sing, K.S.W. Reporting Physisorption Data for Gas/Solid Systems with Special Reference to the Determination of Surface Area and Porosity. Pure Appl. Chem. 1982, 54, 2201–2218. [Google Scholar] [CrossRef]
- Mendoza-Castillo, D.I.; Reynel-Avila, H.E.; Bonilla-Petriciolet, A.; Silvestre-Albero, J. Synthesis of denim-waste-based adsorbents and their application in water defluoridation. J. Mol. Liq. 2016, 221, 469–478. [Google Scholar] [CrossRef]
- Wickramaratne, N.P.; Xu, J.; Wang, M.; Zhu, L.; Dai, L.; Mietek, J. Nitrogen enriched porous carbon spheres: Attractive materials for supercapacitor electrodes and CO2 adsorption. Chem. Mater. 2014, 26, 2820–2828. [Google Scholar] [CrossRef]
- Banerjee, S.; Gautam, R.K.; Jaiswal, A.; Chattopadhyaya, M.C.; Sharma, Y.C. Rapid scavenging of methylene blue dye form a liquid phase by adsorption on alumina nanoparticles. RSC Adv. 2015, 5, 14425–14440. [Google Scholar] [CrossRef]
- Li, T.; Shen, J.; Huang, S.; Li, N.; Ye, M. Hydrothermal carbonization synthesis of a novel montmorillonite supported carbon nanosphere adsorbent for removal of Cr (VI) form waste water. Appl. Clay Sci. 2014, 93–94, 48–55. [Google Scholar] [CrossRef]
- Tzvetkov, G.; Mihaylova, S.; Stoitchkova, K.; Tzvetkov, P.; Spassov, T. Mechanochemical and chemical activation of lignocellulosic materials to prepare activated carbons for adsorption. Powder Technol. 2016, 299, 41–50. [Google Scholar] [CrossRef]
- Lam, Y.F.; Lee, L.Y.; Chua, S.J.; Lim, S.S.; Gan, S. Insights into the equilibrium, kinetic and thermodynamics of nickel removal by environmental friendly Lansium domesticum peel adsorbent. Ecotoxicol. Environ. Saf. 2016, 127, 61–70. [Google Scholar] [CrossRef] [PubMed]
- Wahab, M.A.; Boubakri, H.; Jellai, S.; Jedial, N. Characterisation of ammonium retention processes onto cactus leaves fibres using FTIR, EDX and SEM analysis. J. Hazard. Mater. 2012, 241–242, 101–109. [Google Scholar] [CrossRef] [PubMed]
- Sardella, F.; Gimenez, M.; Navas, C.; Morandi, C.; Deiana, C.; Sapag, K. Conversion of viticultural industry wastes into activated carbon for removal of lead and cadmium. J. Environ. Chem. Eng. 2015, 3, 253–260. [Google Scholar] [CrossRef]
- Wasewar, K.L; Kumar, P.; Chand, S.; Padmini, B.N.; Teng, T.T. Adsorption of cadmium ions from aqueous solution using granular activated carbon and activated clay. Clean-Soil Air Water 2010, 38, 649–656. [Google Scholar] [CrossRef]
- Iqbal, M.; Schiewar, S.; Cameron, R. Mechanistic elucidation and evaluation of biosorption of metal ions by grapefruit peel using FTIR spectroscopy, kinetics and isotherms modeling, cations displacement and EDX analysis. J. Chem. Technol. Biotechnol. 2009, 84, 1516–1526. [Google Scholar] [CrossRef]
- Kamari, A.; Yusoff, S.N.M.; Abdullah, F.; Putra, W.P. Biosorptive removal of Cu(II), Ni(II) and Pb(II) ions from aqueous solutions using coconut dregs residue: Adsorption and characterisation studies. J. Environ. Chem. Eng. 2014, 2, 1912–1919. [Google Scholar] [CrossRef]
- Werner, K.; Pommer, L.; Brostrom, M. Thermal decomposition of hemicelluloses. J. Anal. Appl. Pyrolysis 2014, 110, 130–137. [Google Scholar] [CrossRef]
- Patwardhan, P.R.; Brown, R.C.; Shanks, B.H. Product distribution from the fast pyrolysis of hemicellulose. ChemSusChem 2011, 4, 636–643. [Google Scholar] [CrossRef] [PubMed]
- Li, H.; Dai, Q.; Ren, J.; Jian, L.; Peng, F.; Sun, R. Effect of structural characteristics of corncob hemicelluloses fractionated by graded ethanol precipitation on furfural production. Carbohydr. Polym. 2016, 136, 203–209. [Google Scholar] [CrossRef] [PubMed]
- Ali, R.M.; Hamad, A.A.; Hussein, M.M.; avnd Malash, G.F. Potential of using green adsorbent of heavy metal removal from aqueous solutions: Adsorption kinetics, isotherm, thermodynamics, mechanisms and economic analysis. Ecol. Eng. 2016, 91, 317–332. [Google Scholar] [CrossRef]
- Stefany, P.M.; Garcia, D.; Lopez, J.; Jimenez, A. Thermogravimetric Analysis of Composite obtained from sintering of Rice Husk scrap tire Mixtures. J. Therm. Anal. Calorim. 2005, 81, 315–320. [Google Scholar] [CrossRef]
- Liu, C.F.; Xu, F.; Sun, J.X.; Ren, J.L.; Curling, S.; Sun, R.C.; Fowler, P.; Baird, M.S. Physicochemical characterization of cellulose from perennial ryegrass leaves (Lolium perenne). Carbohydr. Res. 2006, 340, 2376–2391. [Google Scholar] [CrossRef] [PubMed]
- Chang, Y.M.; Tsai, W.T.; Li, M.H.; Chang, S.H. Preparation and characterization of porous carbon material from post-extracted algal residue by a thermogravimetric system. Algal Res. 2015, 9, 8–13. [Google Scholar] [CrossRef]
- Boumediene, M.; Benaissa, H.; George, B.; Molina, S.; Merlin, A. Characterization of two cellulosic waste materials (orange and almond peels) and their use for the removal of methylene blue from aqueous solutions. Maderas Cienc. Technol. 2015, 17, 69–84. [Google Scholar] [CrossRef]
- Nascimento, R.F; Sousa, F.W.; Neto, V.O.S.; Fechine, P.B.A.; Pereira Teixeira, R.N.P; Tarso, P.; Freire, C.; Araujo-Silva, M.A. Biomass Adsorbent for Removal of Toxic Metal Ions from Electroplating Industry Wastewater. Electroplating. Sebayang, D., Hasan, S.B.H., Eds.; InTech Open Science: London, UK, 2012; ISBN 978-953-51-0471-1. Available online: http://www.intechopen.com/books/electroplating/biomass-adsorbent-for-removal-of-toxic-metal-ions-from-electroplating-industry-wastewater (accessed on 9 December 2015).
- Wang, K.; Jiang, J.X.; Xu, F.; Sun, R.C. Influence of streaming pressure on steam explosion pre-treatment of Lespedeza stalks (Lespedeza crytobotrya): Part 1. Characteristics of degraded cellulose. Polym. Degrad. Stab. 2009, 94, 1379–1388. [Google Scholar] [CrossRef]
- Terinte, N.; Ibbett, R.; Schuster, C. Overview of native cellulose and microcrystalline cellulose I structure studied by X-ray diffraction (WAXD): Comparison between measurement techniques. Lenzinger Berichte 2011, 89, 118–131. [Google Scholar]
- Xiao, L.P.; Zhao, J.S.; Shi, Z.J.; Xu, F.; Sun, R.C. Impact of hot compressed water pre-treatment on the structural changes of woody biomass for bioethanol production. BioResources 2011, 6, 1576–1598. [Google Scholar]
- Segal, L.; Creely, L.; Martin, A.E.; Conrad, C.M. An empirical method for estimating the degree of crystallinity of native cellulose using X-ray diffractometer. Text. Res. J. 1959, 29, 786–794. [Google Scholar] [CrossRef]
- Wassie, A.B.; Srivastava, V.C. Teff straw characterization and utilization for chromium removal from wastewater: Kinetics, isotherm and thermodynamic modelling. J. Environ. Chem. Eng. 2016, 4, 1117–1125. [Google Scholar] [CrossRef]
- Ahmadzadeh, A.; Zakaria, S. Preparation of Novolak resin by liquefaction of oil palm empty fruit bunches (EFB) and characterisation of the EFB residue. Polym.-Plast. Technol. Eng. 2009, 48, 10–16. [Google Scholar] [CrossRef]
- Paduraru, C.; Tofan, L.; Teodosiu, C.; Bunia, I.; Tudorachi, N.; Toma, O. Biosorption of Zinc(II) on rapeseed waste: Equilibrium studies and thermogravimetric investigations. Process Saf. Environ. Prot. 2015, 94, 18–25. [Google Scholar] [CrossRef]
- Lim, L.; Priyantha, N.; Tennakoon, D.; Chieng, H.; Dahri, M.; Suklueng, M. Breadnut peel as a highly effective low-cost biosorbent for methylene blue: Equilibrium, thermodynamic and kinetic studies. Arab. J. Chem. 2017. [Google Scholar] [CrossRef]
- Zhou, Y.; Hu, X.; Xinhai, Q.J.; Wang, X.; Ma, T. Adsorption of Cd(II) from aqueous solutions by cellulose modified with maleic anhydride and thiourea. Adsorpt. Sci. Technol. 2013, 31, 583–598. [Google Scholar] [CrossRef]
- Simonescu, M.C. Application of FTIR Spectroscopy in Environmental Studies. In Advanced Aspects of Spectroscopy; Farrukh, A.M., Ed.; Intech Publishers: New York, NY, USA, 2012; pp. 49–84. [Google Scholar]
- Markovic, J.P.; Radovic, J.B.; Strbanovic, R.T.; Bajic, D.S.; Vrvic, M.M. Changes in the infra red attenuated total reflectance (ATR) spectra of lignins from alfalfa stem with growth and development. J. Serb. Chem. Soc. 2009, 74, 885–892. [Google Scholar] [CrossRef]
- Run, C.S.; Jeremy, T.; Gwynn, L.J. Fractional characterization of ash AQ lignin by successive extraction with organic solvents from oil palm EFB fibre. Polym. Degrad. Stab. 2000, 68, 111–119. [Google Scholar]
- Lewin, M. Wood Structure and Composition; Marcel Dekker Inc.: New York, NY, USA, 1991; pp. 49–139. [Google Scholar]
- Tarley, T.C.R.; Arruda, M.A.Z. Biosorption of heavy metals using rice milling by-product-Characterisation and application for removal of metal from aqueous effluents. Chemosphere 2004, 54, 987–995. [Google Scholar] [CrossRef] [PubMed]
- Moyo, M.; Chirinda, A.A.; Nharingo, T. Removal of copper from aqueous solution using chemically treated potato (Solanum tuberosum) leaf powder. Clean Soil Air Water 2016, 43, 1–8. [Google Scholar] [CrossRef]
- Sahu, J.N.; Acharya, J.; Meikap, B.C. Optimization of production conditions for Activated carbons from Tamarind wood by Zinc Chloride using Response Surface Methodology. Bioresour. Technol. 2010, 101, 1974–1982. [Google Scholar] [CrossRef] [PubMed]
- Yang, H.; Yan, R.; Chen, H.; Lee, D.H.; Zheng, C. Characteristics of hemicellulose, cellulose and lignin pyrolysis. Fuel 2007, 86, 1781–1788. [Google Scholar] [CrossRef]
- Yu, X.; Tong, S.; Ge, M.; Wu, L.; Zuo, J.; Cao, C.; Song, W. Adsorption of heavy metal ions from aqueous solution by carboxylated cellulose nanocrystals. J. Environ. Sci. 2013, 25, 933–943. [Google Scholar] [CrossRef]
- Oh, S.Y.; Yoo, D.I.; Shin, Y.; Kim, H.C.; Kim, H.Y.; Chung, Y.S.; Park, W.H.; Youk, J.H. Crystalline structure analysis of cellulose treated with sodium hydroxide and carbondioxide by means of X-ray diffraction and FTIR spectroscopy. Carbohydr. Res. 2005, 340, 2376–2391. [Google Scholar] [CrossRef] [PubMed]
- Liang, L.S.; Ibrahim, M.N.M. Preparation of lignin graft copolymer as a fluid loss additive for water based mud. J. Eng. Sci. 2013, 9, 39–49. [Google Scholar]
- Wang, G.; Zhang, S.; Yao, P.; Chen, Y.; Xu, X.; Li, T.; Gong, G. Removal of Pb(II) from aqueous solutions by Phytolacca americana L. biomass as a low cost biosorbent. Arab. J. Chem. 2015. [Google Scholar] [CrossRef]
- Zhang, J.; Zhai, S.; Li, S.; Xiao, Z.; Song, Y.; An, Q.; Tian, D. Pb(II) removal of Fe3O4@SiO2-NH2 core shell nanomaterials prepared via a controllable sol-gel process. Chem. Eng. J. 2013, 215–216, 461–471. [Google Scholar] [CrossRef]
- Antunes, W.M.; Luna, A.S.; Henriques, C.A.; Costa, A.C.A. An Evaluation of Copper Biosorption by a Brown Seaweed under Optimized Conditions. Electron. J. Biotechnol. 2003, 6, 174–184. Available online: http://www.ejbiotechnology.info/index.php/ejbiotechnology/article/view/v6n3–5/599 (accessed on 6 October 2016).
- Teker, M.; Imamoglu, M.; Saltasbas, O. Adsorption of copper and cadmium ions by activated carbon from rice hulls. Turk. J. Chem. 1999, 23, 185–191. [Google Scholar]
- Kikuchi, Y.; Qian, Q.; Machida, M.; Tatsumoto, H. Effect of ZnO loading to activated carbon on Pb(II) adsorption from aqueous solution. Carbon 2006, 44, 195–202. [Google Scholar] [CrossRef]
- Akpomie, K.G.; Dawodu, F.A.; Kayode, O.; Adebowale, K.O. Mechanism on the sorption of heavy metals from binary-solution by a low cost montmorillonite and its desorption potential. Alex. Eng. J. 2015, 54, 757–767. [Google Scholar] [CrossRef]
- Hu, H.; Jiang, B.; Zhang, J.; Chen, X. Adsorption of perrhenate ion by bio-char produced from Acidosasa edulis shoot shell in aqueous solution. RSC Adv. 2015, 5, 104769–104778. [Google Scholar] [CrossRef]
- Dalali, N.; Hagghi, A. Removal of cadmium from aqueous solution by walnut green husk as a low cost adsorbent. Desalin. Water Treat. 2016, 57, 13782–13794. [Google Scholar] [CrossRef]
- Pehlivan, E.; Yanik, B.H.; Ahmeti, G.; Pehlivan, M. Equilibrium isotherm studies for the uptake of cadmium and lead ions onto sugar beet pulp. Bioresour. Technol. 2008, 99, 3520–3527. [Google Scholar] [CrossRef] [PubMed]
- Feizi, M.; Jalali, M. Removal of heavy metals from aqueous solutions using sunflower, potato, canola and walnut shell residues. J. Taiwan Inst. Chem. Eng. 2015, 54, 125–136. [Google Scholar] [CrossRef]
- Shahidi, A.; Jalilnejad, N.; Jalilnejad, E. A study on adsorption of cadmium(II) ions from aqueous solution using Luffa cylindica. Desalin. Water Treat. 2015, 53, 3570–3579. [Google Scholar] [CrossRef]
- Barkar, N.; Abdennouri, M.; El Makhfouk, M.; Qourzal, S. Biosorption characteristics of cadmium and lead onto eco-friendly dried cactus (opuntia ficus indica) cladodes. J. Environ. Chem. Eng. 2013, 1, 144–149. [Google Scholar] [CrossRef]
- Krishnan, K.A.; Anirudhan, T.S. Removal of cadmium (II) from aqueous solution by steam-activated sulphurised carbon prepared from sugar-cane bagasse pith: Kinetics and equilibrium studies. Water SA 2003, 29, 147–156. [Google Scholar] [CrossRef]
- Ho, Y.S.; Huang, C.T.; Huang, H.W. Agricultural by-product as a metal sorbent: Sorption of copper ions from aqueous solution onto tree fern. Process Biochem. 2002, 37, 1421–1430. [Google Scholar] [CrossRef]
- Augustine, A.A.; Orike, B.D.; Edidiong, A.D. Adsorption kinetics and modelling of Cu(II) ion sorption from aqueous solution by mercaptoacetic acid modified cassava (manihot sculenta cranz) wastes. Electron. J. Environ. Agric. Food Chem. 2007, 6, 2221–2234. [Google Scholar]
- Guo, H.; Zhang, S.; Kou, Z.; Zhai, S.; Ma, W.; Yang, Y. Removal of cadmium(II) from aqueous solutions by chemically modified maize straw. Carbohydr. Polym. 2015, 115, 177–185. [Google Scholar] [CrossRef] [PubMed]
- Qiu, H.; Lu, L.V.; Pan, B.; Zhang, Q.; Zhang, W.; Zhang, Q. Critical Review in Adsorption Kinetic Models. J. Zhejiang Univ. Sci. A 2009, 10, 716–724. [Google Scholar] [CrossRef]
- Ding, Y.; Jing, D.; Gong, H.; Zhou, L.; Yang, X. Biosorption of aquatic cadmium (II) by unmodified rice straw. Bioresour. Technol. 2012, 114, 20–25. [Google Scholar] [CrossRef] [PubMed]
- Ebrahimi, A.; Ehteshami, M.; Dahrazma, B. Isotherm and Kinetic studies for the biosorption of cadmium from aqueous solution by Alhaji maurorum seed. Process Saf. Environ. Prot. 2015, 98, 374–382. [Google Scholar] [CrossRef]
- Iqbal, M.; Saeed, A.; Zafar, S.I. FTIR spectrometry, kinetics and adsorption isotherm modelling, ion exchange and EDX analysis for understanding the mechanism of Cd2+ and Pb2+ removal by mango peels. J. Hazard. Mater. 2009, 164, 161–171. [Google Scholar] [CrossRef] [PubMed]
- Azizian, S. Kinetic models of sorption: A theoretical analysis. J. Colloid Interface Sci. 2004, 276, 47–52. [Google Scholar] [CrossRef] [PubMed]
- Liu, Y.; Liu, Y. Biosorption isotherms, kinetics and thermodynamics. Sep. Purif. Technol. 2008, 61, 229–242. [Google Scholar] [CrossRef]
- Basha, S.; Murthy, Z.V.P. Kinetic and equilibrium models for biosorption of Cr(VI) on chemically modified seaweed, Cystoseira indica. Process Biochem. 2007, 42, 1521–1529. [Google Scholar] [CrossRef]
- Alberti, G.; Amendola, V.; Pesavento, M.; Biesuz, R. Beyond the synthesis of novel solid phases: Review on modelling of sorption phenomena. Coord. Chem. Rev. 2012, 256, 28–45. [Google Scholar] [CrossRef]
- Giles, C.H.; Smith, D.; Huitson, A. A General Treatment and Classification of the Solute Adsorption Isotherm I. Theoretical. J. Colloid Interface Sci. 1974, 47, 755–765. [Google Scholar] [CrossRef]
- Giles, C.H.; D’Silva, A.P.; Easton, I.A. A General Treatment and Classification of the Solute Adsorption Isotherm Part II. Experimental Interpretation. J. Colloid Interface Sci. 1974, 47, 766–778. [Google Scholar] [CrossRef]
- Vadivelan, V.; Kumar, V.K. Equilibrium, kinetics, mechanism and process design for the sorption of methylene blue onto rice husk. J. Colloid Interface Sci. 2005, 286, 90–100. [Google Scholar] [CrossRef] [PubMed]
- Gupta, V.K.; Nayak, A. Cadmium removal and recovery from aqueous solutions by novel adsorbents prepared from orange peel and Fe2O3 nanoparticles. Chem. Eng. J. 2012, 180, 81–90. [Google Scholar] [CrossRef]
- Min, S.H.; Han, J.S.; Shin, E.W.; Park, J.K. Improvement of cadmium ion removal by base treatment of Juniper fiber. Water Res. 2004, 38, 1289–1295. [Google Scholar] [CrossRef] [PubMed]
- Izanloo, H.; Nasseri, S. Cadmium removal from aqueous solutions by ground pine cone. Iran. J. Environ. Health Sci. Eng. 2005, 2, 33–42. [Google Scholar]
- Mahvi, A.H.; Nouri, J.; Omrani, G.A.; Gholami, F. Application of Platanus orientalis leaves in removal of cadmium from aqueous solution. World Appl. Sci. J. 2007, 2, 40–44. [Google Scholar]
- Ammari, T.G. Utilization of a natural ecosystem bio-waste: Leaves of Arundo donax reed as a raw material of low-cost eco-biosorbent for cadmium removal from aqueous phase. Ecol. Eng. 2014, 71, 466–473. [Google Scholar] [CrossRef]
- Ghodbane, I.; Nouri, L.; Hamdaoui, O.; Chiha, M. Kinetic and equilibrium study for the sorption of cadmium (II) ions from aqueous phase by eucalyptus bark. J. Hazard. Mater. 2008, 152, 148–158. [Google Scholar] [CrossRef] [PubMed]
- Fiol, N.; Villaescusa, I.; Martinez, M.; Miralles, N.; Poch, J.; Serarols, J. Sorption of Pb(II), Ni(II), Cu(II) and Cd(II) from aqueous solution by olive stone waste. Sep. Purif. Technol. 2006, 50, 132–140. [Google Scholar] [CrossRef]
- Al-Qahtani, K.M. Water purification using different waste fruit cortexes for the removal of heavy metals. J. Taibah Univ. Sci. 2016. [Google Scholar] [CrossRef]
- Tounsadi, H.; Khalidi, A.; Abdennouri, M.; Barka, N. Biosorption potential of Diplotaxis harra and Glebionis coronaria L. biomasses for the removal of Cd(II) and Co(II) from aqueous solutions. J. Environ. Chem. Eng. 2015, 3, 822–830. [Google Scholar] [CrossRef]
- Ho, Y.S.; Ofomaja, A.E. Biosorption thermodynamics of Cadmium on coconut copra meal as biosorbent. Biochem. Eng. J. 2006, 30, 117–123. [Google Scholar] [CrossRef]
- Taty-Costodes, V.C.; Fauduet, H.; Porte, C.; Delacroix, A. Removal of Cd(II) and Pb(II) ions, from aqueous solutions, by adsorption onto sawdust of Pinus sylvestris. J. Hazard. Mater. 2003, 105, 121–142. [Google Scholar] [CrossRef] [PubMed]
- Saeed, A.; Akhter, M.W.; Iqbal, M. Removal and recovery of heavy metals from aqueous solution using papaya wood as a new biosorbent. Sep. Purif. Technol. 2005, 45, 25–31. [Google Scholar] [CrossRef]
- Doyurum, S.; Celik, A. Pb(II) and Cd(II) removal from aqueous solutions by olive cake. J. Hazard. Mater. 2006, B138, 22–28. [Google Scholar] [CrossRef] [PubMed]
- Chakravarty, P.; Sarma, N.S.; Sarma, H.P. Biosorption of cadmium(II) from aqueous solution using heartwood powder of Areca catechu. Chem. Eng. J. 2010, 162, 949–955. [Google Scholar] [CrossRef]
- Vazquez, G.; Freire, S.M.; Gonzalez-Alvarez, J.; Antorrena, G. Equilibrium and kinetic modelling of the adsorption of Cd2+ ions onto chestnut shell. Desalination 2009, 249, 855–860. [Google Scholar] [CrossRef]
- Vashantha, R.; Samuel, J.; Banu, N.A. Adsorption of Cadmium(II) Ions from Simulated Wastewater Using Raw Luffa Husk: Kinetics, Isotherm and Thermodynamic Studies. Int. J. Innov. Res. Sci. Eng. Technol. 2016, 5, 7846–7857. [Google Scholar]
- Dupont, E.; Guillon, E. Removal of hexavalent chromium with a lignocellulosic substrate extracted from wheat bran. Environ. Sci. Technol. 2003, 37, 4235–4241. [Google Scholar] [CrossRef] [PubMed]
- El-Kamash, A.M.; Zaki, A.A.; Abed-El-Geleel, M. Modelling batch kinetics and thermodynamics of Zinc and cadmium removal from waste solutions using synthetic zeolite. J. Hazard. Mater. 2005, 127, 211–220. [Google Scholar] [CrossRef] [PubMed]
- Panda, G.C.; Das, S.K.; Chatterjee, S.; Maity, P.B.; Bandopadhyay, T.S.; Guha, A.K. Adsorption of cadmium on husk of Lathyrus sativus: Physico-chemical study. Colloid Surf. B Biointerfaces 2006, 50, 49–54. [Google Scholar] [CrossRef] [PubMed]
- Vaghetti, J.C.P.; Lima, E.C.; Royer, B.; Cunha, B.M.C.; Cardoso, N.F. Pecan nutshell as biosorbent to remove Cu (II), Mn (II), and Pb (II) from aqueous solutions. J. Hazard. Mater. 2009, 162, 270–280. [Google Scholar] [CrossRef] [PubMed]


© 2018 by the authors. Licensee MDPI, Basel, Switzerland. This article is an open access article distributed under the terms and conditions of the Creative Commons Attribution (CC BY) license (http://creativecommons.org/licenses/by/4.0/).