Cd(II) ion sorption was carried out and some parameters used for adsorption were obtained from the YTBS characterization that has been discussed. Based on the zeta potential and pHpzc characterization of the YTBS adsorbent, the pH of 6.5 was chosen for Cd(II) ion sorption studies. The effect of a number of parameters on the sorption of Cd(II) ion by the YTBS adsorbent were studied. These were adsorbate pH, contact time and adsorbent dose. Equilibrium sorption of Cd(II) ion was also evaluated to determine the uptake capacity of the YTBS adsorbent. The determination of Cd(II) ion loading on the YTBS adsorbent was based on Equation (1).
4.2.1. Effect of Adsorbate pH
The effect of adsorbate pH on the sorption Cd(II) ions was also studied in this work. The adsorbate pH is a crucial parameter in sorption as it influences the speciation of ions in the adsorbate by determining both the nature of the species and the charge on the adsorbent surface and hence the probability of adsorption [
121,
122,
123]. The effect of pH on Cd(II) ion sorption by the YTBS adsorbent is presented in
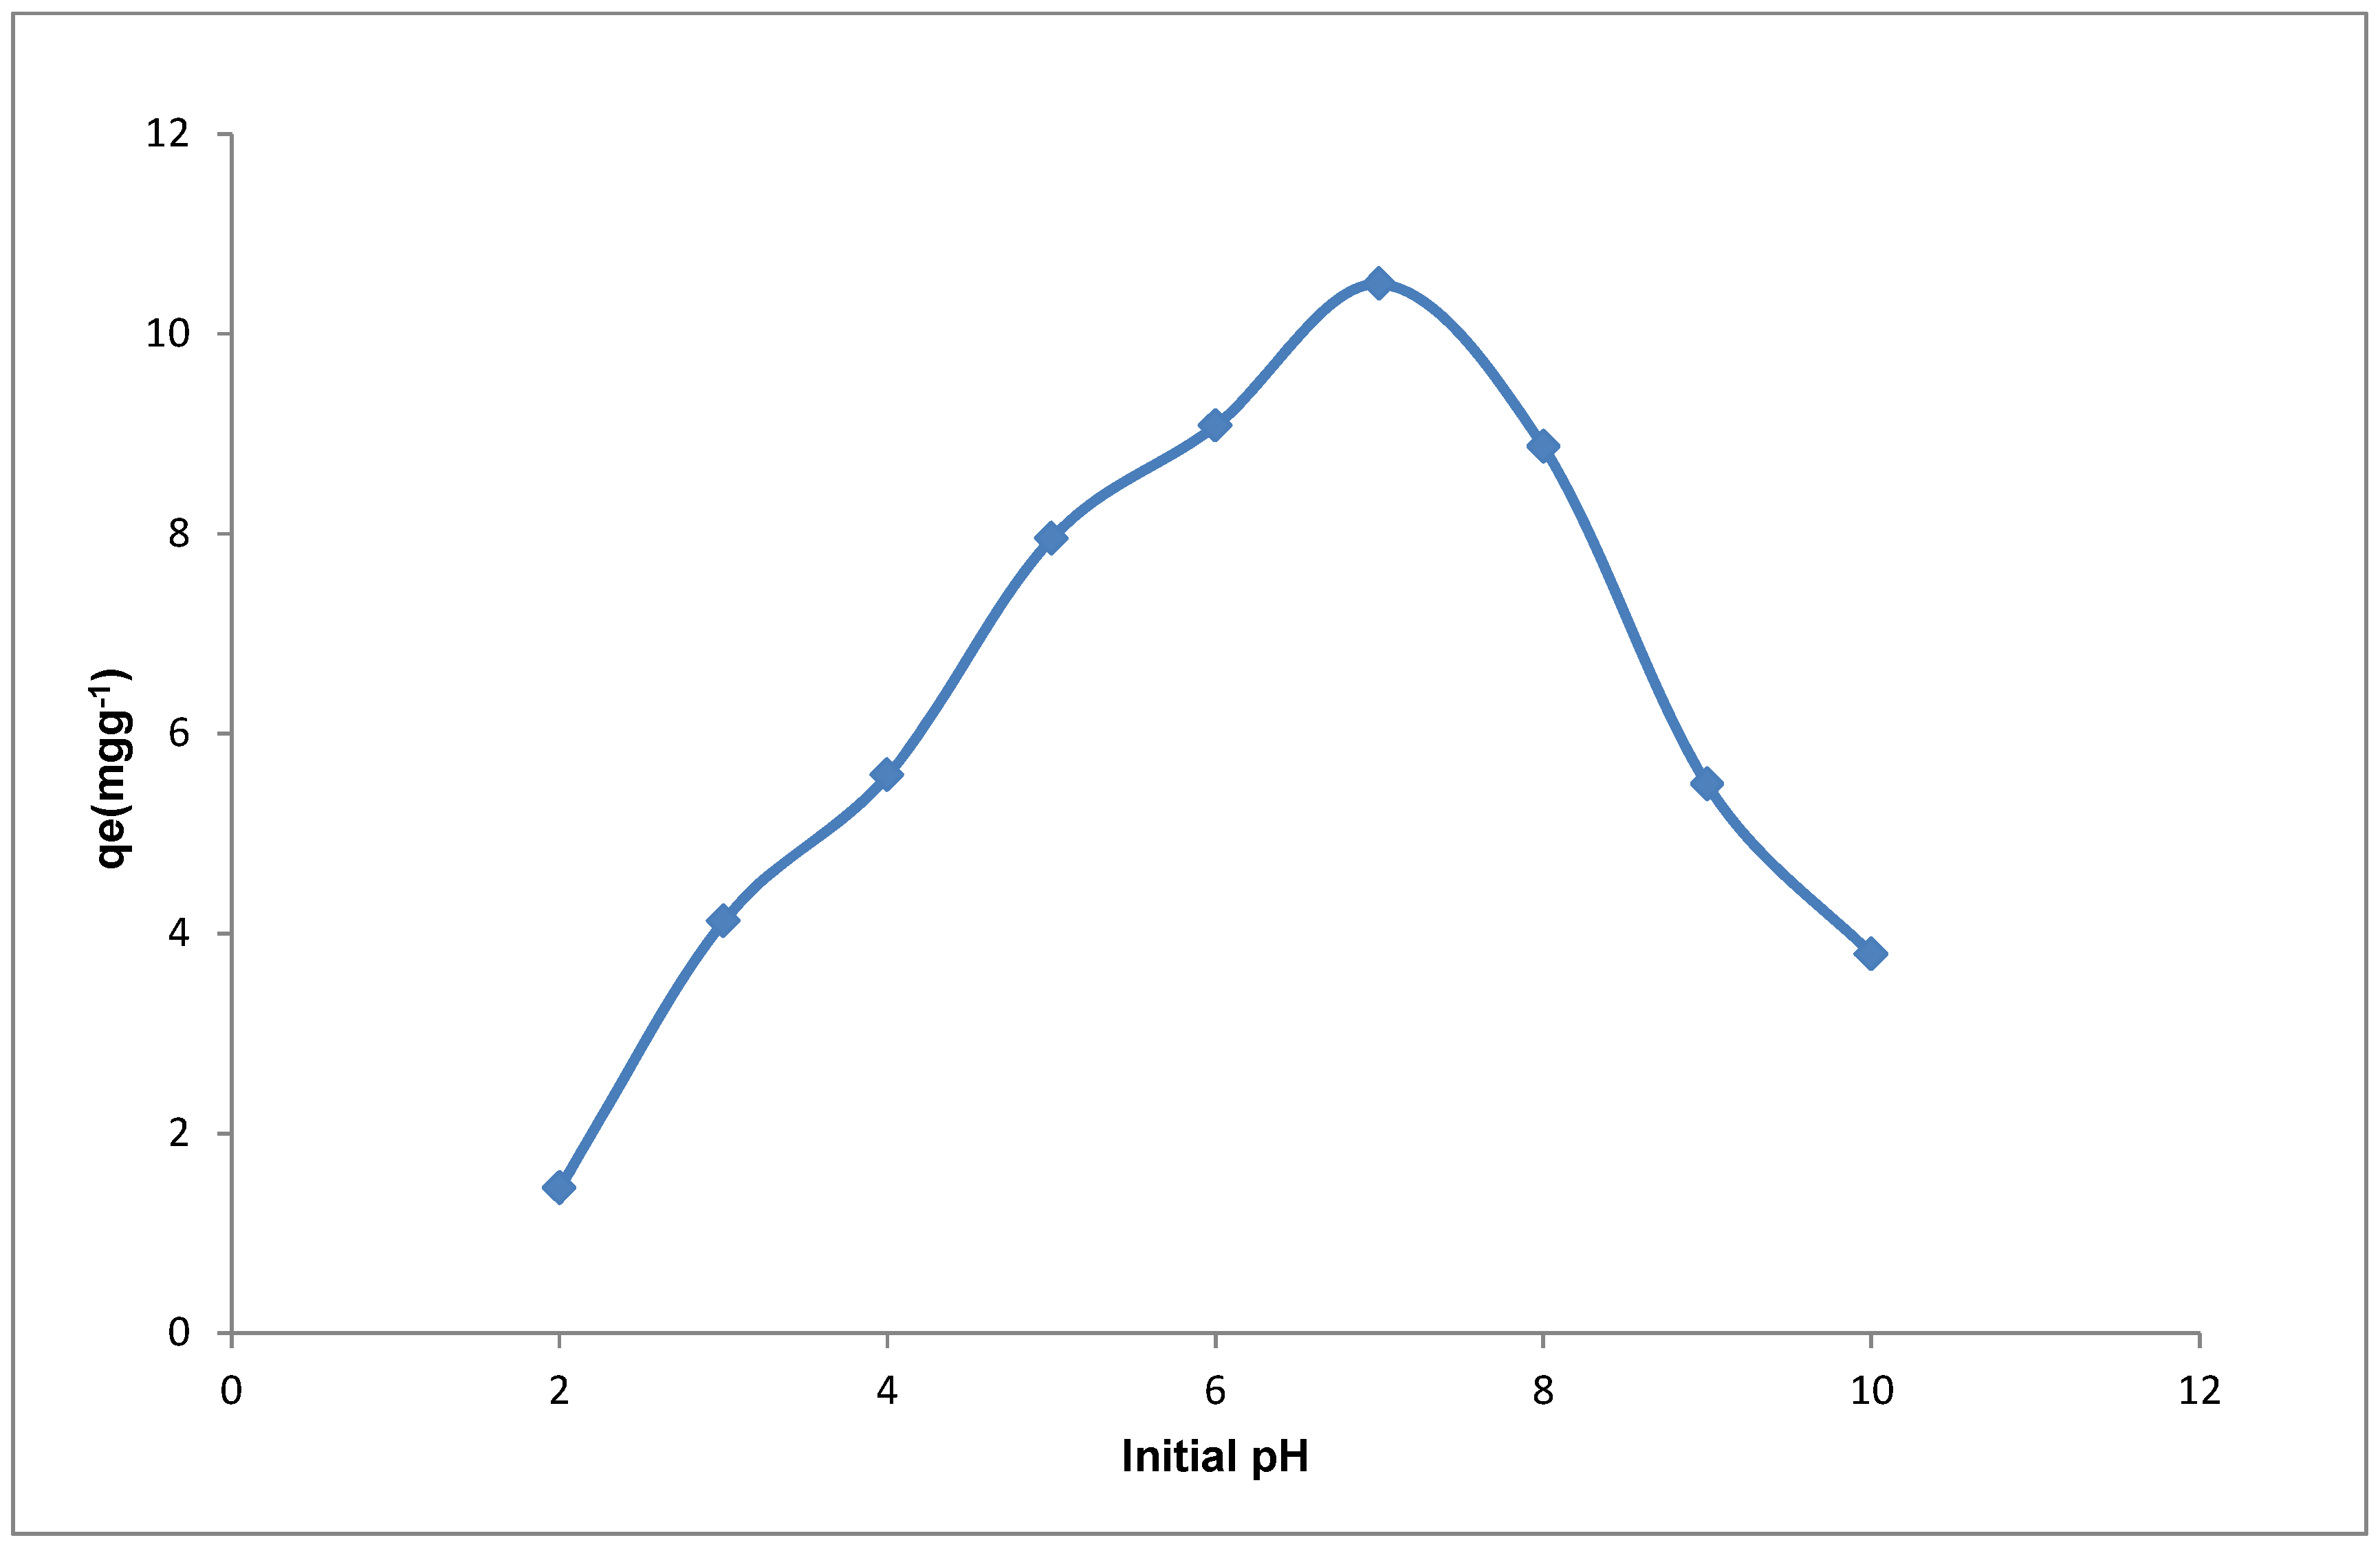
Figure 9. From
Figure 9, it can be observed that the amount of Cd(II) ions adsorbed was initially low between the pH 2–4. The low loading observed for Cd(II) at pH 2 is presumed to be associated with the influence of protons in solution at the low pH which leads to the protonation of the adsorbent surface (positively charged). Protonation of the adsorbent surface causes repulsion of the positive Cd(II) ions thereby leading to the reduction in the binding ability of the adsorbent for the metal ion. As the adsorbate pH increases, there is a gradual increase in the uptake of the Cd(II) ions due to the increase in the amount of negatively charged ions that exist on the adsorbent surface. This increase leads to the highest loading at pH 7.0 for Cd(II), and subsequently there is a decrease in uptake as the pH increased from 8–10. The increased sorption of Cd(II) ions at pH 5–7 may be due to the interaction of the species that are dominant at pH < 8, such as Cd
2+ and Cd(OH)
+ with the functional groups on the YTBS adsorbent surface [
124]. Since these species are positively charged, there is more likelihood of interactions with the anions on the adsorbent surface leading to increase in uptake especially beyond the pHpzc (6.4) when the surface of the adsorbent is negatively charged. This is evident in
Figure 9 where the highest loading is observed at pH 7 above the pHpzc, thereby confirming that at this pH the proportion of active sites for sorption of the positive Cd(II) ions are greatest. The increase in the species on the YTBS adsorbent that can interact with the Cd(II) ions as the pH enters the alkaline region improves the probability of metal ion removal. Thus due to the multiple-ion-binding sites on the adsorbent surfaces and the variety of metal ion species {Cd(OH)
+ and Cd
2+} in the adsorbate, a number of metal adsorbent complexes are formed during sorption process. This can be represented according to Equation (18) [
19,
125,
126]:
where
M = metal;
A −
XH (Adsorbent surface); [
X = S, O, COO, NH];
M(
A −
X)
n—metal adsorbent complex and
H+—Displaced proton.
Hence, the sorption of Cd(II) by the YTBS adsorbent may occur by ion exchange where the metal ion displaces the proton (
H+) from the adsorption site and becomes attached to the adsorbent forming an adsorbent metal complex. This mechanism may account for the decrease in the pH of the adsorbate after sorption between the pH 6–8 where there was substantial Cd(II) sorption which reduces as the pH further increases up till pH 10 as shown in
Table 4 and
Figure 9. The reduction in the uptake of Cd(II) ions from pH 8–10 indicates the effect of precipitation of the metal hydroxides species such as-Cd(OH)
2 thereby leading to low amounts of the metal ion adsorbed by the YTBS adsorbent. This effect has also been reported by Dalali and Hagghi [
127] in their study on the removal of cadmium from aqueous solution using walnut green husk. Pehlivan et al. [
128] has also observed the decrease in sorption of Cd(II) by sugar beet pulp adsorbent with increasing pH and in their study, this was also attributed to the effect of hydrolysis accompanying precipitation of metal hydroxides.
However, it should be noted that ion-exchange is not the only mechanism of sorption that might occur between the Cd(II) ions and the active sites/functional groups on the YTBS adsorbent surface. According to Sari et al. [
34], metal ion removal by sorbents often involves complex mechanism such as ion exchange, chelation, adsorption by physical forces, ion entrapment in the intrafibrillar capillaries and spaces of the adsorbents and since the adsorbent surface is composed of functional groups such as carbonyl, hydroxyl, and amine these group will be involved in all potential metal ion binding mechanism. The maximum sorption of Cd(II) ion has also been reported in a number of previous studies. Feizi and Jalali [
129] in their study on the removal of some heavy metal from aqueous solution using sunflower, potato, canola and walnut shell residues observed that the maximum uptake of Cd(II) by these residues were observed at pH 7, 6, 6, and 7 for sunflower, potato, canola, and walnut shell residues, respectively.
4.2.2. Effect of Adsorbent Dose
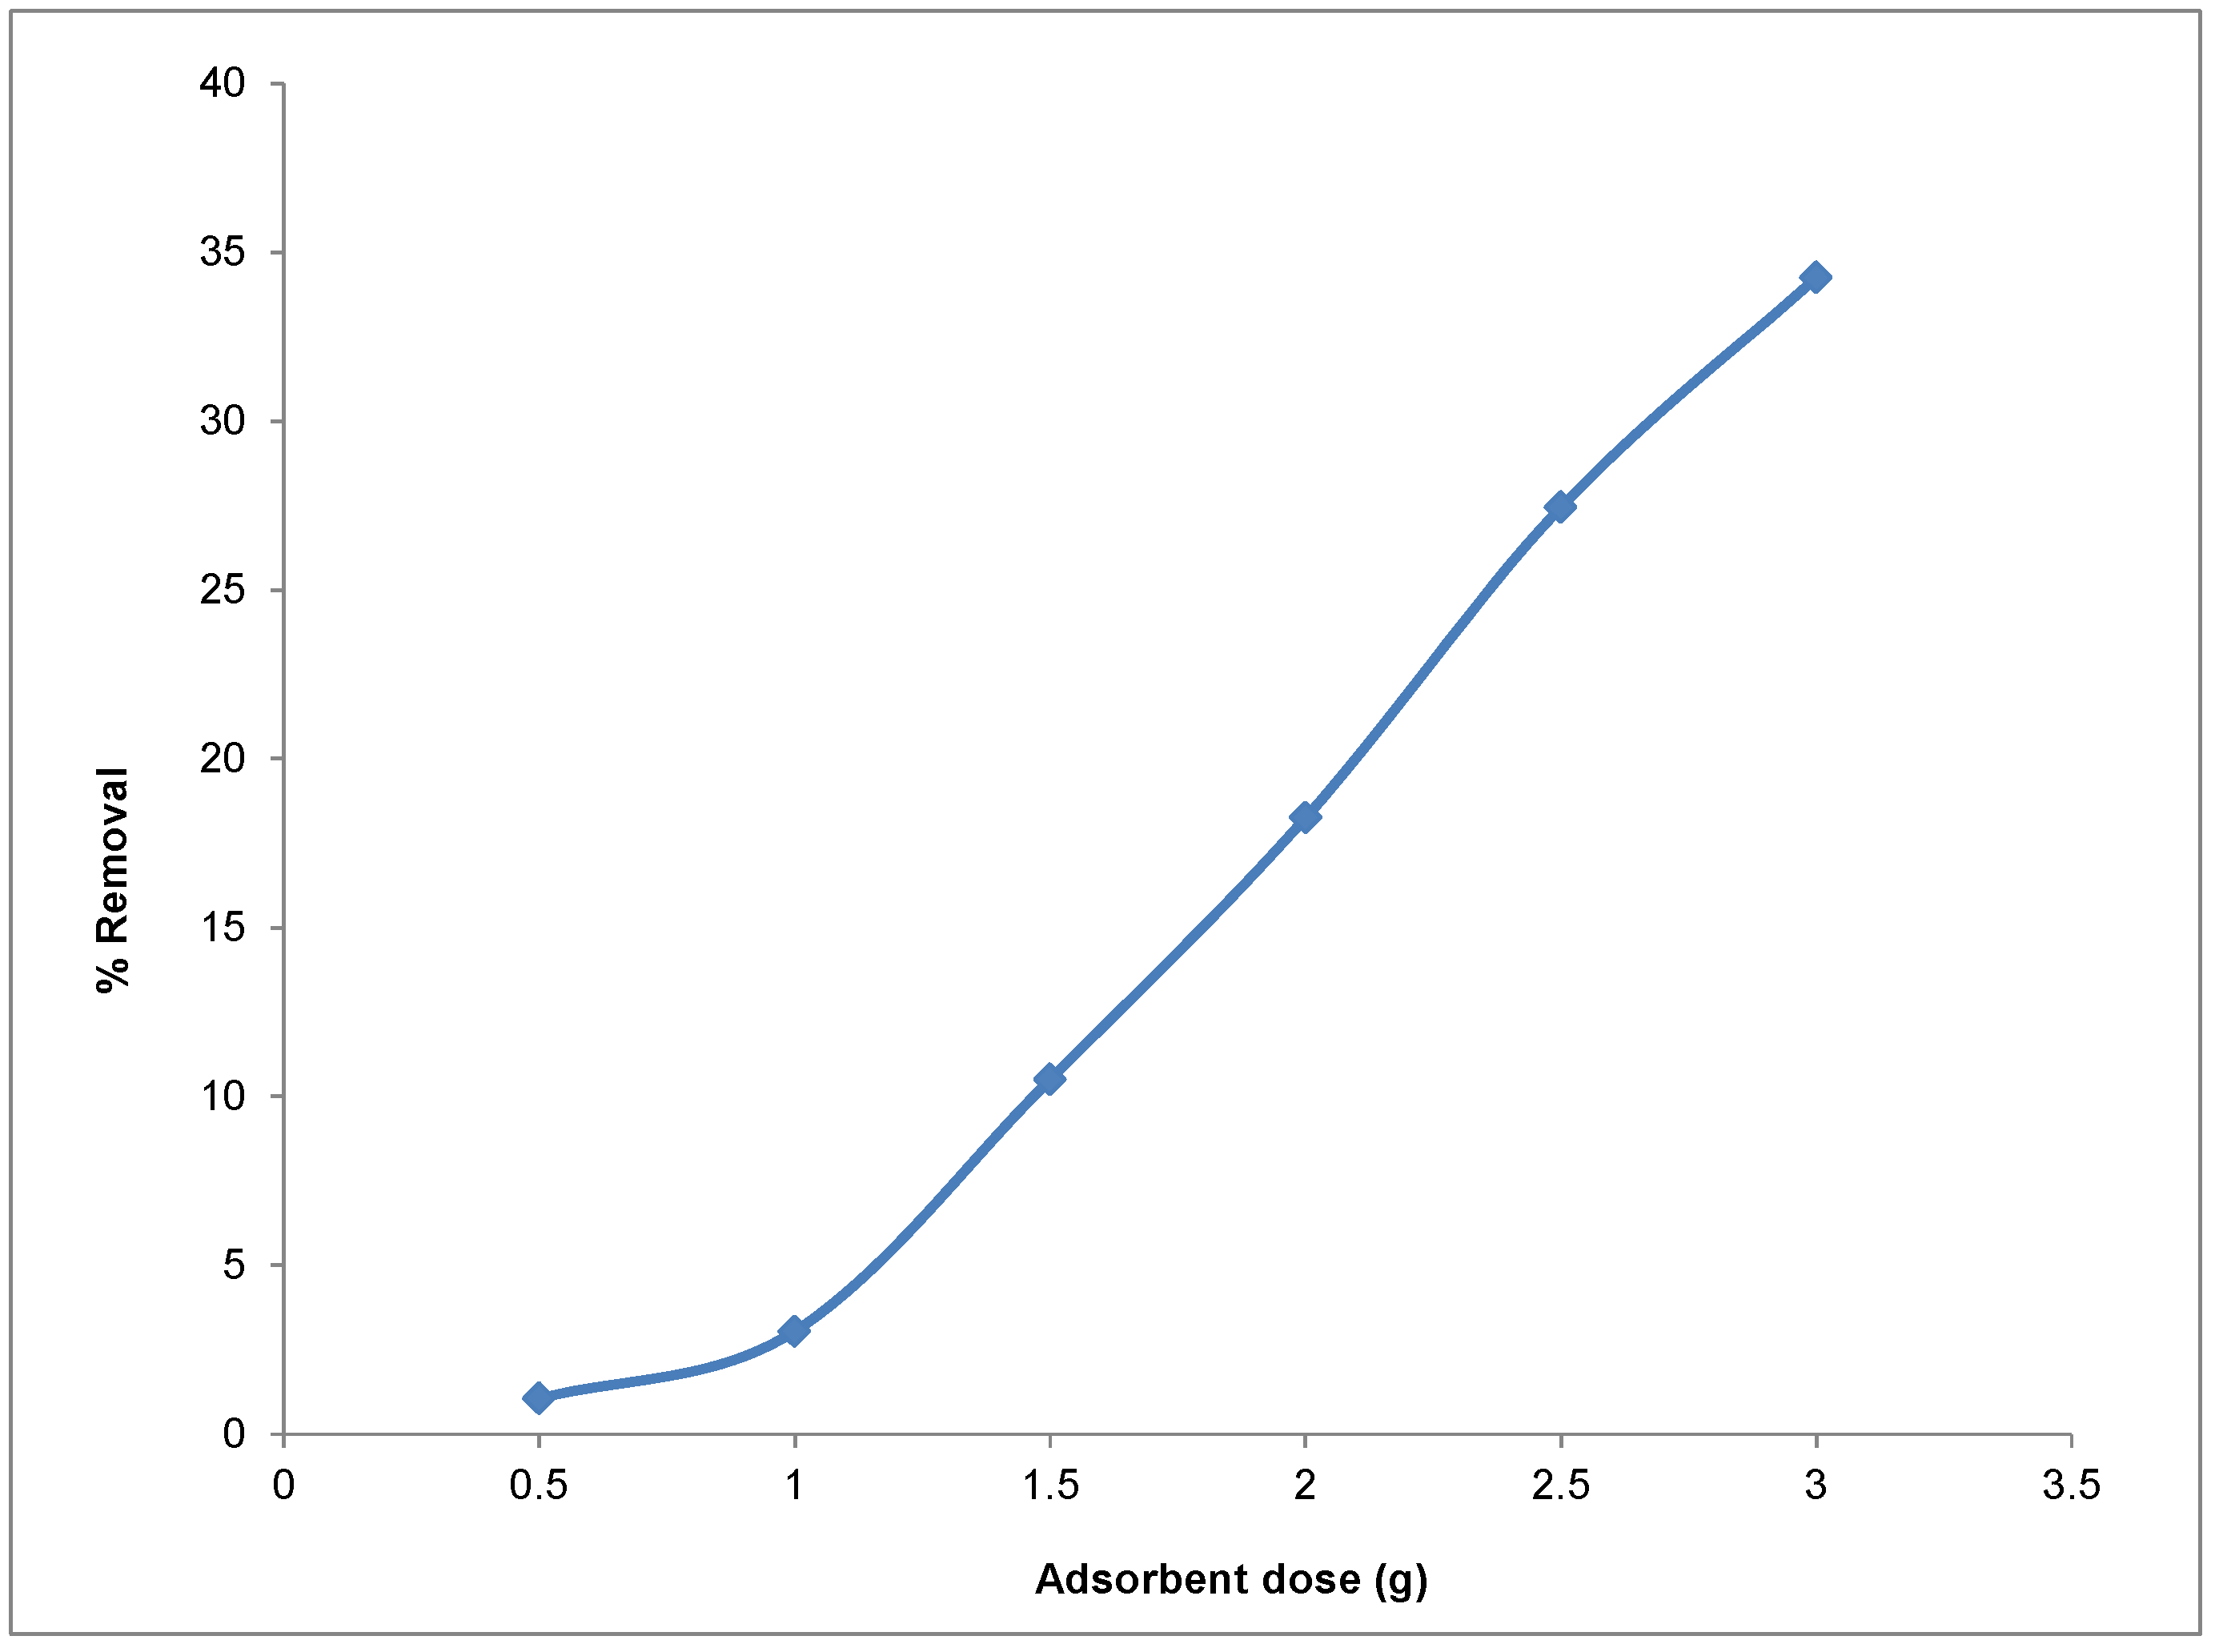
The amount of an adsorbent used for sorption is an important parameter as it gives information on the effectiveness of the adsorbent. The dependency of Cd(II) ion sorption on the YTBS adsorbent dosage was studied at pH 6.5, with initial metal ion concentration of 500 mg∙L
−1, a temperature of 25 °C, and a reaction volume of 0.1 L. The amounts of adsorbent used were 0.5, 1.0, 1.5, 2.0, 2.5, and 3.0 g. The effect of adsorbent quantity on the efficiency of uptake of Cd(II) ions from the adsorbate is shown in
Figure 10. From
Figure 10, it is observed that the increase in adsorbent dosage from 0.5 to 3.0 g resulted in an increase of about 30% in the adsorption of Cd(II) ions. This trend in uptake is attributed to the increasing number of active sites and surface area for Cd(II) binding on the adsorbent as the weight of the adsorbent increases from 0.53 g due to the availability of larger surface area and more adsorption sites.
This observation of the effect of adsorbent dose has also been reported by Shahidi et al. [
130] in their study on the adsorption of cadmium ions from aqueous solution using
Luffa cylindrica adsorbent. There was an increase in the percentage removal from 48-94% when the adsorbent dosage was increased from 2.1 to 8.4 g∙L
−1. Barka et al. [
131] has also reported a similar finding in their study of Cd(II) ion sorption onto dried cactus (
opuntia ficus indica) cladodes. In their observation, there was an enhancement of metal ion loading from 10% to 36% when the biosorbent dosage was increased from 0.5 to 4.0 g∙L
−1.
4.2.3. Sorption Kinetics
The kinetics of metal ion sorption provides information on the description of an adsorption process as the kinetics governs the rate which in turn determines the residence time of sorption, thus making it an essential characteristic that is used to define the efficiency of an adsorbent system [
132]. Since, the rate at which sorption takes place provides analysis data that is useful for the design batch sorption systems, it is therefore pertinent to establish the time dependency of such systems for various pollutant removal processes [
133]. The sorption kinetics also provides information on the minimum time required for considerable adsorption to take place and the can be used to predict the possible diffusion control mechanism between the metal ions as it migrates from the adsorbate towards the adsorbent surface [
134].
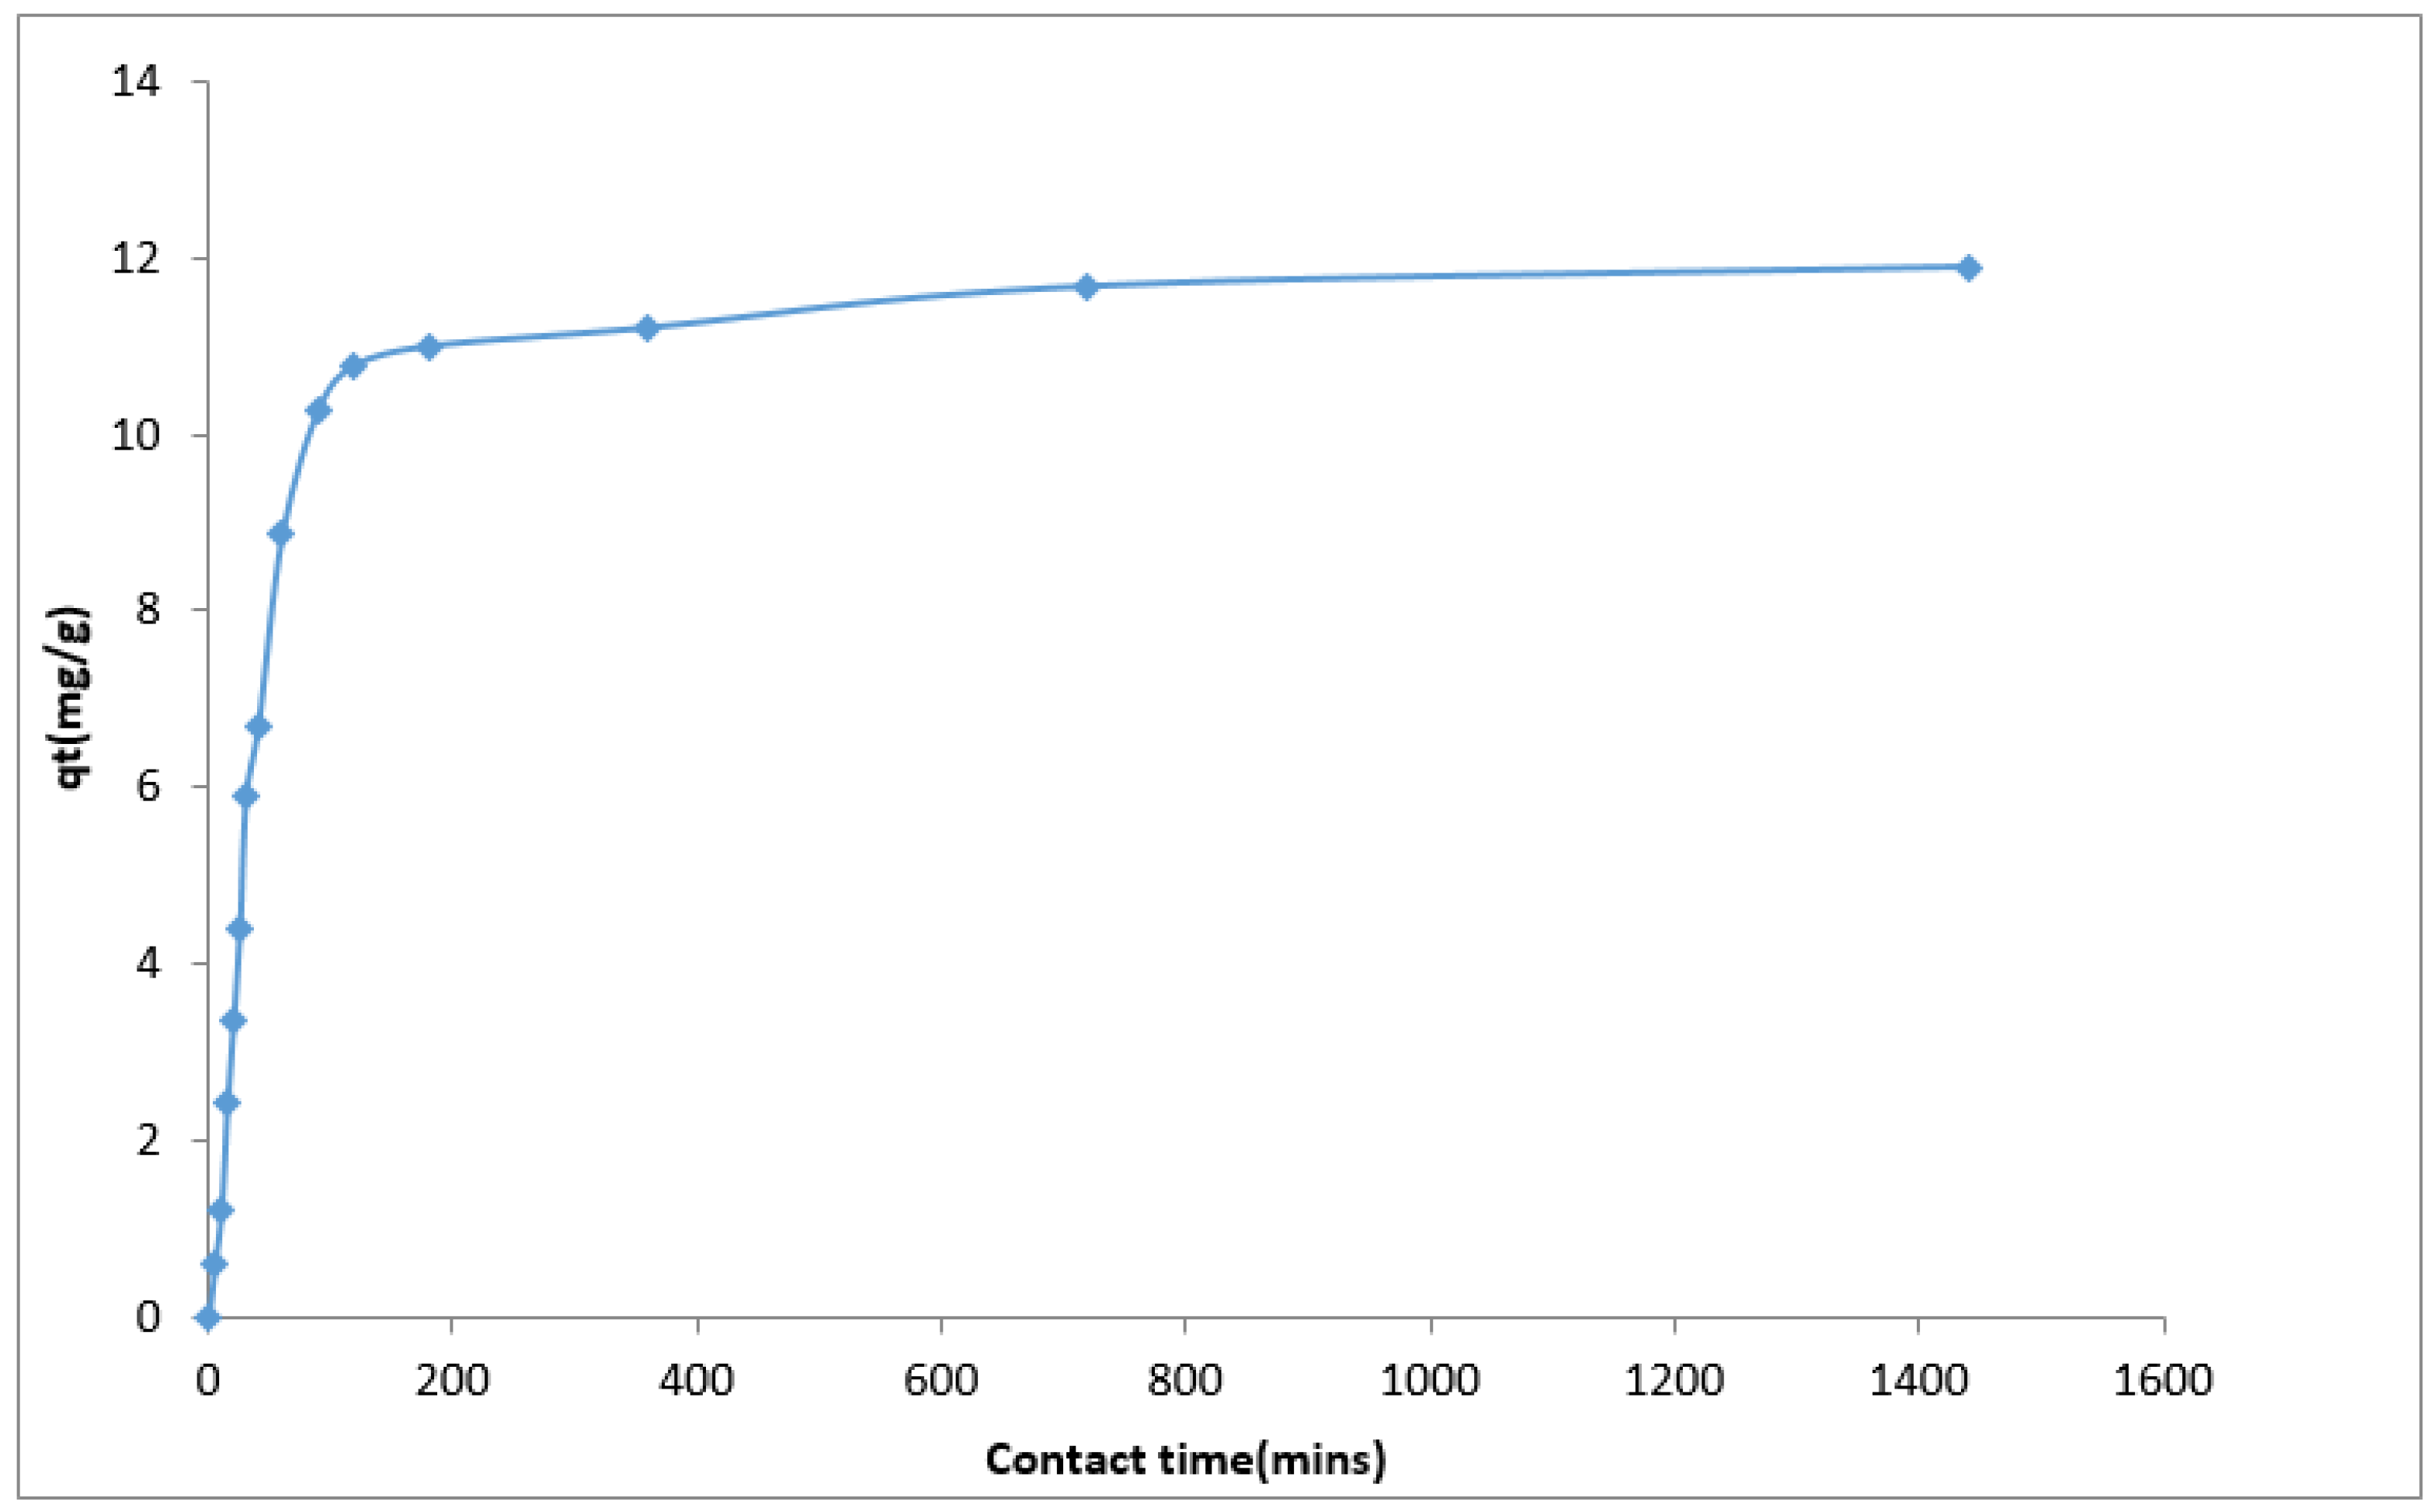
The effect of contact time on Cd(II) ion uptake using the YTBS adsorbent was studied at pH 6.5 with initial metal ion concentration of 500 mg·L
−1, temperature of 25 °C, and a volume of 0.1 L. The amount of the YTBS adsorbent used was 2.0 g and the duration of kinetic studies was from 5 to 1440 minutes (72 h). From the experiment, the kinetic profile of Cd(II) sorption was obtained and is presented in
Figure 11.
From
Figure 11, Cd(II) ion uptake by the YTBS adsorbent increased with time up till 1440 min. The sorption process was slow due to the textural characteristics of the biosorbent (low surface area, low pore volume) with maximum uptake at 180 min and thereafter there was a gradual loading of Cd(II) ion on the YTBS adsorbent up till the attainment of pseudo-equilibrium loading of 11.89 mg∙g
−1 after 1440 min. The two stage process of the uptake of Cd(II) by the YTBS adsorbent can be explained based on the availability of active sites on the YTBS adsorbent for Cd(II) ion loading. At inception of the metal ion-adsorbent contact, there are a number of readily accessible active sites on the adsorbent surface making the uptake of the Cd(II) ions at the initial instance faster than the process after 180 min. According to Sarada et al. [
32] during metal ion uptake as a function of time, as contact time increases the vacant sites on the adsorbent surface become occupied and the number of sites available for uptake by incoming metal ions decreases thereby making the process slow. In addition, as more metal ions adsorb onto the surface of the adsorbents, there is a repulsive interaction between the metal ions in solution and those on the surface of the adsorbent due charge similarity thereby hindering the rapid uptake of metal ions, since surface of the adsorbent are now predominantly positive [
32,
129]. The trend of the metal ion kinetics reported in this study is similar to those reported in literature for example in a study by Guo et al. [
135] on the sorption of Cd(II) by a chemically modified maize straw adsorbent; the two stages of uptake were reported: the initial rapid stage of metal ion uptake was associated with the activation energy and the subsequent slow stage linked with the rearrangement of the adsorbed ions (Cd(II)) on the surface of the adsorbent which leads to a more thorough utilization of the adsorption sites on the adsorbent. These effects are presumed to contribute to the gradual metal ions uptake noticed until equilibrium is attained. The two stage variation in the uptake profile of the Cd(II) ions onto the surface of the YTBS adsorbent has also been observed in other studies. Ding et al. [
135] has also reported on the two stages in their description of the sorption kinetics of aquatic Cd(II) ions using unmodified rice straw. Shahidi et al. [
130] has also observed this two stage profile in their study on the adsorption of cadmium (II) ions from aqueous solution using
Luffa cylindica adsorbent and this was attributed to the presence of vacant sites at the inception of sorption.
4.2.4. Kinetic Modelling
A number of models have been used to describe the rate and extent of sorption of an adsorbate onto an adsorbent and these models have assumptions for the prediction of these interactions [
136]. To determine the potential rate-controlling step for Cd(II) sorption by the YTBS adsorbent three diffusion-based kinetic models were used to test the experimental data. The applicability of different kinetic models is often tested based on their ability to describe the experimental kinetic data using some optimization parameters. For the sorption of Cd(II) ions onto the YTBS adsorbent, three kinetic models were evaluated and these are the pseudo-first order (PFO), pseudo second order (PSO), and Elovich. To determine the goodness of fit of the kinetic models to the experimental data using non-linear regression, the optimization procedure requires that error functions be defined to enable the fitting of the model parameters with the experimental values. In this study, the coefficient of determination (
r2), the root mean square error (RMSE), sum of square error (ERRSQ), and the Chi square test (
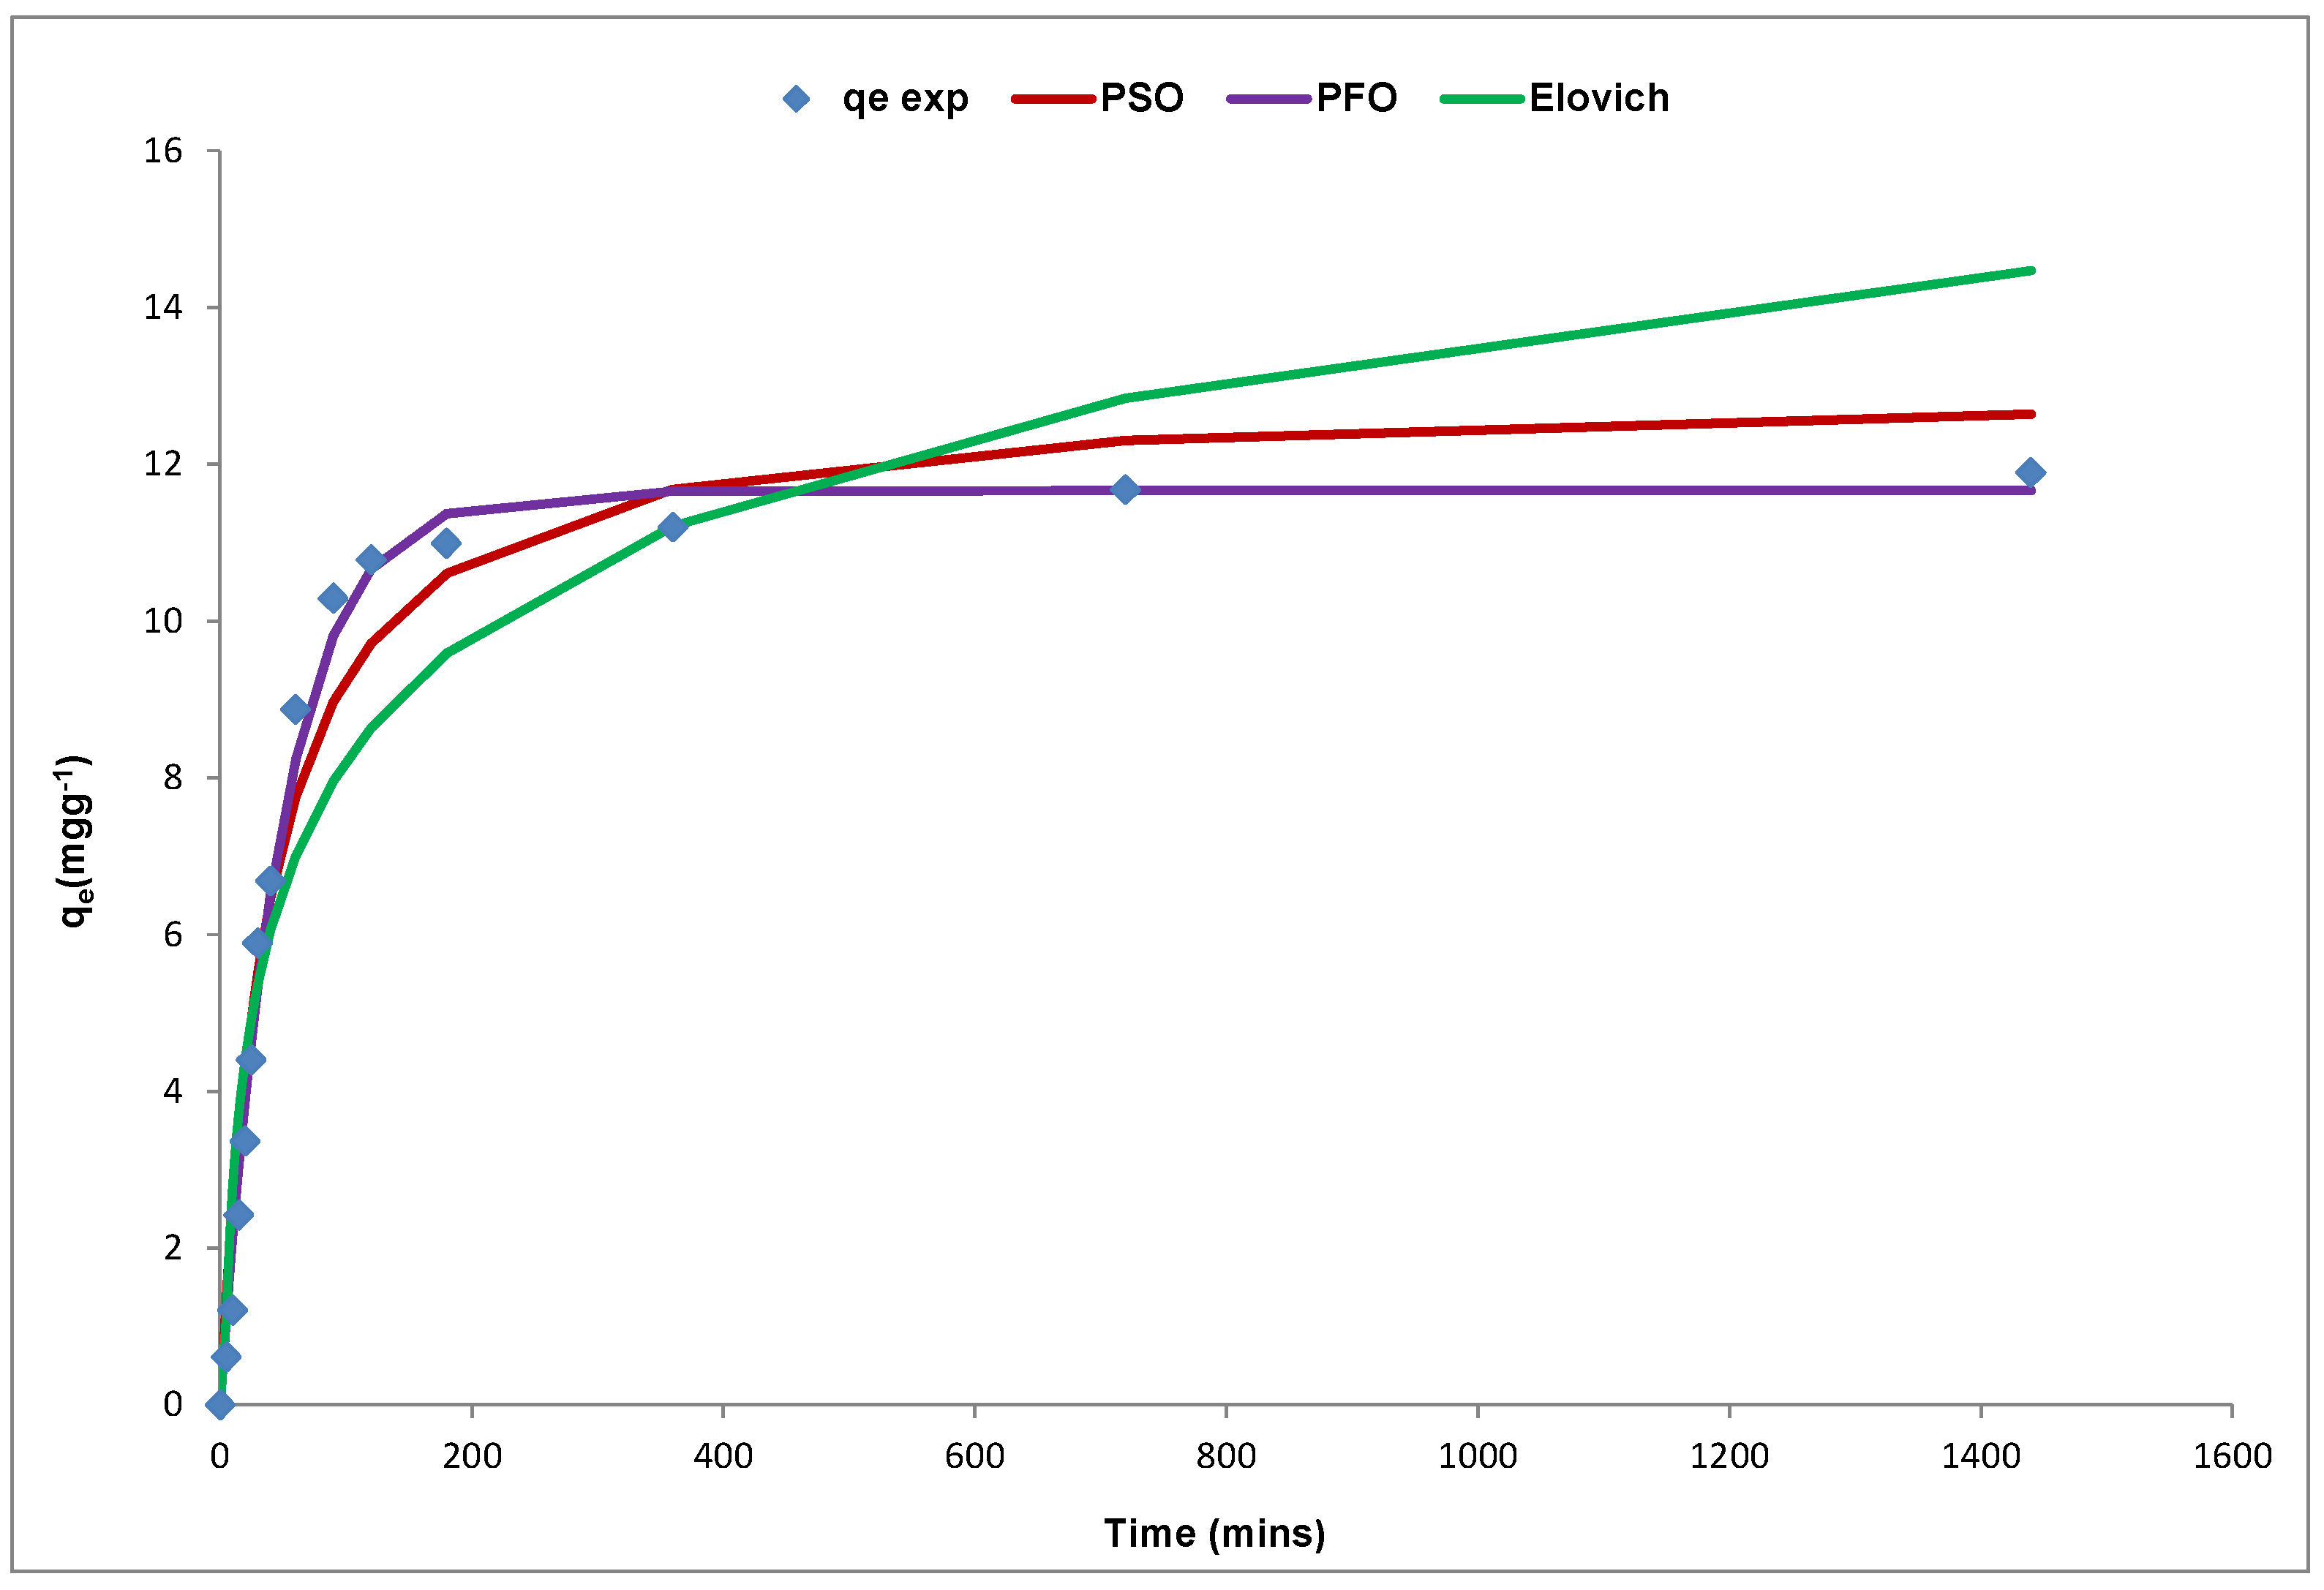
χ2) were used as error parameters for each model and these were determined based on Equations (13)–(16) which have been previously described in this study. The kinetic modelling plot of Cd(II) ion sorption onto the YTBS adsorbent is presented in
Figure 12. From these models, the kinetic parameters and their respective error functions obtained are presented in
Table 5. From
Table 5, the results indicate that all the three kinetic models could be used to predict the kinetics of Cd(II) ion uptake onto the YTBS adsorbent. For the pseudo-first order (PFO) & pseudo-second order (PSO) models, the prediction of each model of the kinetic parameter (
qe,model) is close to the result obtained from the experimental analysis of Cd(II) ion sorption (11.89 mg∙g
−1). The Elovich equation on the other hand also gave estimation of the initial adsorption rate (α) and
which relates to the extent of surface coverage and activation energy for chemisorption.
From
Table 5, the rate constant (
k1) of the pseudo first order (PFO) model was 2.05 × 10
−2 min
−1 and this result is similar to what has been reported in previous studies for some lignocellulosic adsorbents used for Cd(II) adsorption. Feizi and Jalali [
129] have reported on the kinetics of Cd(II) sorption using sunflower, potato, canola, and walnut shell adsorbents and in their study, the values of k
1 for the PFO model were; 2.0 × 10
−2 min
−1, 8.0 × 10
−2 min
−1, 1.0 × 10
−2 min
−1 and 1.0 × 10
−2 min
−1 for sunflower, potato, canola, and walnut shell adsorbents, respectively. In another study by Ding et al. [
137], the rate constant (
k1) of the pseudo first order (PFO) model obtained for Cd(II) sorption by unmodified rice straw was reported as 1.1 × 10
−1 min
−1. A k
1 value of 1.6 × 10
−1 min
−1 for the PFO model has also been reported for the sorption of Cd(II) from aqueous solution by
Alhaji maurorum seed adsorbent [
138]. For the pseudo second order (PSO) model, the rate constant (
k2) obtained for Cd(II) sorption by the YTBS adsorbent was 1.9 × 10
−3 g∙mg
−1·min
−1 and this value indicates that the rate of uptake as described by the PSO model was faster than that of the PFO model. Similar values for the PSO rate constant have been reported by Feizi and Jalali [
129] for the sorption of Cd(II) by potato (9.0 × 10
−3 g∙mg
−1·min
−1) and canola (7.0 × 10
−3 g∙mg
−1·min
−1) residue adsorbents. Iqbal et al. [
139] has also reported a pseudo second order rate conatant of 1.0 × 10
−3 g∙mg
−1·min
−1 in their study of Cd(II) sorption by mango peels. For the PSO model, the initial adsorption rate “h” obtained from the model as presented in
Table 5 is 3.2 × 10
−1 mg∙g
−1·min
−1, and this is observed from
Table 5 to be lower than 7.7 × 10
−1 mg∙g
−1·min
−1 obtained for initial adsorption rate (α) obtained based on the Elovich equation. Both the pseudo second order model and the Elovich equation are based on fundamental assumptions of chemisorption mechanism for adsorbate uptake, and the value of the initial adsorption rate from both models indicates that the Elovich equation has a faster rate than that the PSO. The Elovich equation parameter which relates to the extent of heterogeneous surface coverage was 0.43g mg
−1 and this indicates the extent of Cd(II) loading on the YTBS surface based on this model. The surface loading obtained for the PFO and PSO models were 11.7 mg∙g
−1 and 12.9 mg∙g
−1, respectively, and these values indicate that the (
qe,cal) value obtained for the PFO model was closer to the experimental value (11.9 mg∙g
−1).
To determine which kinetic model best describes the sorption of Cd(II) onto the YTBS adsorbent, further evaluation of the values for error parameters (
χ2, ERRSQ and RMSE) and determination coefficient (
r2) in
Table 5 for the three models indicates that the PFO model had the lowest values for the three error parameters and the highest
r2 value (0.99). Thus, it can be said that the PFO model gave the best approximation of the kinetics of Cd(II) sorption by the YTBS adsorbent than the PSO and Elovich model. This implies that the kinetics supports the assumption that the rate limiting step of Cd(II) ion sorption onto the YTBS adsorbent is dependent on the concentration of the Cd(II) ions in the adsorbate [
46,
140,
141].
4.2.5. Equilibrium Isotherm Modelling
Analysis of equilibrium data is known to be important for the evaluation of the efficiency of an adsorbent for the adsorbate under consideration. It is also used to generate isotherm modelling parameters that can be used to compare different adsorbents as well as for the design and optimization the sorption procedure [
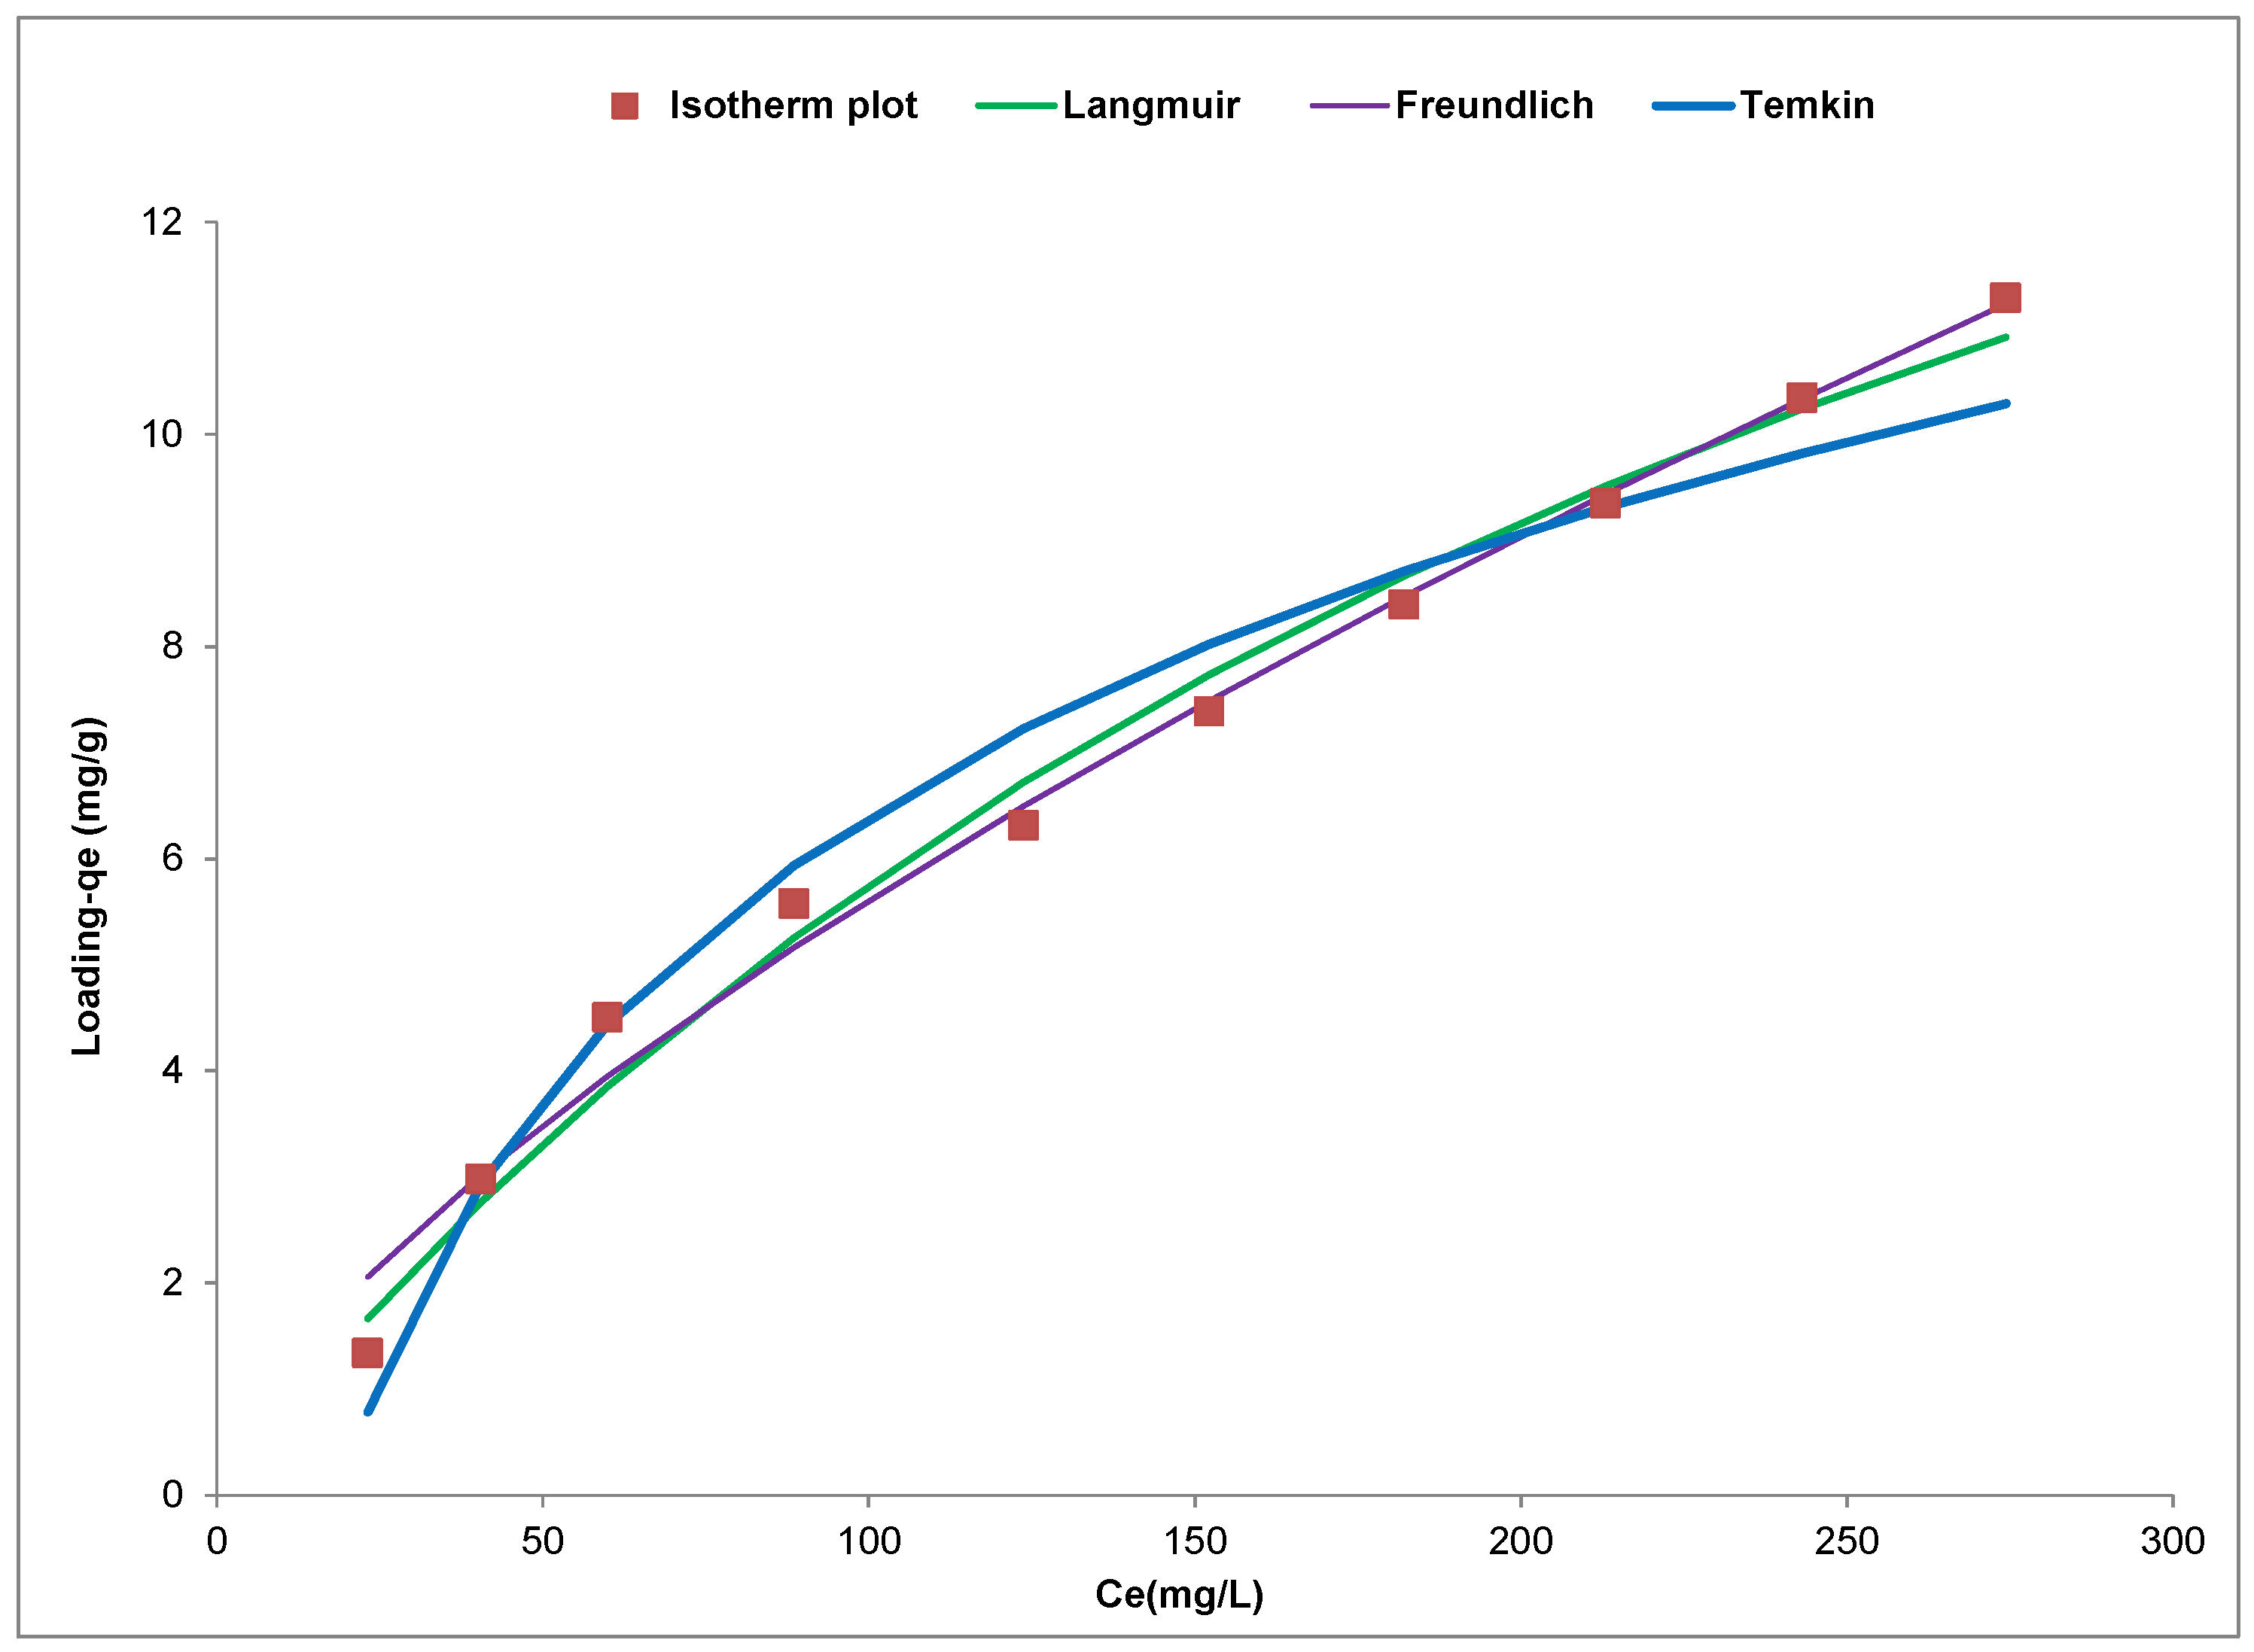
142]. The plot of the experimental and isotherm plots for Cd(II) ion removal using the YTBS adsorbent is shown in
Figure 13 and this figure indicates that the adsorption of the Cd(II) ion was concentration dependent with loading (q
e,exp) increasing from 1.32 mg∙g
−1 to 11.28 mg·g
−1 with increase in initial metal ion concentration from 50 to 500 mg∙L
−1. This increase can be associated with the increase in availability of Cd(II) ions in the adsorbate system as the initial metal ion concentration increased from 50 to 500 mg∙L
−1. This leads to an increase in the driving force afforded the system by the increasing metal ion concentration making it possible to overcome the mass transfer resistance that exist between the Cd(II) ions in the adsorbate and the YTBS adsorbent [
17]. Based on the classification of equilibrium adsorption isotherms according to Giles [
143,
144,
145], the equilibrium isotherm for YTBS sorption of Cd(II) ions can grouped as an “L” isotherm. From these experimental values, three isotherm models (Langmuir, Freundlich and Temkin) were used to further characterize the sorption equilibrium between the adsorbent (YTBS) and the adsorbate. In this study, the coefficient of determination (
r2), the root mean square error (RMSE), sum of square error (ERRSQ), and the Chi square test (
χ2) were used as error parameters for each model and these were determined based on Equations (13)–(16) which have been previously described in this study in addition with the fundamental assumptions of these kinetic models theoretical models for fitting experimental data section of this study.
From this isotherm plot, the Langmuir, Freundlich and Temkin isotherm parameters and errors parameters (RMSE,
χ2 and ERRSQ), as well as the coefficient of determination (
r2) for the YTBS adsorbent sorption of Cd(II) ions were obtained and are presented in
Table 6. From the Langmuir isotherm plot in
Figure 13, the
qmax is the parameter that is used to characterize the adsorbent loading capacity; it is attributable to the maximum metal uptake upon complete saturation of the adsorbent, while the parameter
KL is a coefficient that describes the affinity between the adsorbent and the adsorbate [
17,
33,
142].
This model also assumes that there exist a monolayer coverage of the surface of the YTBS adsorbent with Cd(II) ions which is indicated by the
qmax parameter [
35]. From this model, the value of Langmuir constant
KL obtained was 3.46 × 10
−3 L·mg
−1 for the YTBS adsorbent indicating the level of adsorbent-adsorbate affinity as presented in
Table 6. The value of the Langmuir isotherm constant
qmax (22.4 mg·g
−1) is also indicated in
Table 6, and this implies that the maximum saturation capacity of the YTBS adsorbent for the Cd(II) is 22.4 mg·g
−1. The value obtained for the Cd(II) ion maximum monolayer loading capacity
qmax for the YTBS adsorbent was compared to those of some adsorbents reported in literature as seen in
Table 6. From the Table, it is observed that the adsorbent in this study had a
qmax value that was comparable to those reported in literature indicating that this residue can be a promising adsorbent for the removal of cadmium from aqueous solutions and effluent systems.
For the Freundlich isotherm in
Figure 13, the parameters “n” and “
KF” are used to describe the multilayer nature of sorption on heterogeneous surfaces [
35,
36]. For the sorption of Cd(II) ions onto the YTBS adsorbent, the value of the parameter
KF, which relates to adsorption capacity was 2.37 × 10
−1 (mg·g
−1) (L·mg
−1)
1/n as presented in
Table 7, thereby indicating a low multilayer adsorption capacity.
The Freundlich constant “n” which relates to the adsorption intensity and varies with the heterogeneity of the adsorbent surface is used to indicate how favorable the multilayer sorption process is based on this model. The range of “n” from 1–10 indicates a favorable adsorption process [
17,
32,
34,
146]. From
Table 6, it is observed that the value of the parameter “n” for the sorption of Cd(II) ions onto the surface of the YTBS adsorbent was 1.46, which confirms that the sorption process was favorable.
A number of studies have reported values for the Freundlich isotherm modeling of Cd(II) sorption that are similar to those obtained in this study. Vazquez et al. [
161] in their study on the equilibrium and kinetic modelling of the adsorption of Cd
2+ ions onto chestnut shell reported
KF value of 1.07 mg
1−1/n g
−1 L
1/n and the value of “n” obtained was 2.7. Similarly, in another study by Perez-Marin et al. [
43] on the removal of cadmium from aqueous solution by adsorption onto orange waste, the Freundlich isotherm parameters obtained were
KF (0.317) and n (3.38). The Temkin isotherm in
Figure 13 was used to obtain the constants of the Temkin equation presented in
Table 6. From
Table 6, can be observed that the value of the Temkin constant “
B” is 3.84 kJ∙mol
−1, this parameter relates to the heat of adsorption gives an indication of the heat associated with the adsorption of the Cd(II) ions onto the surface of the YTBS adsorbent [
37]. The second constant of the Temkin isotherm “
AT” is the equilibrium constant and it indicates the loading of the adsorbate onto the adsorbent for the sorption process based on the Temkin model. From
Table 6, the value of
AT for the sorption of Cd(II) ions onto the YTBS adsorbent is 5.29 × 10
−2 L·mg
−1 and implies a very low loading based on the Temkin model. The results obtained for the sorption of the YTBS adsorbent for the Temkin model is similar to what has been reported in literature. Vashantha et al. [
162] in their study on the adsorption of Cadmium(II) ions from simulated wastewater using raw Luffa husk have reported parameters for the Temkin model of 2.41 (
BT) and 1.00 (
KT).
Furthermore, from
Table 6, a comparison of the three isotherm models can be made based on the value of their respective error parameters used to characterize the non-linear modelling. It was observed that the high
r2 values and low root mean square error (RMSE), Chi square (
χ2) and sum of error squared (ERRSQ) values for the three isotherm models implies that these models can be used to described the sorption of Cd(II)ions onto the YTBS residue adsorbent. However, the Langmuir model was the best model that described the uptake of Cd(II) ions onto the YTBS adsorbent as its r
2 value (0.99) was higher than that of the Freundlich (0.98) and Temkin models (0.98). In addition, the values of the three error parameters (ERRSQ, RMSE and
χ2) were lowest for the Langmuir model when compared with those of the Temkin and Freundlich models.

