Article

Bioavailable Forms of Heavy Metals and Se in Soil in the Vicinity of the Pechenganikel Smelting Plant and the Relationship with Mineral Composition and Antioxidant Status of Biocrusts

1
Federal Scientific Vegetable Center, Odintsovo District, VNIISSOK, Selectsionnaya 14, Moscow 143072, Russia
2
Laboratory of Forest Monitoring and Planning, Voronezh State University of Forestry and Technologies Named After G.F. Morozov, Timiryazeva 8, Voronezh 394087, Russia
3
Department of Ecology, Sergo Ordzhonikidzer Russian State Geological Exploration University, Miclukho-Maklay St. 23, Moscow 117485, Russia
4
T.A. Viazemski Karadag Scientific Station—Nature Reserve of RAS, Branch of A. O. Kovalevsky Institute of Biology of the Southern Seas of RAS, Nauki St., 22, Kurortnoe 298188, Russia
5
Pasvik Nature Reserve, Murmansk Region, Pechenga District, Gvardeisky Prospect, 43, Nikel 184402, Russia
6
Department of Agricultural Sciences, University of Naples Federico II, 80055 Portici, Naples, Italy
*
Author to whom correspondence should be addressed.
Standards 2025, 5(4), 28; https://doi.org/10.3390/standards5040028
Submission received: 31 July 2025 / Revised: 10 September 2025 / Accepted: 23 September 2025 / Published: 14 October 2025

Abstract

The evaluation of bioavailable forms of heavy metals in zones of anthropogenic pollution is the basis of ecological risk assessment. The characterization of the consequences of the operation of the Pechenganikel smelting plant was carried out using AAS and two methods of soil bioavailable forms of heavy metal extraction (3% nitric acid and ammonium acetate buffer with pH 4.8) along three directions from the plant, corresponding to the wind prevalence. Buffer extraction provided more significant correlations between Ni, Co, Cu, Pb, and Zn, compared to nitric acid application, indicating a negative correlation between soil Cu, Co, and the distance from the plant, while no significant correlations were recorded for nitric acid extracts. A higher significant correlation number arose between soil elements in buffer extracts along the N-E direction than the S-W one. In the former direction, the number of the mentioned correlations decreased according to the following sequence: Zn (6) > Cu (5) > Se and Co (4) > Ni and Fe (3); in nitric acid extract, only significant correlations of Cu, Zn, and Se with Co and Ni were recorded. Biocrust formation was revealed only along the N-E direction, characterized by unexpected high Se concentrations and intensive correlation between Zn and all the elements extracted by the buffer. Biocrust accumulated high levels of all the elements tested and showed antioxidant activity and polyphenol content significantly correlated with soil organic matter. The biocrust mineral content demonstrated a complex relationship with soil Fe, Cu (buffer extract), and Se, as well as Co and Zn (nitric acid extract). Application of linear mixed-effects modelling and transfer factor analysis indicate that biocrusts may serve as effective bioindicators of both absolute metal contamination and its bioavailable fractions. The results indicate the expediency of using both methods of soil extraction for assessing the ecological risk and soil–biocrust relationships.

1. Introduction

The analysis of soil mineral content in the vicinity of industrial plants is of fundamental importance for the assessment of ecological risks and efficient phytoremediation technology development [1]. The Nikel settlement in the Murmansk region, situated in the vicinity of the Norwegian and Finnish border, is known for its Cu/Ni mining and processing, with intensive environmental pollution causing the formation of vast anthropogenically contaminated zones affected by soil degradation, with a related reduction in microbiological biodiversity [2,3], toxic element absorption by growing plants, and a negative effect on human health [4,5]. Native acidic soils promote the mobility and bioavailability of heavy metals [6], while Arctic conditions slow down the activity of soil microorganisms. Until 2020, this region was among the most polluted regions in Russia, due to intensive sulfur oxide, nickel, and copper emissions starting from the 1930s [7]. Multiple investigations of the anthropogenic risks [3,8,9,10,11] and the proximity of the state border led to the decision to shut down the Ni/Cu smelting plant in 2020, which decreased sulfur dioxide emissions by 70% compared to that recorded in 2015. Nevertheless, the assessment of the long-term consequences of plant functioning and the development of a unified technological plan of phytoremediation remain an unsolved issue. In this respect, selenium, which is present in soil deposits along with S and Cu [12], may be a contamination factor because of either possible Se toxicosis or its beneficial effect on biota due to the well-known antagonism with heavy metals [13].
The amount of heavy metals that may be easily absorbed by plants, or the so-called metal bioavailability, is of utmost importance as a major qualitative indicator of the geochemical barrier efficiency, necessary for phytoremediation [14]. In this respect, soil fractioning using different extracting agents provides important information on the peculiarities of soil–plant interactions. Indeed, extraction of soil heavy metals using water, EDTA [15], CaCl2 [16], NaNO3 [17], NH4NO3 [18,19], ammonium acetate buffer [20], and diluted nitric acid [21,22] is often used for the characterization of different forms of heavy metals in soils and their effect on plants. Brady et al. [21] demonstrated that in marine sediments, 3% nitric acid solution provided deeper element extraction, compared to the ammonium acetate buffer, capable of extracting metal ions only from the weakest sorption centers and destroying some metal complexes due to the complexing ability of the acetate ion [23]. So far, only the total content of heavy metals in soils from the vicinity of Pechenganikel plant has been determined [3]. However, the levels of heavy metal accumulation in living organisms are preferable as an integral indicator of ecological risks. The latter may be applicable only to the south-western part of Pechenganikel plant’s vicinity, but not to the north-eastern part of the area, where the predominant north-easterly wind caused the formation of an anthropogenic desert lacking any vegetation except biocrusts. Thus, the determination of heavy metal content in mushrooms of Pechenga district was achieved only in unpolluted areas [24], contrary to biocrusts, which lack any information about the peculiarities of their mineral composition in the above-mentioned conditions. Being the primary organisms under extreme environmental stresses, biocrusts are able to concentrate macro- and microelements, and can thus provide important information about the ecological situation of the polluted area [25].
Indeed, biocrusts compose a complex interaction system of soil with bacteria (mostly cyanobacteria), algae, yeast, fungi along with lichens, and bryophytes [26], increasing soil biological diversity, improving primary production, water and carbon storage, nitrogen fixation, soil aggregation, and providing a long-term promotion of vascular plant growth [27,28]. The biocrust matrix is formed from polymeric substances, predominantly polysaccharides distributed in the thin upper layer of the soil [29,30]. The species composition of biocrusts varies depending on the stage of their development, from cyanobacteria as the primary colonizer [31] to a complex of algae, lichen, and bryophyte association, with a predominance of bryophytes in polar territories [30,32]. Nitrogen, phosphorus, and water deficiency, as well as high soil acidity, are the main factors affecting the development of biocrusts [33,34]. Investigation of bryophyte and lichen tolerance to heavy metals near Monchegorsk ‘Severonikel’ plant in subarctic conditions [32] revealed three Marchantiales species that were highly tolerant to Ni/Cu contamination among the 18 tested: Gymnocolea inflate, Isopaches bicrenatus, and Solenostoma confertissimum. Unfortunately, no data are available regarding the composition of biocrusts in the vicinity of Pechenganikel smelting plant.
To date, most of the investigations conducted, especially in the Arctic, have been devoted to biocrust diversity, carbon fixation, and water availability regulation [26,27,29,30,31,33,34,35,36,37,38,39], leaving aside the biochemical aspects of biocrust protection. This is particularly important in the zones affected by high anthropogenic pollution with specific loading in toxic elements. No literature information is available regarding the mineral composition of biocrusts grown at the extremely high anthropogenically polluted territory in the vicinity of the Pechenganikel smelting plant.
The present investigation aimed to (1) compare soil Ni, Cu, Co, Co, and Fe levels using two extracting solvents, i.e., 3% nitric acid and ammonium acetate buffer, pH 4.8, and determine the Se content in the vicinity of the Ni/Cu smelting plant and in areas far away from the plant; (2) characterize biocrust mineral composition and antioxidant status; and (3) study the relationships between biocrust and soil parameters.

2. Material and Methods

2.1. Climate Parameters and Sampling Places

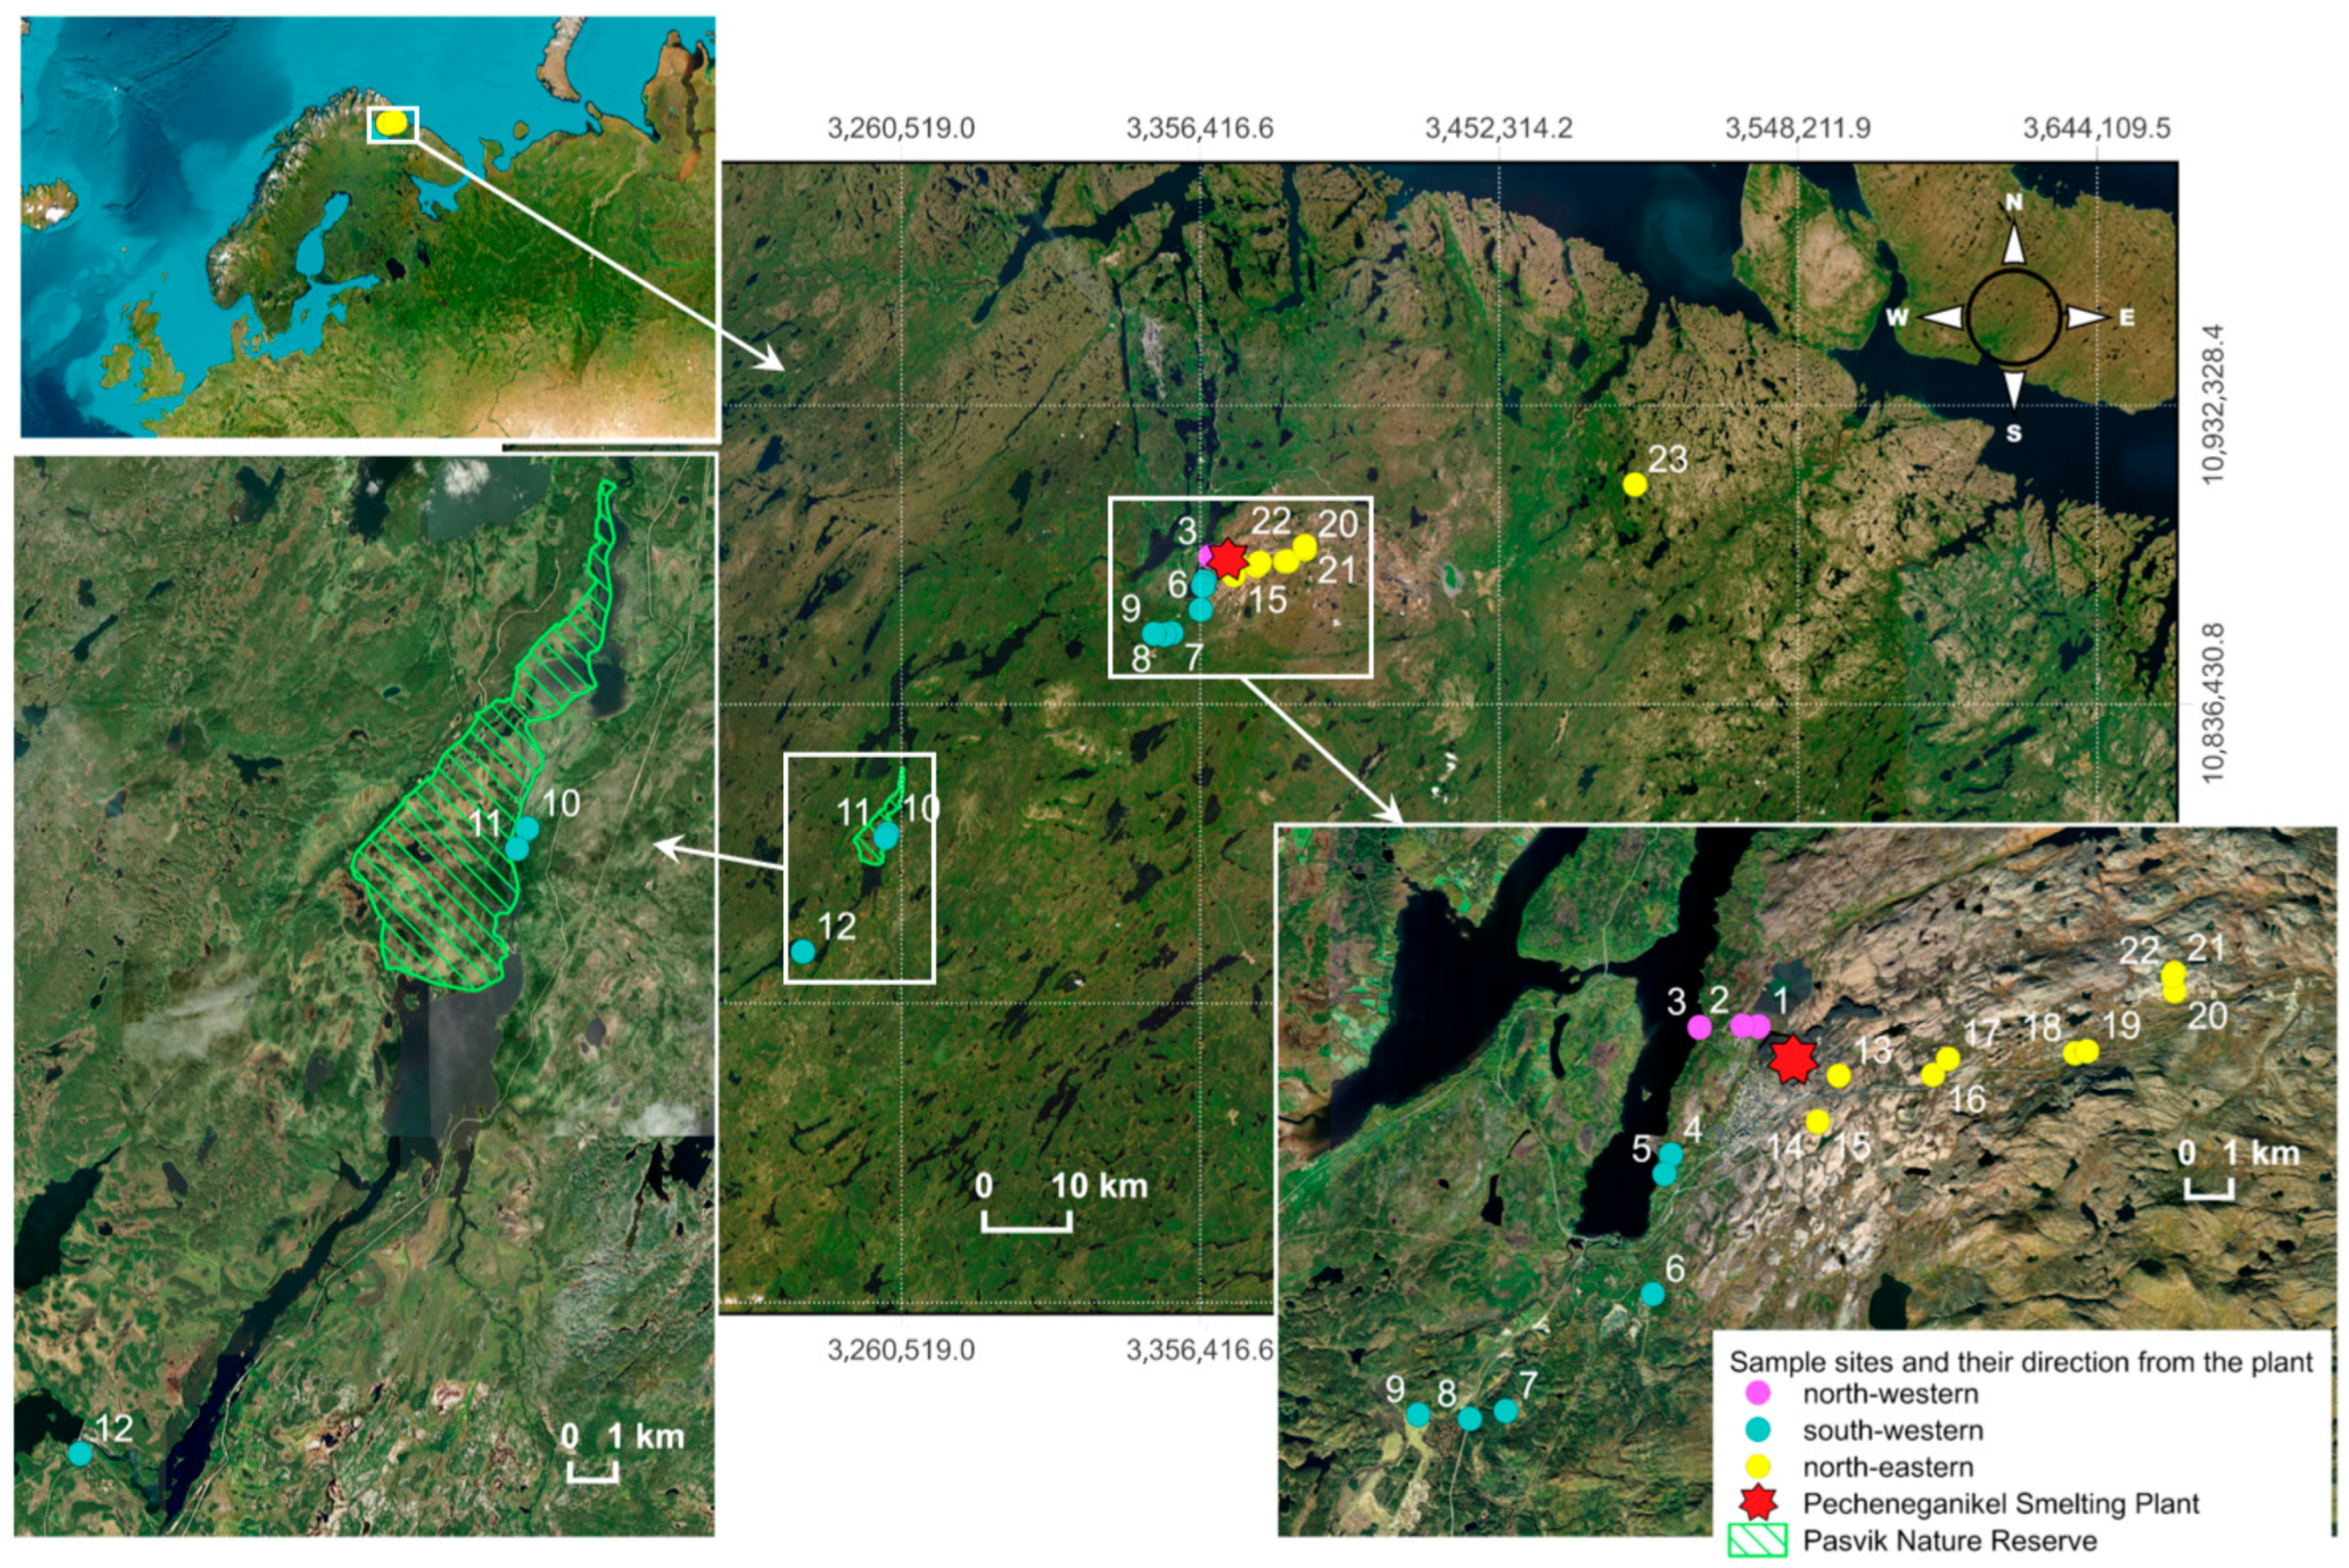
The investigated territory is situated in the subarctic region in the north-western part of European Russia near the Norwegian and Finnish border. Pechenga district is situated in the tundra and taiga soil and vegetation zone with the predominance of tundra, bog–podzolic, podzolic, bog, and sod soils. To evaluate the peculiarities of soil mineral content from 16 to 21 August 2024, 23 soil samples were taken at 8–12 cm depth at variable distance from 0.8 to 65.7 km from the Pechenganikel Ni/Cu smelting plant, Murmansk region, while biocrust samples were collected at the N-E locations 13–22 (Supplementary Table S1; Figure 1). Taking into account that imported soil is widely used in the Nikel settlement, soil was not sampled at the territory of Nikel. Soil sampling places were chosen according to the preferred wind directions: N-E (16.4%), S-W (6.9%), and N-W (10.2%). The geographical coordinates of sampling places, north-west, south-west, and north-east from the smelting plant, were determined by a GPS navigator.
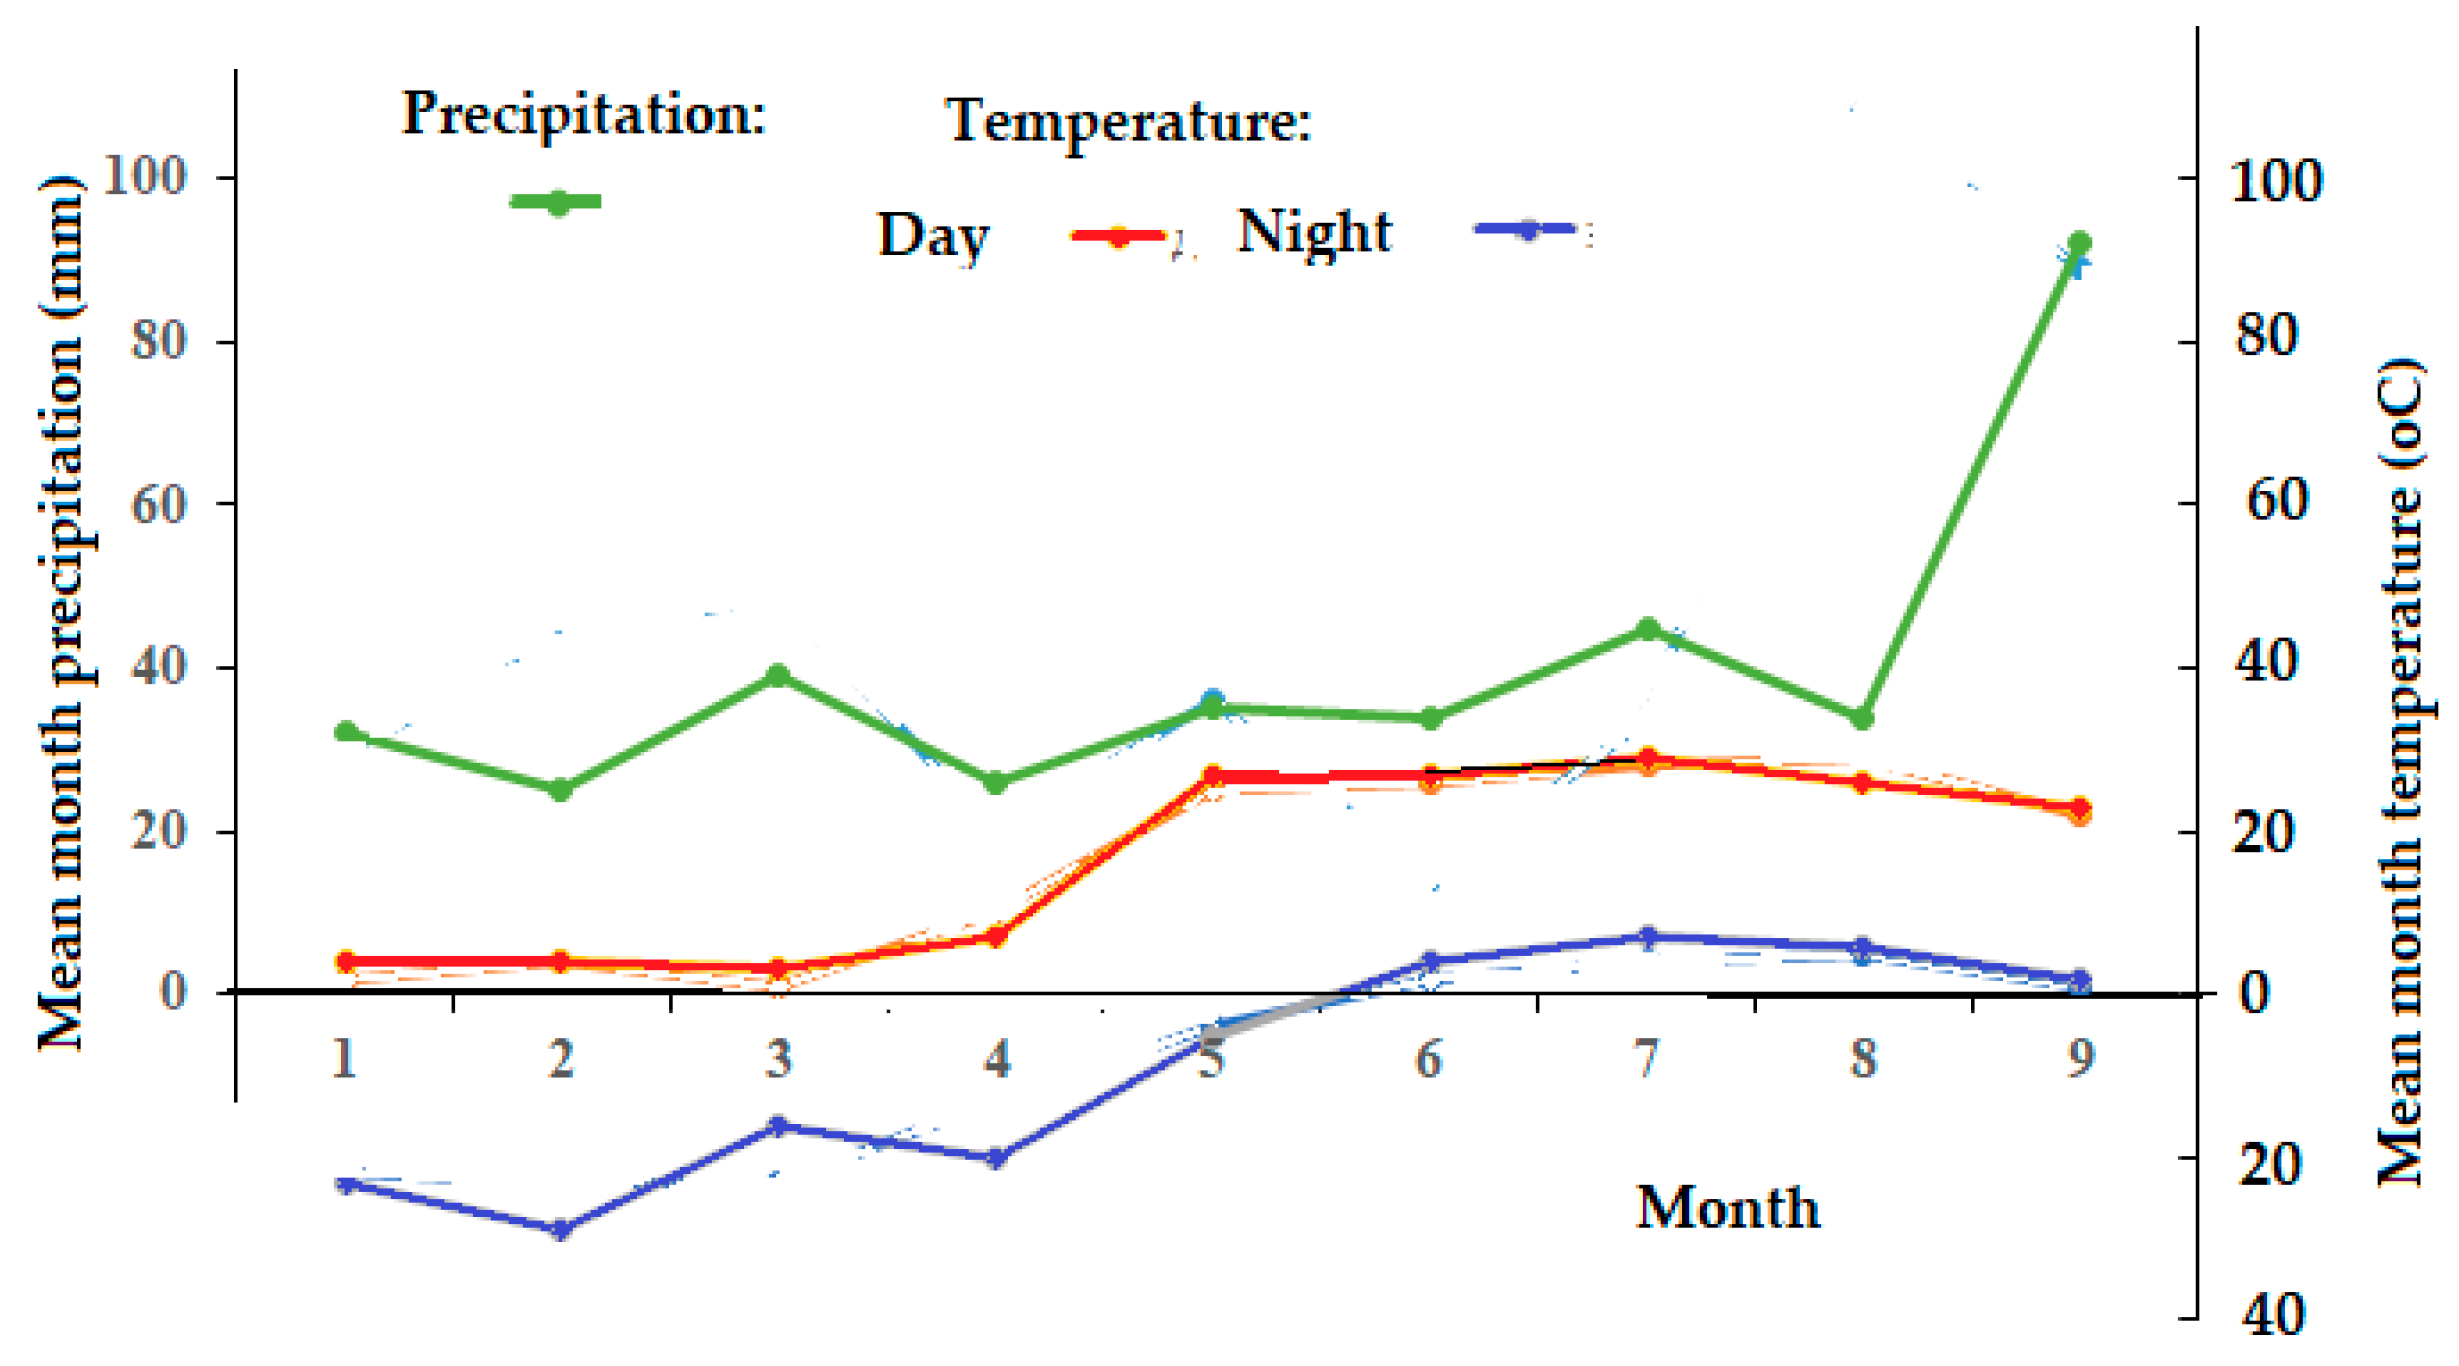
Mean annual temperature in the region studied reaches −0.5 °C due to the proximity of the Polar Circle and severe winters lasting about 6 months, bringing sudden cold snaps with temperatures dropping to −30 °C or even lower. Summer is short and cool, with mean temperatures from 10 to 15 °C. During the expedition in 2024, August was unusually dry and hot (Figure 2).

2.2. Collection and Preparation of Soil and Biocrust Samples

Each soil sample of about 1 kg represents a mixture of soils collected at a depth of 8–12 cm at three different points. The samples were dried at room temperature, homogenized after removing stones and plant residues, sieved through a 1 mm nylon sieve, and used for the elemental analysis.
Biocrust samples were gathered in similar locations to the soil, along the N-E direction from the plant, dried at room temperature, and transferred in separate bags to the laboratory, where the 3 mm upper layer was carefully separated with a thin scalpel and homogenized.

2.3. Determination of Microelements and Heavy Metals

The contents of Cu, Fe, Zn, Co, Ni, and Pb in soils were determined using the flame Atomic Absorption Spectrometry method (AAS) with a Shimadzu GFA-7000 spectrophotometer (Shimadzu, Kioto, Japan), using soil extracts with (a) 3% nitric acid solution and (b) ammonium acetic buffer with pH 4.8. First, 5 g of each soil sample was mixed with the appropriate solvent according to the soil–solute ratio (1:10, w/v). The mixture was stirred vigorously at room temperature for one hour, and then filtered through filter paper, and the eluate was used for the AAS measurement of the analyzed elements. Certified Reference Material GBN07408 (Institute of Geophysical and Geochemical Exploration, Langfang, China) was used as an external standard. All determinations were made in triplicate, and the limits of detection (µg L−1) were as follows: Ni 2.1; Cu 0.8; Co 1.8; Zn 1.9; and Pb 8.0; the recovery levels were in the range of 98.6–98.9%.
The elemental composition of biocrusts was determined via sample digestion (1 g) at 20–425 °C and subsequent extraction of the obtained white powder with 20 mL of 3% nitric acid. The filtrate was used for the analysis.

2.4. Selenium Content

The microfluorimetric method of Se measurement [40] adapted to the soil/biocrust analysis [22] was used in the present work. First, 100 mg of dry homogenized soil/biocrust probe was mixed with 1.5 mL of nitric/perchloric acid (10:7, v/v) and digested according to the temperature regimes: 120 °C—1 h; 150 °C—1 h; and 180 °C—1 h. Traces of nitric acid were removed via heating the samples with 1–2 drops of 30% hydrogen peroxide for 10 min at 150 °C, while the reduction of the selenate to selenite was achieved by sample treatment with 1 mL of 6 N HCl at 120 °C for 10 min. The reaction was stopped by adding 1 mL of distilled water; the upper layer was decanted after full separation of phases, and the residue was extracted once more using 1 mL of 10% EDTA solution. The combined liquid extract was mixed with 1 mL of 10% EDTA solution, and the pH was adjusted to 1 with ammonia solution. A complex of selenite with 2,3-diaminonaphtalene (piasoselenol) was obtained via sample heating with 1 mL of freshly prepared 0.1% 2,3-diaminonaphtalene solution in 1% HCl at 53 °C for half an hour. The selenium concentration was determined using the fluorescence value of piasoselenol extracted with hexane using a λ excitation wavelength 376 nm and λ emission at 519 nm using a Fluorate 4M spectrophotometer (Lumex, St. Peterburg, Russia). Three replicates were used for the analysis. A soil sample with known Se content (240 µg kg−1 d.w.; Federal Scientific Vegetable Center) was used as an external standard. The calibration curve was obtained using 5 different Se concentrations (as sodium selenate): 0, 2, 5, 10, and 15 ng. The sensitivity value of the method was 0.8 ng, and the recovery rate was 98.8%.
In general, only the total soil Se was analyzed due to the significant variability in the results at low concentrations [41].

2.5. Organic Matter (OM)

The organic matter content (OM) was determined according to [42].
Taking into account that soil composes only a small part of biocrust, the Folin–Ciocâlteu colorimetric method for the determination of polyphenol content and the titrimetric method for the determination of the total antioxidant activity in plants [43] were adapted for biocrust analysis. Only dried homogenized samples of biocrust were used in the determination, which provides representativeness of the determination under the low sampling mass applied.

2.6. Antioxidant Activity (AOA)

The total antioxidant activity of dried biocrust powder was assessed in ethanolic extracts after heating the samples in 70% ethanol at 80 °C for 1 h using a redox titration method developed previously for plant samples with gallic acid as an external standard [43]. A calibration curve was constructed using different concentrations of gallic acid (10 to 70 mg L−1); the recovery level was 98.5%, and the analysis was made in triplicate.

2.7. Total Polyphenols (TPs)

Biocrust polyphenol content was assessed using the Folin–Ciocâlteu colorimetric method, according to [43] with a small modification. After the extraction of one gram of dry biocrust with 20 mL of 70% ethanol at 80 °C for 1 h, the mixture was cooled down and quantitatively transferred to a volumetric flask, and the volume was adjusted to 25 mL. After thorough separation of the solid fraction, 1 mL of the resulting solution was used for the reaction with Folin–Ciocâlteu reagent in the presence of saturated Na2CO3 solution. The concentration of polyphenols was determined one hour later using the absorption value of the resulting solution at 730 nm on a Unico 2804 UV spectrophotometer (Suite E, Dayton, NJ, USA) based on the appropriate values of the external standard 0.02% gallic acid solution. The recovery level was 98.5%, and the analysis was performed in triplicate.

2.8. Statistical Analysis

All statistical analyses were performed using the R 4.3.2 and Python 3.11 environments with the statsmodels and scipy packages. Metal concentrations in soil and biocrust samples were log10-transformed prior to analysis to improve normality and homoscedasticity of residuals. To account for the nested structure of the data (multiple observations within individual sampling sites), linear mixed-effects models (MixedLM) were applied with the sampling site included as a random intercept.
For soil data, models of the form (1)
log10(concentration)~Distance × Direction × Soil pool + SOM + (1|Site)
were fitted separately for each element, where Distance is the distance from the emission source (km), Direction indicates the sector relative to the smelter (N–E vs. S–W), Soil pool refers to the chemical fraction (NH4OAc or 3% HNO3), and SOM is the soil organic matter content (%).
For biocrusts, the response variable was the log10-transformed metal concentration, and alternative models were fitted with soil predictors from NH4OAc or HNO3 pools. Models included Distance, Direction, and SOM as covariates, with Site as a random effect. The best model for each element was selected using the Akaike Information Criterion (AIC).
To explore potential transfer processes, transfer factors (TFs) were calculated as the ratio between metal concentrations in biocrusts and soils for both pools (TF_NH4OAc and TF_HNO3). Mixed-effects models with the structure
log10(TF)~Distance + Direction + SOM + (1|Site)
were used to test the effects of spatial gradient and soil properties on TF values.
Pairwise correlations between metals in biocrusts and biocrust functional indicators (AOA and TP) were assessed using Spearman’s rank correlation coefficients. Partial correlations controlling for distance were also calculated. For all families of tests (model coefficients or correlation matrices), p-values were adjusted for multiple comparisons using the Benjamini–Hochberg false discovery rate (FDR) procedure. Results were reported as adjusted q-values, with q < 0.05 considered statistically significant.
Spatial autocorrelation of model residuals was evaluated using Moran’s I with k-nearest neighbors (k = 4) and permutation tests (499 randomizations). In addition, sensitivity analyses were carried out by excluding imported soil samples to test the robustness of the results.
All descriptive statistics, model outputs, correlation matrices, and TF calculations are provided in the Supplementary Information.

3. Results and Discussion

3.1. Soil Characteristics

According to Evdokimova et al. [3], the soils in the vicinity of Pechenganikel are Al Fe–humus podzols. In the present work, soil sampling was performed along three directions from the Pechenganikel smelting plant: (1) N-W wind (10.2%; the distance from the plant was 1.5–2.6 km), (2) S-W wind (6.9%; the distance from the plant was in the range of 3.5–65.7 km), and (3) N-E wind (16.2%; the distance from the plant was 0.8–46.6 km) (Figure 1, Supplementary Table S1). Only the latter direction was characterized by biocrust formation.

3.1.1. Selenium Levels

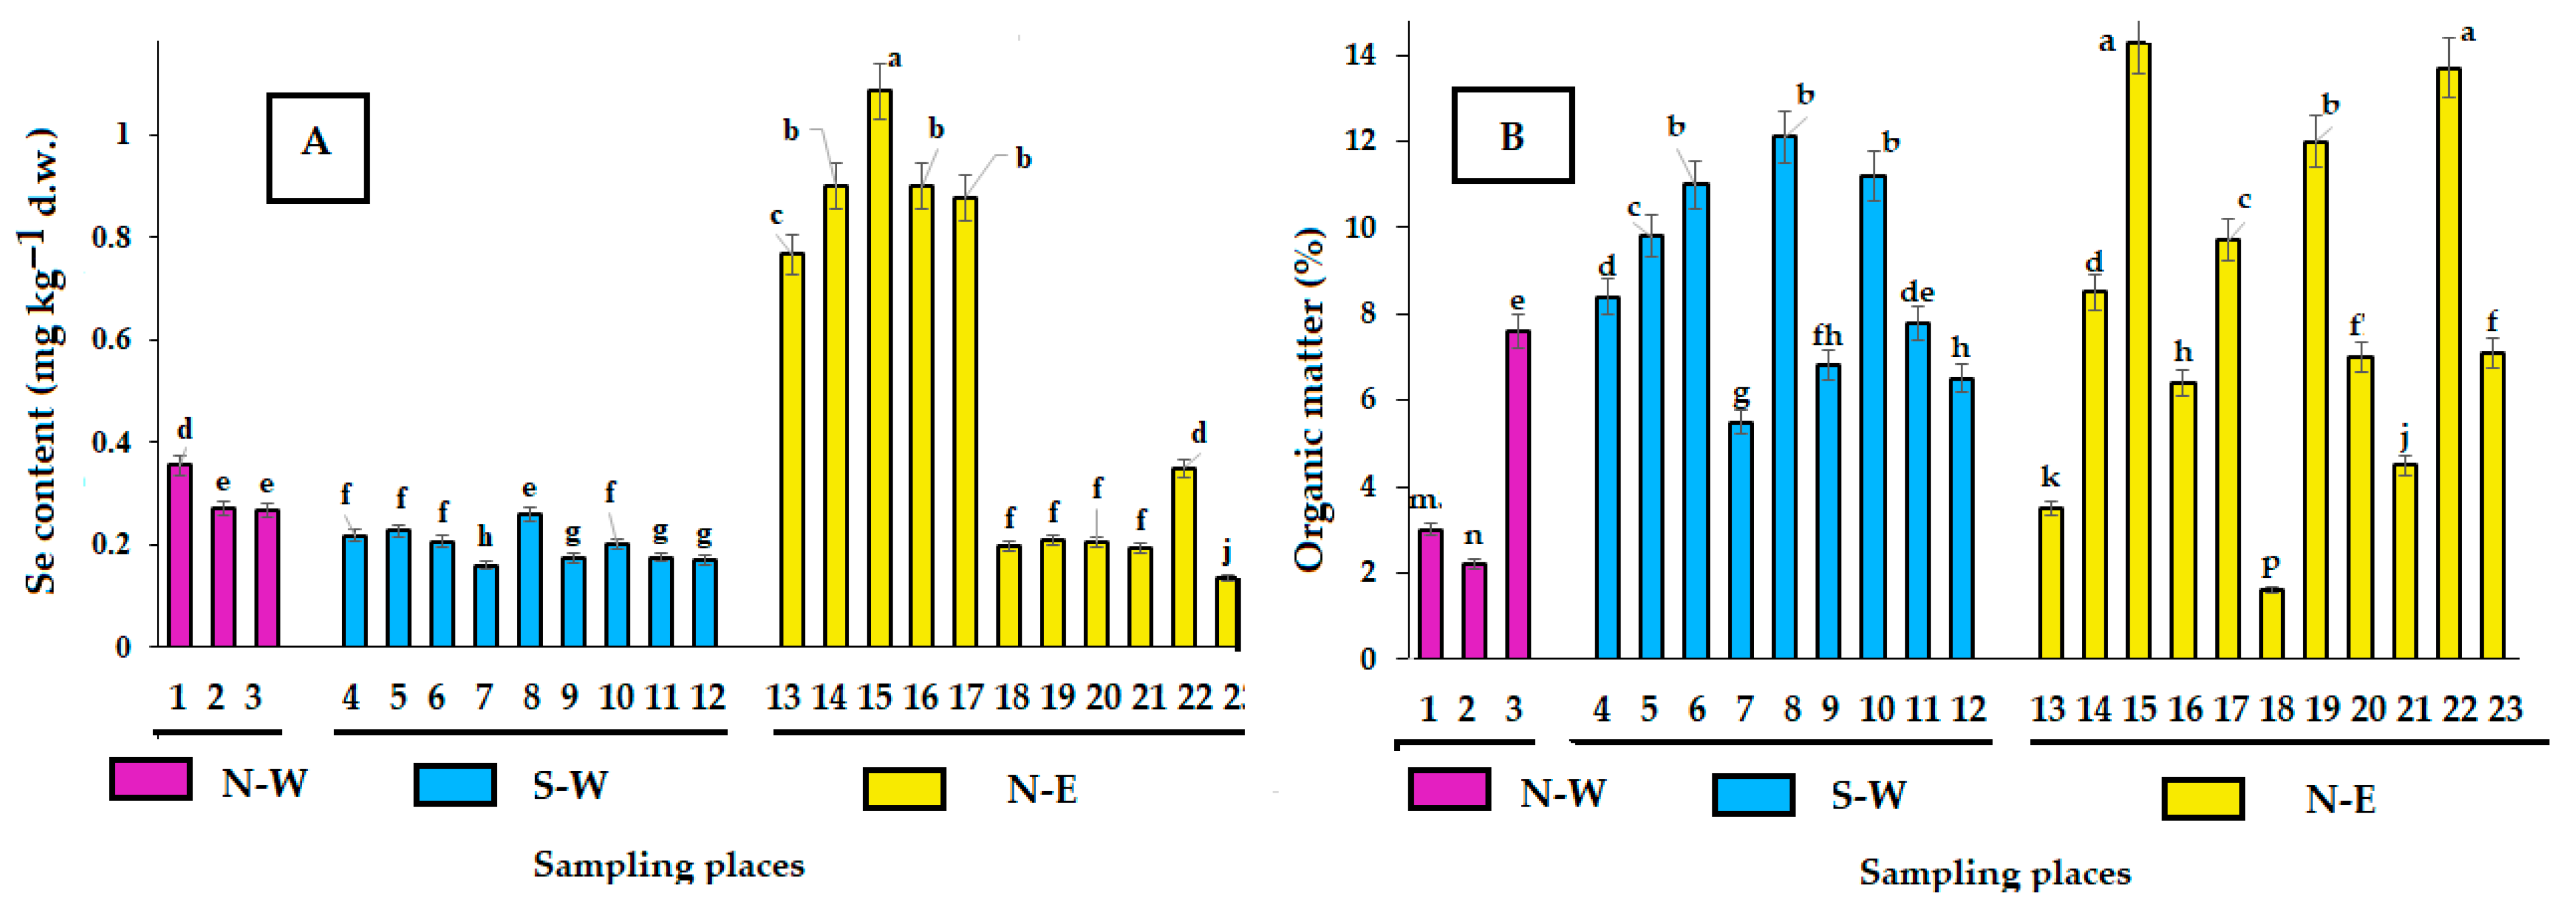
The evaluation of Se distribution revealed high geographical heterogeneity with the predominance of Se concentration in the north-eastern vicinity of Pechenganikel plant (Figure 3A; Supplementary Table S2).
The highest concentrations of Se (767–1085 µg kg−1 d.w.) were recorded within 0.8–3.3 km from the smelting plant, exceeding those of far remoted territories by 4–5 times. The phenomenon relates to the predominance of N-E wind and may be indirectly connected with the area of biocrust development. Indeed, the abundance of Se in Cu, Ni, and S soil deposits [12] and its antagonism with the three mentioned elements in living organisms [44] may be beneficial for biocrust formation, decreasing heavy metal toxicity [13].
The results entail low selenium leaching in conditions of existing environmental pollution and insignificant air transfer, contrary to the known intensive sulfur oxide emissions [3]. Acidic soils are known to promote selenite (+4) formation and Se adsorption on Fe and Al oxides, which significantly decrease Se mobility [45], while a lack of vegetation excludes the biosynthesis of volatile methyl selenides. The narrow location of high soil Se does not cause additional ecological risks connected with the possible intensive oxidative stress occurrence due to Se toxicity [46], as the Se concentrations detected were within the safe soil concentration range [47]. Low soil Se levels in remote territories (within 160–220 µg kg−1 d.w.) are in accordance with the known abundance of low Se in the Arctic. The general Se association with soil organic matter (Figure 3B; Supplementary Table S2) [47] entails the existence of a positive correlation between the two mentioned parameters, which was recorded only along the S-W direction (Figure 4).
The latter phenomenon demonstrates the geographical peculiarities of the tested territories, suggesting the need for separately determining the characteristics of the three chosen wind directions.

3.1.2. Nitric Acid Extraction

The extraction of soil samples with 3% nitric acid resulted in significant heterogeneity of mineral content values not directly connected with the distance from the Pechenganikel smelting plant, contrary to the total content decrease in the tested element with the distance augmentation from the plant recorded at Pechenganickel in 2014 [3]. In the present study, the mean Ni concentrations decreased from the N-W (107.5 mg kg−1 d.w.) to the S-W (57.6 mg kg−1 d.w.) and to the N-E (32.6 mg kg−1 d.w.) directions, with the corresponding CV values of 49.6%. 112.5%, and 105.1%, respectively (Supplementary Table S3). Similar trends were recorded for Co, Zn, and Cu levels, while Fe values showed the lowest CV variations.
The highest levels of Ni of 162–168 mg kg−1 d.w. were detected 2.6 km N-W and 10.8 and 50 km S-W from the Pechenganikel smelting plant. The highest concentrations of Cu (75–83 mg kg−1 d.w.) were recorded 2.6 km N-W; 3.8, 11.6, 49.5, and 50 km S-W; and 1.1 and 3.3 km N-E. High levels of soil Co (12–14 mg kg−1 d.w.) were measured 2.6 km N-W and 10.8 km S-W from the plant. The highest Pb concentration in soil was detected 1.1 km N-E, at the experimental plot with imported soil. Despite the absence of vegetation along the N-E direction, significantly lower levels of soil heavy metals soluble in diluted nitric acid were recorded.
In the mentioned conditions, several correlations between soil elements were revealed (Table 1). Indeed, in the N-E area, negative correlations between the distance from the plant and Se and Zn content were recorded, while positive correlations regarded Ni–Co; Cu–Pb, Zn, Se; Pb–OM (organic matter); and Zn–Se. Interestingly, among the heavy metals tested, only Pb showed significant correlation with OM content, which entails the existence of competition between elements for OM adsorption [48]. Contrary to the N-E direction, S-W soils displayed positive correlations of OM with Fe and Se, and of Se with Fe. Further examples of geographical variations in Se and other element behavior include significant correlations of Se with Cu and Zn, Zn with the distance from the smelting plant, and Se and L, along the N-E direction, as well as Fe and Co, and Se and Fe along the S-W direction. Nevertheless, the Ni–Co strong correlation did not depend on the sampling location, which is in accordance with the abundance of Ni–Co soil consortium [49].
Supposedly, the S-W area shows intensive Se adsorption on Fe oxides and OM, which is in accordance with soil Se properties [47].

3.1.3. Ammonium Acetate Buffer

Unexpectedly, the rather chaotic distribution of soil elements extracted with diluted nitric acid in the N-W, S-W, and N-E directions from the smelting plant showed no correlations with the results of the buffer extraction (Supplementary Table S4). Furthermore, the obtained results did not confirm the literature reports about the ubiquitous higher extraction ability of 3% nitric acid compared to the buffer application [20]; the latter situation may relate to the peculiarities of Arctic conditions and specific interactions between elements in highly polluted areas.
Notably, the ammonium acetate buffer application for heavy metal extraction elicited several significant correlations between the elements and the distance from the Pechenganikel smelting plant, compared to nitric acid extraction (Supplementary Table S4, Figure 5 and Figure 6).
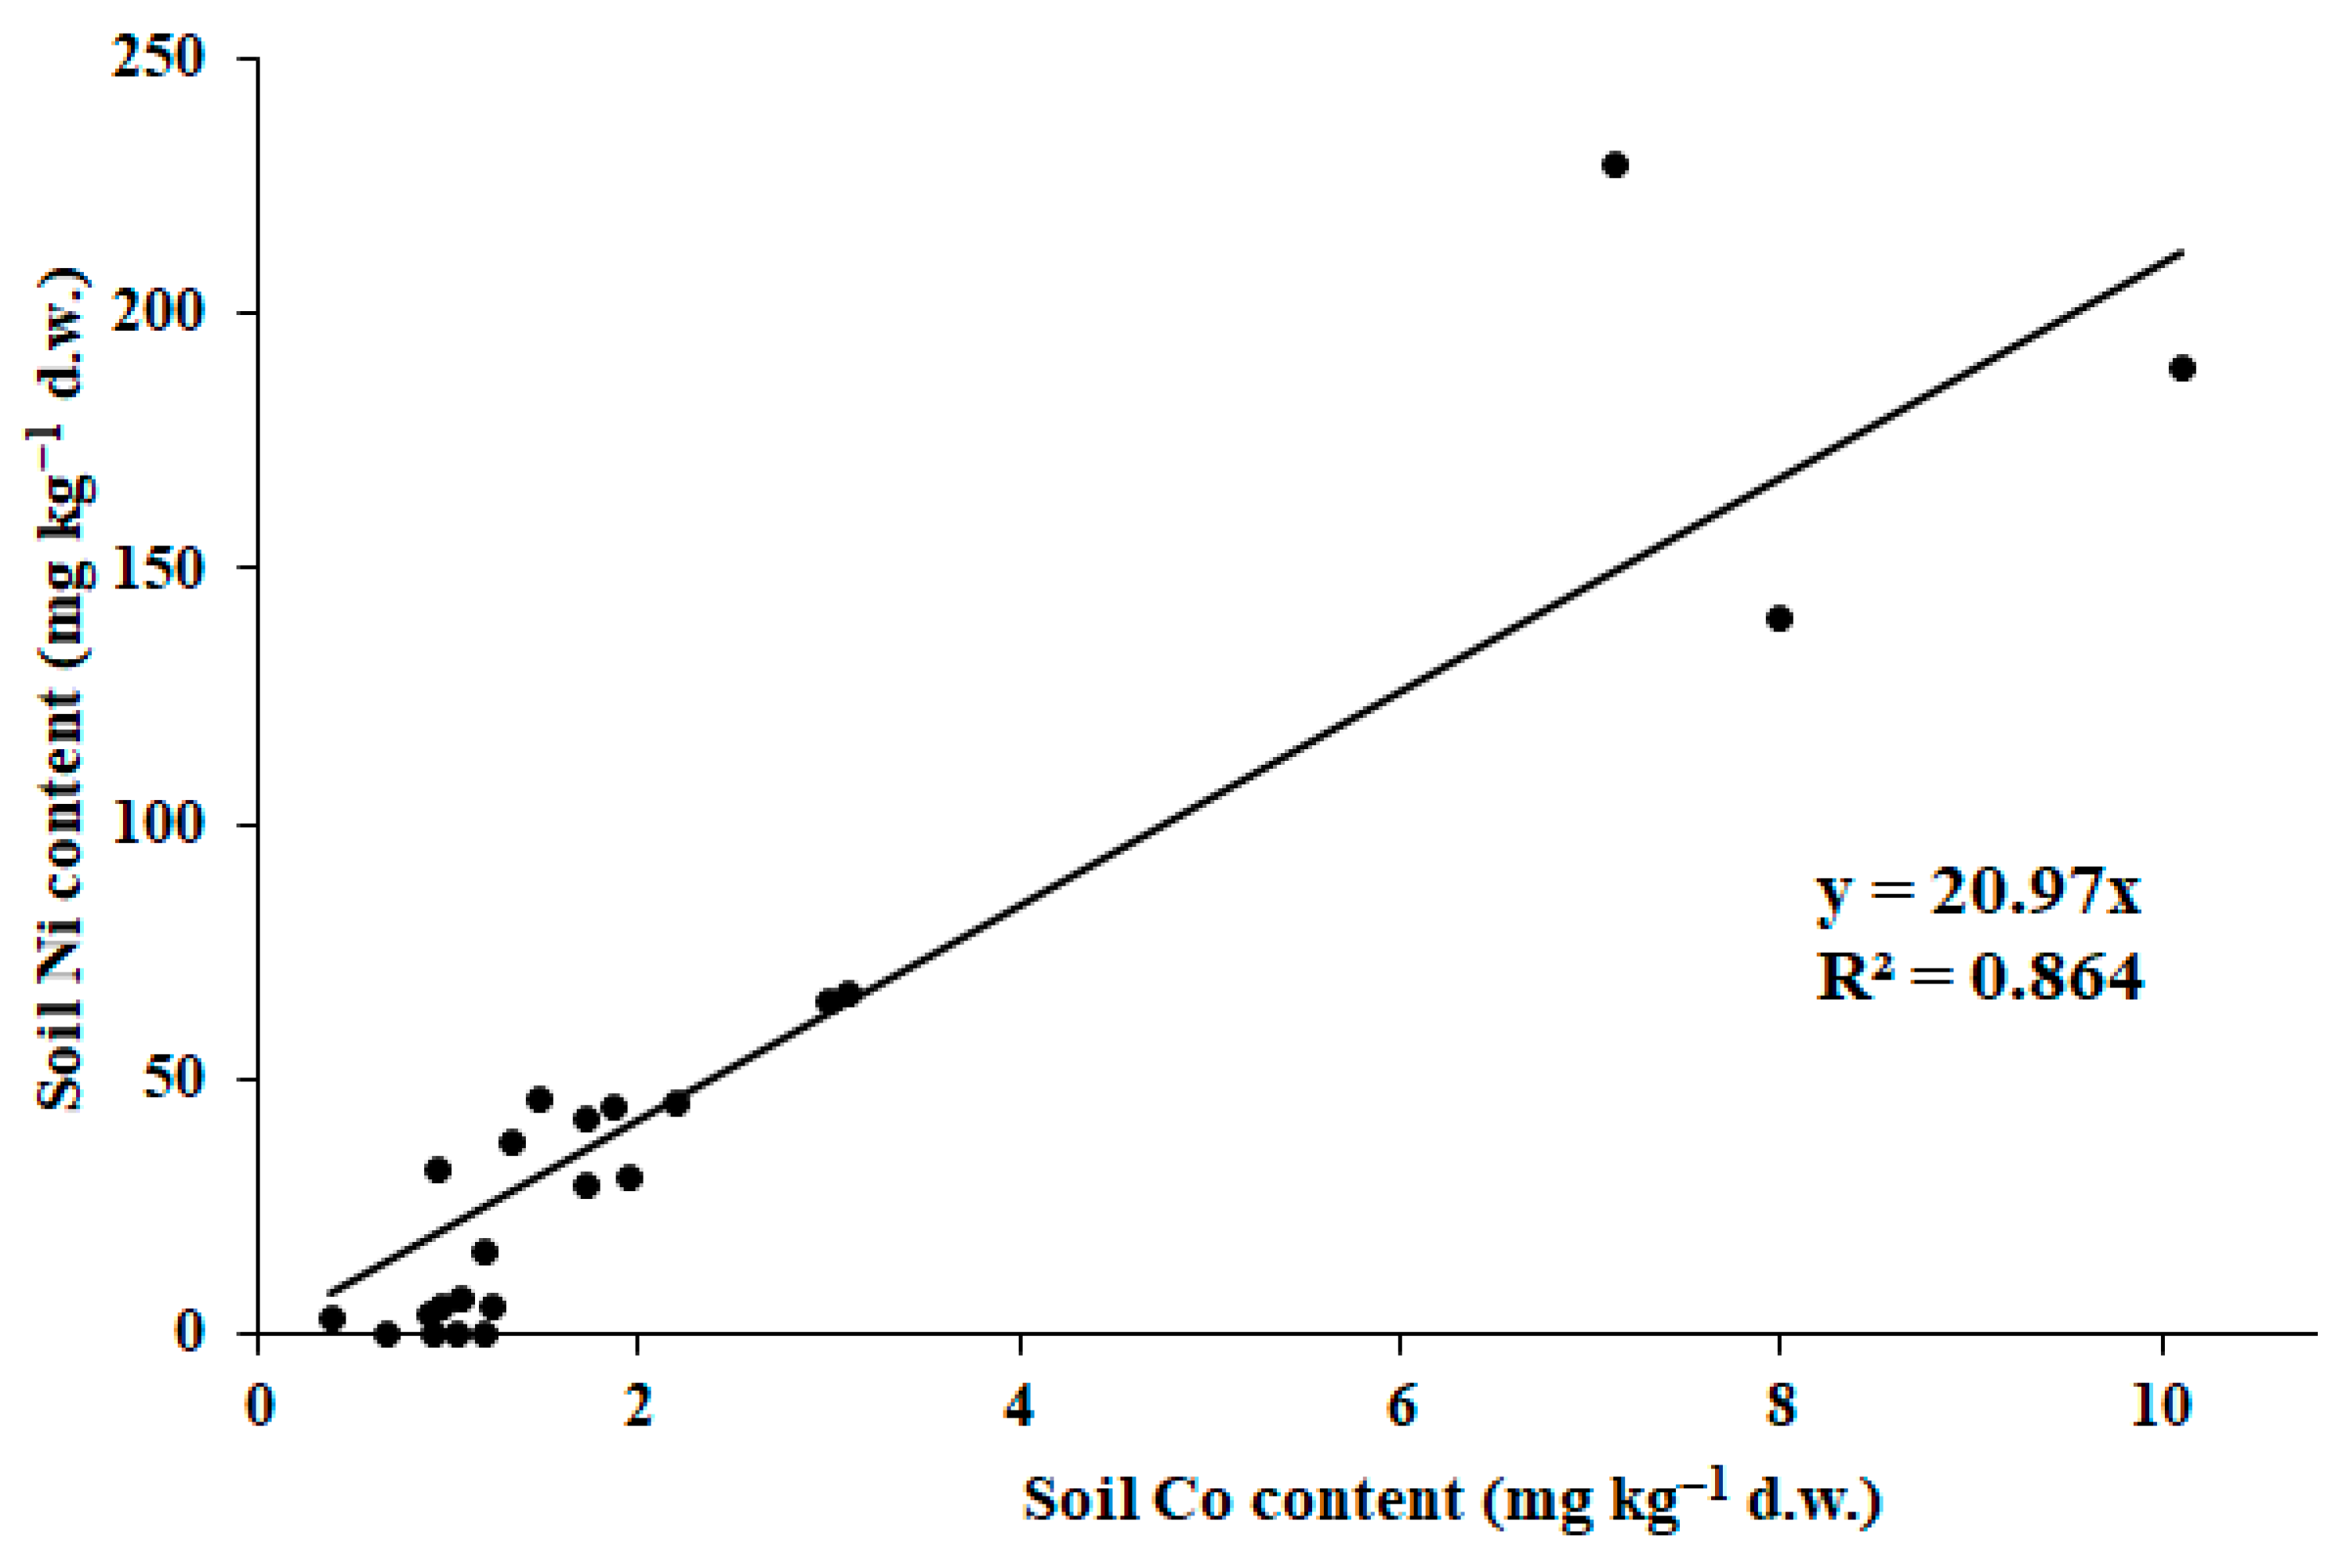
However, only upon ammonium acetate extraction were strong correlations revealed between soil Cu content and the distance from the smelting plant (Figure 5A), soil Ni and Co (Figure 6), and soil Cu and Se (Figure 5B) throughout the area investigated. The detected correlations were in accordance with the previously reported relationships between Ni and Co [50,51], and Cu and Se [12].
The results of the present investigation indicate that, in general, referring to the N-E direction, a higher number of correlations was recorded between the elements and between the elements and the distance from the smelting plant, compared to the corresponding correlations along the S-W direction (Table 2). Indeed, the N-E direction was characterized by significant Zn correlations with all tested elements, while Se recorded correlations with L, Cu, Co, Fe, and Zn, contrary to the S-W direction showing strong interactions of Se with only Ni, Cu, and Co. Only the Ni–Cu–Co relationships did not depend on the direction from the smelting plant (Table 2).
Special attention should be paid to Se and OM correlations, which were statistically significant along the S-W direction but not the N-E direction. Similar trends were recorded for Se–Ni and Ni–L relationships, with strong interaction in the S-W and insignificant interaction in the N-E (p > 0.05). In contrast, strong correlations between Se and Fe were recorded in the N-E, but they were absent in the S-W.
These results entail more intensive interactions between the elements examined, in the case of the ammonium acetate extraction technique, and the interactions are especially significant along the N-E direction under the highest environmental pollution.
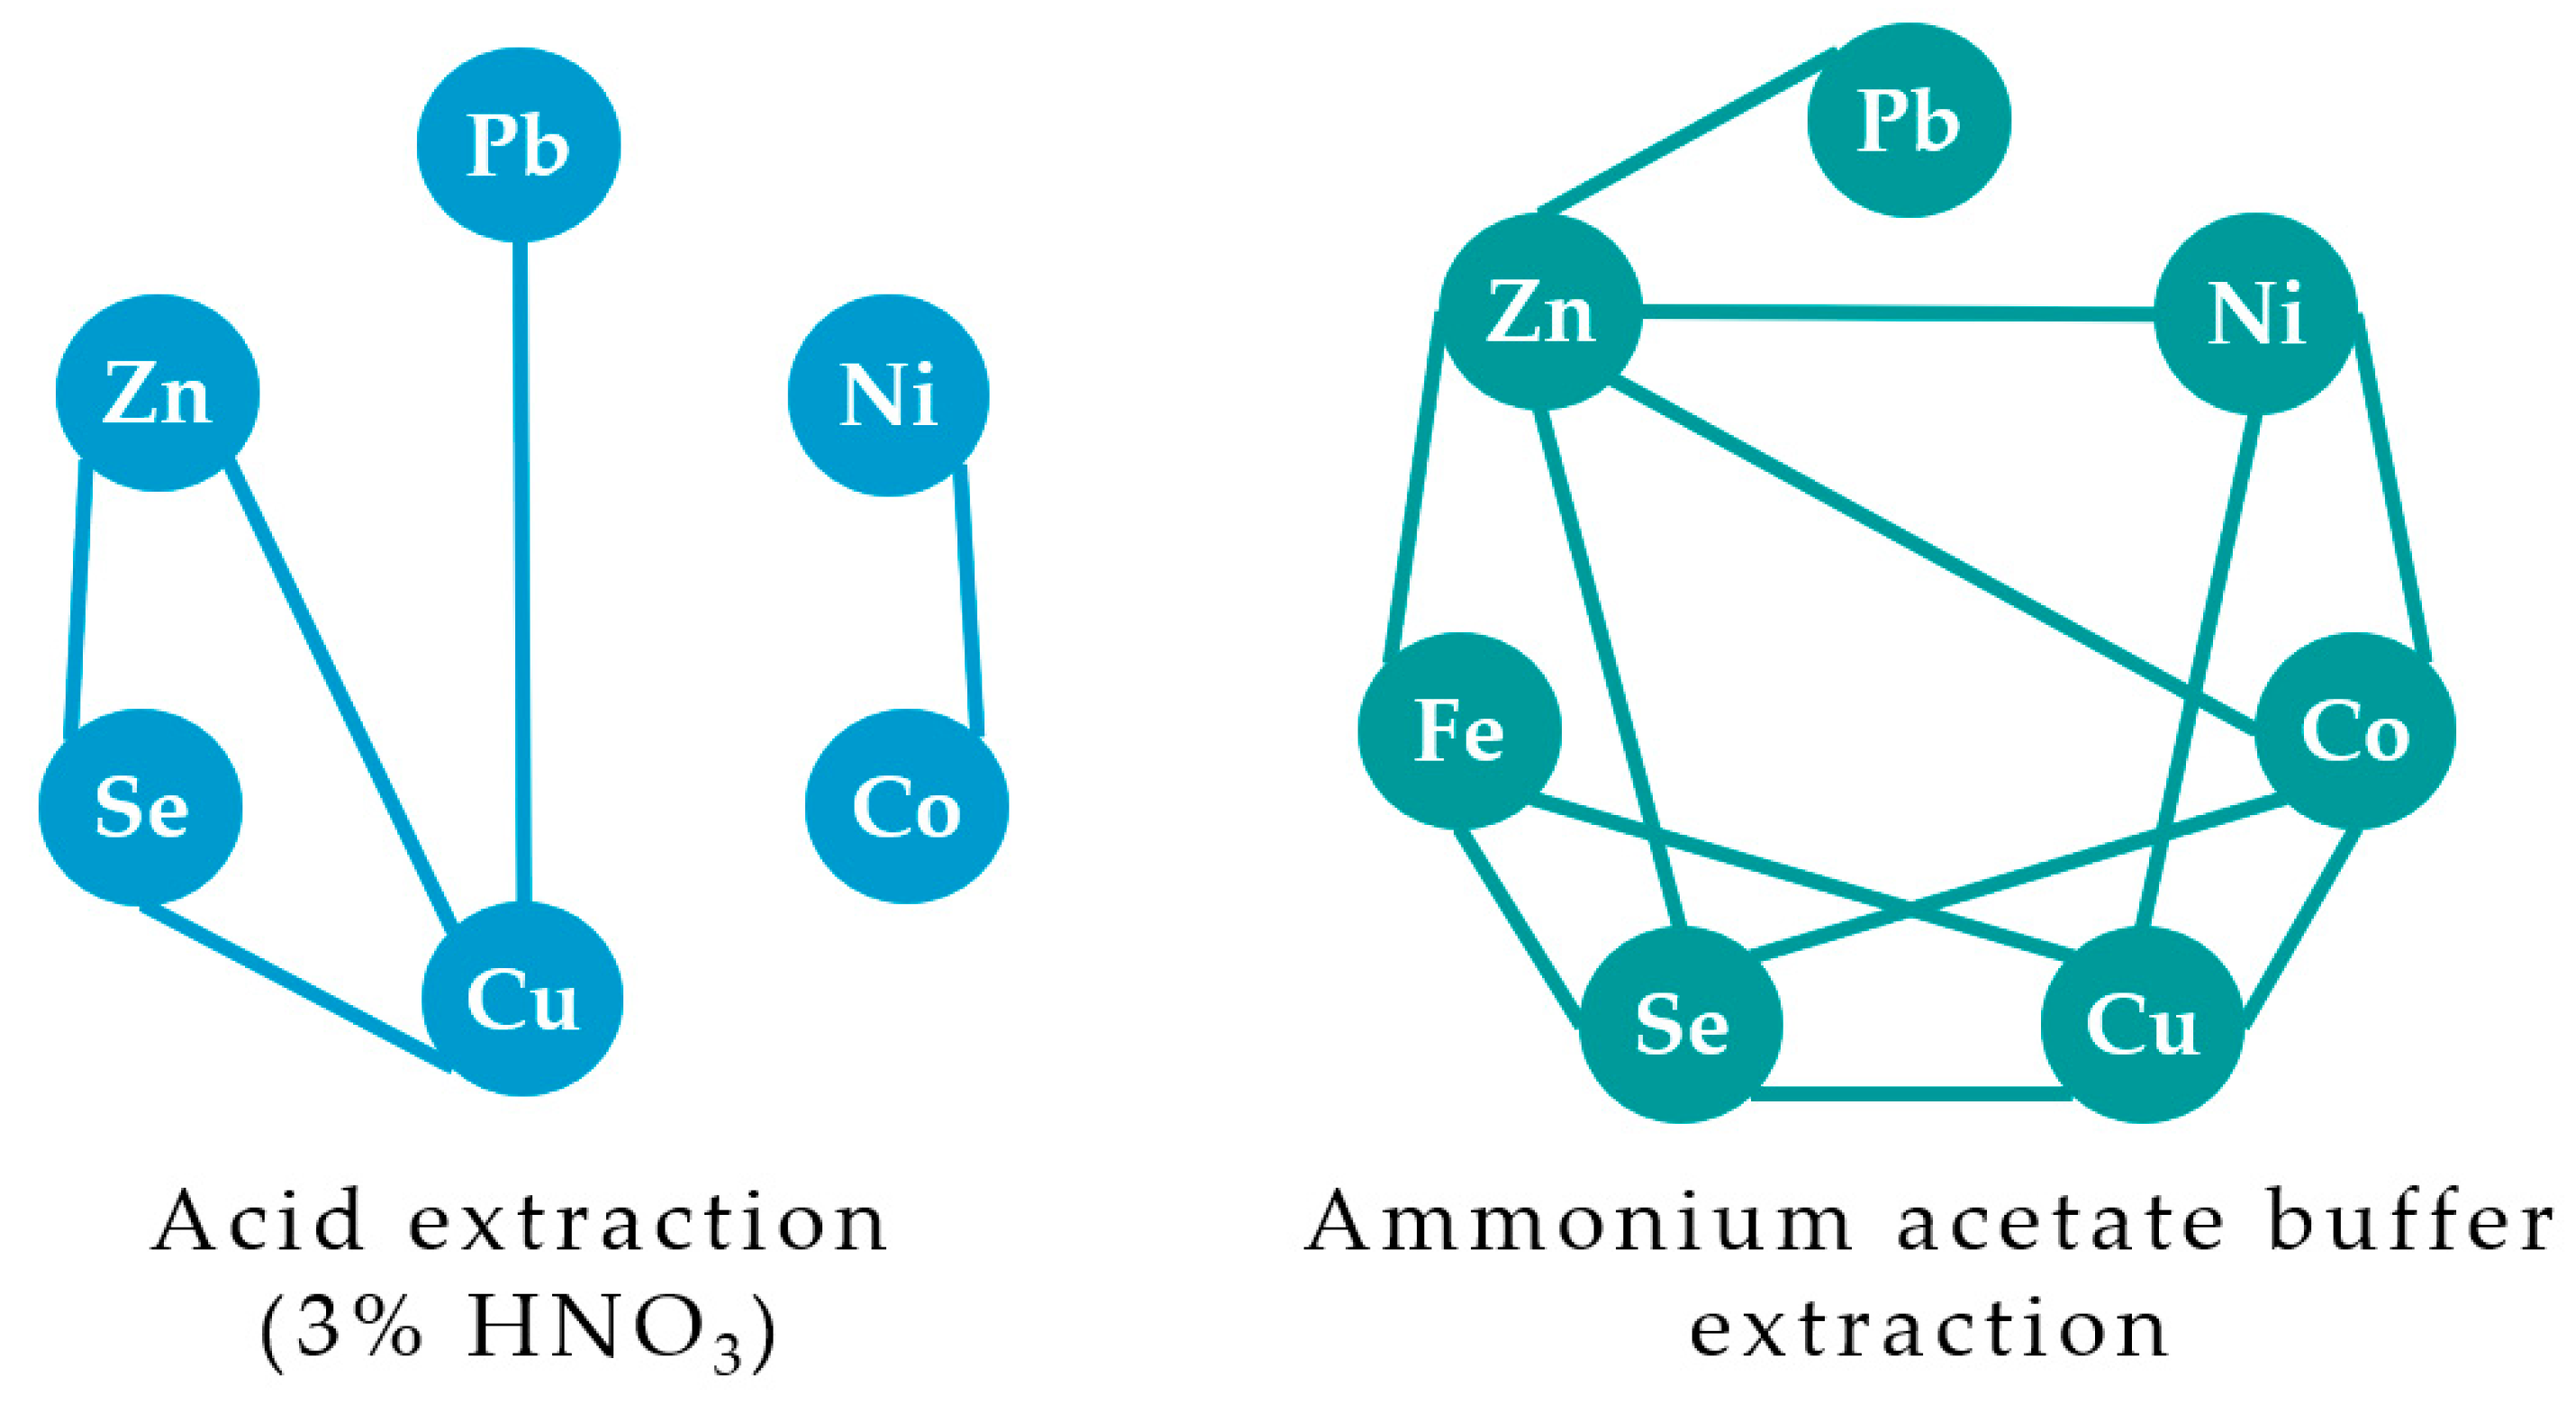
Figure 7 summarizes the relationships between soil minerals recorded in the N-E area, both in the case of nitric acid and ammonium acetate buffer application. The number of correlations between the elements decreased, in the case of ammonium acetate buffer application, according to the sequence Zn > Cu > Se > Co, Ni, Fe > Pb, and was in the range of five links (Zn) to one (Pb).
Furthermore, Ni–Co, Se–Zn, Se–Cu, and Zn–Cu exhibited significant correlations both in the case of nitric acid and ammonium acetate buffer utilization.
From the correlations between the elements tested at all 23 sampling places, significant differences between the two extraction methods applied arose (Table 3).
The results indicate that the ammonium acetate buffer method for soil extraction allows to distinguish the most active and bioavailable forms of mineral elements, also suggesting a complex effect of the latter on soil characteristics [52,53,54]. The buffer extracting fraction belongs to the mobile extractable aliquot, and the content of elements in it reflects the toxicological character of polluted soils [23,55,56,57]. As the effect of ammonium acetate buffer on different metal derivatives shows significant variations, this phenomenon causes serious difficulties in interpreting their mobility in soils. The buffer provides complexations and ion exchange. It has been shown that the more stable element complexes there are in acetate buffer, the more significant the distribution of the mentioned process in metal extraction from soil. It is also known that the acetate buffer can extract more minerals than in the case of separate utilization of the acetic acid and ammonium. The latter phenomenon suggests that the acetate buffer can extract not only mobile forms but also metal derivatives of low sorption [23].
Overall, the results obtained indicate soil excess of the total mineral content of both Ni and Cu, but not Co (112 mg kg−1, 35 mg kg−1, and 50 mg kg−1, respectively), compared to the average world regulatory guideline values [49].

3.2. Biocrusts

The obtained results pose the question of which soil fraction shows the strongest effect on biocrust growth and development.
Biocrusts represent a fine example of the so-called ecological ‘Edge effect’, with the presence of extraordinary (odd) edge species representing a buffer zone offering protection to the bordering ecosystems from possible damage [58]. The ecological significance of biocrusts is reflected in their wide distribution along all continents of the Earth [59], being the primary point of biosphere development. The vicinity of Pechenganikel smelting plant represents a wide N-E desert area where only biocrusts exist among living beings.

3.2.1. Biocrust Mineral Composition

Though it is practically impossible to completely separate biocrusts and soil, because the former contains soil particles in its composition, their mineral composition indicates a great ability to accumulate high levels of toxic elements (Supplementary Table S5). The investigation of Fan et al. [25] showed increased levels of minerals in the underground fraction of biocrusts, which is in accordance with the present results.
The obtained values significantly exceeded those referring to the mineral content in nitric acid and buffer extracts by 9.6–11.8 for Ni, 4.4–10.5 for Cu, 7.4–10.8 for Co, 50.3–9.0 for Pb, 7.7–7.1 for Zn, 2.8–4.1 for Fe, and 5.8 for Se.
As a consortium between soil and living organisms, showing unusually high ability to accumulate minerals, biocrusts of the Pechenganikel environment demonstrated significant correlations between the elements tested (Table 4), with the highest correlation coefficients recorded for Ni with Cu and Co, Zn with Co and Pb, Fe and Cu, and Se and Pb. The intensity of Ni, Cu, Co, Fe, Pb, Zn, and Se accumulation by biocrusts was inversely correlated with the distance from Pechenganikel plant, with the highest correlation relevant to Co.

3.2.2. Biocrust Antioxidant Status

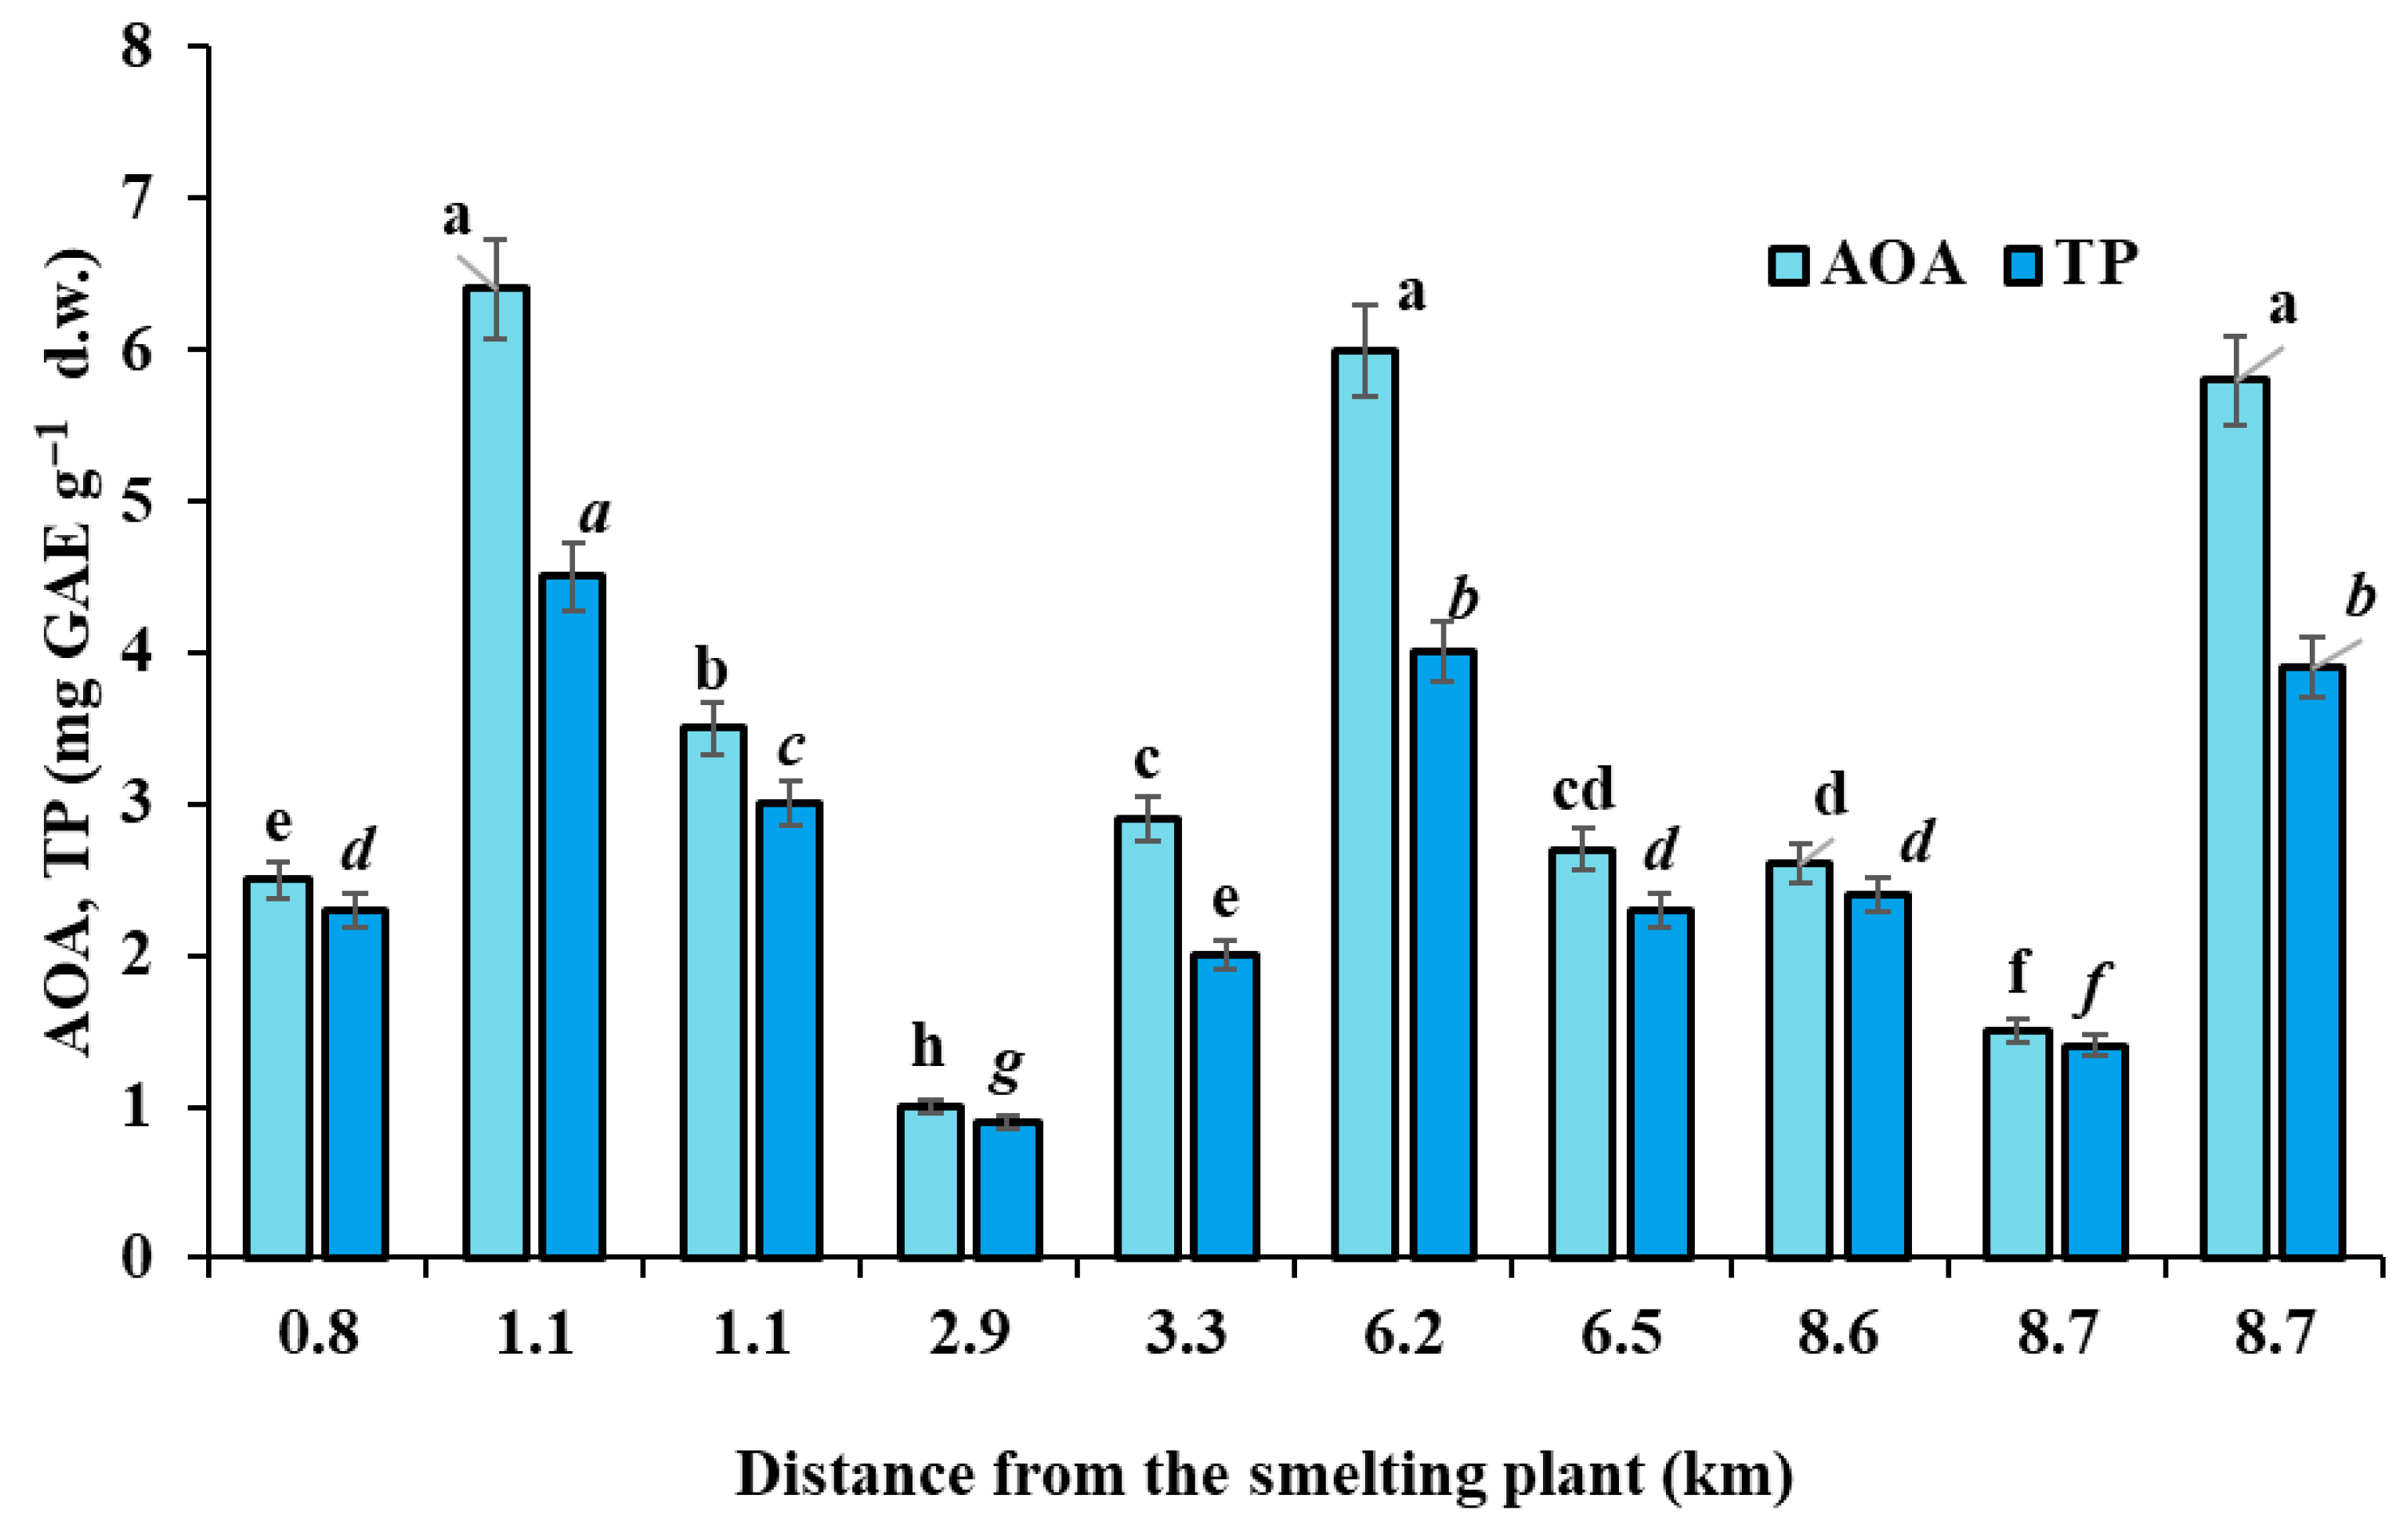
Another typical characteristic of biocrusts is their antioxidant status; i.e., they contain polyphenols (TP) and show antioxidant activity (AOA) due to their biological components (Figure 8; Supplementary Table S6).
Biocrust antioxidant activity and TP levels in 2024 were 2.3 and 1.2 times lower than those recorded in separate biocrust samples from 2023 [60]. The differences between the 2023 and 2024 results may relate to the three times lower precipitation levels in 2024 compared to 2023, as biocrust activity greatly depends on water availability [61]. The levels of AOA and TP in plants are usually affected by the intensity of environmental stresses, which stimulate the biosynthesis of natural antioxidants [62]. The obtained data (Figure 8) indicate a decrease in AOA and TP values only within small distance intervals: 1.1–2.9 km and 6.2–8.7 km. However, further investigations are needed to reveal the reasons for this phenomenon.
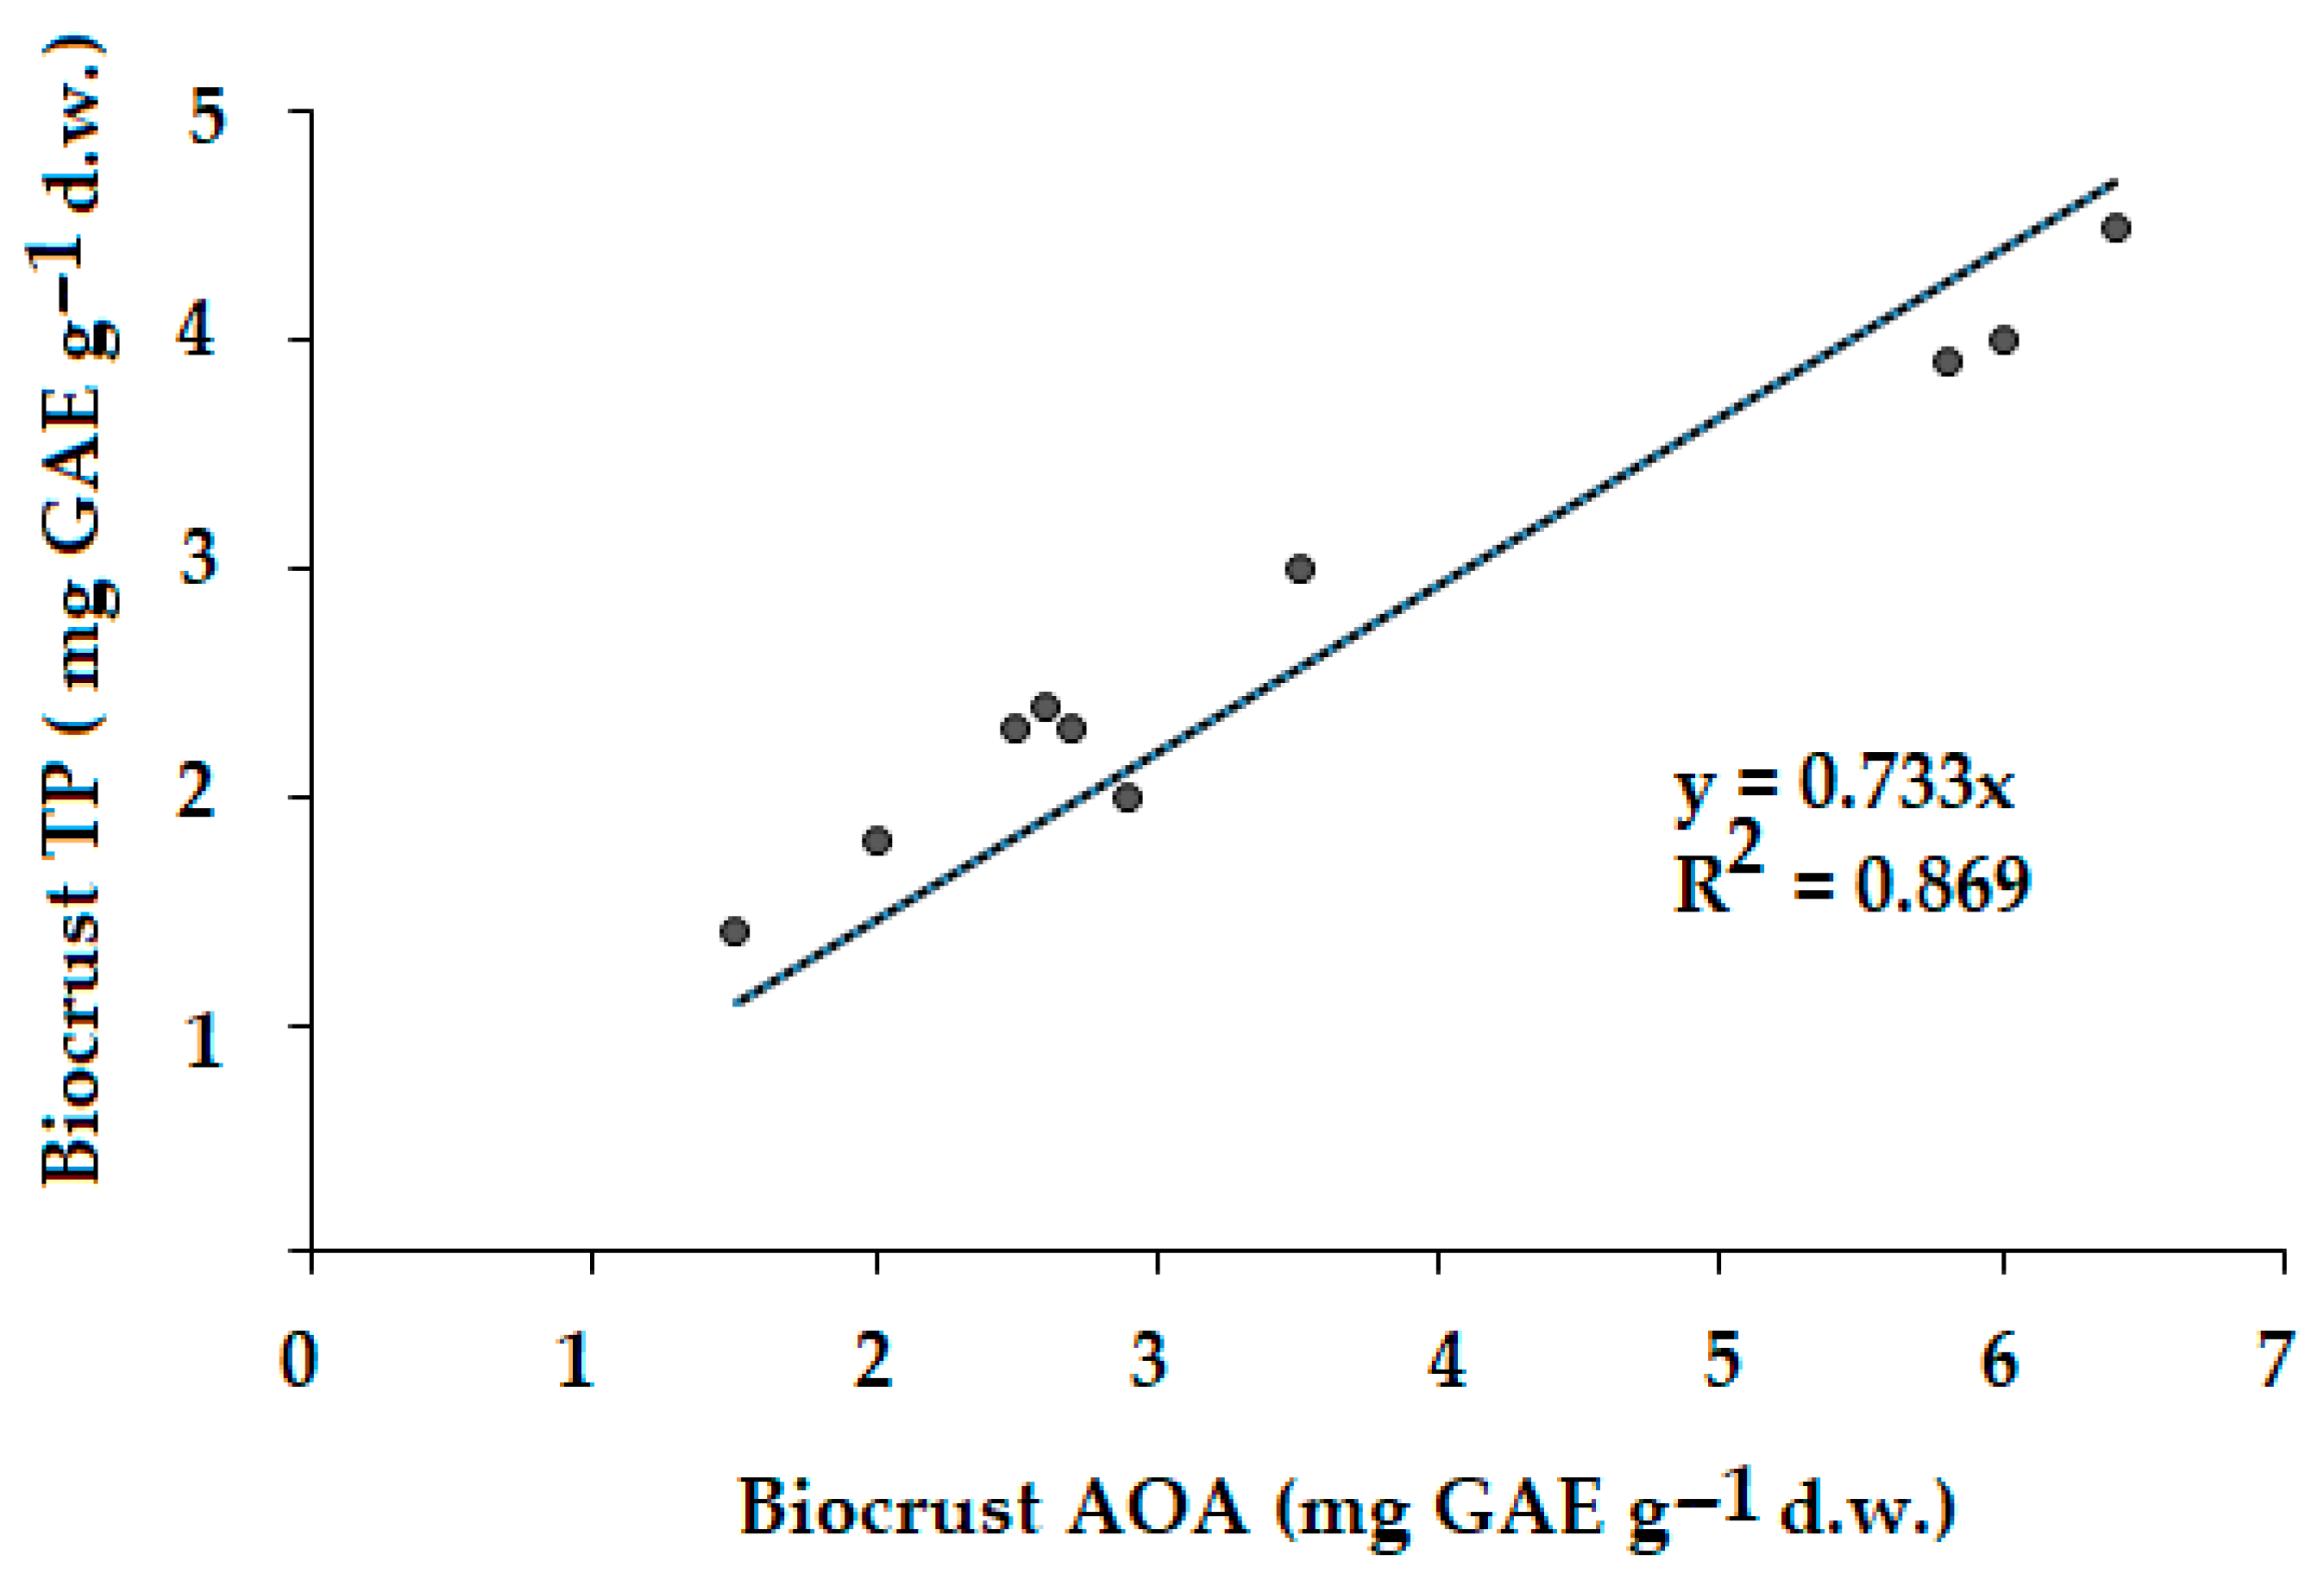
A strong correlation was recorded between AOA and TP in biocrusts (r = 0.932, p = 0.001; n = 10) (Figure 9), which is in agreement with the previous reports relevant to numerous plant species [22,59].
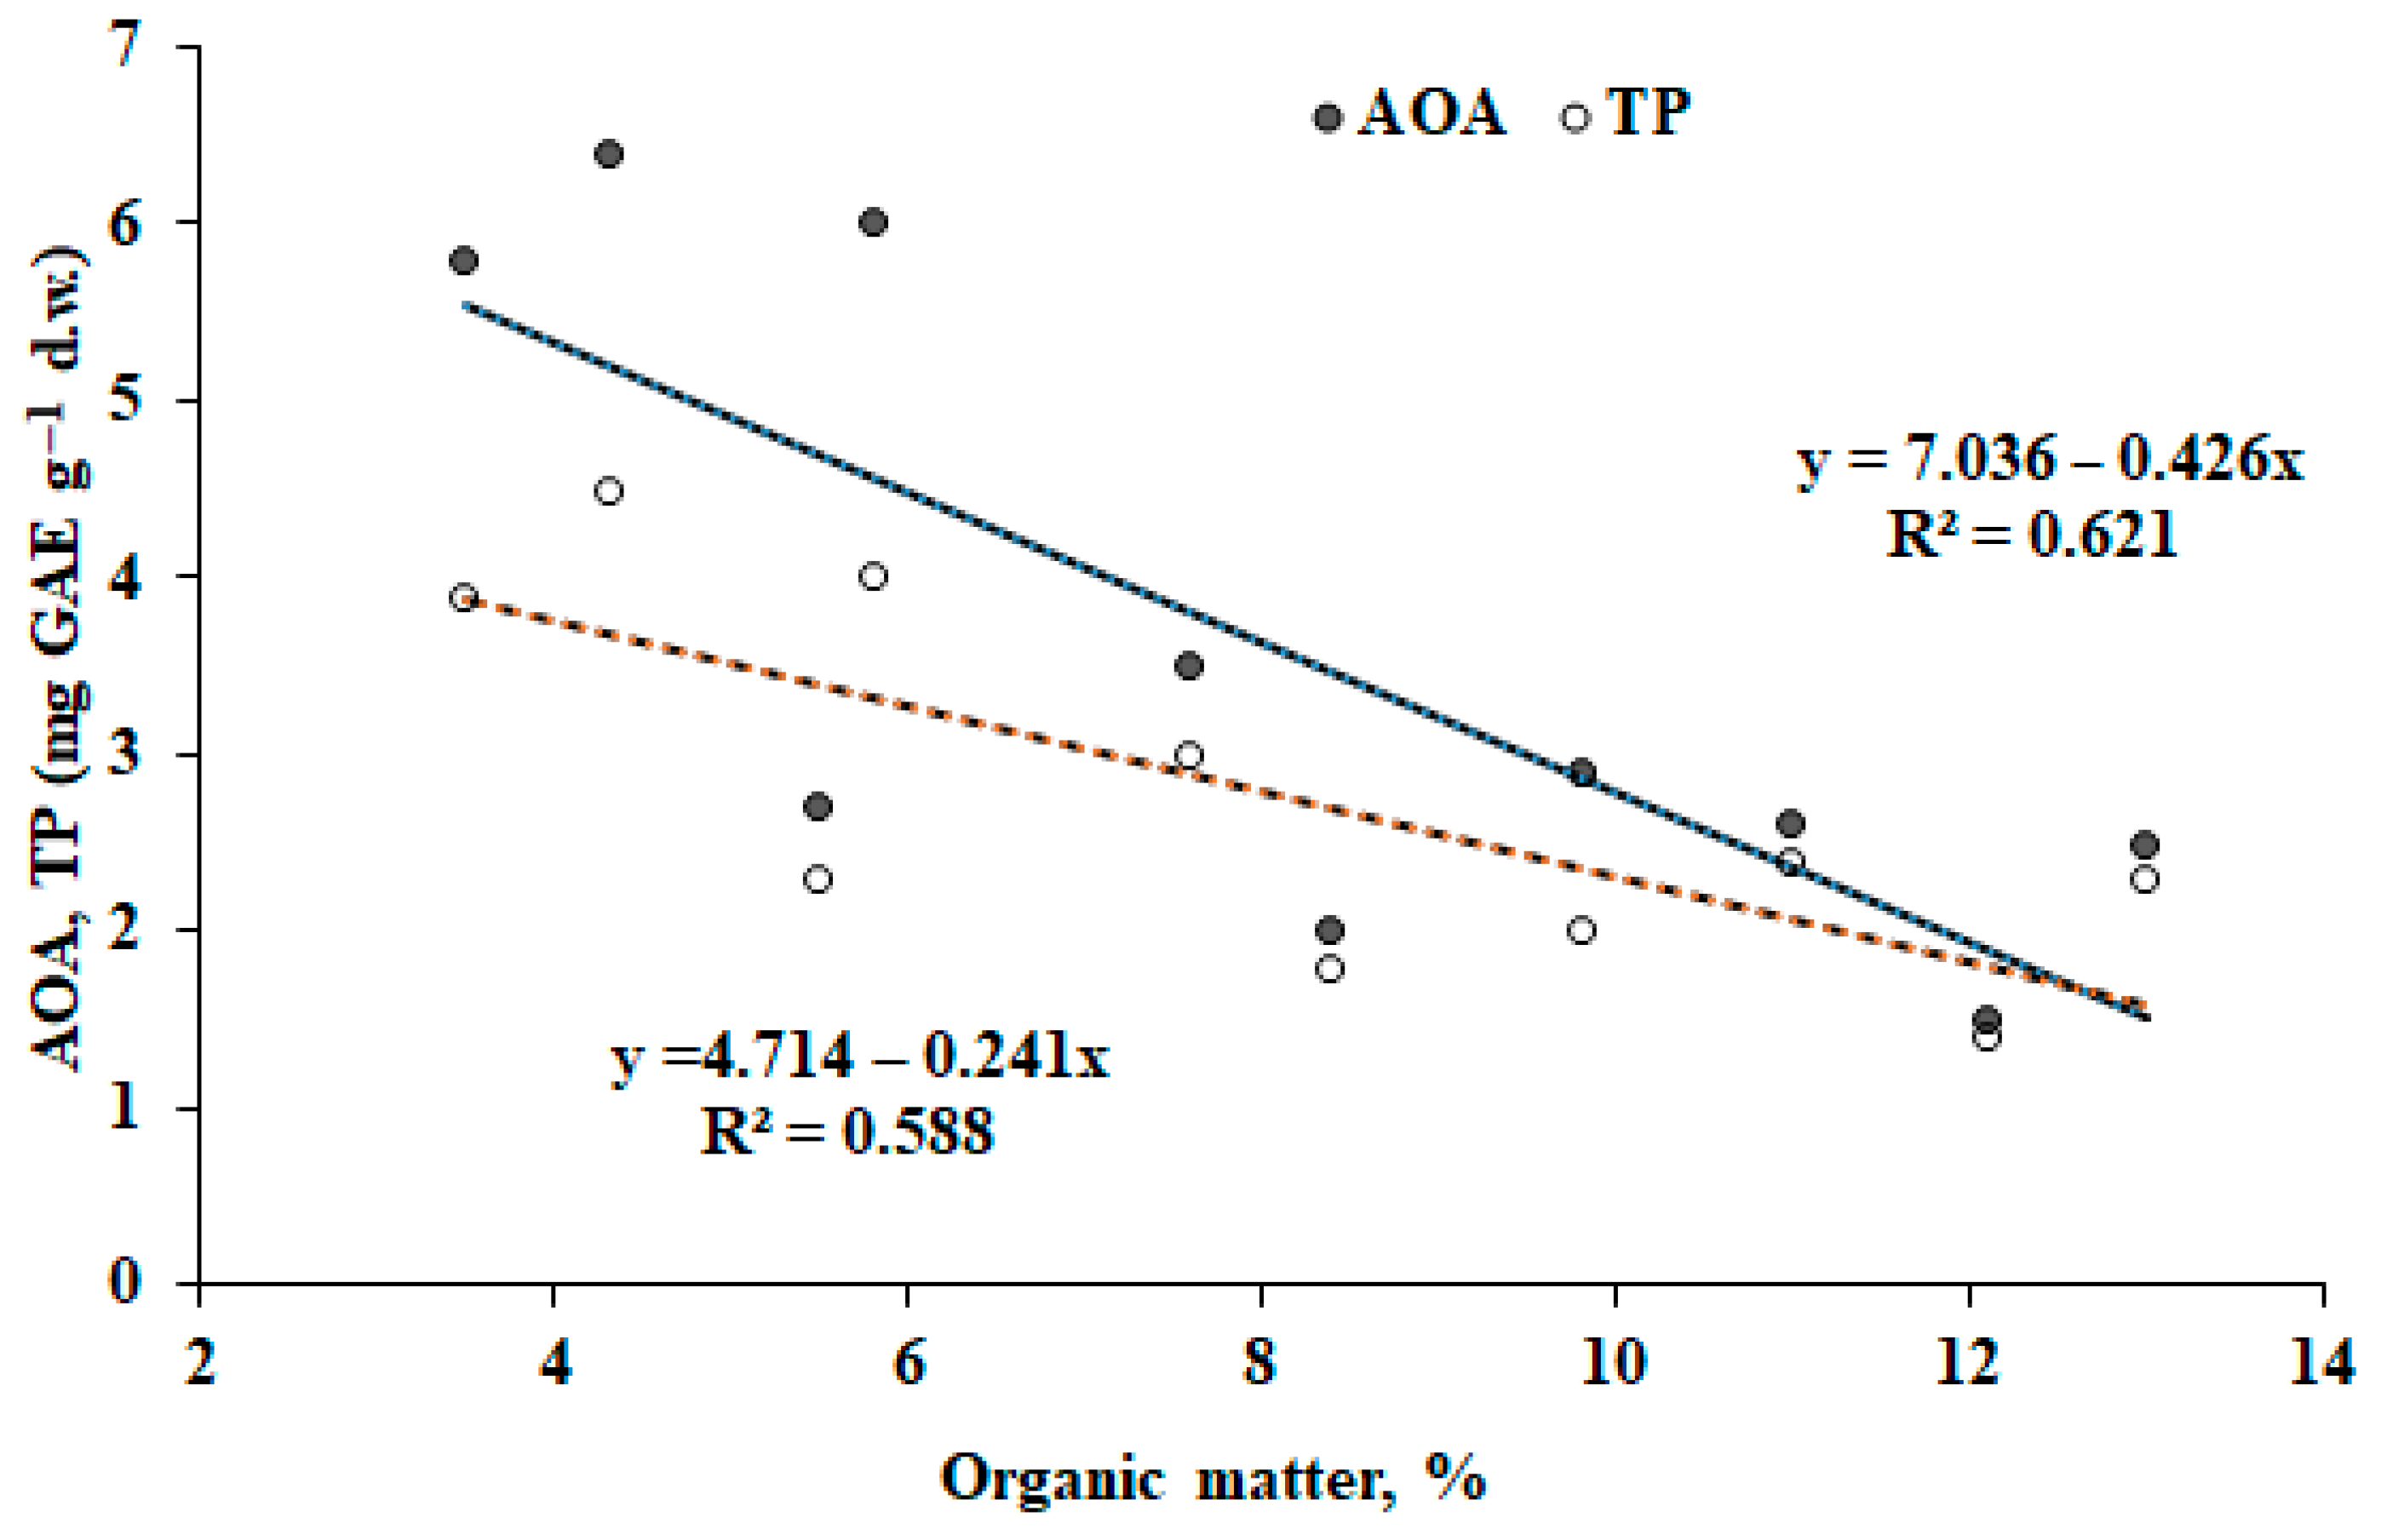
Taking into account the soil characteristics in the vicinity of Pechenganikel plant, we succeeded in identifying only the negative correlations between biocrust total antioxidant activity and polyphenol content with soil organic matter (Figure 10), suggesting that organic matter is the important factor affecting biocrust development. It may be supposed that organic matter deficiency in soil promotes another stress in biocrusts, in addition to heavy metal uptake, causing the intensification of antioxidant biosynthesis.
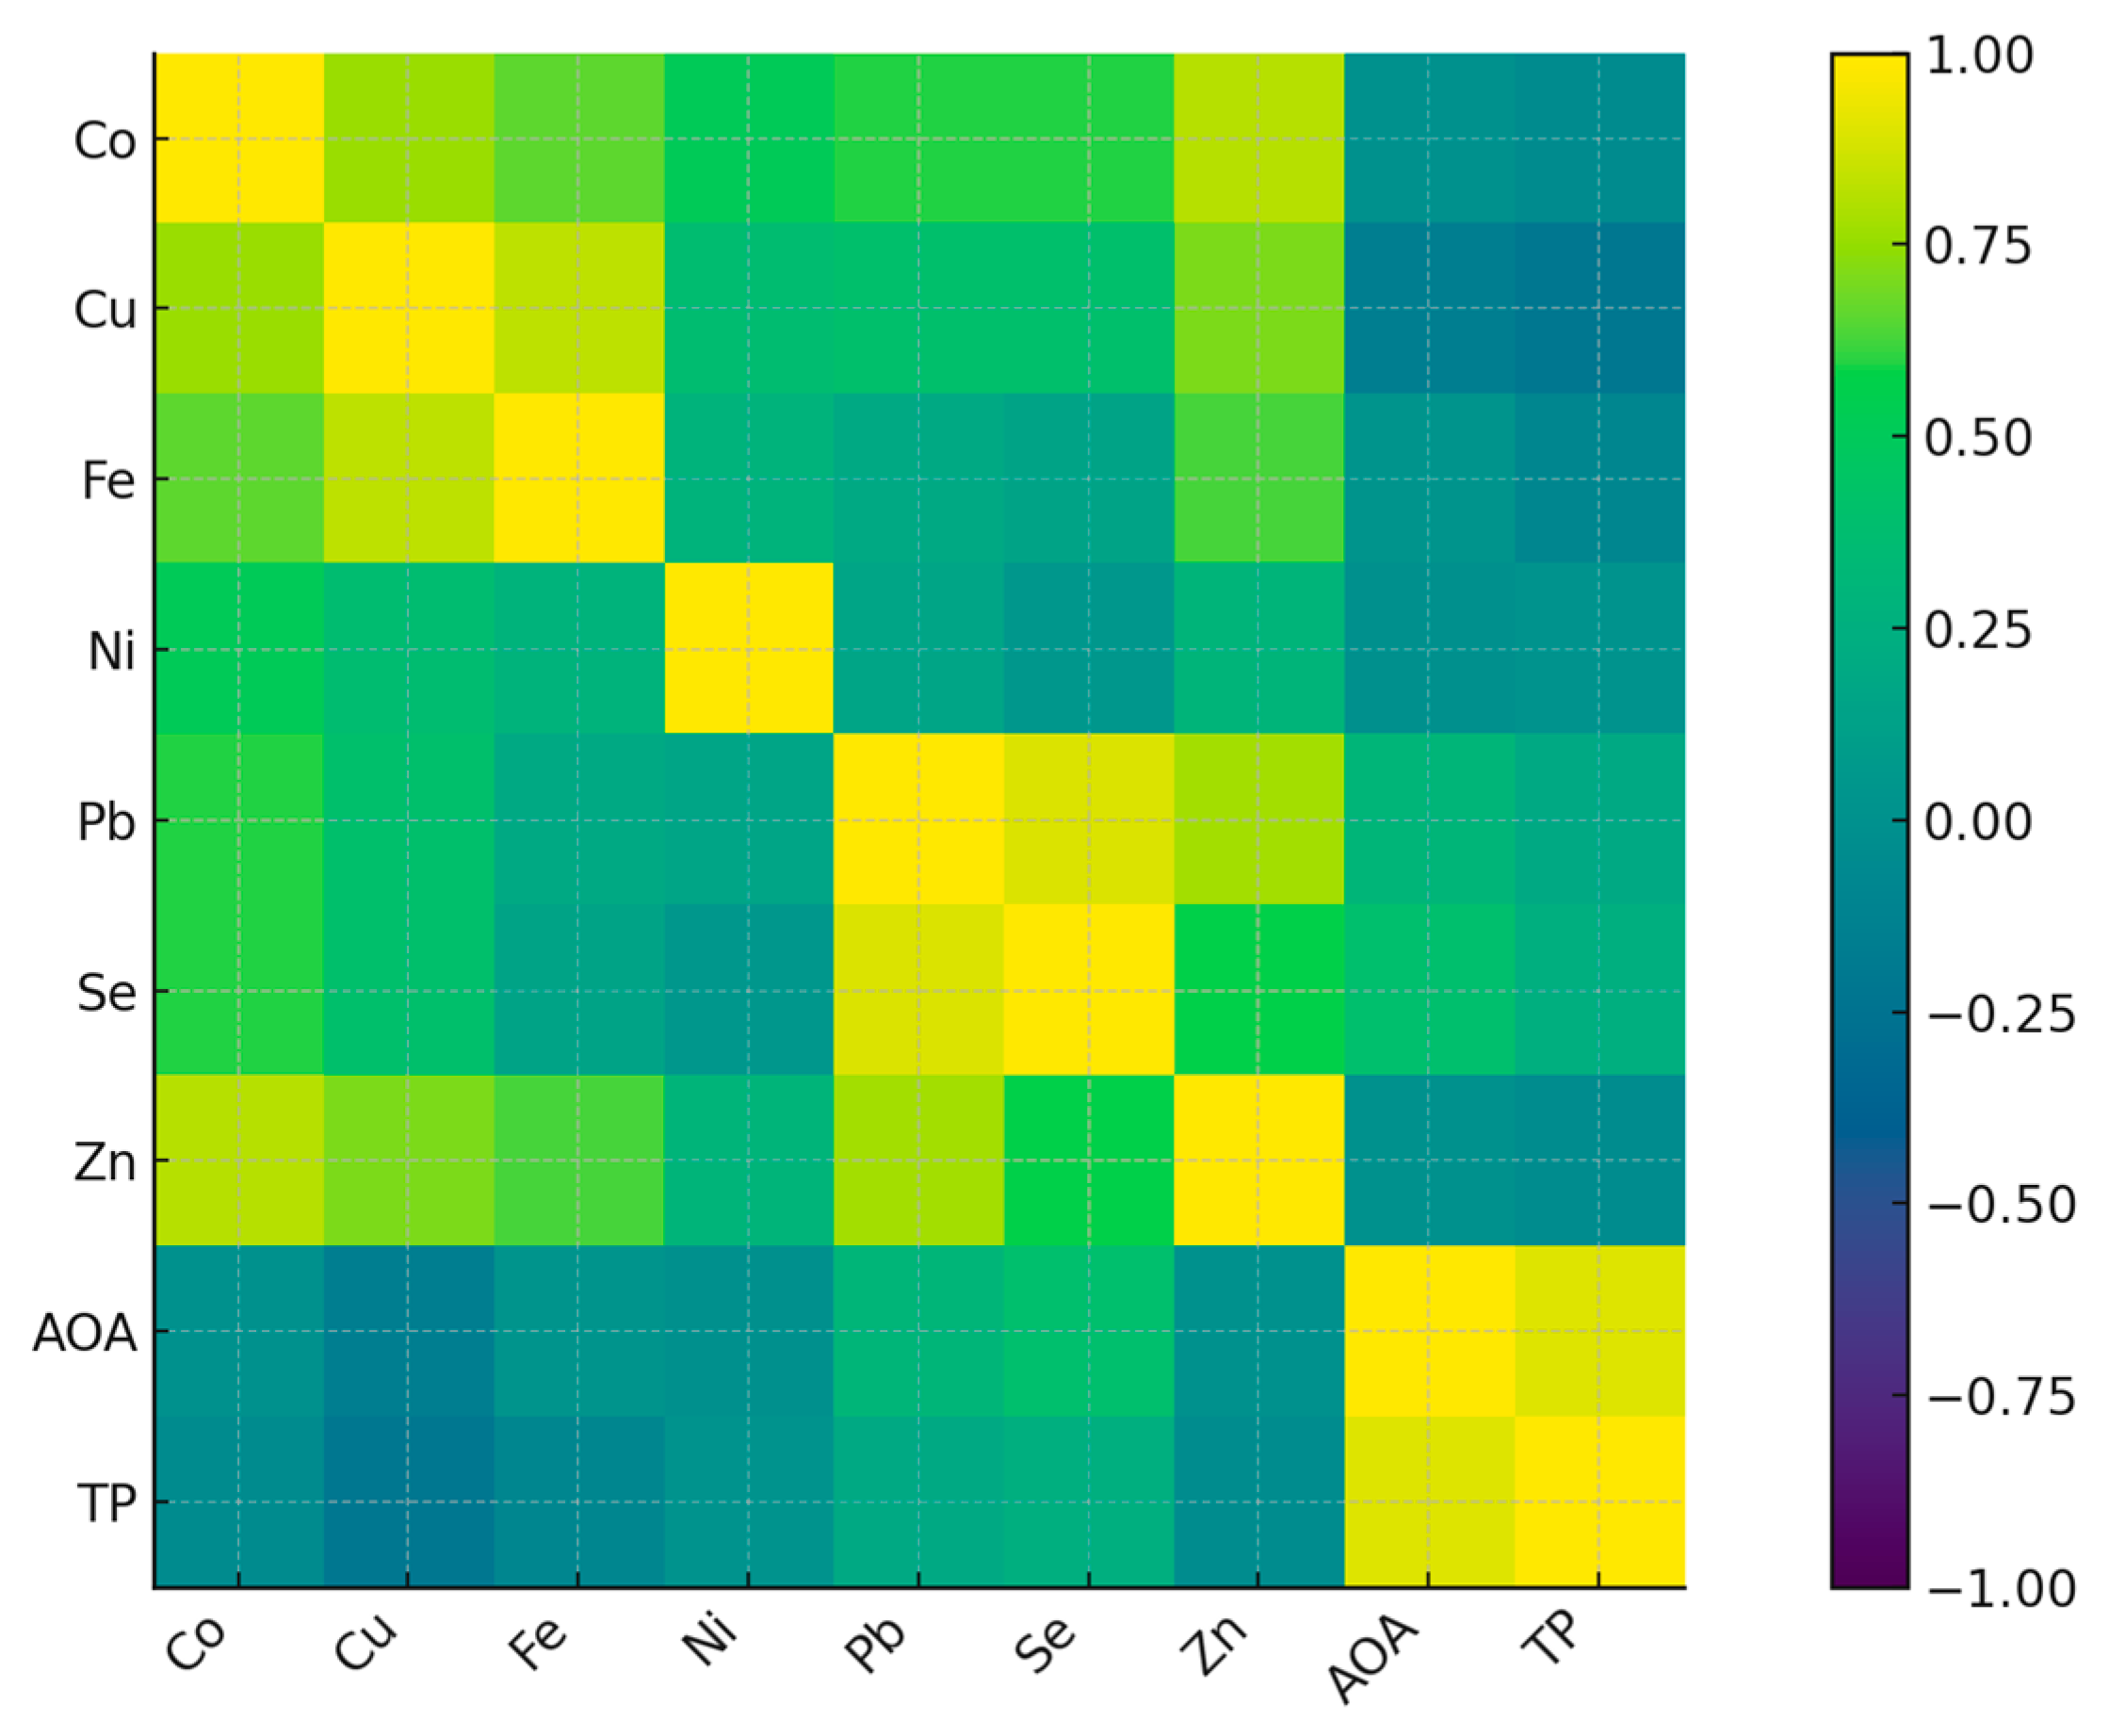
The correlation analysis revealed that most metals in biocrusts exhibit positive associations with each other (Figure 11). The strongest correlations were found between Cu and Zn (r = 0.78, p < 0.01, q < 0.05) and Cu and Pb (r = 0.74, p < 0.05, q ≈ 0.06), reflecting their joint accumulation under conditions of anthropogenic impact. A high correlation was also recorded for the Zn–Pb pair (r = 0.71, p < 0.05), though the significance was borderline after correcting for multiple tests. The metals Ni and Fe form a separate cluster of moderate associations (r ≈ 0.45–0.55, p < 0.1), which did not reach statistical significance after FDR correction. However, they indicate similar sources or mechanisms of accumulation in the biocrust.
The functional biocrust indicators, AOA and TP, did not show close relationships with metal concentrations; all Spearman’s coefficients were low (|r| < 0.3) and statistically insignificant (p > 0.1; q > 0.2). Therefore, unlike the consistent accumulation of metals, AOA and TP reflect independent factors related to the state of the microbial community and the productivity of the biocrust rather than the level of heavy metal contamination.

3.2.3. Biocrust–Soil Interactions

Being a complex organism comprising bacteria, algae, yeast, fungi, bryophytes, and soil, biocrusts can concentrate heavy metals within the soil upper layer [26], which confirms the existence of biocrust phytoremediation phenomenon. Analysis of mineral composition of deeper soil layers (8–12 cm) in the present work, along with the biocrust elemental profile assessment, provides the opportunity to clarify the soil–biocrust interaction in Arctic conditions.
In this respect, it is worth highlighting the significant differences between the nitric acid and the ammonium acetate buffer method (Table 5 and Table 6). Indeed, the HNO3 extraction led to significant correlations of biocrust Co levels with soil Cu, Zn, and Se content, and of biocrust Se and Pb with soil Cu levels; Ni–Co buffer extraction elicited a significant correlation of biocrust Co and Ni only with soil Cu and Fe. It is important that nitric acid caused a negative Ni (biocrust)–Co (soil acidic fraction) correlation, whereas no significant correlations arose between these elements (biocrust–soil) upon ammonium acetate buffer extraction.
Comparison of acidic/buffer results indicates significant differences in biocrust correlation with soil bioavailable components. The accumulation of Se, Pb, and Co in biocrusts correlates with the soil Cu acidic fraction, while that of Co is affected by soil Se. Ionic mobile forms of Fe in soil extracted by buffer influenced Co and Ni content in biocrusts. A schematic illustration of differences in biocrust–soil interaction in the cases of nitric acid and ammonium acetate buffer application (Figure 12) suggests that both methods of soil extraction are reliable for revealing biocrust–soil correlations in conditions of intensive anthropogenic pollution.
The presented results reveal the importance of soil Se and Cu content within the mineral composition of biocrusts along with the soil Fe ionic forms extracted by ammonium acetate buffer and less available soil Zn and Co upon diluted nitric acid extraction.

3.2.4. Mixed-Effects Modelling of Soil Element Pools and Biocrust Predictors

Mixed-effects models constructed for soil element pools revealed several significant patterns that remained after correction for multiple testing (Table 7).
A marked decrease in copper concentrations was observed with increasing distance from the emission source. This effect was particularly evident in the south-western direction. Additionally, positive influences of organic matter content and higher levels in NH4OAc extraction, compared to HNO3, were recorded. A significant negative slope of nickel along the distance gradient in the accessible fraction (NH4OAc) was observed, reflecting this fraction’s increased sensitivity to the spatial gradient of contamination. Selenium concentrations decreased with distance from the source and were lower in the south-western sector. Organic matter was positively associated with element content. Higher zinc values were found in the south-western direction and in interaction with the extractant, indicating a spatially heterogeneous distribution. In this respect, both distance effects and directional differences can be observed in soil pools, and organic matter plays an additional role in retaining individual elements.
The analysis of models of element transfer from soil to biocrusts revealed that the optimal predictor varies depending on the specific element and soil fraction type. The acid-soluble fraction produced the best results for nickel, copper, and zinc, while the NH4OAc extract produced the best results for cobalt, iron, lead, and selenium (Table 8).
The slope of the regressions between the concentrations in the biocrust and the corresponding soil pool was positive for all elements, confirming a direct relationship between the element content in the substrate and its accumulation in microbial communities. Significant additional effects of distance from the emission source (negative trends) and soil organic matter content (positive associations) were identified for several elements, suggesting the spatial and ecological conditioning of accumulation processes. When comparing alternative models, the AIC difference exceeded two units in most cases, confirming the robustness of choosing the best soil fraction as a predictor. Indeed, biocrusts sensitively reflect variations in both mobile and acid-soluble metal pools, and the nature of their response varies by element and is related to the pollution gradient and soil properties.

3.2.5. Soil–Biocrust Transfer Factors: Spatial Patterns and Drivers

Transfer factors (TFs), calculated as the ratio of biocrust to soil metal concentrations, revealed clear spatial patterns (Supplementary Table S7, Figure 13). Figure 13 illustrates the transfer factors (TFs) for nickel, copper, and zinc within biocrusts across a distance gradient from the emission source.
The TF values calculated for nickel, relative to NH4OAc, were more stable. However, when using the acid fraction, a gradual decrease was observed as the distance increased. Conversely, for copper and zinc, the regression lines indicated an increase in TFs along the gradient, more evident for HNO3 than for NH4OAc. Overall, Figure 12 demonstrates the differences in TF change with distance for different metals and soil pools, reflecting the heterogeneity of element behavior in the soil–biocrust system.
For Ni, mixed-effects models indicated a significant negative association between TFs (NH4OAc) and distance from the emission source (β = −0.07, q = 0.004), whereas HNO3-based TFs showed weaker and statistically non-significant gradients. The TF values for Cu decreased with distance in both soil pools, with the strongest effect observed in NH4OAc extracts (β = −0.06, p < 0.05), while the HNO3 fraction displayed a less pronounced decline. For Zn, a negative trend with distance was detected, particularly for NH4OAc, though statistical support was moderate (β = −0.04, p = 0.07). In contrast, Se and Co showed no consistent gradients, and TF values varied substantially among sites. Soil organic matter occasionally contributed positively to TFs, for example in Se (β = +0.02, q = 0.025); non-parametric tests confirmed the latter findings. Spearman’s correlations demonstrated negative associations of TFs with distance for Ni (NH4OAc, r = −0.52, p < 0.05) and Cu (HNO3, r = −0.47, p < 0.05), while no significant relationships were recorded after FDR adjustment with other elements.
The decrease in TFs for Ni and Cu with increasing distance highlights the role of local deposition in shaping relative metal accumulation in biocrusts. The stronger distance effects for NH4OAc-based TFs (e.g., Ni: β = −0.07; Cu: β = −0.06) emphasize the sensitivity of mobile soil fractions in explaining the transfer of metals to surface biota. By contrast, HNO3-based TF values were generally lower and less responsive to spatial gradients, consistent with their reflection of less mobile pools. The weaker or absent gradients for Zn, Se, and Co likely reflect lower deposition fluxes or stronger site-specific variability in uptake. The positive contribution of soil organic matter (Se: β = +0.020, q = 0.025) suggests that organic-rich substrates may enhance relative transfer by providing additional binding or exchange sites.
Overall, the TF analysis shows that biocrusts are not only sensitive integrators of spatial patterns of contamination but also distinguish between soil fractions, with NH4OAc pools yielding the most evident gradients. This confirms the value of TFs as an integrative metric linking soil contamination with biological accumulation and supports the use of biocrusts as effective bioindicators of technogenic pollution.

4. Conclusions

The consequences of Pechenganikel operation over decades revealed complex Ni, Cu, Co, Pb, Se, and Zn distribution both in soils and biocrusts, with correlations between the elements greatly affected by the soil extraction method. Local Se contamination in the vicinity of Pechenganikel plant and a positive correlation between Ni and Co, and Cu and Se upon the ammonium acetate buffer application are important environmental characteristics of the territory in 2024. Biocrust formation in conditions of intensive anthropogenic influence is directly related to the organic matter content in soil, while its accumulation abilities in Ni, Co, Se, and Pb are directly connected with soil mineral content, which demonstrates a complex relationship with soil Fe and Cu (buffer extract), Se, and Co and Zn (nitric acid extract). Further investigations are expected to deepen the study of the biocrust–soil interaction mechanisms in conditions of intensive environmental pollution.
The application of linear mixed-effects modelling and transfer factor analysis revealed significant spatial gradients in transfer factors for Ni, Cu, and Zn, with the strongest associations observed for NH4OAc-based fractions. This emphasizes the sensitivity of mobile pools in explaining biocrust–soil interactions; therefore, biocrusts serve as effective bioindicators of both absolute metal contamination and its bioavailable fractions.
Future studies are expected to address temporal changes in soil–biocrust metal dynamics, explore the role of microbial community composition in accumulation patterns, and integrate biocrust-based monitoring into regional environmental management frameworks.
Supplementary Materials

The following supporting information can be downloaded at: https://www.mdpi.com/article/10.3390/standards5040028/s1, Table S1. Soil sampling places and their geographical coordinates; Table S2. Selenium and organic matter content in soil samples; Table S3. Bioavailable forms of micro-elements in soil samples extracted by 3% nitric acid; Table S4. Bioavailable forms of micro-elements in soil samples extracted by ammonium acetate buffer, pH 4.8 (mg kg−1 d.w.); Table S5. Mineral composition of biocrusts (mg kg−1 d.w.); Table S6. Antioxidant status of biocrusts (mg GAE g−1 d.w.); Table S7. Transfer factors (TF) for metals in biocrusts relative to soil pools (NH4OAc and HNO3): summary of mixed-effects models and Spearman correlations.

Author Contributions

Conceptualization: N.G., O.K., and G.C.; investigation: N.G., S.S., A.K., U.P., and E.S.; methodology: M.A.; formal analysis: N.P. and O.K.; data curation: N.P. and V.L.; software: O.K. and D.T.; validation: N.G., E.S., and G.C.; writing original draft: N.G., S.S., and U.P.; writing, review and editing: N.G., S.S., and G.C. All authors have read and agreed to the published version of the manuscript.

Funding

Agreement№ 200-2023, 13.02.2023 ‘Comprehensive monitoring of ecosystems and their component biodiversity at the area neighboring Zapolyarny and Nikel of ‘Nornikel’ corporation and Pasvik Nature Reserve’. Sponsor ‘Kola Mining and Metallurgical Company’. T.I. Vyazemsky Karadag Scientific Station, theme № 124030100098-0 ‘Investigation of biotic and abiotic ecosystem components in different climatic conditions’.

Institutional Review Board Statement

This manuscript does not contain any studies with human participants or animals performed by any author.

Data Availability Statement

The data that support the findings of this study are available on request.

Acknowledgments

The authors express their gratitude to the Pasvik Nature Reserve and ‘Nornikel’ corporation for providing the opportunity to gather soil and biocrust samples at the territory investigated.

Conflicts of Interest

The authors declare no conflicts of interest.

References

  1. Xia, F.; Zhao, Z.; Niu, X.; Wang, Z. Integrated pollution analysis, pollution area identification and source apportionment of heavy metal contamination in agricultural soil. J. Hazard. Mat. 2024, 465, 133215. [Google Scholar] [CrossRef]
  2. Korneykova, M.; Vasenev, V.; Kozlova, E.; Soshina, A.; Nikitin, D.; Dolgikh, A.; Saltan, N. Microbial communities of urban and industrial polluted soils in the Russian Arctic. Geoderma Regional 2024, 39, e00890. [Google Scholar] [CrossRef]
  3. Evdokimova, G.A.; Mozgova, N.P.; Korneikova, M.V. The content and toxicity of heavy metals in soils affected by aerial emissions from the Pechenganikel plant. Eurasian Soil Sci. 2014, 47, 504–510. [Google Scholar] [CrossRef]
  4. Setia, R.; Dhaliwal, S.S.; Singh, R.; Singh, B.; Kukal, S.S.; Pateriya, B. Ecological and human health risk assessment of metals in soils and wheat along Sutlej river (India). Chemosphere 2023, 312, 137331. [Google Scholar] [CrossRef]
  5. Haghighizadeh, A.; Rajabi, O.; Nezarat, A.; Hajyani, Z.; Haghmohammadi, M.; Hedayatikhah, S.; Asl, S.D.; Beni, A.A. Comprehensive analysis of heavy metal soil contamination in mining Environments: Impacts, monitoring Techniques, and remediation strategies. Arab. J. Chem. 2024, 17, 105777. [Google Scholar] [CrossRef]
  6. Wu, H.; Yang, F.; Li, H.; Li, Q.; Zhang, F.; Ba, Y.; Cui, L.; Sun, L.; Lv, T.; Wang, N.; et al. Heavy metal pollution and health risk assessment of agricultural soil near a smelter in an industrial city in China. Int. J. Environ. Health Res. 2020, 30, 174–186. [Google Scholar] [CrossRef]
  7. Steinnes, E.; Lukina, N.; Nikonov, V.; Aamlid, D.; Royset, O. A gradient study of 34 elements in the vicinity of a copper-nickel smelter in the Kola Peninsula. Environ. Monit. Assess. 2000, 60, 71–88. [Google Scholar] [CrossRef]
  8. Hansen, M.D.; Nøst, T.H.; Heimstad, E.S.; Evenset, A.; Dudarev, A.A.; Rautio, A.; Myllynen, P.; Dushkina, E.V.; Jagodic, M.; Christensen, G.N.; et al. The Impact of a Nickel-Copper Smelter on Concentrations of Toxic Elements in Local Wild Food from the Norwegian, Finnish, and Russian Border Regions. Int. J. Environ. Res. Public Health 2017, 14, 694. [Google Scholar]
  9. Gregurek, D.; Reimann, C.; Stumpf, E.F. Trace elements and precious metals in snow samples from the immediate vicinity of nickel processing plants, Kola Peninsula, northwest Russia. Environ. Poll. 1998, 102, 221–232. [Google Scholar] [CrossRef]
  10. Redkina, V.V.; Shalygina, R.R. Algae and cyanobacteria in soils polluted with heavy metals (Northwest Russia, Murmansk region). Czech. Polar Rep. 2021, 11, 279–290. [Google Scholar] [CrossRef]
  11. Nikonov, V.; Goryainova, V.; Lukina, N. Ni and Cu migration and accumulation in forest ecosystems on the Kola Peninsula. Chemosphere 2001, 42, 93–100. [Google Scholar] [CrossRef] [PubMed]
  12. Queffurus, M.; Barnes, S.-J. A review of sulfur to selenium ratios in magmatic nickel–Copper and platinum-group element deposits. Ore Geol. Rev. 2015, 69, 301–324. [Google Scholar] [CrossRef]
  13. Asgher, M.; Rehaman, A.; Islam, S.N.; Arshad, M.; Khan, N.A. Appraisal of Functions and Role of Selenium in Heavy Metal Stress Adaptation in Plants. Agriculture 2023, 13, 1083. [Google Scholar] [CrossRef]
  14. Antoniadis, V.; Levizou, E.; Shaheen, S.M.; Ok, Y.S.; Sebastian, A.; Baum, C.H.; Prasad, M.N.V.; Wenzel, W.W.; Rinklebe, J. Trace elements in the soil-plant interface: Phytoavailability, translocation, and phytoremediation—A review. Earth-Sci. Rev. 2017, 171, 621–645. [Google Scholar] [CrossRef]
  15. Manouchehri, N.; Besancon, S.; Bermond, A. Major and trace metal extraction from soil by EDTA: Equilibrium and kinetic studies. Anal. Chim. Acta 2006, 559, 105–112. [Google Scholar] [CrossRef]
  16. Houba, V.J.G.; Temminghoff, E.J.M.; Gaikhorst, G.A.; vab Vark, W. Soil analysis procedures using 0.01 M calcium chloride as extraction reagent. Commun. Soil Sci. Plant Anal. 2000, 31, 1299–1396. [Google Scholar] [CrossRef]
  17. Bo, V.S. Verordnung über Schadstoffgehalt im Boden, Swiss Ordinance on Pollutants in Soils Nr.814.12; Eidgenössische Drucksachen und Materialzentrale [EDMZ]: Bern, Switzerland, 1986; Volume 3000, p. 1. [Google Scholar]
  18. Pueyo, M.; López-Sánchez, J.F.; Rauret, G. Assessment of CaCl2, NaNO3 and NH4NO3 extraction procedures for the study of Cd, Cu, Pb and Zn extractability in contaminated soils. Anal. Chim. Acta 2004, 504, 217–226. [Google Scholar] [CrossRef]
  19. Lebourg, A.; Sterckeman, T.; Ciesielski, H.; Proix, N. Interet de differents reactifs d’extraction chimique pour l’evaluation de la biodisponibilite des metaux en traces du sol. Agronomie 1996, 16, 201–215. [Google Scholar] [CrossRef]
  20. Slukovskaya, M.V.; Kremenetskaya, I.P.; Drogobuzhskaya, S.V.; Novikov, A.I. Sequential Extraction of Potentially Toxic Metals: Alteration of Method for Cu-Ni Polluted Peat Soil of Industrial Barren. Toxics 2020, 8, 39. [Google Scholar] [CrossRef]
  21. Brady, J.P.; Kinaev, I.; Goonetilleke, A.; Ayoko, G.A. Comparison of partial extraction reagents for assessing potential bioavailability of heavy metals in sediments. Marine Pollut. Bull. 2016, 106, 329–334. [Google Scholar] [CrossRef]
  22. Golubkina, N.; Sheshnitsan, S.; Koshevarov, A.; Pirogov, N.; Plotnikova, U.; Tallarita, A.V.; Murariu, O.C.; Merlino, L.; Caruso, G. Peculiarities of Plant Mineral Composition in Semi-Desert Conditions. Int. J. Plant Biol. 2024, 15, 1229–1249. [Google Scholar] [CrossRef]
  23. Minkina, T.M.; Mandzhieva, S.S.; Burachevskaya, M.V.; Bauer, T.V.; Sushkova, S.N. Method of determining loosely bound compounds of heavy metals in the soil. MethodsX 2018, 5, 217–226. [Google Scholar] [CrossRef]
  24. Golubkina, N.; Plotnikova, U.; Koshevarov, A.; Sosna, E.; Hlebosolova, O.; Polikarpova, N.; Murariu, O.C.; Tallarita, A.V.; Caruso, G. Nickel, Cu, Fe, Zn, and Se Accumulation, and the Antioxidant Status of Mushrooms Grown in the Arctic Under Ni/Cu Pollution and in Unpolluted Areas. Stresses 2025, 5, 25. [Google Scholar] [CrossRef]
  25. Fan, J.; Bu, C.; Qi, Y.; Zhou, W.; Wang, C.; Wei, Y.; Siddique, K.H.M. Biocrusts significantly affect the bioavailability and ecological risk of heavy metals in gold mine tailings. Plant Soil 2023, 493, 99–113. [Google Scholar] [CrossRef]
  26. Weber, B.; Belnap, J.; Büdel, B.; Antoninka, A.J.; Barger, N.N.; Chaudhary, V.B.; Darrouzet-Nardi, A.; Eldridge, D.J.; Faist, A.M.; Ferrenberg, S.; et al. What is a biocrust? A refined, contemporary definition for a broadening research community. Biol. Rev. 2022, 43, 1768–1785. [Google Scholar] [CrossRef]
  27. Weber, B.; Büdel, B.; Belnap, J. Biological Soil Crusts: An Organizing Principle in Drylands. In Biological Soil Crusts: An Organizing Principle in Drylands; Composition and Macrostructure of Biological Soil Crusts; Springer International Publishing: Cham, Switzerland, 2016; Volume 226, pp. 159–172. [Google Scholar] [CrossRef]
  28. Bowker, M.A.; Doherty, K.D.; Antoninka, A.J.; Ramsey, P.W.; DuPre, M.E.; Durham, R.A. Biocrusts Influence vascular Plant Community Development, Promoting Native Plant Dominance. Front. Ecol. Evol. 2022, 10, 840324. [Google Scholar] [CrossRef]
  29. Mugnai, G.; Rossi, F.; Mascalchi, C.; Ventura, S.; De Philippis, R. High Arctic biocrusts: Characterization of the exopolysaccharidic matrix. Polar Biol. 2020, 43, 1805–1815. [Google Scholar] [CrossRef]
  30. Mugnai, G.; Pinchuk, I.; Borruso, L.; Tiziani, R.; Sannino, C.; Canini, F.; Turchetti, B.; Mimmo, T.; Zucconi, L.; Buzzini, P. The hidden network of biocrust successional stages in the High Arctic: Revealing abiotic and biotic factors shaping microbial and metazoan communities. Sci. Total Environ. 2024, 926, 171786. [Google Scholar] [CrossRef]
  31. Williams, L.; Borchhardt, N.; Colesie, C.; Baum, C.; Komsic-Buchmann, K.; Rippin, M.; Becker, B.; Karsten, U.; Büdel, B. Biological soil crusts of Arctic Svalbard and of Livingston Island, Antarctica. Polar Biol. 2017, 40, 399–411. [Google Scholar] [CrossRef]
  32. Urbanavichus, G.P.; Borovichev, E.A.; Ershov, V.V. Cryptogamic Organisms as Pioneers of the Northern Taiga Recovery Affected ubder the Conditions of Lowered Industrial Air Pollution. Lesovedenie 2021, 2, 195–207. [Google Scholar] [CrossRef]
  33. Kerem, T.; Nejidat, A.; Zaady, E. Monitoring dynamics of biocrust rehabilitation in acid-saturated desert soils. Environ. Monit. Assess. 2024, 196, 715. [Google Scholar] [CrossRef]
  34. Sun, F.; Xiao, B.; Kidron, G.J.; Heitman, J. Biocrusts critical regulation of soil water vapor transport (diffusion, sorption, and late-stage evaporation) in drylands. Water Resour. Res. 2024, 60, e2023WR036520. [Google Scholar] [CrossRef]
  35. Agnelli, A.; Corti, G.; Massaccesi, L.; Ventura, S.; D’Acqui, L.P. Impact of biological crusts on soil formation in polar ecosystems. Geoderma 2021, 401, 115340. [Google Scholar] [CrossRef]
  36. Pushkareva, E.; Hejduková, E.; Elster, J.; Becker, B. Microbial response to seasonal variation in arctic biocrusts with a focus on fungi and cyanobacteria. Environ. Res. 2024, 263, 120110. [Google Scholar] [CrossRef]
  37. Jung, P.; Briegel-Williams, L.; Simon, A.; Thyssen, A.; Büdel, B. Uncovering biological soil crusts: Carbon content and structure of intact Arctic, Antarctic and alpine biological soil crusts. Biogeosciences 2018, 15, 1149–1160. [Google Scholar] [CrossRef]
  38. Barrera, A.; Acuña-Rodríguez, I.S.; Ballesteros, G.I.; Atala, C.; Molina-Montenegro, M.A. Biological Soil Crusts as Ecosystem Engineers in Antarctic Ecosystem. Front. Microbiol. 2022, 13, 755014. [Google Scholar] [CrossRef]
  39. Cantón, Y.; Chamizo, S.; Rodriguez-Caballero, E.; Lázaro, R. Water Regulation in Cyanobacterial Biocrusts from Drylands: Negative Impacts of Anthropogenic Disturbance. Water 2020, 12, 720. [Google Scholar] [CrossRef]
  40. Alfthan, G.V. A micromethod for the determination of selenium in tissues and biological fluids by single-test-tube fluorimetry. Anal. Chim. Acta 1984, 165, 187–194. [Google Scholar] [CrossRef]
  41. Somagattu, P.; Chinnannan, K.; Yammanuru, H.; Reddy, U.K.; Nimmakayala, P. Selenium dynamics in plants: Uptake, transport, toxicity, and sustainable management strategies. Sci. Total Environ. 2024, 949, 175033. [Google Scholar] [CrossRef] [PubMed]
  42. Poudel, S. Organic Matter Determination (Walkley-Black Method). IAAS. 2020. Available online: https://www.researchgate.net/publication/339941885_Organic_Matter_determination_Walkley_-Black_method (accessed on 15 March 2020).
  43. Golubkina, N.A.; Kekina, H.G.; Molchanova, A.V.; Antoshkina, M.S.; Nadezhkin, S.M.; Soldatenko, A.V. Plants Antioxidants and Methods of Their Determination; Infra-M: Moscow, Russia, 2020. (In Russian) [Google Scholar] [CrossRef]
  44. Gui, J.-Y.; Rao, S.; Huang, X.; Liu, X.; Chen, S.; Xu, F. Interaction between selenium and essential micronutrient elements in plants: A systematic review. Sci. Total Environ 2022, 853, 158673. [Google Scholar] [CrossRef] [PubMed]
  45. Qu, L.; Xu, J.; Dai, Z.; Elyamine, A.M.; Huang, W.; Han, D.; Dang, B.; Xu, Z.; Jia, W. Selenium in soil-plant system: Transport, detoxification and bioremediation. J. Hazard. Mat. 2023, 452, 131272. [Google Scholar] [CrossRef]
  46. Gupta, M.; Gupta, S. An overview of selenium uptake, metabolism, and toxicity in plants. Front. Plant Sci. 2017, 7, 2074. [Google Scholar] [CrossRef]
  47. Dhillon, K.S.; Bijay-Singh, S.K.D. Genesis of seleniferous soils and associated animal and human health problems. In Advances in Agronomy; Sparks, D.L., Ed.; Academic Press: Burlington, ON, Canada, 2019; Volume 154, pp. 1–80. [Google Scholar]
  48. Campillo-Cora, C.; Conde-Cid, M.; Arias-Estévez, M.; Fernández-Calviño, D.; Alonso-Vega, F. Specific Adsorption of Heavy Metals in Soils: Individual and Competitive Experiments. Agronomy 2020, 10, 1113. [Google Scholar] [CrossRef]
  49. Tošić Jojević, S.; Mrvić, V.; Stajković-Srbinović, O.; Jovković, M.; Antić Mladenović, S.; Krpović, M.; Belanović Simić, S. Geochemical Distribution of Ni, Cr, and Co in the Main Soil Types of the Čemernica River Basin in Serbia (In a Serpentine Environment). Land 2024, 13, 2075. [Google Scholar] [CrossRef]
  50. Huang, K.; Yang, Y.; Lu, H.; Hu, S.; Chen, G.; Du, Y.; Liu, T.; Li, X.; Li, F. Transformation kinetics of exogenous nickel in a paddy soil during anoxic-oxic alteration: Roles of organic matter and iron oxides. J Hazard. Mat. 2023, 452, 131246. [Google Scholar] [CrossRef] [PubMed]
  51. Xu, E.; Liu, Y.; Gu, D.; Zhan, X.; Li, J.; Zhou, K.; Zhang, P.; Zou, Y. Molecular Mechanisms of Plant Responses to Copper: From Deficiency to Excess. Int. J. Mol. Sci. 2024, 25, 6993. [Google Scholar] [CrossRef] [PubMed]
  52. Rao, C.R.M.; Sahuquillo, A.; Lopez Sancher, J.F. A review of the different methods applied in environmental geochemistry for single and sequential extraction of trace elements in soils and related materials. Water Air Soil Pollut. 2008, 189, 291–333. [Google Scholar] [CrossRef]
  53. Del Castilho, P.; Rix, I. Ammonium acetate extraction for soil heavy metal speciation; model aided soil test interpretation. Int. J. Environ. Anal. Chem. 1993, 51, 59–64. [Google Scholar] [CrossRef]
  54. Takeda, A.; Tsukada, H.; Takaku, Y.; Hisamatsu, S.; Inaba, J.; Nanzyo, M. Extractability of major and trace elements from agricultural soils using chemical extraction methods: Application for phytoavailability assessment. Soil Sci. Plant Nutr. 2006, 52, 406–417. [Google Scholar] [CrossRef]
  55. Quevauviller, P.; Rauret, G.; Griepink, B. Single and sequential extraction in sediments and soils. Int. J. Environ. Anal. Chem. 1993, 51, 231–235. [Google Scholar] [CrossRef]
  56. Minkina, T.M.; Motuzova, G.V.; Nazarenko, O.G.; Kryshchenko, V.S.; Mandzhieva, S.S. Combined approach for fractioning metal compounds in soils. Eur. Soil Sci. 2008, 41, 1171–1179. [Google Scholar] [CrossRef]
  57. Normandin, V.; Kotuby-Amacher, J.; Miller, R.O. Modification of the ammonium acetate extractant for the determination of exchangeable cations in calcareous soils. Commun. Soil Sci. Plant Anal. 1998, 29, 1785–1791. [Google Scholar] [CrossRef]
  58. Golubkina, N.; Skrypnik, L.; Logvinenko, L.; Zayachkovsky, V.; Smirnova, A.; Krivenkov, L.; Romanov, V.; Kharchenko, V.; Poluboyarinov, P.; Sekara, A.; et al. The ‘Edge Effect’ Phenomenon in Plants: Morphological, Biochemical and Mineral Characteristics of Border Tissues. Diversity 2023, 15, 123. [Google Scholar] [CrossRef]
  59. Wang, S.; Ma, L.; Yang, L.; Ma, Y.; Zhang, Y.; Zhao, C.; Chen, N. Advancing studies on global biocrust distribution. Soil 2024, 10, 763–778. [Google Scholar] [CrossRef]
  60. Golubkina, N.; Plotnikova, U.; Hlebosolova, O.; Koshevarov, A. Adaptation of soil biuocrusts in conditionsa of intensive anthropogenic loading. Karelian Scientific Center RAS. In Proceedings of the Karelian Scientific Center RAS, Scientific Conference ‘Fundemental and Applied Aspects of Living Organism Adaptation to Changes in Environmental Conditions’, Petrozavodsk, Russia, 8–13 September 2024; p. 87. [Google Scholar]
  61. Baldauf, S.; Cantón, Y.; Tietjen, B. Biocrusts intensify water redistribution and improve water availability to dryland vegetation: Insights from a spatially-explicit ecohydrological model. Front. Microbiol. 2023, 14, 1179291. [Google Scholar] [CrossRef] [PubMed]
  62. Gaude, A.A.; Jalmi, S.K. Environmental stress induced biosynthesis of plant secondary metabolites-transcriptional regulation as a key. Crop Des. 2025, 4, 100100. [Google Scholar] [CrossRef]
Figure 1. Soil sampling places. (1) thank you, commas are necessary; (2) No explanation is necessary; (3) We confirm that the presented version has been revised earlier according to the reviewer’s comments and is the most suitable for understanding the peculiarities of sampling places.
Standards 05 00028 g001
Figure 2. Mean monthly values of day and night temperature and precipitation, in 2024, in the Pechenga district in Murmansk region.
Standards 05 00028 g002
Figure 3. Soil selenium (A) and organic matter (B) content. Values with the same letters do not significantly differ according to Duncan’s test at p < 0.05. Sampling place 15 represents imported experimental soil.
Standards 05 00028 g003
Figure 4. Correlation between Se and organic matter content in soils located along the S-W direction from the smelting plant (r = 0.860; p = 0.001; n = 9).
Standards 05 00028 g004
Figure 5. Correlations between Cu content in soil and (A) the distance from the smelting plant (r = −0.896; p = 0.001; n = 23) and (B) soil Se content (r = +0.890; p = 0.001; n = 23), in the case of soil extraction by ammonium acetate.
Standards 05 00028 g005
Figure 6. Correlation between soil Ni and Co, in the case of soil extraction by ammonium acetate buffer (r = +0.930; p = 0.001; n = 23).
Standards 05 00028 g006
Figure 7. Statistically significant correlations between soil elements extracted by 3% nitric acid and ammonium acetate buffer.
Standards 05 00028 g007
Figure 8. The total antioxidant activity (AOA) and polyphenol content (TP) in biocrusts. For each parameter, values with similar letters do not differ statistically according to Duncan’s test at p < 0.05.
Standards 05 00028 g008
Figure 9. Correlation between AOA and polyphenol content in biocrusts (r = +0.932; p = 0.001; n = 10).
Standards 05 00028 g009
Figure 10. Correlation between biocrust antioxidant activity (AOA), polyphenol content (TP), and soil organic matter content (r = −0.788, p = 0.002; and r = −0.767, p = 0.005, respectively; n = 10).
Standards 05 00028 g010
Figure 11. Spearman correlation heatmap between biocrust metal concentrations and functional biocrust indicators (AOA and TP).
Standards 05 00028 g011
Figure 12. Statistically significant correlations between biocrust mineral and antioxidant characteristics and soil element content (samples along N-E direction).
Standards 05 00028 g012
Figure 13. Transfer factors (TFs) for Ni, Cu, and Zn in biocrusts along the distance gradient from the emission source. The symbols denote individual sampling sites; regression lines show general trends.
Standards 05 00028 g013
Table 1. Correlation coefficients between soil elements extracted by 3% nitric acid, Se, and organic matter content *.
LNiCuCoFePbZnOMSe
L1−0.236−0.557−0.1080.233−0.194−0.766 b−0.031−0.901 a
Ni0.3371−0.1500.594 d0.107−0.2910.071−0.043−0.048
Cu0.2710.1351−0.199−0.4410.623 c0.580 d0.4860.650 d
Co0.0870.899 a0.21010.422−0.4580.1340.1830.071
Fe0.0470.5500.4720.664 d10.1140.1980.365−0.157
Pb0.3930.1150.3870.0100.32910.5410.593 d0.289
Zn0.3590.1740.0440.4510.0440.29110.4060.817 a
OM0.1870.2790.3100.5490.840 a0.3980.38010.273
Se0.4480.3550.0200.5670.794 b0.0310.3360.839 a1
* N-E direction (standard font), n-10; S-W direction (italics), n = 9. L: the distance from the Pechenganikel smelting plant; OM: organic matter. The significance of correlations: (a) p = 0.001; (b) p = 0.005; (c) p = 0.03; and (d) p = 0.05.
Table 2. Correlation coefficients between soil elements extracted with ammonium acetate buffer along the N-E and S-W directions from the smelting plant.
LNiCuCoFePbZnOMSe
L1−0.454−0.786 f−0.550−0.705 e−0.483−0.751 d−0.031−0.901 a
Ni0.755 e10.628 g0.986 a0.4030.2220.712 e0.5160.526
Cu0.720 f0.765 e10.686 f0.797 b0.3640.886 a0.3610.914 a
Co0.728 f0.935 a0.748 e10.5020.3100.776 c0.4370.606 a
Fe0.4750.3680.3650.25210.4020.757 c−0.110.768 c
Pb0.4800.4540.3290.3670.966 a10.821 a0.0470.42
Zn0.0670.0960.1170.2720.3370.45710.3620.841 a
OM0.1870.4560.4720.6120.3620.2400.33410.281
Se0.4480.778 d0.635 g0.853 a0.0110.1310.2430.839 a1
N-E direction (standard font), n-10; S-W direction (italics), n = 9. L: the distance from the Pechenganikel smelting plant; OM: organic matter. The significance of correlations: (a) p = 0.001; (b) p = 0.002; (c) p = 0.003; (d) p = 0.005; (e) p = 0.01; (f) p = 0.02; (g) p = 0.03.
Table 3. Correlations between the elements analyzed at all sampling places (n = 23).
LNiCuCoFePbZnSe
L10.2580.1200.0970.220−0.036−0.214−0.407
Ni0.40310.2200.854 a0.474−0.0220.349−0.223
Cu0.462 b0.40810.3830.0840.1940.2620.121
Co0.3220.934 a0.22910.5250.0330.462−0.212
Fe0.2870.2480.692 a0.19110.3020.191−0.307
Pb0.0570.0510.3010.0360.431 c10.129−0.307
Zn0.0390.565 a0.1810.750 a0.2220.0111−0.058
Se0.528 b0.3470.890 a0.2010.642 a0.642 a0.1791
Nitric acid extraction (standard font); ammonium acetate buffer (italics). The significance of correlations: (a) p = 0.001; (b) p = 0.02; (c) p = 0.05.
Table 4. Correlations between biocrust elements and distance from the Ni/Cu smelting plant (n = 10).
NiCuCoFePbZnSe
L−0.652 e−0.440−0.794 b−0.418−0.593 f−0.591 f−0.651 e
Ni0.816 a0.801 a0.727 d0.5750.658 e0.673 e
Cu0.761 c0.945 a0.5780.792 b0.563
Co0.674 e0.629 f0.806 a0.620 f
Fe0.3740.685 e0.380
Pb0.816 a0.895 a
Zn0.656 e
Significance of the correlations: (a) p = 0.001; (b) p = 0.002; (c) p = 0.005; (d) p = 0.01; (e) p = 0.02; (f) p = 0.05.
Table 5. Correlation coefficients between biocrust mineral composition and mineral composition of soil nitric acid extracts.
Biocrust ParametersSoil Parameters (Soil Extraction with HNO3)
NiCuCoFePbZnSe
Ni−0.2590.549−0.586 c−0.4660.4140.3550.545
Cu−0.2240.348−0.332−0.2650.2600.0790.321
Co−0.1970.571 c−0.149−0.2170.4050.570 c0.746 a
Fe−0.1990.155−0.285−0.2150.1050.0290.300
Pb0.2920.749 a0.022−0.4280.3720.3330.417
Zn0.1540.486−0079−0.1870.4520.3150.404
Se0.2500.631 b−0037−0.05370.1530.3130.409
Significance of the correlations: (a) p < 0.005; (b) p < 0.03; (c) p < 0.05.
Table 6. Correlation coefficients between biocrust mineral composition and mineral composition of soil buffer extracts.
Biocrust ParametersSoil Parameters (Soil Extraction with Ammonium Acetate Buffer)
Ni CuCo FePbZn
Ni0.3820.592 b0.4150.586 b0.0420.413
Cu0.1530.2800.1910.545−0.1310.100
Co0.4780.660 a0.5440.691 a−00460.392
Fe0.0380.1910.1120.5510.010.132
Pb0.3040.5250.3040.343−0.0050.342
Zn0.3290.3640.3500.350−0.1650.181
Se0.2320.5020.2520.3500.1320.347
Significance of the correlations: (a) p = 0.02; (b) p = 0.05.
Table 7. Significant fixed effects (FDR-adjusted) of mixed-effects models for soil element pools.
ElementPredictor Termβ (log10)95% CIq (FDR)n (obs)n (Sites)AIC
CuSoil pool [NH4OAc vs. HNO3]0.7720.211 … 1.3330.0214623108.405
CuSOM (%)0.0760.021 … 0.1310.0214623108.405
CuDistance (km)−0.061−0.088 … −0.0347.9 × 10–54623108.405
CuDistance × Direction [S–W]0.0700.039 … 0.1027.9 × 10–54623108.405
NiDistance × Soil pool [NH4OAc]−0.073−0.108 … −0.0370.000684022100.351
SeDistance × Direction [S–W]0.0150.006 … 0.0250.00223232.115
SeSOM (%)0.0200.004 … 0.0370.02523232.115
SeDirection [S–W vs. N–E]−0.446−0.648 … −0.2455.3 × 10–523232.115
SeDistance (km)−0.016−0.024 … −0.0095.3 × 10–523232.115
ZnDirection [N–W] × Soil pool [NH4OAc]−2.088−3.451 … −0.7250.032462337.443
ZnDirection [S–W vs. N–E]0.4650.119 … 0.8100.034462337.443
ZnDistance × Direction [N–W] × Soil pool [NH4OAc]0.9190.261 … 1.5770.034462337.443
Only effects with q (FDR) < 0.05 are presented. β refers to coefficients on a log10 scale; on the original scale, the effect is equal to 10β. The 95% CI is the confidence interval for coefficients. Δq-values are corrected using the Benjamini–Hochberg method. The number of observations (n obs), number of sites (n sites), and AIC models are also shown.
Table 8. Best soil pool predictors of element concentrations in biocrusts according to mixed-effects models (lowest AIC).
ElementSoil Pool PredictorΔAICβ (log10 Soil Pool)95% CIn (obs)n (Sites)AIC
CoNH4OAc0.14−0.112−0.472 … 0.24810106.370
CuHNO37.00−0.197−0.305 … −0.08810106.020
FeNH4OAc1.82−0.269−0.288 … −0.2501010−21.716
NiHNO328.12−0.055−0.096 … −0.01599−15.638
PbNH4OAc0.27−0.212−0.724 … 0.3005511.100
SeNH4OAc−0.373−1.119 … 0.37410106.242
ZnHNO31.45−0.583−1.299 … 0.13410108.658
Values are regression coefficients (β) for the relationship between log10-transformed metal concentration in soil pools and in biocrusts, with 95% confidence intervals (CIs) and FDR-adjusted significance levels (q). ΔAIC indicates the difference between the best and alternative model; values < 2 suggest similar model support.
Disclaimer/Publisher’s Note: The statements, opinions and data contained in all publications are solely those of the individual author(s) and contributor(s) and not of MDPI and/or the editor(s). MDPI and/or the editor(s) disclaim responsibility for any injury to people or property resulting from any ideas, methods, instructions or products referred to in the content.