Real-Time Monitoring of Tetraselmis suecica in A Saline Environment as Means of Early Water Pollution Detection

 ,
,  and
and 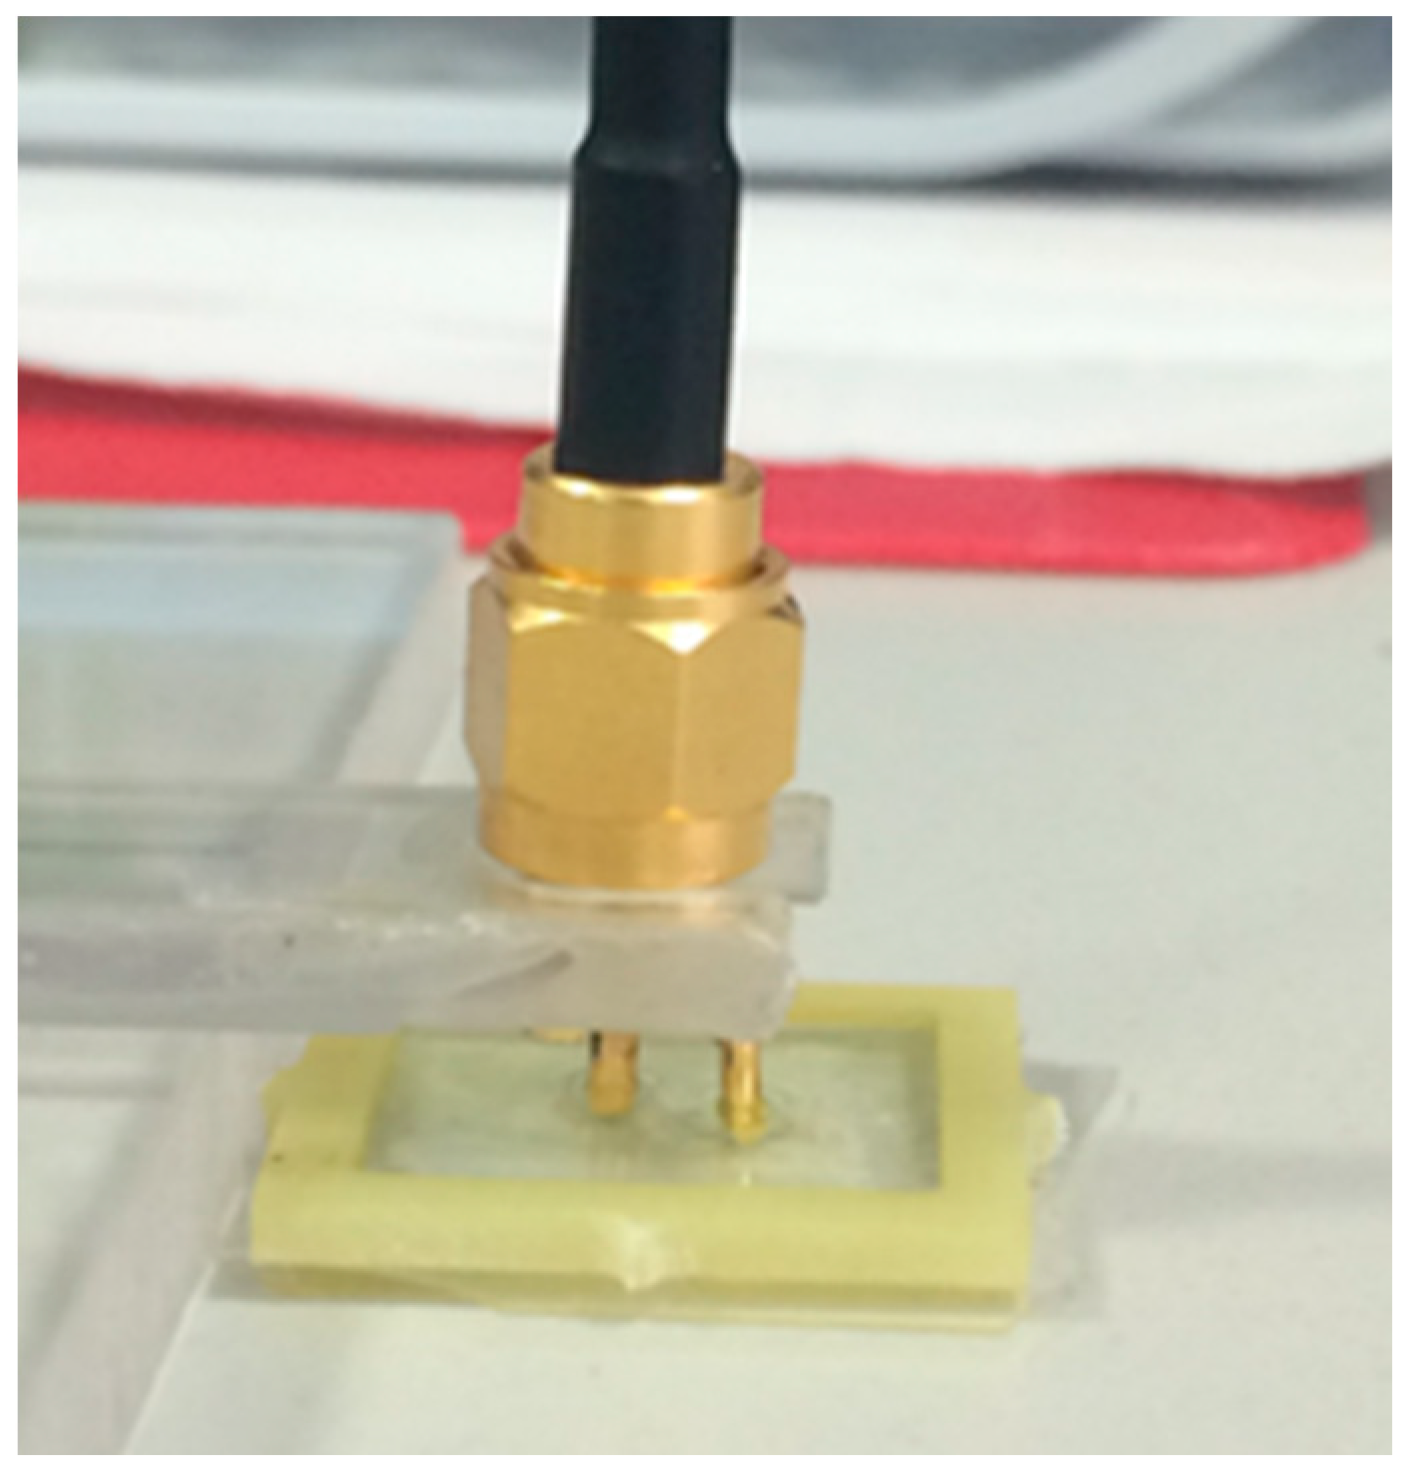
Abstract
1. Introduction
1.1. Pollution of Water with Microorganisms
1.2. State-of-the-Art Detection Technology
1.3. UV-Vis Spectroscopy
- ε = molar absorption coefficient (mol−1 dm3 cm−1)
- l = path length of the sample (cm)
- c = concentration of the sample (mol dm−3)
1.4. Low-Frequency Capacitance Measurements
- ε0 = dielectric constant of the sample between the sensor plates
- εr = permittivity of free space, 8.854 × 10⁻¹² F/m
- l = length of the rods (m)
- d = distance between the rods (m)
- a = radius of the rod (m)
1.5. Low Power Microwave Sensing
2. Materials and Methods
2.1. T. suecica Culturing Process
2.2. Sample Preparation and Cell Count
2.3. Optical Measurements with UV-Vis Spectroscopy
2.4. Low-Frequency Capacitance Measurements
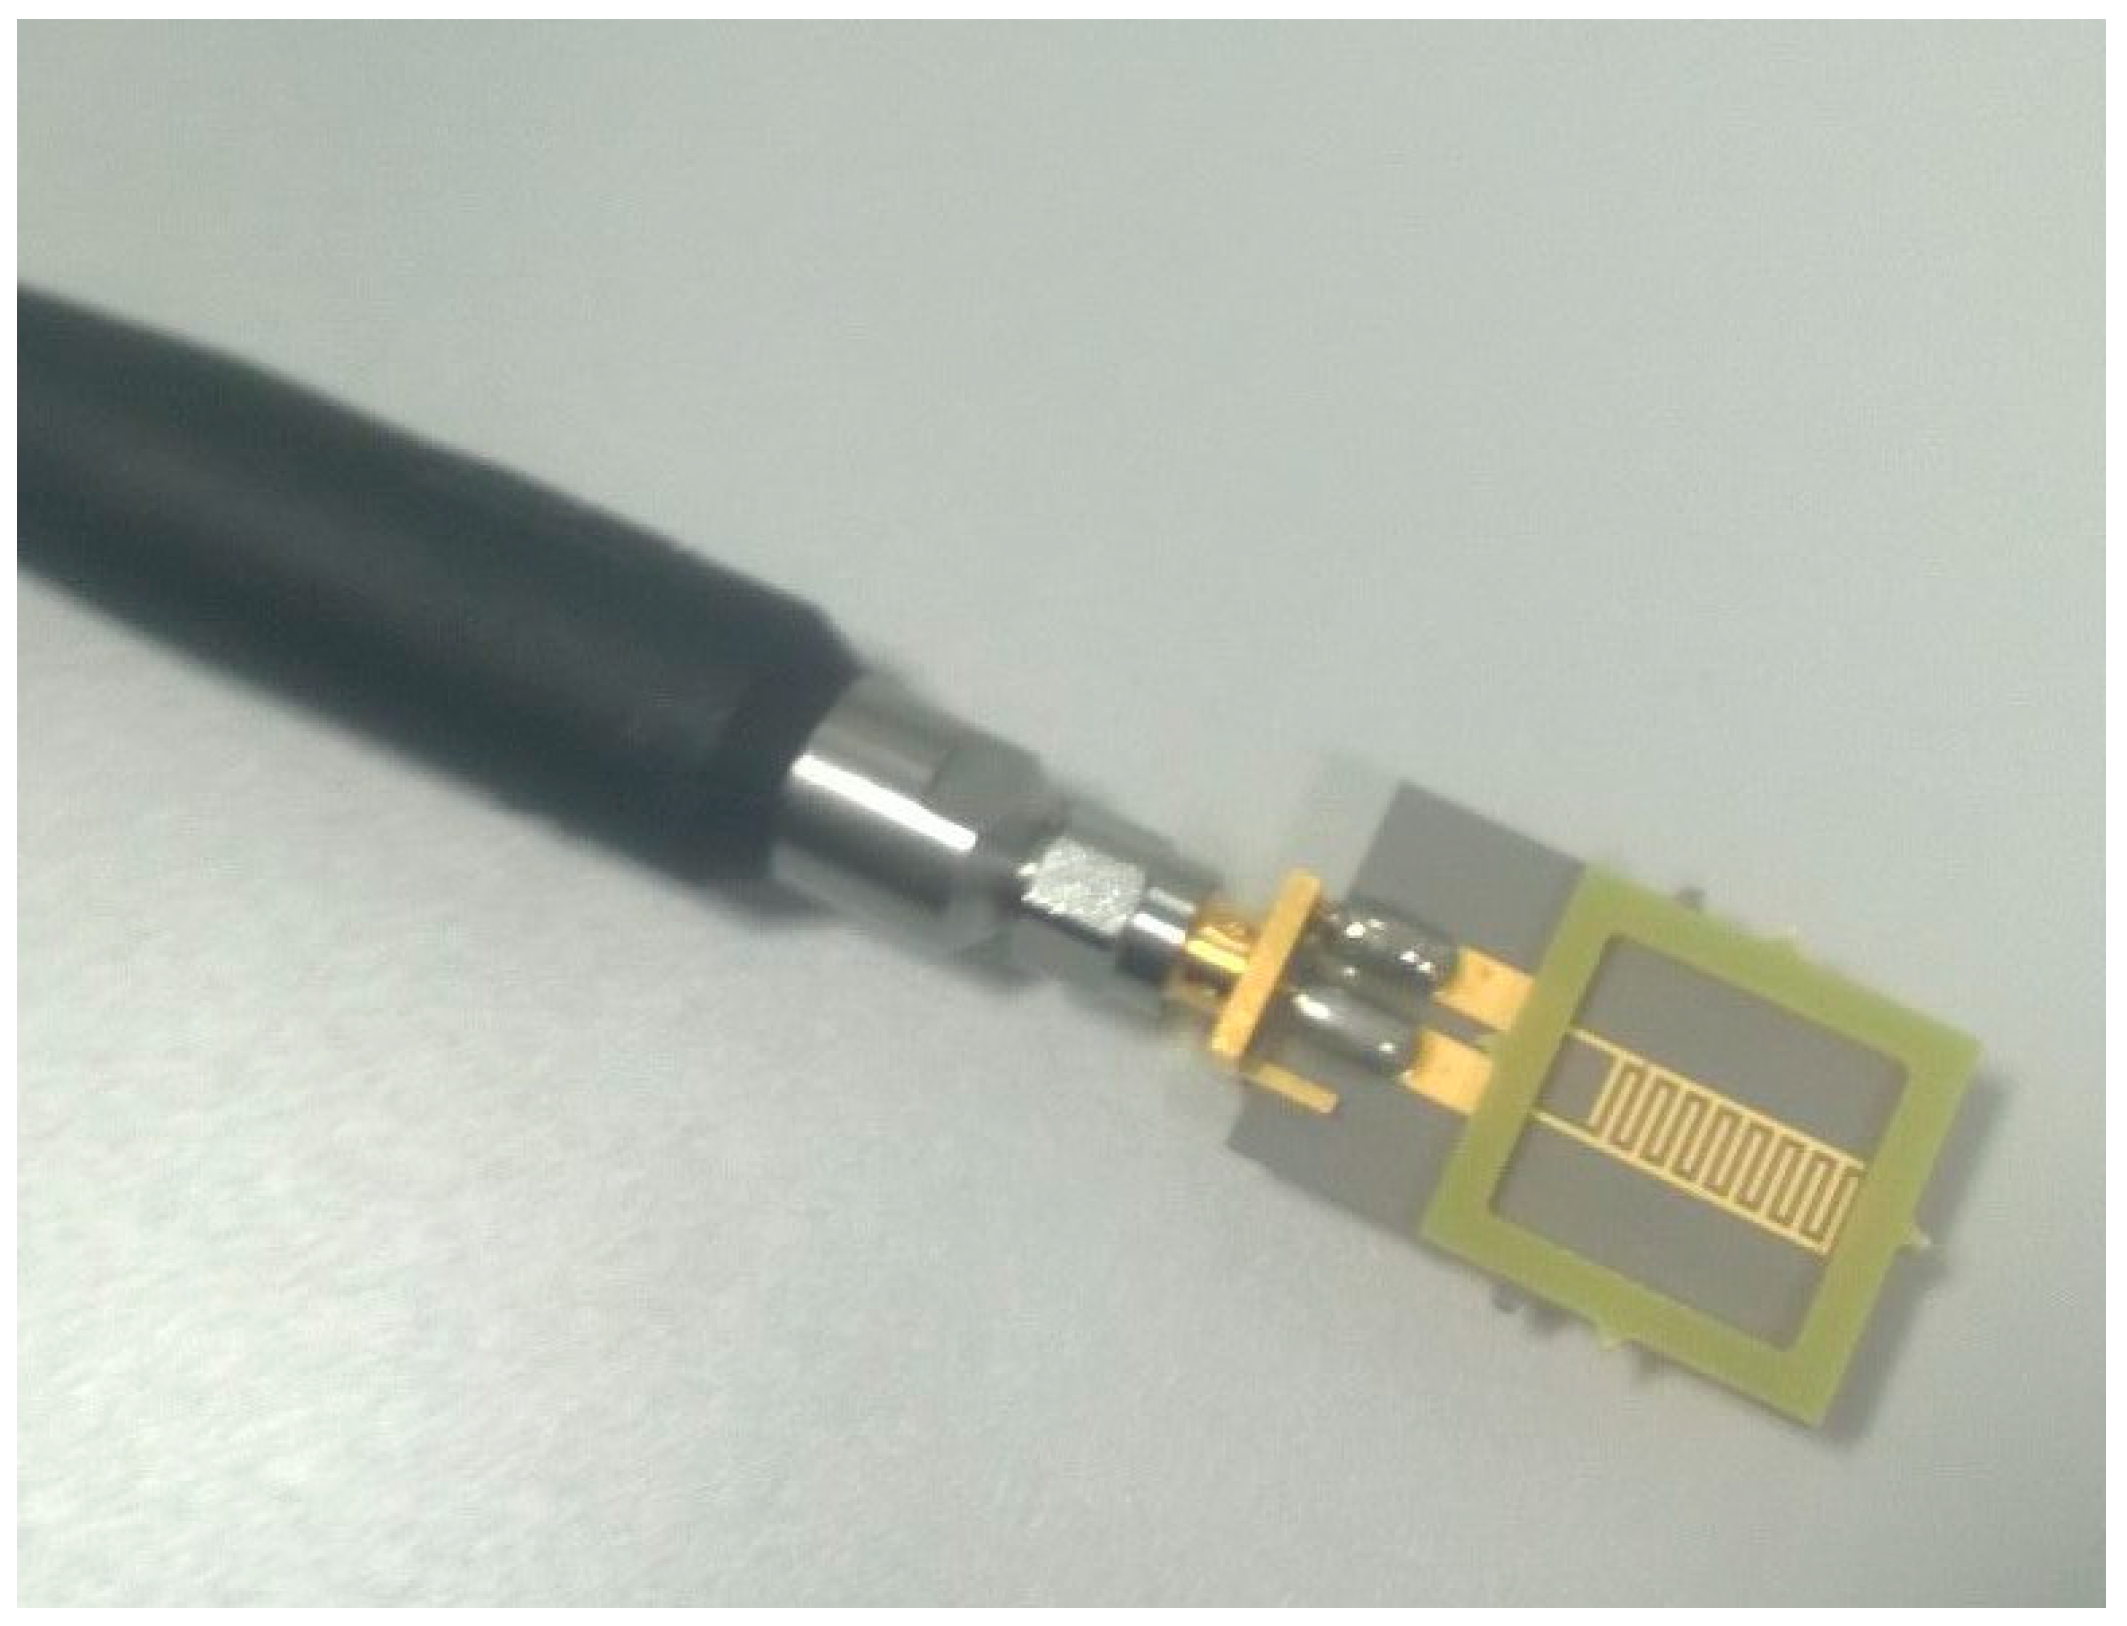
2.5. Electromagnetic Wave Sensors
3. Results
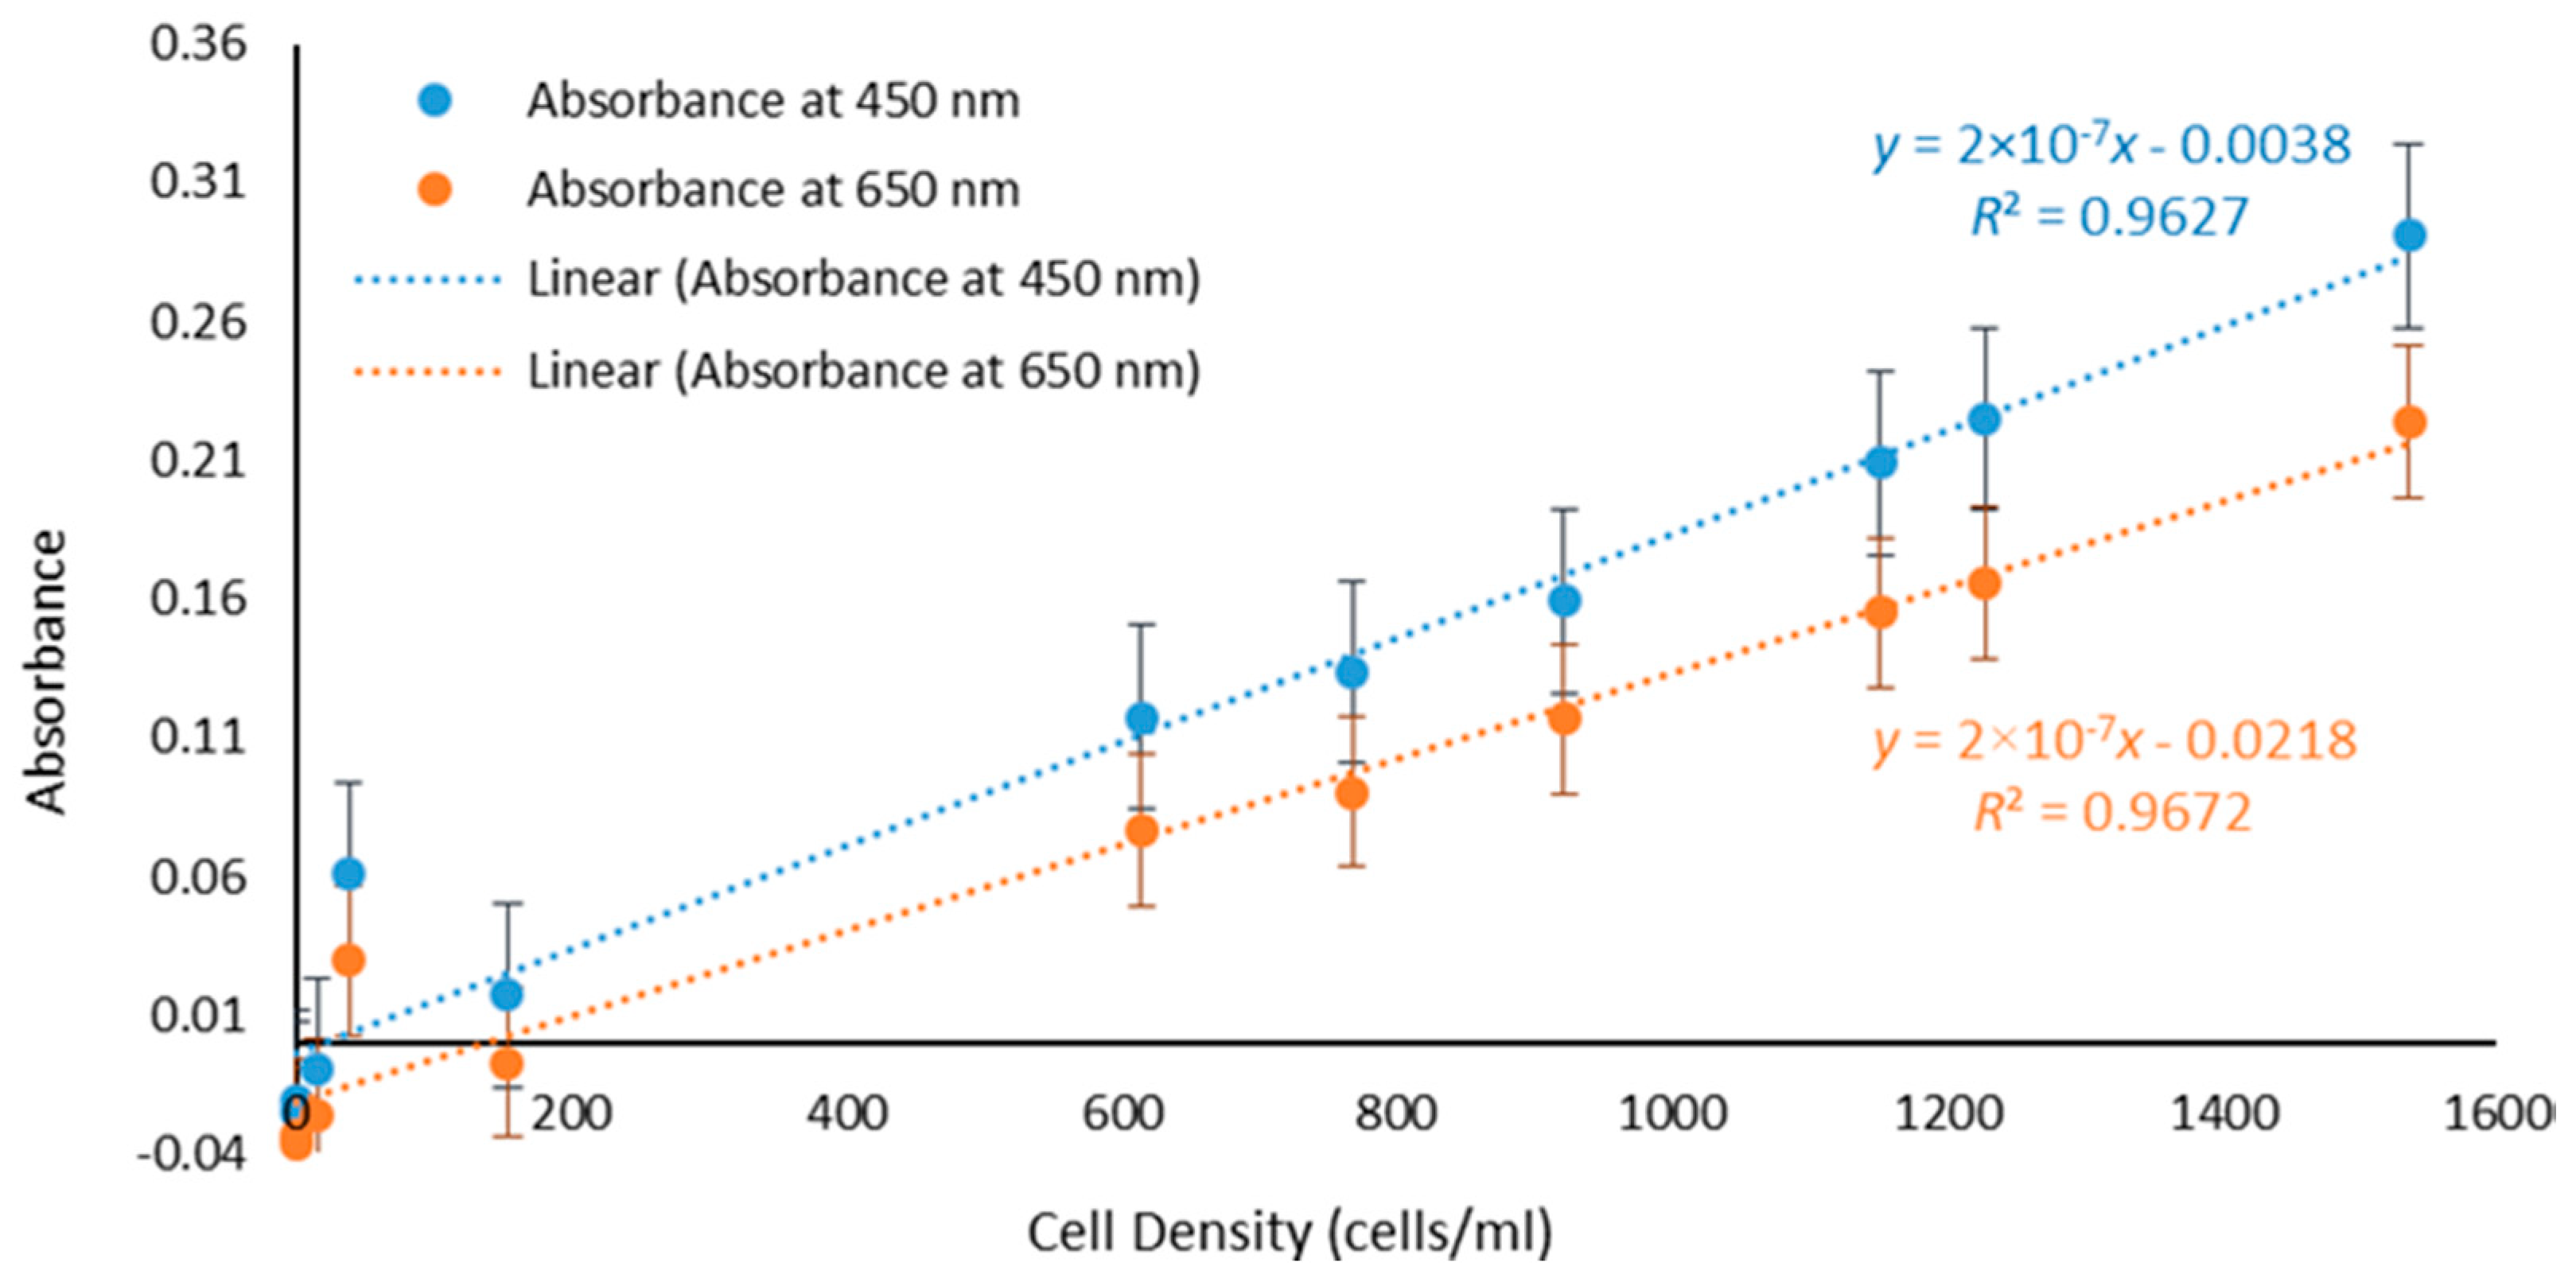
3.1. UV-Vis Spectroscopy—Absorbance Versus Cell Density
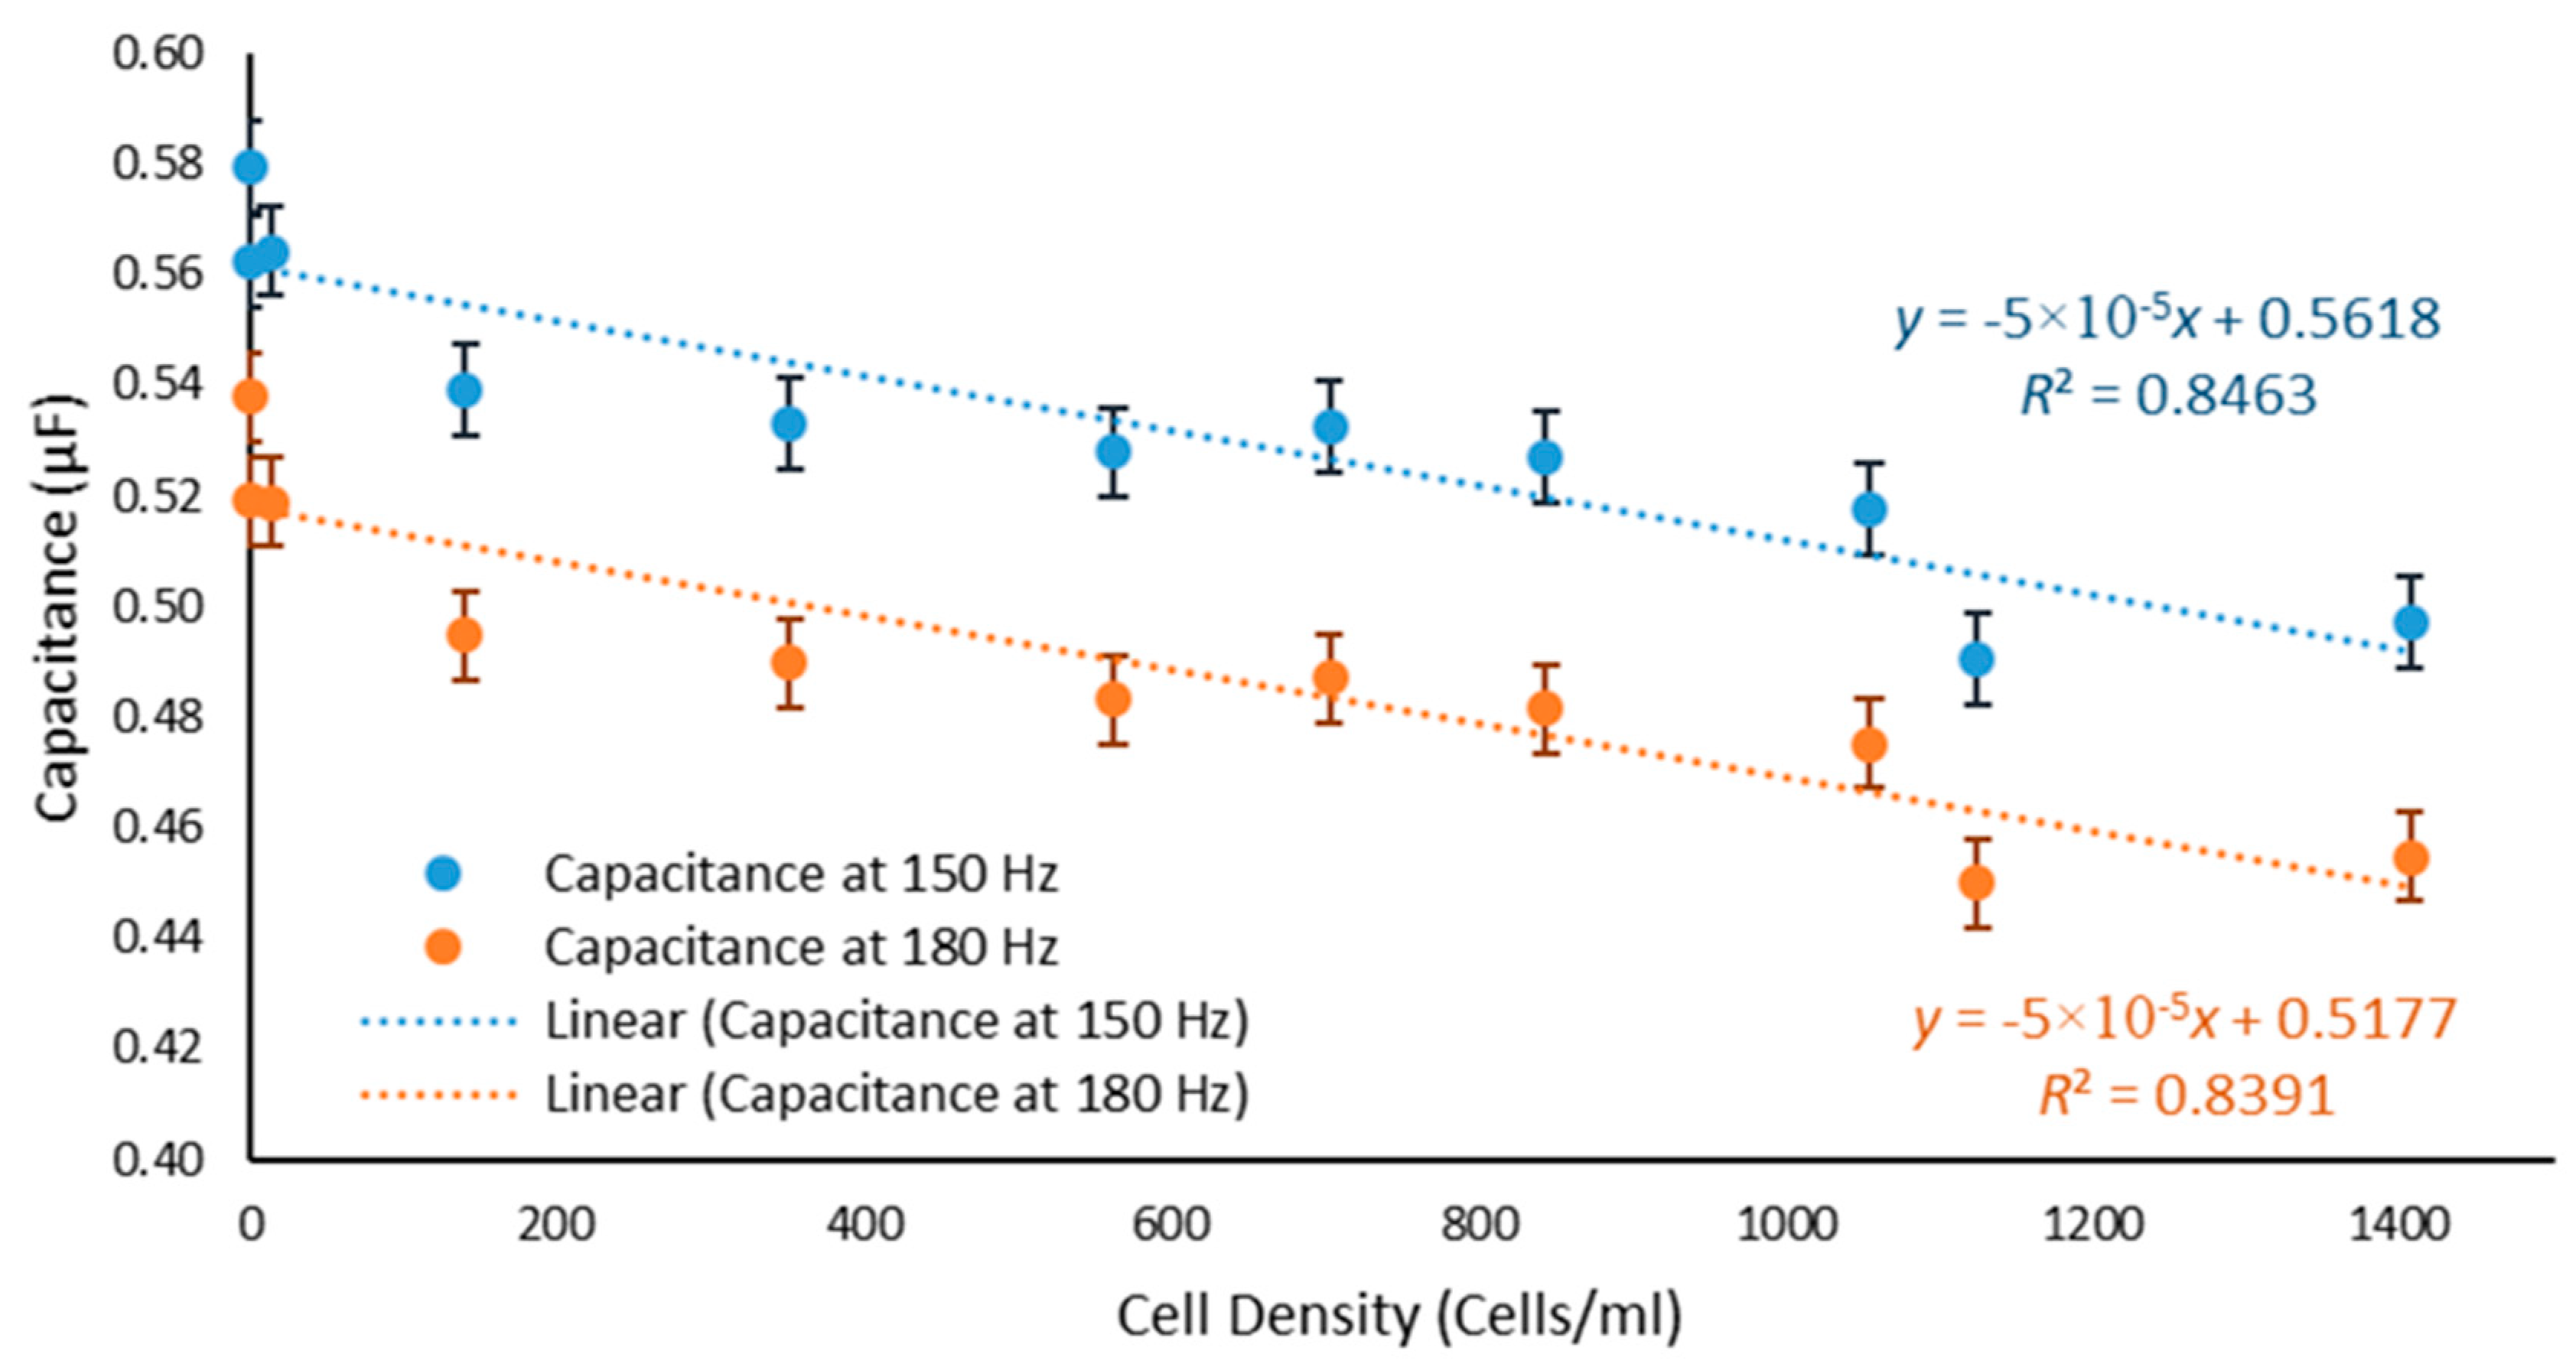
3.2. Low-Frequency Analysis: Capacitance Versus Cell Density
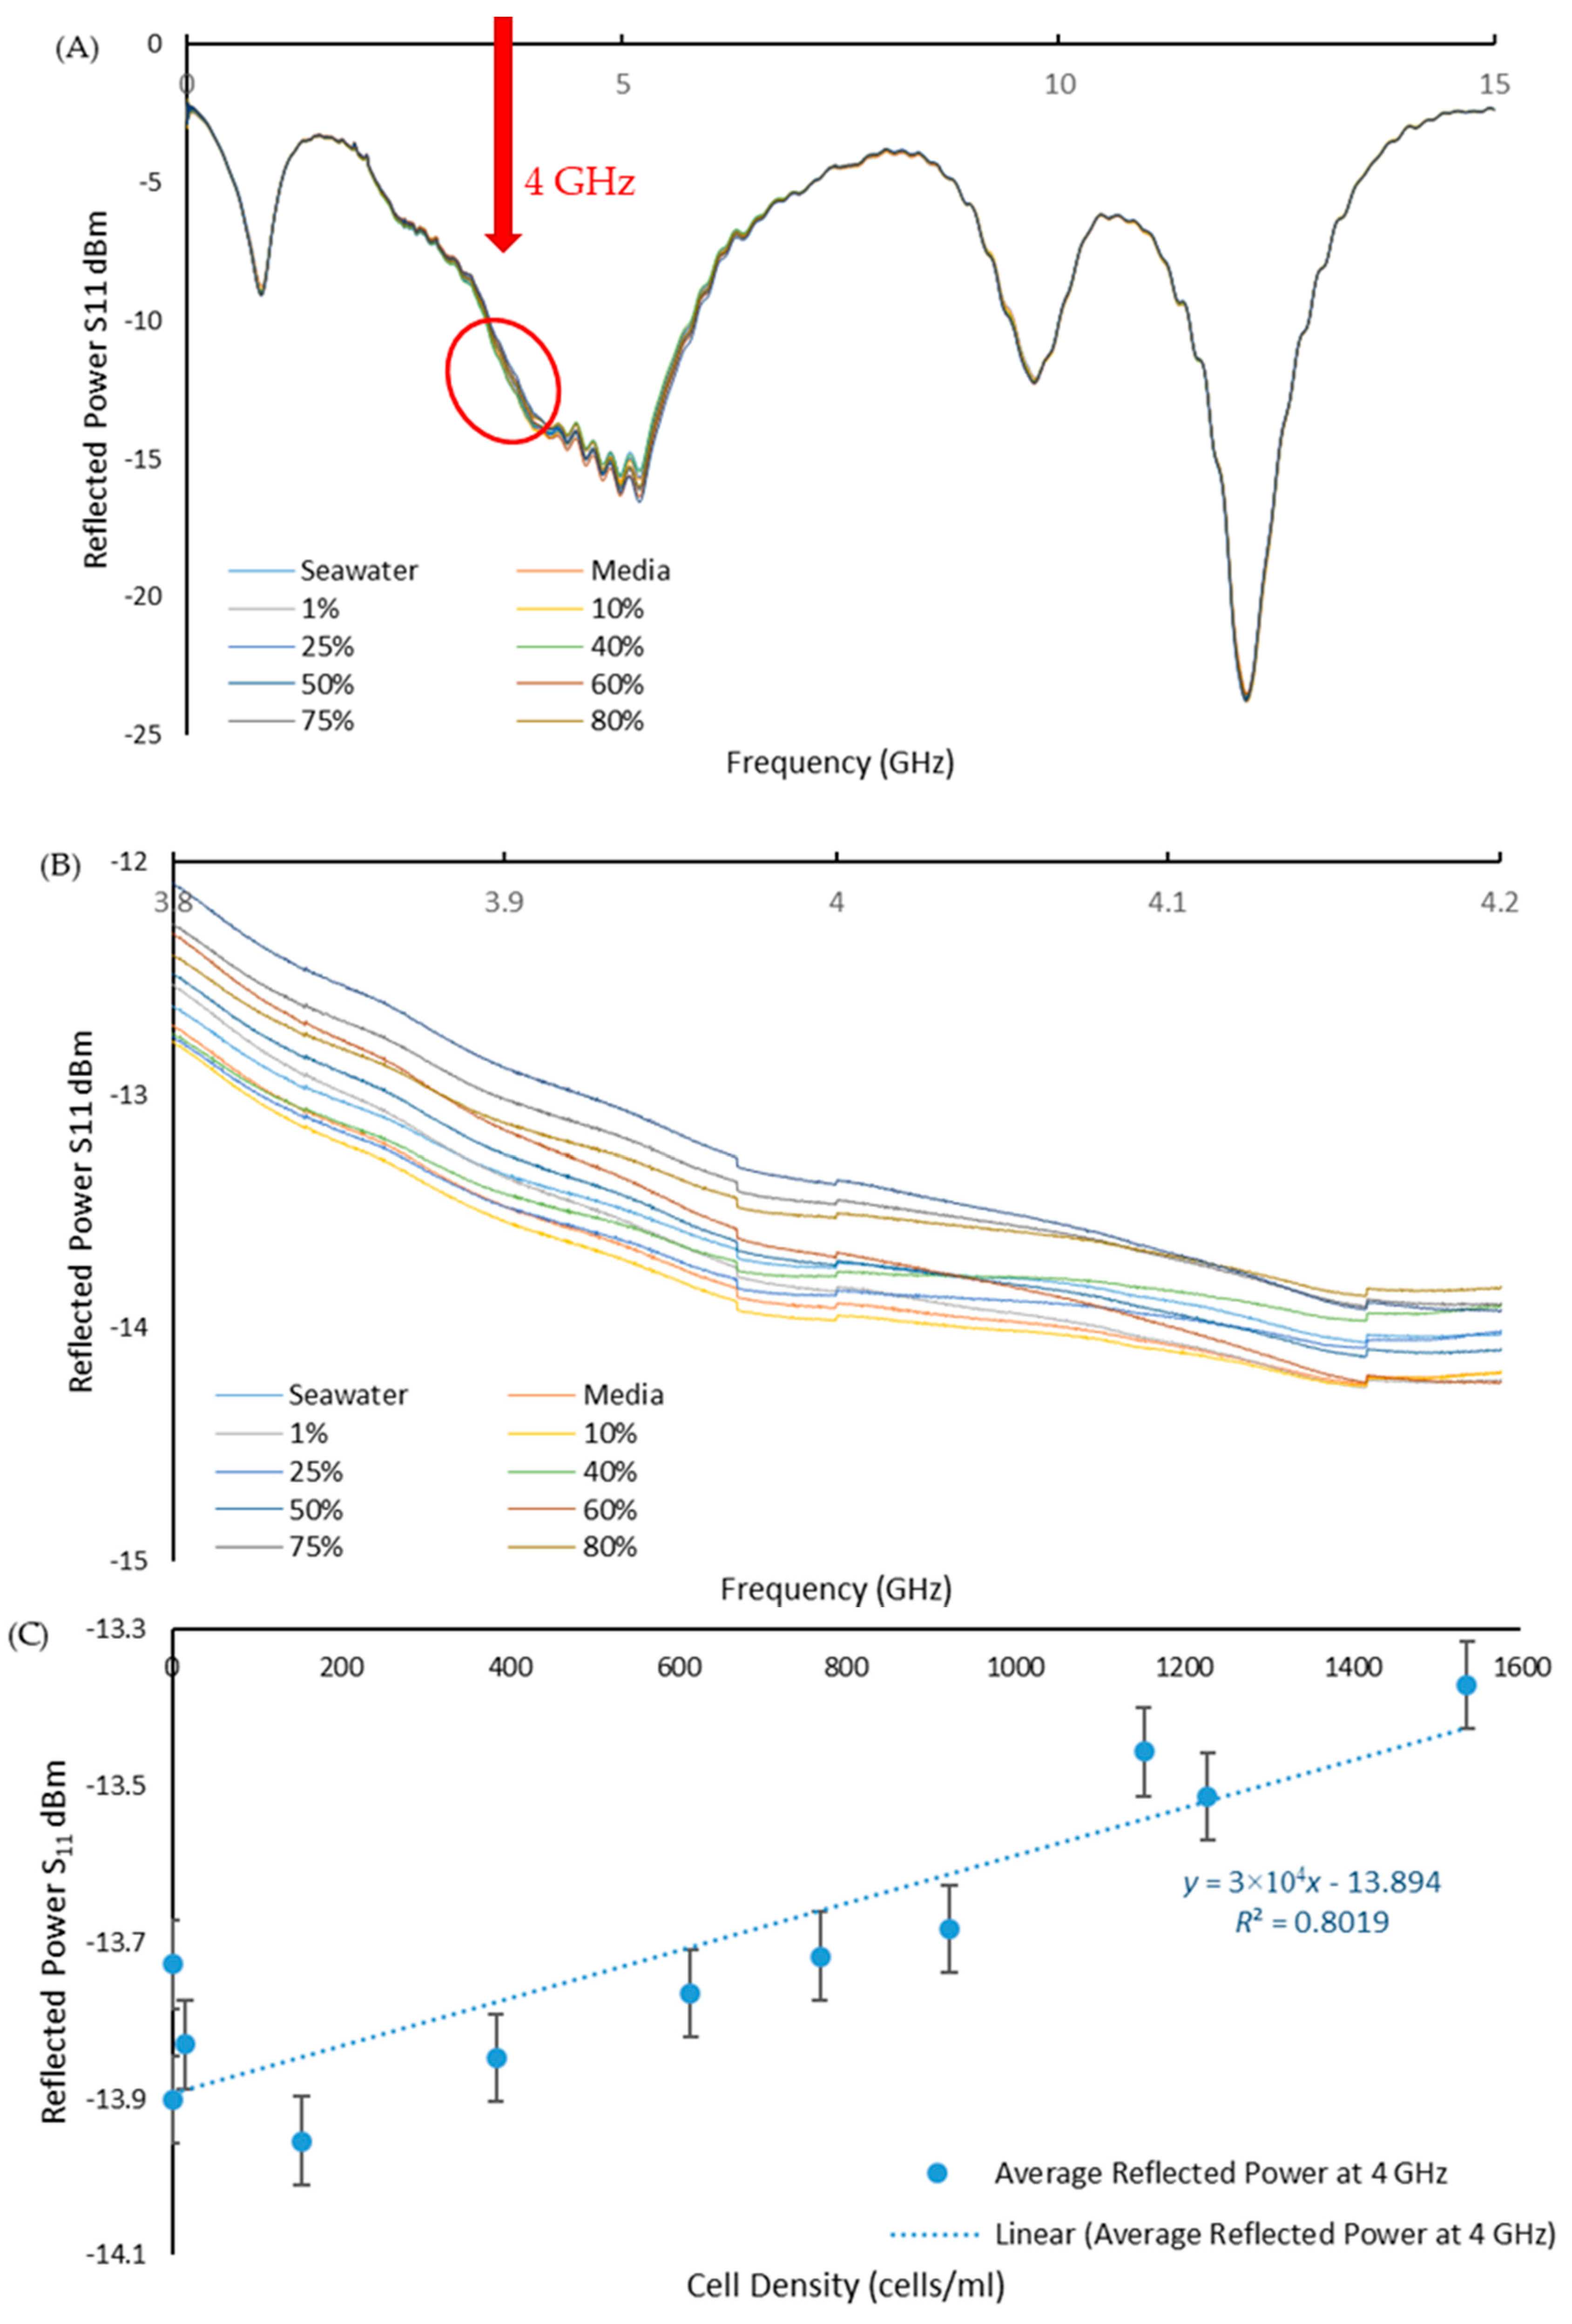
3.3. Planar Electromagnetic Wave Sensors—Reflected Power S11 Versus Cell Density
4. Discussion and Conclusions
- Capacitance of the cell
- Capacitance of the medium
- Impedance
- Frequency
- Real parts of the complex permittivity of the suspension
- Imagined parts of the complex permittivity of the suspension
Author Contributions
Funding
Acknowledgments
Conflicts of Interest
References
- USGS. How Much Water Is There on, in, and above the Earth. Available online: https://water.usgs.gov/edu/earthhowmuch.html (accessed on 7 August 2018).
- Shiklomanov, I.A. Appraisal and Assessment of World Water Resources. Water Int. 2000, 25, 11–32. [Google Scholar] [CrossRef]
- Ghernaout, D. The Best Available Technology of Water/Wastewater Treatment and Seawater Desalination: Simulation of the Open Sky Seawater Distillation. Green Sustain. Chem. 2013, 3, 68–88. [Google Scholar] [CrossRef]
- UNWater. Managing Water under Uncertainty and Risk; UNWater: Geneva, Switzerland, 2012; Volume 1. [Google Scholar]
- UNWater. Water for a Sustainable World; UNWater: Geneva, Switzerland, 2015. [Google Scholar]
- Seoane, M.; Esperanza, M.; Rioboo, C.; Herrero, C.; Cid, Á. Flow Cytometric Assay to Assess Short-Term Effects of Personal Care Products on the Marine Microalga Tetraselmis Suecica. Chemosphere 2017, 171, 339–347. [Google Scholar] [CrossRef] [PubMed]
- Faimali, M.; Giussani, V.; Piazza, V.; Garaventa, F.; Corrà, C.; Asnaghi, V.; Privitera, D.; Gallus, L.; Cattaneo-vietti, R.; Mangialajo, L.; et al. Toxic Effects of Harmful Benthic Dino Fl Agellate Ostreopsis Ovata on Invertebrate and Vertebrate Marine Organisms. Mar. Environ. Res. 2012, 76, 97–107. [Google Scholar] [CrossRef] [PubMed]
- Lindholm, T.; Öhman, P.; Kurki-helasmo, K.; Kincaid, B.; Meriluoto, J. Toxic Algae and Fish Mortality in a Brackish-Water Lake in Åland, SW Finland. Hydrobiologia 1999, 397, 109–120. [Google Scholar] [CrossRef]
- Van Dolah, F.M. Marine Algal Toxins: Origins, Health Effects, and Their Increased Occurrence. Environ. Health Perspect. 2000, 108 (Suppl. 1), 133–141. [Google Scholar] [CrossRef] [PubMed]
- Hallegraeff, G.M. A Review of Harmful Algal Blooms and Their Apparent Global Increase. Phycologia 1993, 32, 79–99. [Google Scholar] [CrossRef]
- Marangoni, C.; Pienaar, R.N.; Sym, S.D. Possible Introduction of Alien Phytoplankton via Shipping Ballast Water: A South African Perspective. S. Afr. J. Bot. 2001, 67, 465–474. [Google Scholar] [CrossRef]
- Ribeiro, S.; Amorim, A.; Andersen, T.J.; Abrantes, F.; Ellengaard, M. Reconstructing the History of an Invasion: The Toxic Phytoplankton Species Gymnodinium Catenatum in the Northeast Atlantic. Biol. Invasions 2012, 14, 969–985. [Google Scholar] [CrossRef]
- Boudouresque, C.F.; Verlaque, M. Biological Pollution in the Mediterranean Sea: Invasive versus Introduced Macrophytes Charles Franc. Mar. Pollut. Bull. 2002, 44, 32–38. [Google Scholar] [CrossRef]
- IMO. International Convention for the Control and Management of Ships’ Ballast Water and Sediments (BWM); International Maritime Organization: London, UK, 2004. [Google Scholar]
- Streftaris, N.; Zenetos, A. Alien Marine Species in the Mediterranean—The 100 ‘Worst Invasives’ and Their Impact. Mediterr. Mar. Sci. 2006, 7, 87–118. [Google Scholar] [CrossRef]
- Mccarthyl, S.A.; Khambaty, F.M. International Dissemination of Epidemic Vibrio Cholerae by Cargo Ship Ballast and Other Nonpotable Waters. Appl. Environ. Microbiol. 1994, 60, 2597–2601. [Google Scholar]
- Nicole, J.C.; Douglas, D.S.; Nina, M.; Jordan, W.T.; Michael, W.; Ryan, J.A.; Vincent, R.H.; David, E.; Thomas, H.; Ariel, H.; et al. Preventing Maritime Transfer of Toxigenic Vibrio Cholerae. Emerg. Infect. Dis. J. 2012, 18, 1680. [Google Scholar]
- Ruiz, G.M.; Rawlings, T.K.; Dobbs, F.C.; Drake, L.A.; Mullady, T.; Huq, A.; Colwell, R.R. Global Spread of Microorganisms by Ships. Nature 2000, 408, 49–50. [Google Scholar] [CrossRef] [PubMed]
- Anderson, D.M.; Couture, D.A.; Kleindinst, J.L.; Keafer, B.A.; McGillicuddy, D.J.; Martin, J.L.; Richlen, M.L.; Hickey, J.M.; Solow, A.R. Understanding Interannual, Decadal Level Variability in Paralytic Shellfish Poisoning Toxicity in the Gulf of Maine: The HAB Index. Deep Sea Res. Part II Top. Stud. Oceanogr. 2014, 103, 264–276. [Google Scholar] [CrossRef] [PubMed]
- Cembella, A.D.; Sullivan, J.J.; Boyer, G.L.; Taylor, F.J.R.; Andersen, R.J. Variation in Paralytic Shellfish Toxin Composition within the Pmtogonyaulax Tamarensislcatenella Species Complex; Red Tide Dinoflagellates. Biochem. Syst. Ecol. 1987, 15, 171–186. [Google Scholar] [CrossRef]
- Mee, L.D.; Espinosa, M.; Diaz, G. Paralytic Shellfish Poisoning with a Gymnodinium Catenatum Red Tide on the Pacific Coast of Mexico. Mar. Environ. Res. 1986, 19, 77–92. [Google Scholar] [CrossRef]
- Negri, A.P.; Bolch, C.J.S.; Geier, S.; Green, D.H.; Park, T.; Blackburn, S.I. Widespread Presence of Hydrophobic Paralytic Shellfish Toxins in Gymnodinium Catenatum. Harmful Algae 2007, 6, 774–780. [Google Scholar] [CrossRef]
- Hallegraeff, G.M. Ocean Climate Change, Phytoplankton Community Responses, and Harmful Algal Blooms: A Formidable Predictive Challenge. J. Phycol. 2010, 46, 220–235. [Google Scholar] [CrossRef]
- Jochimsen, E.M.; Carmichael, W.W.; An, J.S.; Cardo, D.M.; Cookson, S.T.; Holmes, C.E.; Antunes, M.B.; de Melo Filho, D.A.; Lyra, T.M.; Barreto, V.S.; et al. Liver Failure and Death after Exposure to Microcystins at a Hemodialysis Center in Brazil. N. Engl. J. Med. 1998, 338, 873–878. [Google Scholar] [CrossRef] [PubMed]
- Qin, B.; Zhu, G.; Gao, G.; Carmichael, W.W. A Drinking Water Crisis in Lake Taihu, China: Linkage to Climatic Variability and Lake Management. Environ. Manag. 2010, 45, 105–112. [Google Scholar] [CrossRef] [PubMed]
- Ueno, Y.; Nagata, S.; Tsutsumi, T. Detection of Microcystins, a Blue-Green Algal Hepatotoxin, in Drinking Water Sampled in Haimen and Fusui, Endemic Areas of Primary Liver Cancer in China, by Highly Sensitive Immunoassay Haimen. Carcinogenesis 1996, 17, 1317–1321. [Google Scholar] [CrossRef] [PubMed]
- Throndsen, J. Chapter 5—The Planktonic Marine Flagellates A2—Tomas, Carmelo R. In Identifying Marine Phytoplankton; Academic Press: San Diego, CA, USA, 1997; pp. 591–729. [Google Scholar]
- Hori, T.; Norris, R.E.; Chihara, M. Studies on the Ultrastructure and Taxonomy of the GenusTetraselmis (Prasinophyceae). Bot. Mag. 1982, 95, 49. [Google Scholar] [CrossRef]
- Carballo-Cárdenas, E.C.; Tuan, P.M.; Janssen, M.; Wijffels, R.H. Vitamin E (α-Tocopherol) Production by the Marine Microalgae Dunaliella Tertiolecta and Tetraselmis Suecica in Batch Cultivation. Biomol. Eng. 2003, 20, 139–147. [Google Scholar] [CrossRef]
- Mason, A.; Goh, J.H.; Korostynska, O.; Al-Shamma’a, A.I.; Browning, P.; Field, M. Real-Time Monitoring of Bodily Fluids Using a Novel Electromagnetic Wave Sensor. J. Public Health Front. 2013, 2, 201–206. [Google Scholar] [CrossRef]
- Caduff, A.; Talary, M.S.; Mueller, M.; Dewarrat, F.; Klisic, J.; Donath, M.; Heinemann, L.; Stahel, W.A. Non-Invasive Glucose Monitoring in Patients with Type 1 Diabetes: A Multisensor System Combining Sensors for Dielectric and Optical Characterisation of Skin. Biosens. Bioelectron. 2009, 24, 2778–2784. [Google Scholar] [CrossRef] [PubMed]
- Korostynska, O.; Ortoneda-Pedrola, M.; Mason, A.; Al-Shamma’a, A.I. Flexible Electromagnetic Wave Sensor Operating at GHz Frequencies for Instantaneous Concentration Measurements of NaCl, KCl, MnCl 2 and CuCl Solutions. Meas. Sci. Technol. 2014, 25, 65105. [Google Scholar] [CrossRef]
- Huang, C.-W.; Wei, C.-C.; Liao, V.H.-C. A Low Cost Color-Based Bacterial Biosensor for Measuring Arsenic in Groundwater. Chemosphere 2015, 141, 44–49. [Google Scholar] [CrossRef] [PubMed]
- Agranovich, D.; Renhart, I.; Ben Ishai, P.; Katz, G.; Bezman, D.; Feldman, Y. A Microwave Sensor for the Characterization of Bovine Milk. Food Control 2016, 63, 195–200. [Google Scholar] [CrossRef]
- Bjarnadottir, S.G.; Lunde, K.; Alvseike, O.; Mason, A.; Al-Shamma’a, A.I. Assessing Quality Parameters in Dry-Cured Ham Using Microwave Spectroscopy. Meat Sci. 2015, 108, 109–114. [Google Scholar] [CrossRef] [PubMed]
- Jilani, M.; Wen, W.; Cheong, L.; ur Rehman, M. A Microwave Ring-Resonator Sensor for Non-Invasive Assessment of Meat Aging. Sensors 2016, 16, 52. [Google Scholar] [CrossRef] [PubMed]
- Joshi, K.H.; Mason, A.; Korostynska, O.; Al-Shamma’a, A. Milk Quality Monitoring Using Electromagnetic Wave Sensors. In Sensors for Everyday Life: Environmental and Food Engineering; Mukhopadhyay, S.C., Postolache, O.A., Jayasundera, K.P., Swain, A.K., Eds.; Springer: Cham, Germany, 2017; pp. 205–227. [Google Scholar]
- Korostynska, O.; Blakey, R.; Mason, A.; Al-Shamma’a, A. Novel Method for Vegetable Oil Type Verification Based on Real-Time Microwave Sensing. Sens. Actuators A Phys. 2013, 202, 211–216. [Google Scholar] [CrossRef]
- Korostynska, O.; Mason, A.; Ortoneda-Pedrola, M.; Al-Shamma’a, A. Electromagnetic Wave Sensing of NO3 and COD Concentrations for Real-Time Environmental and Industrial Monitoring. Sens. Actuators B Chem. 2014, 198, 49–54. [Google Scholar] [CrossRef]
- Mason, A.; Abdullah, B.; Muradov, M.; Korostynska, O.; Al-Shamma’a, A.; Bjarnadottir, S.; Lunde, K.; Alvseike, O. Theoretical Basis and Application for Measuring Pork Loin Drip Loss Using Microwave Spectroscopy. Sensors 2016, 16, 182. [Google Scholar] [CrossRef] [PubMed]
- Yang, J.; Huang, M.; Peng, J.; Shi, J. Rapid Determination of the Moisture Content of Milk Powder by Microwave Sensor. Measurement 2016, 87, 83–86. [Google Scholar] [CrossRef]
- Blakey, R.T.; Morales-Partera, A.M. Microwave Dielectric Spectroscopy—A Versatile Methodology for Online, Non-Destructive Food Analysis, Monitoring and Process Control. Eng. Agric. Environ. Food 2016, 9, 264–273. [Google Scholar] [CrossRef]
- Cole, K.S.; Cole, R.H. Dispersion and Absorption in Dielectrics I. Alternating Current Characteristics. J. Chem. Phys. 1941, 9, 341–351. [Google Scholar] [CrossRef]
- Davidson, D.W.; Cole, R.H. Dielectric Relaxation in Glycerine. J. Chem. Phys. 1950, 18, 1417. [Google Scholar] [CrossRef]
- Davidson, D.W.; Cole, R.H. Dielectric Relaxation in Glycerol, Propylene Glycol, and N-Propanol. J. Chem. Phys. 1951, 19, 1484–1490. [Google Scholar] [CrossRef]
- Havriliak, S.; Negami, S. A Complex Plane Representation of Dielectric and Mechanical Relaxation Processes in Some Polymers. Polymer 1967, 8, 161–210. [Google Scholar] [CrossRef]
- Moheimani, N.R. Inorganic Carbon and PH Effect on Growth and Lipid Productivity of Tetraselmis Suecica and Chlorella Sp (Chlorophyta) Grown Outdoors in Bag Photobioreactors. J. Appl. Phycol. 2013, 25, 387–398. [Google Scholar] [CrossRef]
- Perez-Lopez, P.; Gonzalez-Garcia, S.; Ulloa, R.G.; Sineiro, J.; Feijoo, G.; Moreira, M.T. Life Cycle Assessment of the Production of Bioactive Compounds from Tetraselmis Suecica at Pilot Scale. J. Clean. Prod. 2014, 64, 323–331. [Google Scholar] [CrossRef]
- Griffiths, M.J.; Garcin, C.; van Hille, R.P.; Harrison, S.T.L. Interference by Pigment in the Estimation of Microalgal Biomass Concentration by Optical Density. J. Microbiol. Methods 2011, 85, 119–123. [Google Scholar] [CrossRef] [PubMed]
- Buchner, R.; Barthel, J.; Stauber, J. The Dielectric Relaxation of Water between 0 °C and 35 °C. Chem. Phys. Lett. 1999, 306, 57–63. [Google Scholar] [CrossRef]
- Napijalo, M.L.; Nikolić, Z.; Dojčilović, J.; Napijalo, M.M.; Novaković, L. Temperature Dependence of Electric Permittivity of Linear Dielectrics with Ionic and Polar Covalent Bonds. J. Phys. Chem. Solids 1998, 59, 1255–1258. [Google Scholar] [CrossRef]
- Bidigare, R.R.; Ondrusek, M.E.; Morrow, J.H.; Kiefer, D.A. In-Vivo Absorption Properties of Algal Pigments. Proc. SPIE 1990, 1302, 290–303. [Google Scholar] [CrossRef]
- Lichtenthaler, H.K. Chlorophylls and Carotenoids: Pigments of Photosynthetic Biomembranes. Methods Enzymol. 1987, 148, 350–382. [Google Scholar]
- Song, Y.; Li, M.; Yang, J.; Wang, J.; Pan, X.; Sun, Y.; Li, D. Capacitive Detection of Living Microalgae in a Microfluidic Chip. Sens Actuators B Chem. 2014, 194, 164–172. [Google Scholar] [CrossRef]
- Blanch, S.; Aguasca, A. Seawater Dielectric Permittivity Model from Measurements at L Band. Proc. IEEE Int. 2004, 2, 1362–1365. [Google Scholar]
- Nörtemann, K.; Hilland, J.; Kaatze, U. Dielectric Properties of Aqueous NaCl Solutions at Microwave Frequencies. J. Phys. Chem. A 1997, 101, 6864–6869. [Google Scholar] [CrossRef]


© 2018 by the authors. Licensee MDPI, Basel, Switzerland. This article is an open access article distributed under the terms and conditions of the Creative Commons Attribution (CC BY) license (http://creativecommons.org/licenses/by/4.0/).
Share and Cite
Moejes, K.B.; Sherif, R.S.R.; Dürr, S.; Conlan, S.; Mason, A.; Korostynska, O. Real-Time Monitoring of Tetraselmis suecica in A Saline Environment as Means of Early Water Pollution Detection. Toxics 2018, 6, 57. https://doi.org/10.3390/toxics6040057
Moejes KB, Sherif RSR, Dürr S, Conlan S, Mason A, Korostynska O. Real-Time Monitoring of Tetraselmis suecica in A Saline Environment as Means of Early Water Pollution Detection. Toxics. 2018; 6(4):57. https://doi.org/10.3390/toxics6040057
Chicago/Turabian StyleMoejes, Karin Brenda, Reshma Sulthana Rahiman Sherif, Simone Dürr, Sheelagh Conlan, Alex Mason, and Olga Korostynska. 2018. "Real-Time Monitoring of Tetraselmis suecica in A Saline Environment as Means of Early Water Pollution Detection" Toxics 6, no. 4: 57. https://doi.org/10.3390/toxics6040057
APA StyleMoejes, K. B., Sherif, R. S. R., Dürr, S., Conlan, S., Mason, A., & Korostynska, O. (2018). Real-Time Monitoring of Tetraselmis suecica in A Saline Environment as Means of Early Water Pollution Detection. Toxics, 6(4), 57. https://doi.org/10.3390/toxics6040057