Survey of the Extent of the Persisting Effects of Methylmercury Pollution on the Inhabitants around the Shiranui Sea, Japan

 ,
,
Abstract
1. Introduction
2. Materials and Methods
2.1. Subjects
2.2. Epidemiological Conditions
2.3. Onset of Symptoms
2.4. Questionnaire on Complaints
2.5. Neurological Examination
2.6. Statistical Methods
2.6.1. Questionnaire on Symptoms and Neurological Examination
2.6.2. Score for Symptoms (Always), Symptoms (Always and Sometimes), and Neurological Signs
2.6.3. Analyses among Fish Ingestion, Score of Signs and Symptoms, and the Onset of Symptoms
2.6.4. Characteristics of Signs and Symptoms in Subjects Whose Sensory Disturbance Was Not Recognized
3. Results
3.1. The Subjects’ Background
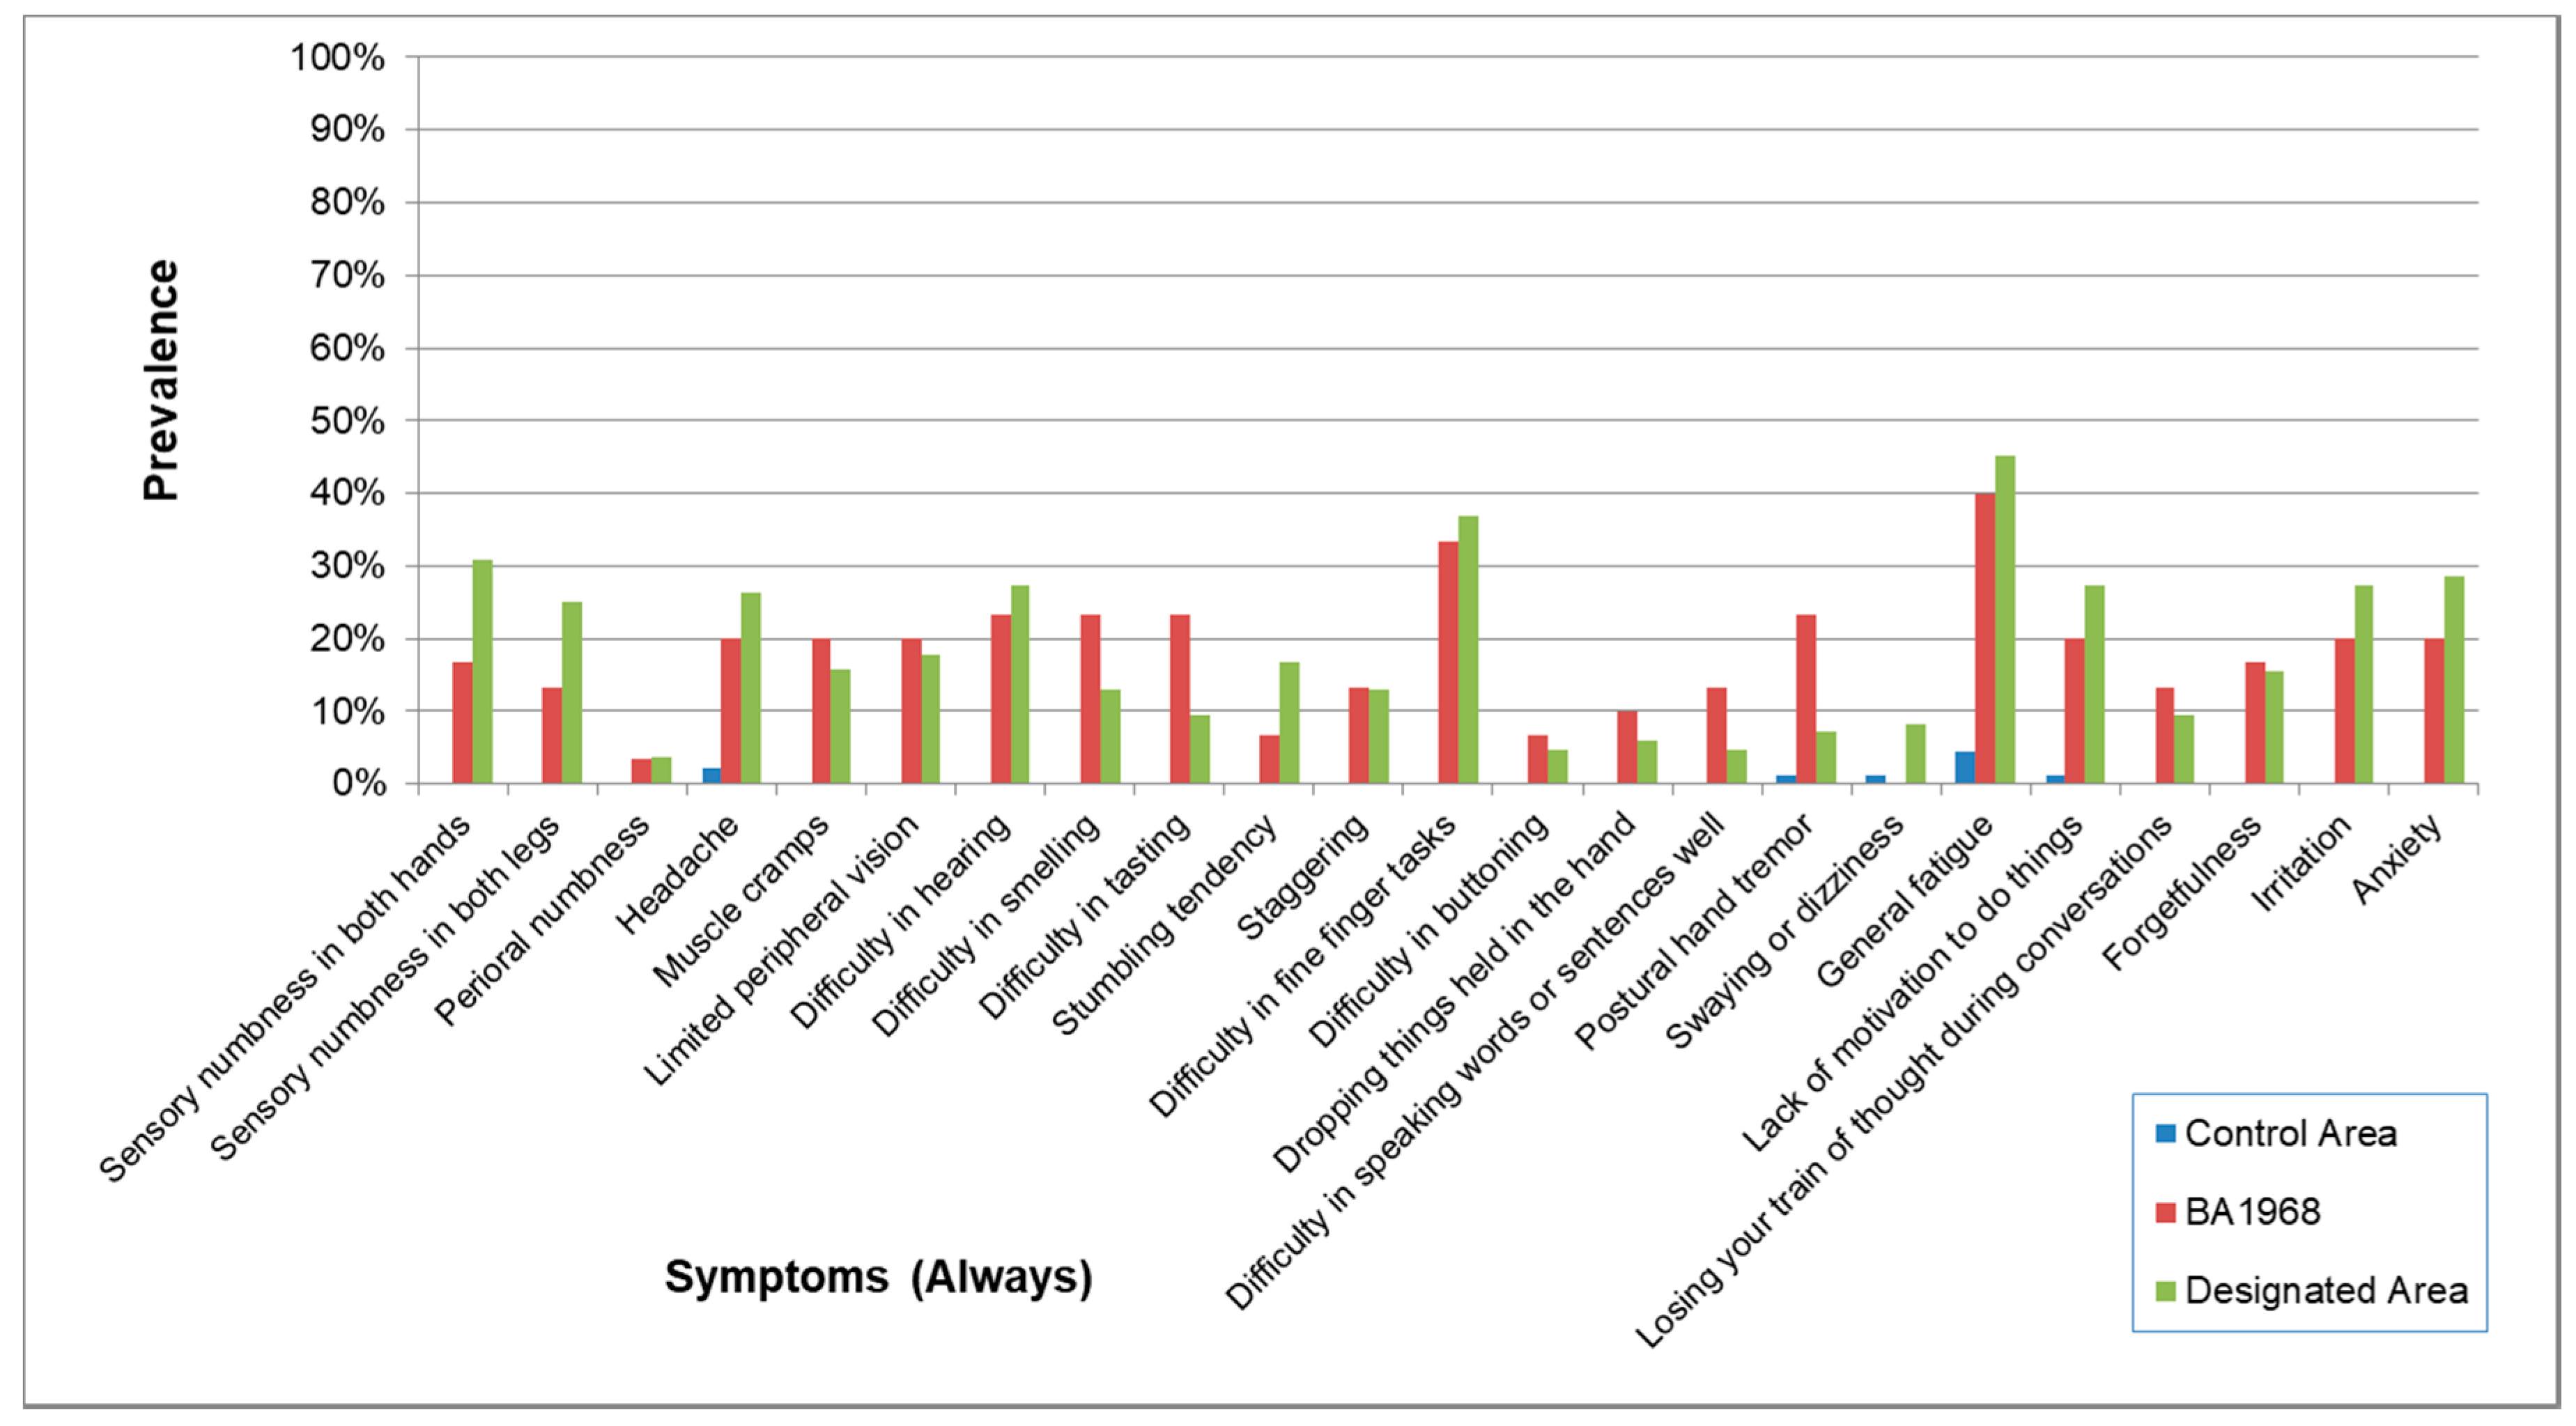
3.2. Questionnaire on Symptoms
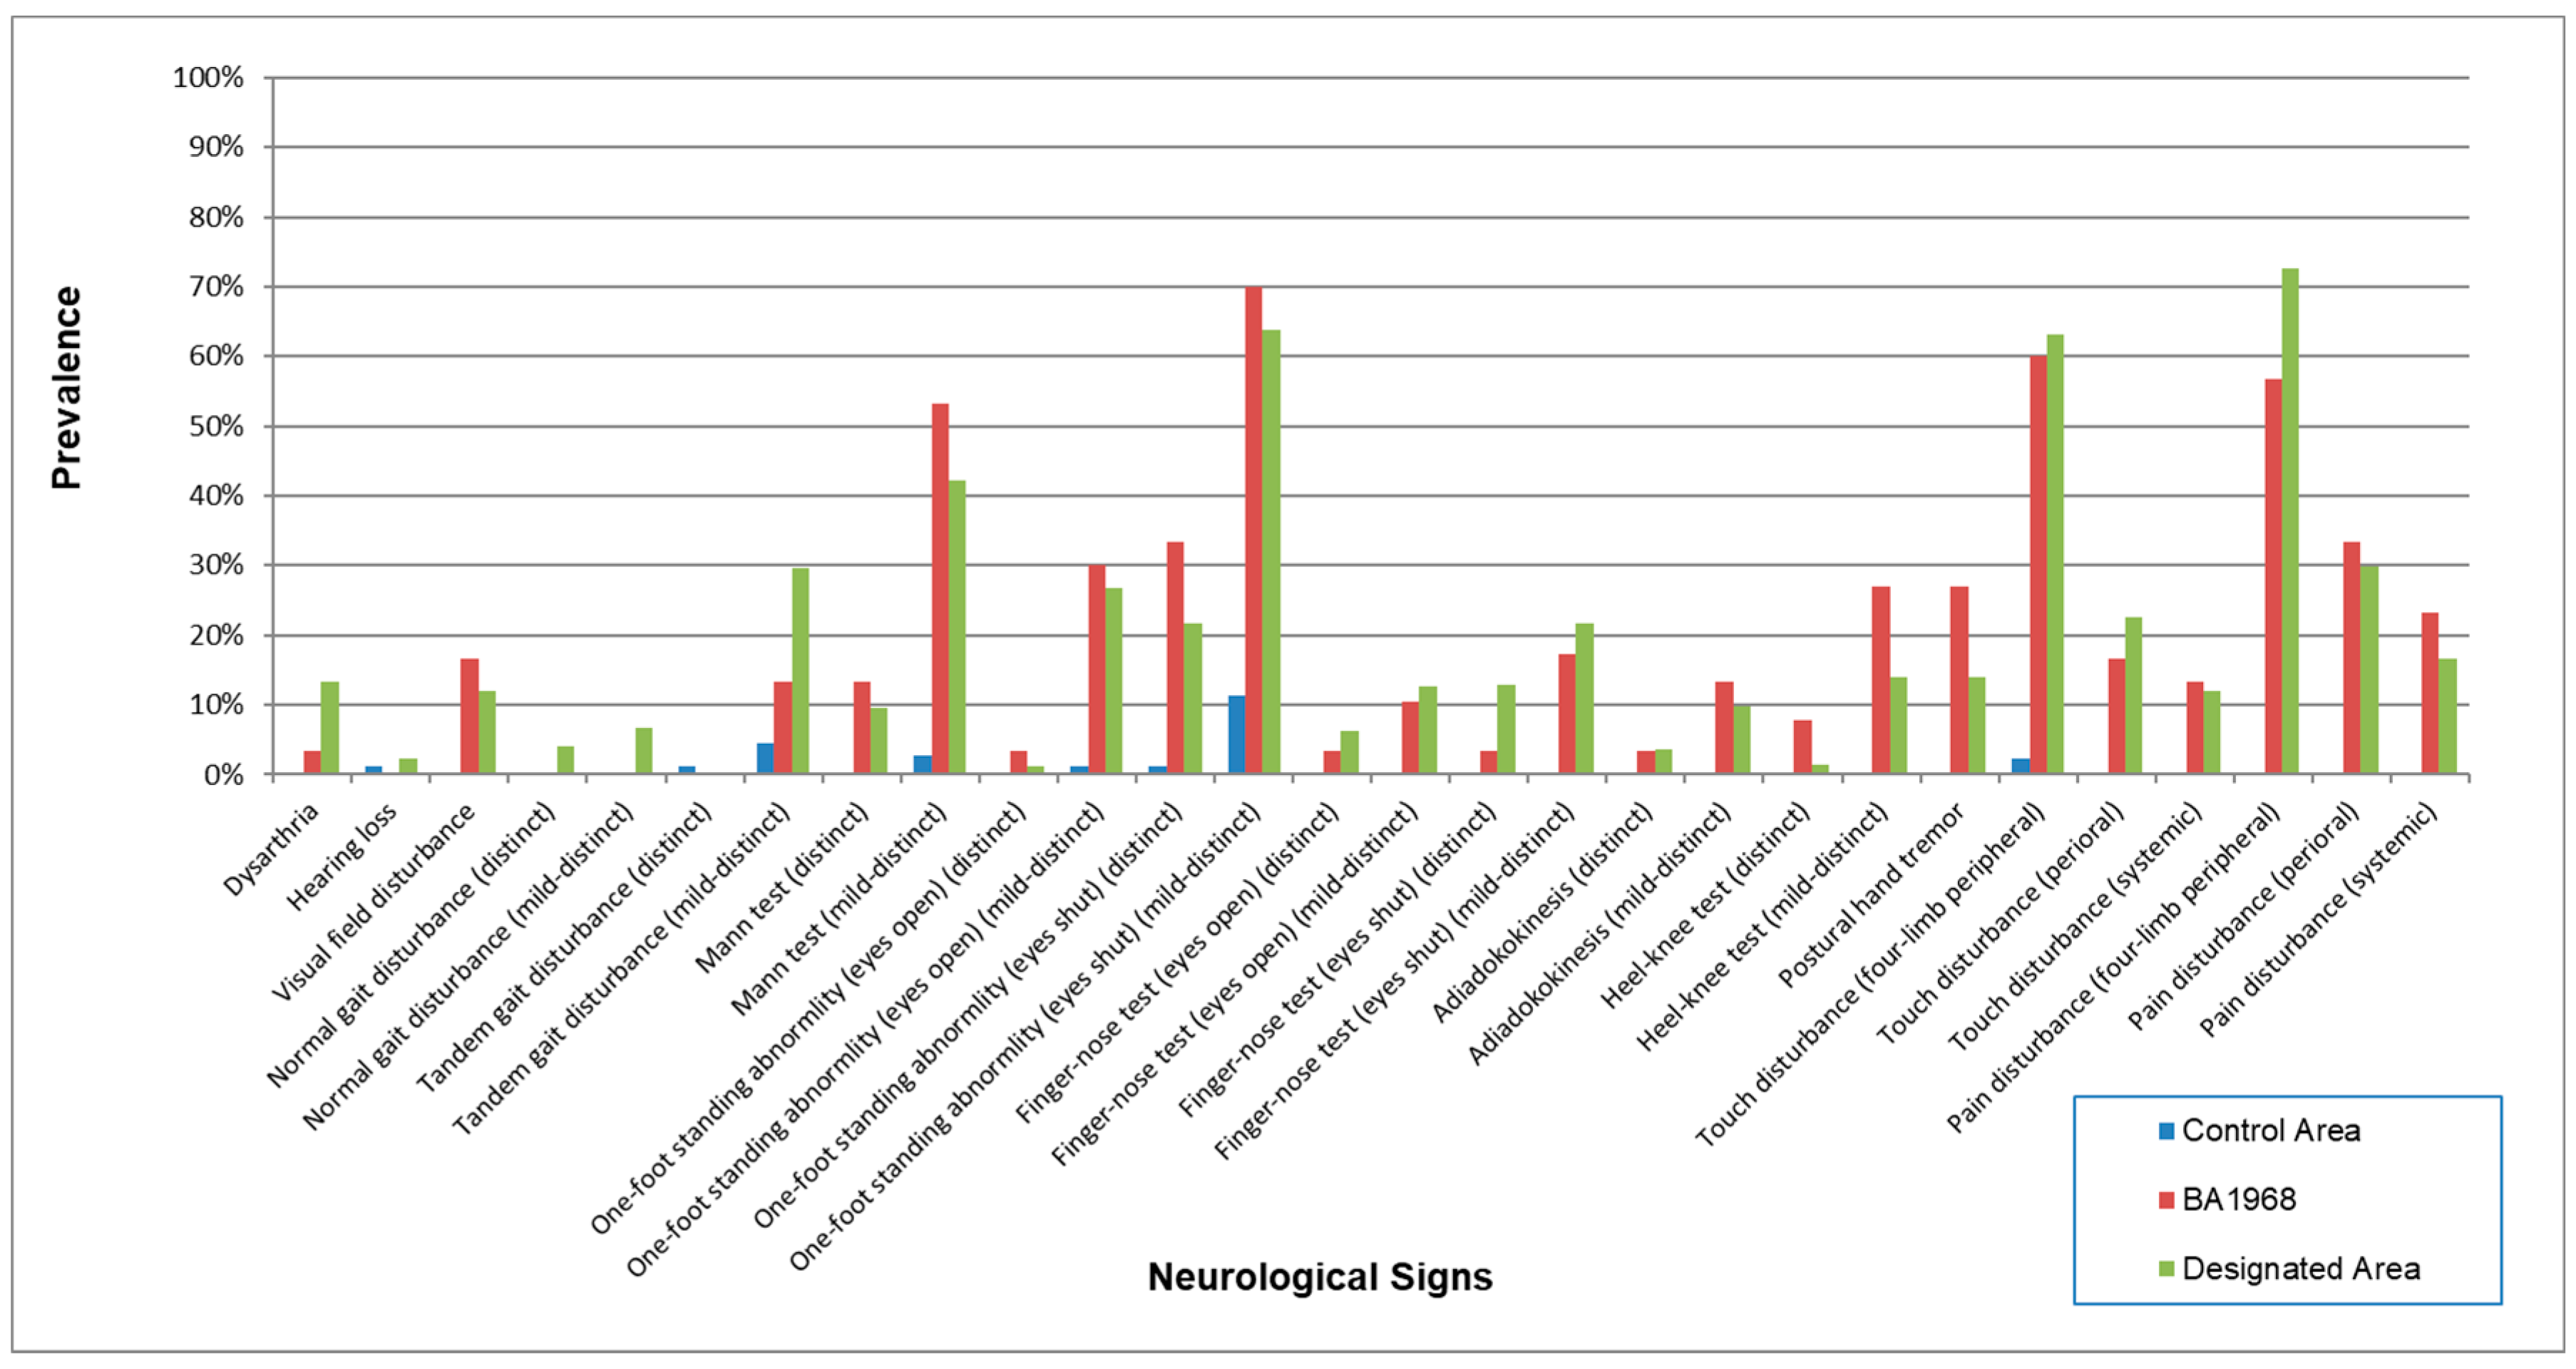
3.3. Neurological Signs
3.4. Scores of Signs and Symptoms
3.5. Onset of Symptoms
3.5.1. Onset of Symptoms in Each Group
3.5.2. Relation between the Onset of Symptoms and Frequency of Fish Ingestion
3.5.3. Relations between Onset of Symptom and Scores of Signs and Symptoms
3.6. Health Effect in Younger Generation
3.6.1. Characteristics of Younger Subjects in the Exposed and the Control Area
3.6.2. Symptoms and Neurological Signs in the Younger Generation
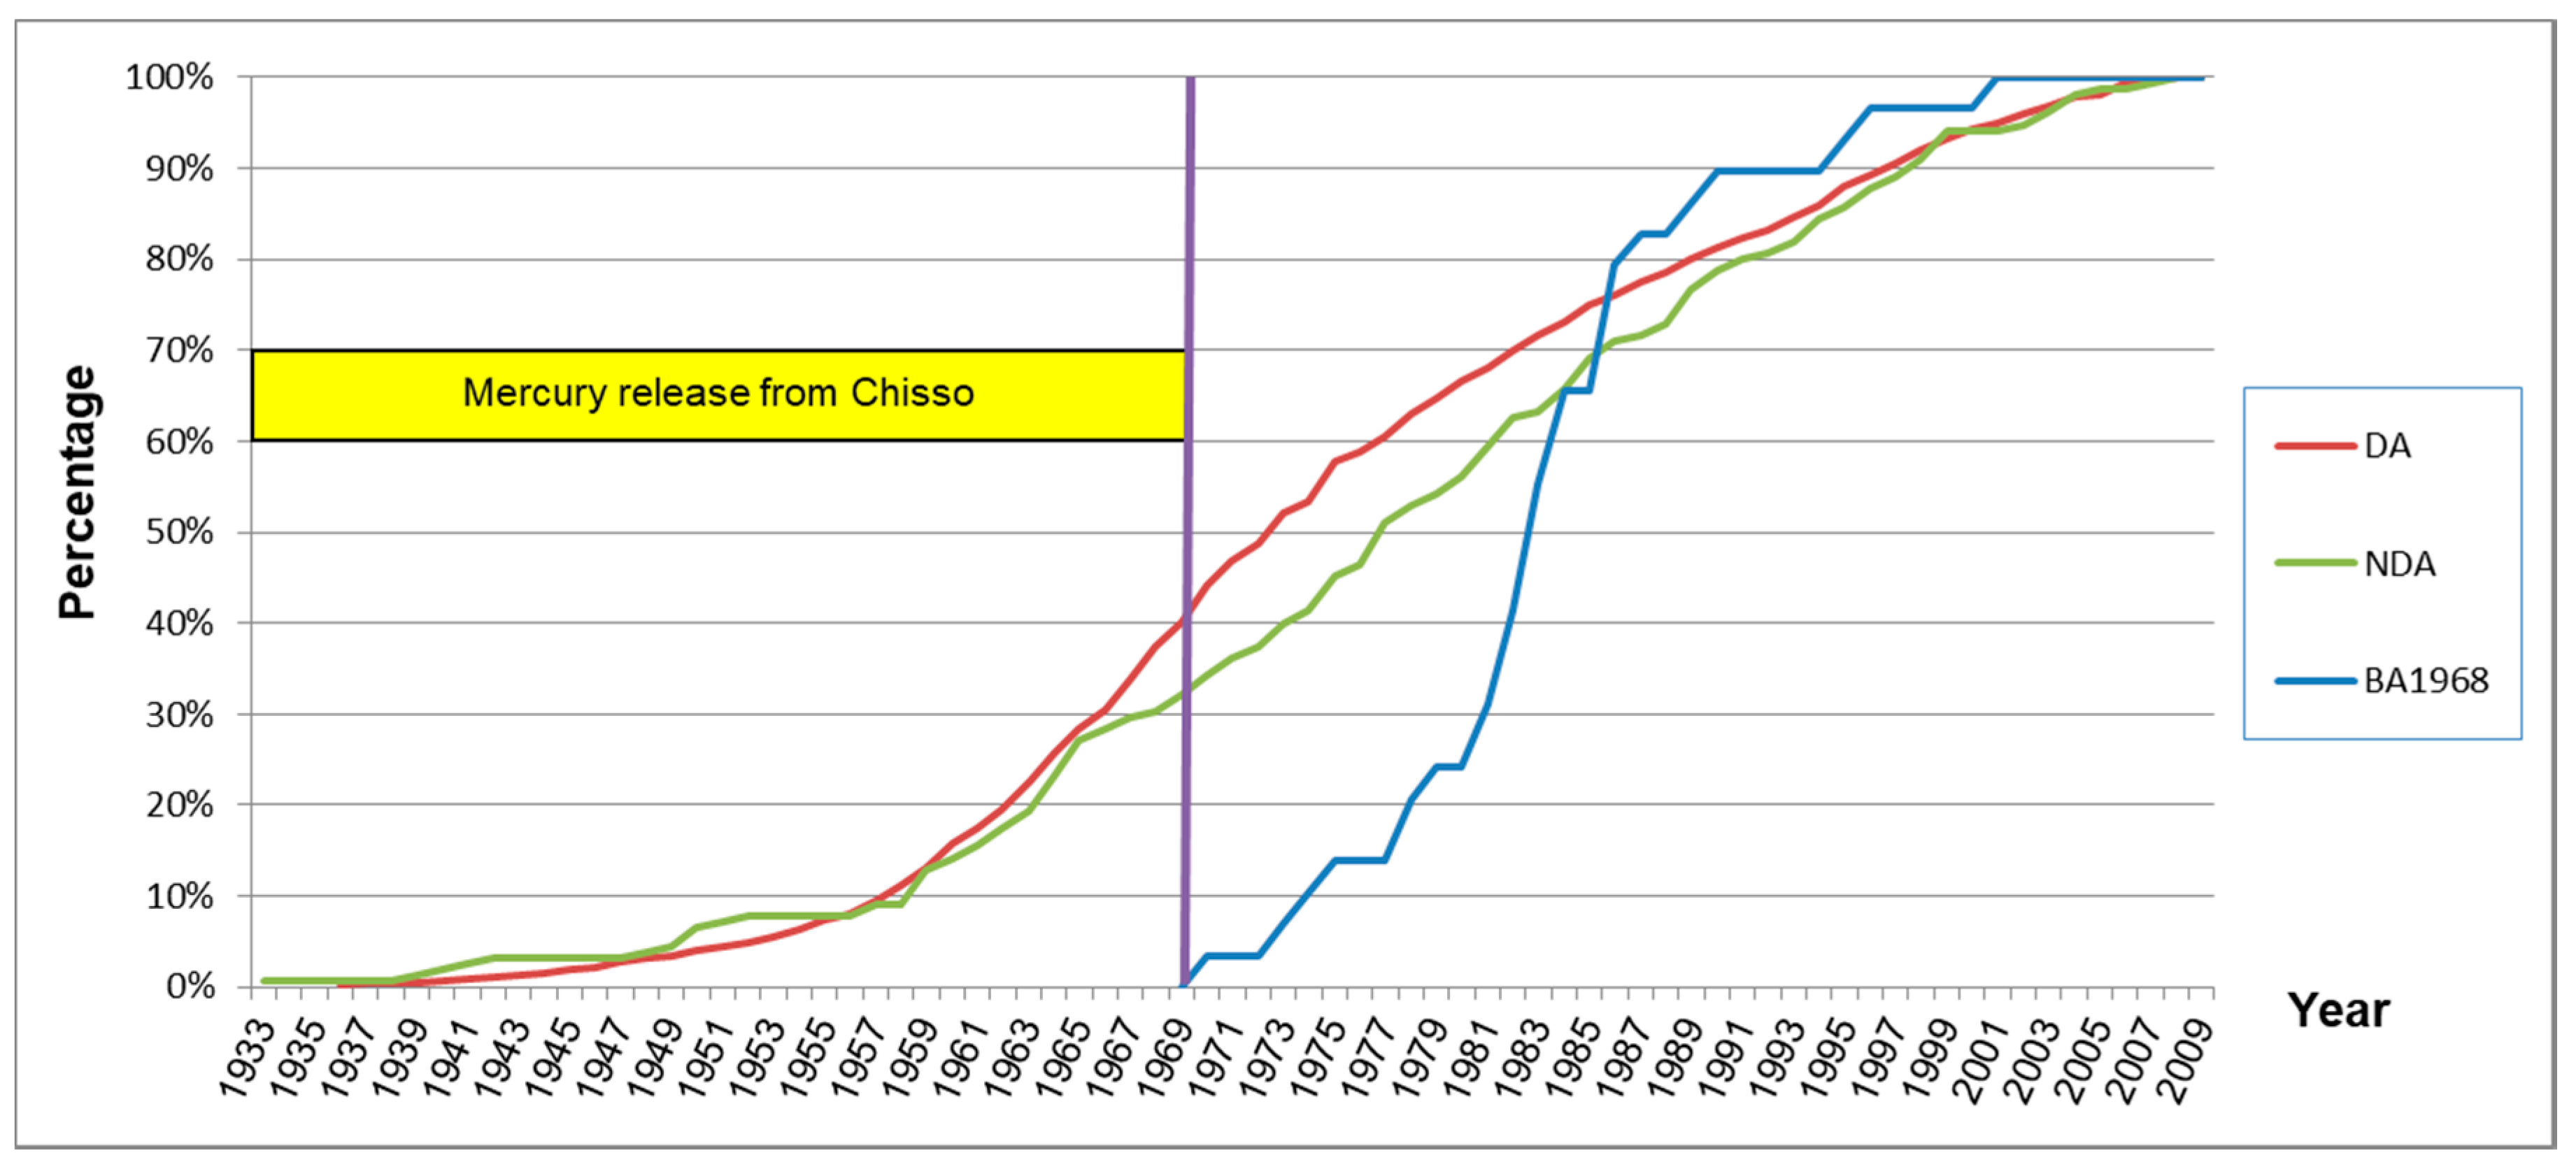
3.6.3. Onset of Symptoms of Designated, Non-Designated Area and Subjects Born after 1968
3.7. Signs and Symptoms in Subjects in Whom Sensory Disturbance had not been Detected during Their Physical Examination
4. Discussion
4.1. Characteristics of the Subjects
4.2. Characteristics of Signs and Symptoms of Chronic Methylmercury Poisonings
4.3. Dose-Response Relationship of Chronic Methylmercury Poisoning
4.4. Late Onset of Methylmercury Poisoning
4.5. How Far Had the Methylmercury Pollution Spread?
4.6. What Is the Longest Time, After Methylmercury Exposure, That Late Developing Symptoms Can Appear?
4.7. Signs and Symptoms in Subjects Whose Sensory Disturbance Was Not Recognized
4.8. Other Problems
5. Conclusions
Author Contributions
Funding
Acknowledgments
Conflicts of Interest
References
- Harada, M. Minamata disease: Methylmercury poisoning in japan caused by environmental pollution. Crit. Rev. Toxicol. 1995, 25, 1–24. [Google Scholar] [CrossRef] [PubMed]
- Yorifuji, T.; Tsuda, T.; Inoue, S.; Takao, S.; Harada, M.; Kawachi, I. Critical appraisal of the 1977 diagnostic criteria for minamata disease. Arch. Environ. Occup. Health 2013, 68, 22–29. [Google Scholar] [CrossRef] [PubMed]
- Uchino, M. Transition of Clinical Picture of Minamata Disease: Analysis of Neurological Symptom of Physical Examination for Certification of Minamata Disease; Japan Public Health Association: Tokyo, Japan, 1997; pp. 72–76. (In Japanese) [Google Scholar]
- Minamata City. Compensastion & relief of victims—Health measures for residents. In Minamata Disease—Its History and Lessons; Minamata City Planning Division: Minamata, Japan, 2000. [Google Scholar]
- Takizawa, Y.; Osame, M. A brief introduction to Minamata disease. In Methylmercury Poisoning in Minamata and Niigata, Japan; Takizawa, Y., Osame, M., Eds.; Japan Public Health Association: Tokyo, Japan, 2001; pp. 3–4. [Google Scholar]
- Takaoka, S.; Kawakami, Y.; Fujino, T.; Oh-ishi, F.; Motokura, F.; Kumagai, Y.; Miyaoka, T. Somatosensory disturbance by methylmercury exposure. Environ. Res. 2008, 107, 6–19. [Google Scholar] [CrossRef] [PubMed]
- Shigenaga, K.; Sato, K.; Takeuchi, T. Pathological changes of pancreatic islets in Minamata disease. Kumamoto Igakkai Zasshi 1974, 48, 189–198. (In Japanese) [Google Scholar]
- Harada, M. Clinical and epidemiological studies of Minamata disease in 16 years after onset. Shinkeikenkyuu no Shinpo 1972, 16, 870–880. (In Japanese) [Google Scholar]
- Tatetsu, S.; Kiyota, K.; Harada, M.; Miyakawa, T. Study on health effect on shiranui seacoast residents by ingestion of fish and shellfish polluted by organic mercury. In Epidemiological, Clinical, and Pathological Study on Minamata Disease 10 Years after the Outbreak; Medical School of Kumamoto University: Kumamoto, Japan, 1993; pp. 48–87. (In Japanese) [Google Scholar]
- Fujino, T. Clinical and epidemiological studies on chronic Minamata disease part I: Study on Katsurajima island. Kumamoto Med. J. 1994, 44, 139–155. [Google Scholar]
- Kinjo, Y.; Higashi, H.; Nakano, A.; Sakamoto, M.; Sakai, R. Profile of subjective complaints and activities of daily living among current patients with minamata disease after 3 decades. Environ. Res. 1993, 63, 241–251. [Google Scholar] [CrossRef] [PubMed]
- Sugiura, A. Health conditions among fishernen living in the Minamata disease prevalent area. Jpn. J. Public Health 1994, 41, 428–440. (In Japanese) [Google Scholar]
- Ninomiya, T.; Ohmori, H.; Hashimoto, K.; Tsuruta, K.; Ekino, S. Expansion of methylmercury poisoning outside of Minamata: An epidemiological study on chronic methylmercury poisoning outside of Minamata. Environ. Res. 1995, 70, 47–50. [Google Scholar] [CrossRef] [PubMed]
- Takeuchi, T. Neuropathology of Minamata disease: Especially at the chronic stage. In Neurotoxicology; Roizin, L., Shiraki, H., Grcevie, N., Eds.; Raven Press: New York, NY, USA, 1977; pp. 235–246. [Google Scholar]
- Ceccatelli, S.; Dare, E.; Moors, M. Methylmercury-induced neurotoxicity and apoptosis. Chem. Biol. Interact. 2010, 188, 301–308. [Google Scholar] [CrossRef] [PubMed]
- Uchino, M.; Araki, S. Clinical features of chronic Minamata disease (organic mercury poisoning). Analysis of the neurological findings in the most recent 100 cases. Rinsho Shinkeigaku 1984, 24, 235–239. (In Japanese) [Google Scholar] [PubMed]
- Central Council for Environmental Pollution Control. About Future Measures to Minamata Disease; The Environmental Agency: Bristol, UK, 1991. (In Japanese) [Google Scholar]
- Igata, A. Epidemiological and clinical features of Minamata disease. In Advances in Mercury Toxicology; Suzuki, T., Imura, N., Clarkson, T., Eds.; Plenum Press: New York, NY, USA, 1991; pp. 439–457. [Google Scholar]
- Bakir, F.; Damluji, S.F.; Amin-Zaki, L.; Murtadha, M.; Khalidi, A.; Al-Rawi, N.Y.; Tikriti, S.; Dahahir, H.I.; Clarkson, T.W.; Smith, J.C.; et al. Methylmercury poisoning in iraq. Science 1973, 181, 230–241. [Google Scholar] [CrossRef] [PubMed]
- Rice, D.C. Evidence for delayed neurotoxicity produced by methylmercury. Neurotoxicology 1996, 17, 583–596. [Google Scholar] [PubMed]
- Evans, H.L.; Garman, R.H.; Weiss, B. Methylmercury: Exposure duration and regional distribution as determinants of neurotoxicity in nonhuman primates. Toxicol. Appl. Pharmacol. 1977, 41, 15–33. [Google Scholar] [CrossRef]
- Weiss, B.; Clarkson, T.W.; Simon, W. Silent latency periods in methylmercury poisoning and in neurodegenerative disease. Environ. Health Perspect. 2002, 110 (Suppl. 5), 851–854. [Google Scholar] [CrossRef] [PubMed]
- Julvez, J.; Yorifuji, T.; Choi, A.L.; Grandjean, P. Chapter 2 epidemiological evidence on methylmercury neurotoxicity. In Methylmercury and Neurotoxicity; Ceccatelli, S., Aschner, M., Eds.; Springer: New York, NY, USA, 2012; pp. 14–35. [Google Scholar]
- Karagas, M.R.; Choi, A.L.; Oken, E.; Horvat, M.; Schoeny, R.; Kamai, E.; Cowell, W.; Grandjean, P.; Korrick, S. Evidence on the human health effects of low-level methylmercury exposure. Environ. Health Perspect. 2012, 120, 799–806. [Google Scholar] [CrossRef] [PubMed]


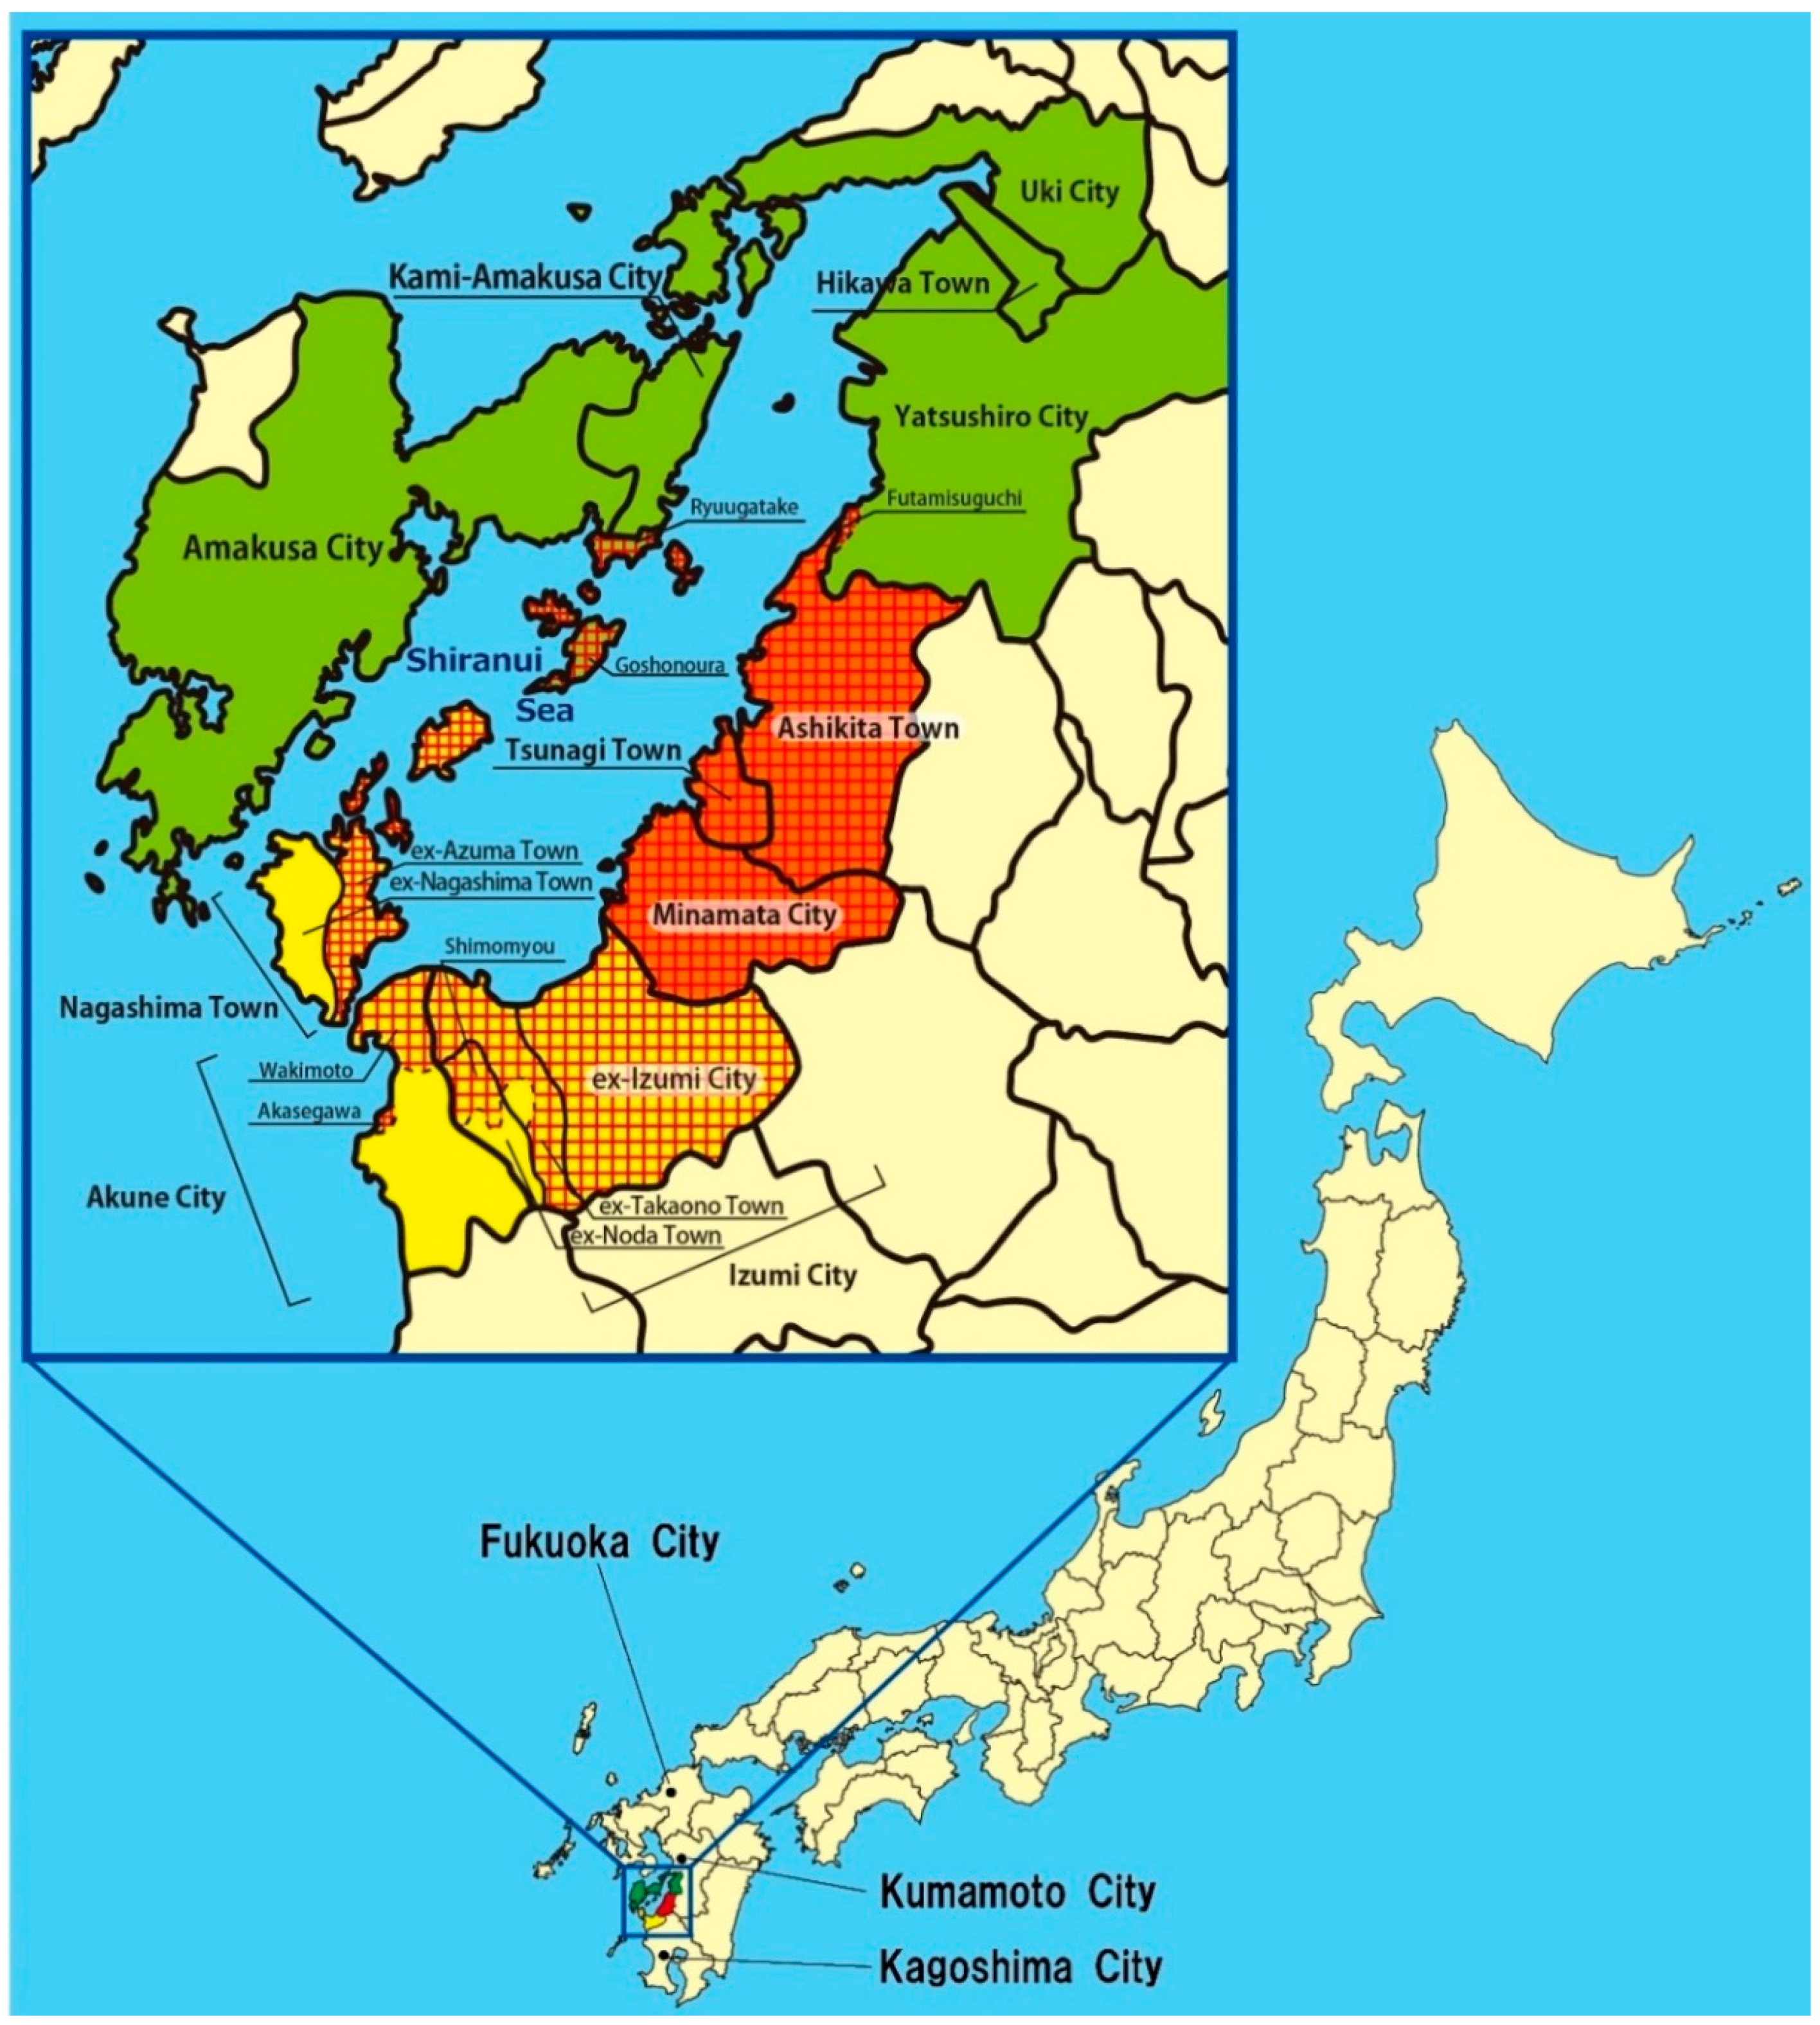
| Designated Area | Non-Designated Area | |
|---|---|---|
| Control Area | around Fukuoka City | |
| around Kumamoto City | ||
| around Kagoshima City | ||
| Minamata Area (Kumamoto Prefecture) | Minamata City | |
| Tsunagi Town | ||
| Ashikita Town * | ||
| Northern Area (Kumamoto Prefecture) | Goshonoura district, Amakusa City ** | Other districts of Amakusa City ** |
| Ryuugatake district, Kami-Amakusa City *** | Other districts of Kami-Amakusa City *** | |
| Futamisuguchi district, Yatsushiro City | Other districts of Yatsushiro City | |
| Uki City | ||
| Hikawa Town | ||
| Southern Area (Kagoshima Prefecture) | All ex-Izumi City district, Izumi City **** | Other districts of Izumi City **** |
| Euchi, Ookubo, Kamizuru, Shimozuru, and Shibabiki of ex-Takaono Town district, Izumi City **** | ||
| Shimomyo district of ex-Noda Town, Izumi City **** | ||
| All ex-Azuma Town district, Nagashima Town ***** | Other districts (All ex-Nagashima Town) of Nagashima Town ***** | |
| Wakimoto and Akasegawa districts of Akune City | Other districts of Akune City | |
| Other Areas | Other districts of Kumamoto Prefecture | |
| Other districts of Kagoshima Prefecture | ||
| Other Prefectures |
| Control Area | Minamata Area | Northern Area | Southern Area | Other Areas | |
|---|---|---|---|---|---|
| (n = 142) | (n = 259) | (n = 279) | (n = 246) | (n = 189) | |
| Sex, n (%) | |||||
| Male | 56 (39.4) | 136 (52.5) | 147 (52.7) | 121 (49.2) | 88 (46.6) |
| Female | 86 (60.6) | 123 (47.5) | 132 (47.3) | 125 (50.8) | 101 (53.4) |
| Age | |||||
| Mean ± SD | 62.0 ± 10.5 | 62.5 ± 13.6 | 64.0 ± 11.1 | 63.0 ± 11.1 | 58.6 ± 9.9 |
| Range (min–max) | 36–86 | 33–92 | 33–90 | 36–88 | 34–82 |
| Residential history in designated area (DA) more than 1 year, n (%) | |||||
| In DA > 1 year (DA) | 3 (2.1) | 234 (90.3) | 156 (55.9) | 222 (90.2) | 174 (92.1) |
| Not in DA > 1 year (NDA) | 139 (97.9) | 12 (4.6) | 116 (41.6) | 19 (7.7) | 10 (5.3) |
| Born after 1968 (BA1968) | 0 (0.0) | 13 (5.0) | 7 (2.5) | 5 (2.0) | 5 (2.6) |
| Smoking, n (%) | |||||
| Non-smoker | 109 (77.3) | 198 (76.4) | 226 (81.0) | 185 (75.2) | 133 (70.4) |
| Smoker | 32 (22.7) | 61 (23.6) | 53 (19.0) | 61 (24.8) | 56 (29.6) |
| Alcohol drinking, n (%) | |||||
| Non-drinker | 72 (51.1) | 136 (52.5) | 148 (53.0) | 129 (52.4) | 98 (51.9) |
| Drinker | 69 (48.9) | 123 (47.5) | 131 (47.0) | 117 (47.6) | 91 (48.1) |
| Frequency of fish intake, n (%) | |||||
| Three times a day | 6 (4.4) | 95 (36.7) | 166 (59.5) | 99 (40.2) | 99 (52.4) |
| Twice a day | 7 (5.1) | 61 (23.6) | 70 (25.1) | 94 (38.2) | 46 (24.3) |
| Once a day | 27 (19.9) | 59 (22.8) | 27 (9.7) | 35 (14.2) | 25 (13.2) |
| More than once a week | 63 (46.3) | 35 (13.5) | 13 (4.7) | 16 (6.5) | 15 (7.9) |
| Less than once a week | 33 (24.3) | 9 (3.5) | 3 (1.1) | 2 (0.8) | 4 (2.1) |
| Occupation, n (%) | |||||
| Fishermen (subject) | 0 (0.0) | 7 (2.7) | 82 (29.4) | 32 (13.0) | 10 (5.3) |
| Fishermen (subject’s parent) | 2 (1.4) | 28 (10.8) | 153 (54.8) | 78 (31.7) | 60 (31.7) |
| Complications, n (%) | |||||
| Hypertension | 40 (28.2) | 85 (32.8) | 118 (42.3) | 102 (41.5) | 43 (22.8) |
| Renal diseases | 3 (2.1) | 17 (6.6) | 10 (3.6) | 13 (5.3) | 15 (7.9) |
| Liver diseases | 6 (4.2) | 20 (7.7) | 17 (6.1) | 20 (8.1) | 14 (7.4) |
| Respiratory diseases | 12 (8.5) | 14 (5.4) | 8 (2.9) | 6 (2.4) | 13 (6.9) |
| Diabetes Mellitus | 3 (2.1) | 17 (6.6) | 37 (13.3) | 24 (9.8) | 15 (7.9) |
| Orthopedic diseases | 13 (9.2) | 60 (23.2) | 72 (25.8) | 62 (25.2) | 52 (27.5) |
| Malignant diseases | 7 (4.9) | 12 (4.6) | 11 (3.9) | 17 (6.9) | 11 (5.8) |
| History of application for Minamata disease, n (%) | 0 (0.0) | 33 (12.7) | 24 (8.6) | 38 (15.4) | 17 (9.0) |
| Family history of Minamata disease, n (%) | 0 (0.0) | 164 (63.3) | 108 (38.7) | 123 (50.0) | 151 (79.9) |
| Have witnessed abnormal animal behavior, n (%) | No Data | 100 (38.6) | 103 (36.9) | 108 (43.9) | 76 (40.2) |
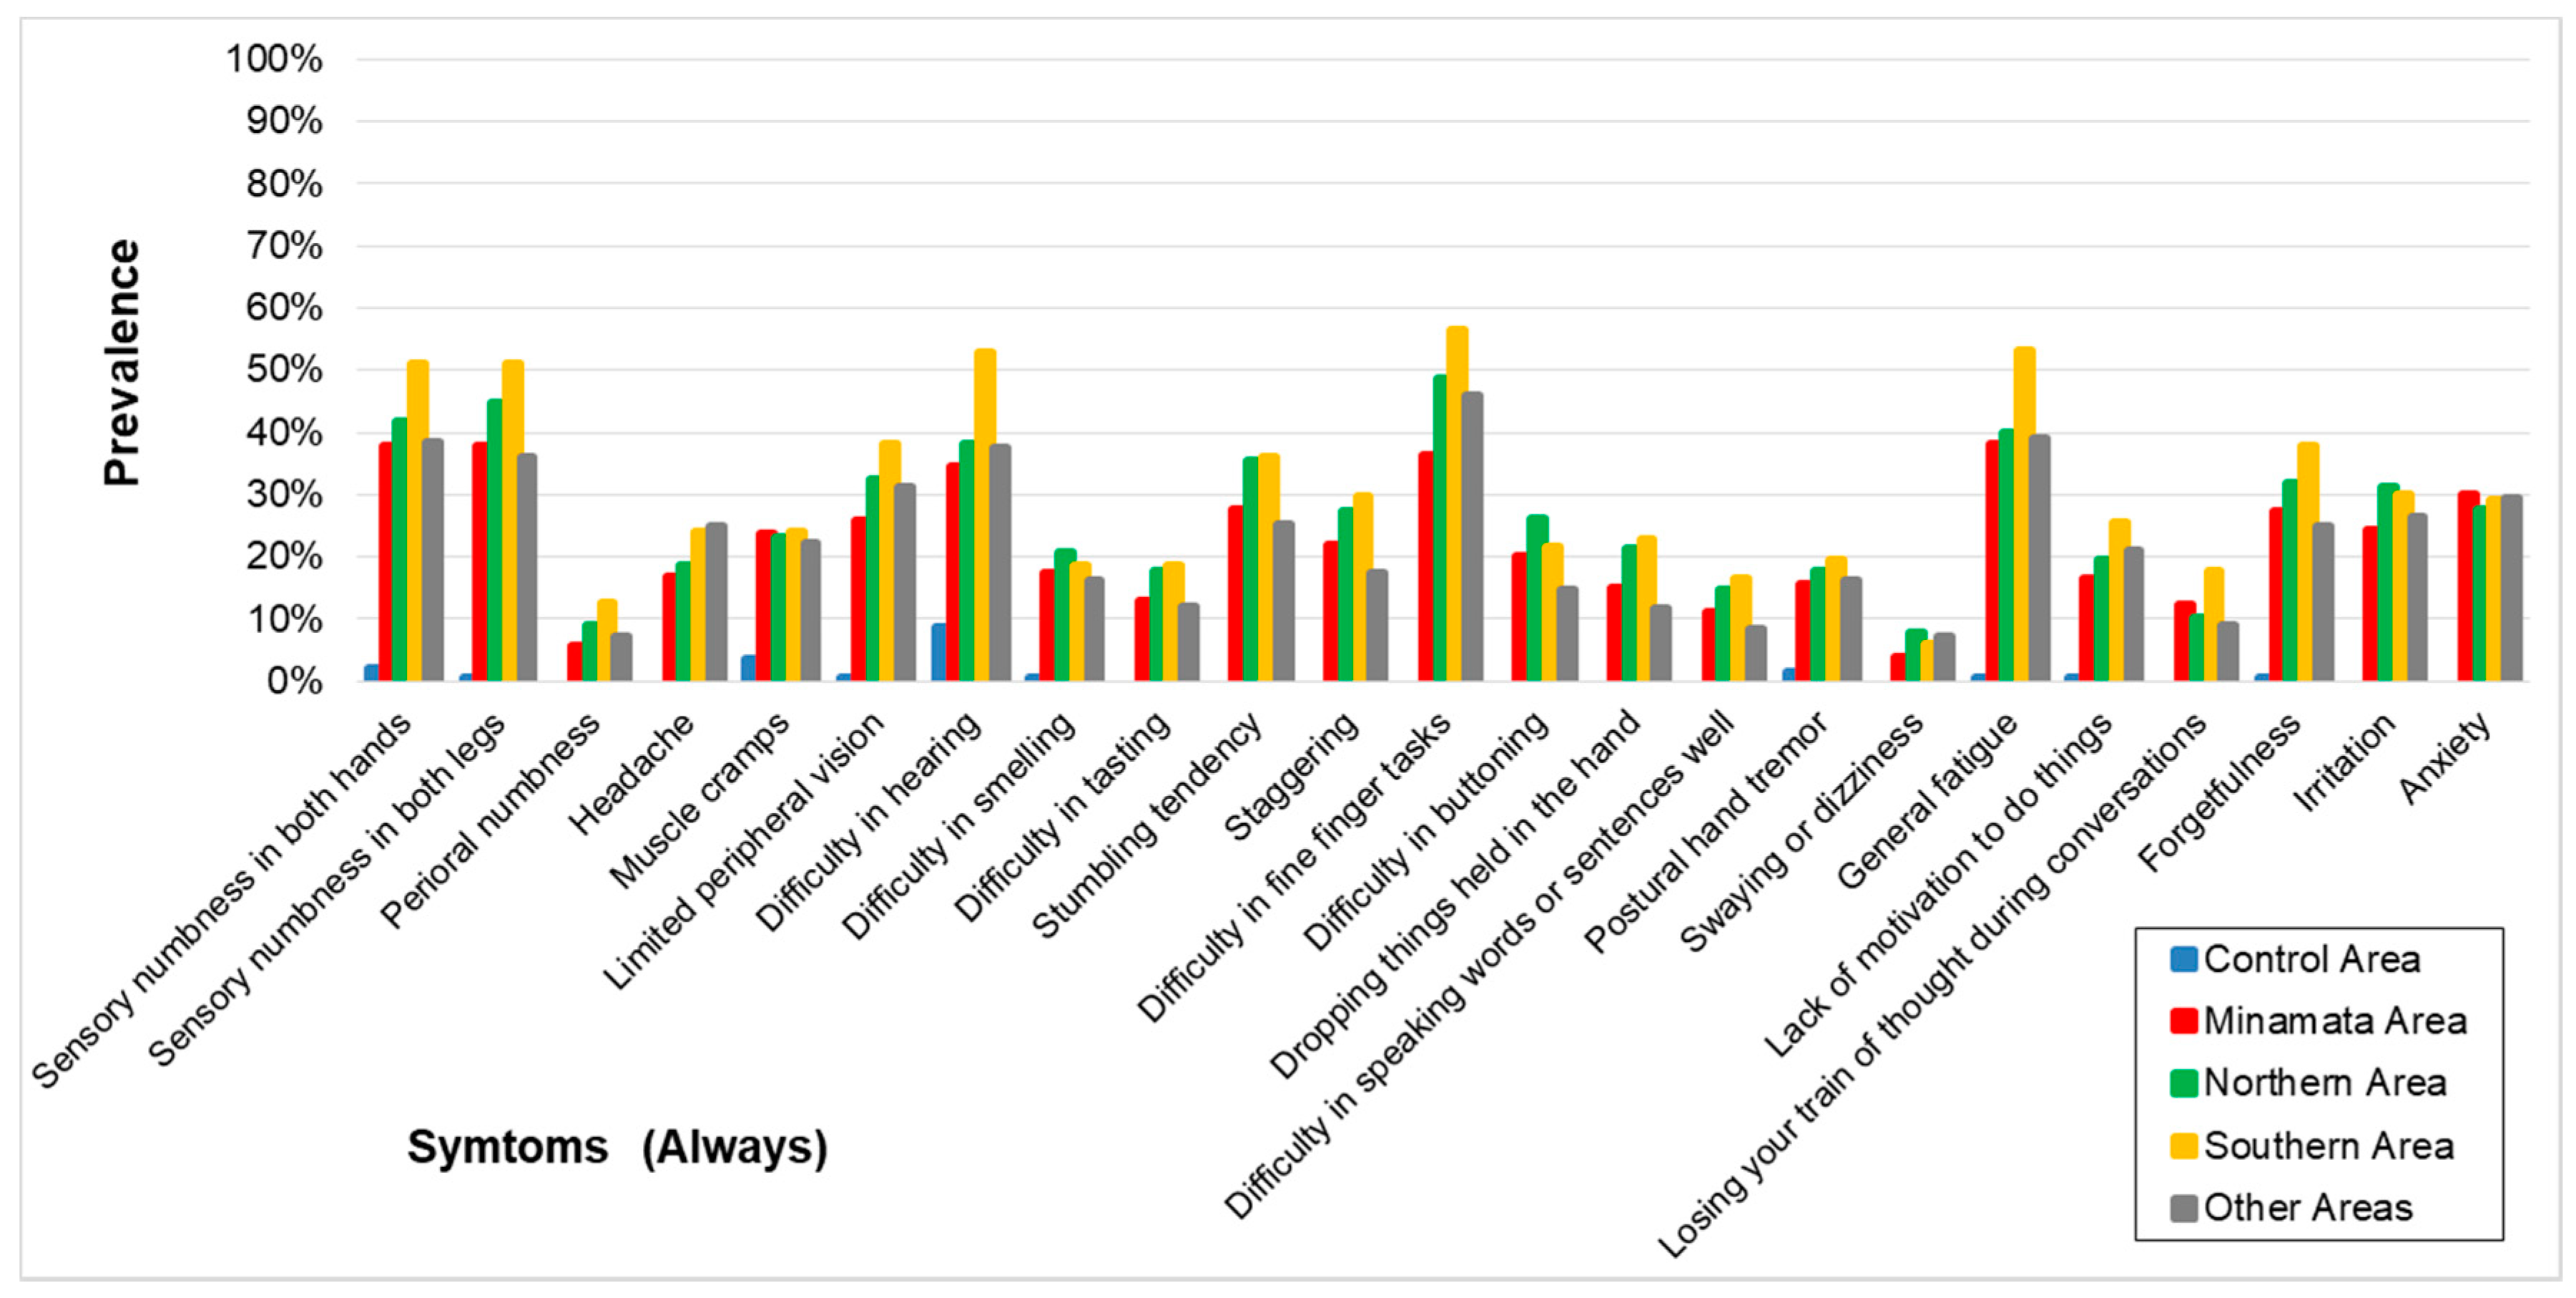
| Control Area | Minamata Area | Northern Area | Southern Area | Other Areas | |
|---|---|---|---|---|---|
| Sensory numbness in both hands | |||||
| case/N (%) | 3/138 (2.2) | 98/259 (37.8) | 116/278 (41.7) | 126/246 (51.2) | 73/189 (38.6) |
| OR (95% CI) | 1 (reference) | 27 (8.3–87) | 30 (9.4–98) | 46 (14–148) | 29 (9.0–96) |
| Sensory numbness in both legs | |||||
| case/N (%) | 1/139 (0.7) | 98/259 (37.8) | 125/279 (44.8) | 126/246 (51.2) | 68/189 (36.0) |
| OR (95% CI) | 1 (reference) | 80 (11–586) | 100 (14–731) | 140 (19–1022) | 86 (12–633) |
| Perioral numbness ** | |||||
| case/N (%) | 0/107 (0.0) | 15/259 (5.8) | 25/279 (9.0) | 31/246 (12.6) | 14/189 (7.4) |
| OR (95% CI) | 1 (reference) | 5.8 (0.7–45) | 8.8 (1.2–66) | 13.9 (1.9–104) | 9.6 (1.2–75) |
| Headache ** | |||||
| case/N (%) | 0/137 (0.0) | 44/259 (17.0) | 52/279 (18.6) | 59/246 (24) | 47/189 (24.9) |
| OR (95% CI) | 1 (reference) | 31 (4.2–228) | 35 (4.7–254) | 47 (6.4–344) | 49 (6.6–358) |
| Muscle cramps | |||||
| case/N (%) | 5/137 (3.6) | 62/259 (23.9) | 65/279 (23.3) | 59/245 (24.1) | 42/189 (22.2) |
| OR (95% CI) | 1 (reference) | 8.5 (3.3–22) | 8.1 (3.2–21) | 8.5 (3.3–22) | 8.3 (3.2–22) |
| Limited peripheral vision | |||||
| case/N (%) | 1/138 (0.7) | 67/259 (25.9) | 91/279 (32.6) | 94/246 (38.2) | 59/72 (81.9) |
| OR (95% CI) | 1 (reference) | 47 (6.5–347) | 63 (8.6–457) | 84 (12–614) | 71 (9.6–520) |
| Difficulty in hearing | |||||
| case/N (%) | 12/137 (8.8) | 90/259 (34.7) | 106/278 (38.1) | 130/246 (52.8) | 71/189 (37.6) |
| OR (95% CI) | 1 (reference) | 5.1 (2.7–9.9) | 5.5 (2.9–11) | 11 (5.9–22) | 7.2 (3.7–14) |
| Difficulty in smelling | |||||
| case/N (%) | 1/139 (0.7) | 45/259 (17.4) | 58/279 (20.8) | 46/245 (18.8) | 31/189 (16.4) |
| OR (95% CI) | 1 (reference) | 29 (3.9–213) | 36 (5.0–266) | 32 (4.4–238) | 31 (4.1–228) |
| Difficulty in tasting ** | |||||
| case/N (%) | 0/140 (0.0) | 34/259 (13.1) | 50/279 (17.9) | 46/245 (18.8) | 23/189 (12.2) |
| OR (95% CI) | 1 (reference) | 20 (2.7–146) | 28 (3.9–208) | 31 (4.2–226) | 20 (2.7–151) |
| Stumbling tendency ** | |||||
| case/N (%) | 0/106 (0.0) | 72/259 (27.8) | 99/279 (35.5) | 89/246 (36.2) | 48/189 (25.4) |
| OR (95% CI) | 1 (reference) | 41 (5.6–304) | 59 (8.0–429) | 63 (8.6–463) | 45 (6.1–336) |
| Staggering ** | |||||
| case/N (%) | 0/107 (0.0) | 57/259 (22.0) | 76/278 (27.3) | 73/246 (29.7) | 33/189 (17.5) |
| OR (95% CI) | 1 (reference) | 29 (3.9–212) | 38 (5.2–280) | 46 (6.2–337) | 29 (3.8–215) |
| Difficulty in fine finger tasks ** | |||||
| case/N (%) | 0/140 (0.0) | 94/259 (36.3) | 136/279 (48.7) | 139/246 (56.5) | 87/189 (46.0) |
| OR (95% CI) | 1 (reference) | 77 (11–562) | 128 (18–930) | 182 (25–1326) | 135 (18–987) |
| Difficulty in buttoning ** | |||||
| case/N (%) | 0/140 (0.0) | 52/259 (20.1) | 73/279 (26.2) | 53/245 (21.6) | 28/189 (14.8) |
| OR (95% CI) | 1 (reference) | 31 (4.2–228) | 43 (5.9–319) | 36 (4.9–267) | 30 (4.0–228) |
| Dropping things held in the hand ** | |||||
| case/N (%) | 0/140 (0.0) | 39/259 (15.1) | 60/279 (21.5) | 56/246 (22.8) | 22/189 (11.6) |
| OR (95% CI) | 1 (reference) | 24 (3.2–176) | 36 (4.9–266) | 41 (5.6–303) | 22 (3.0–170) |
| Difficulty in speaking words or sentences well ** | |||||
| case/N (%) | 0/140 (0.0) | 29/259 (11.2) | 41/279 (14.7) | 41/246 (16.7) | 16/189 (8.5) |
| OR (95% CI) | 1 (reference) | 17 (2.3–125) | 23 (3.1–167) | 28 (3.8–206) | 15 (2.0–118) |
| Postural hand tremor | |||||
| case/N (%) | 2/138 (1.4) | 41/259 (15.8) | 50/279 (17.9) | 48/246 (19.5) | 31/189 (16.4) |
| OR (95% CI) | 1 (reference) | 12 (2.9–51) | 14 (3.2–57) | 16 (3.8–67) | 16 (3.7–68) |
| Swaying or dizziness ** | |||||
| case/N (%) | 0/140 (0.0) | 10/259 (3.9) | 22/279 (7.9) | 15/246 (6.1) | 14/189 (7.4) |
| OR (95% CI) | 1 (reference) | 5.5 (0.7–44) | 12 (1.5–88) | 9.1 (1.2–70) | 13 (1.7–105) |
| General fatigue | |||||
| case/N (%) | 1/140 (0.7) | 99/259 (38.2) | 112/279 (40.1) | 131/246 (53.3) | 74/189 (39.2) |
| OR (95% CI) | 1 (reference) | 90 (12–657) | 98 (14–714) | 166 (23–1205) | 94 (13–686) |
| Lack of motivation to do things | |||||
| case/N (%) | 1/140 (0.7) | 43/259 (16.6) | 55/279 (19.7) | 63/246 (25.6) | 40/189 (21.2) |
| OR (95% CI) | 1 (reference) | 32 (4.4–237) | 40 (5.5–294) | 56 (7.6–409) | 46 (6.2–341) |
| Losing your train of thought during conversations ** | |||||
| case/N (%) | 0/139 (0.0) | 32/259 (12.4) | 29/279 (10.4) | 44/246 (17.9) | 17/189 (9.0) |
| OR (95% CI) | 1 (reference) | 20 (2.6–146) | 16 (2.1–118) | 31 (4.1–225) | 15 (2.0–118) |
| Forgetfulness | |||||
| case/N (%) | 1/140 (0.7) | 71/259 (27.4) | 89/279 (31.9) | 93/246 (37.8) | 47/189 (24.9) |
| OR (95% CI) | 1 (reference) | 54 (7.4–396) | 65 (8.9–473) | 89 (12–651) | 57 (7.7–419) |
| Irritation ** | |||||
| case/N (%) | 0/140 (0.0) | 63/259 (24.3) | 87/279 (31.2) | 74/246 (30.1) | 50/189 (26.5) |
| OR (95% CI) | 1 (reference) | 46 (6.3–337) | 65 (9.0–475) | 61 (8.4–446) | 51 (6.9–373) |
| Anxiety ** | |||||
| case/N (%) | 0/106 (0.0) | 78/259 (30.1) | 77/279 (27.6) | 72/246 (29.3) | 56/189 (29.6) |
| OR (95% CI) | 1 (reference) | 48 (6.6–354) | 43 (5.8–312) | 46 (6.2–335) | 48 (6.5–351) |
| Correlation/(p-value) | Control Area | Minamata Area | Northern Area | Southern Area |
|---|---|---|---|---|
| Minamata Area | 0.3641 | 1.0000 | ||
| (p-value) | (0.0876) | |||
| Northern Area | 0.2751 | 0.9611 | 1.0000 | |
| (p-value) | (0.2040) | (0.0000) | ||
| Southern Area | 0.3866 | 0.9540 | 0.9581 | 1.0000 |
| (p-value) | (0.0684) | (0.0000) | (0.0000) | |
| Other Areas | 0.3609 | 0.9417 | 0.9246 | 0.9460 |
| (p-value) | (0.0906) | (0.0000) | (0.0000) | (0.0000) |
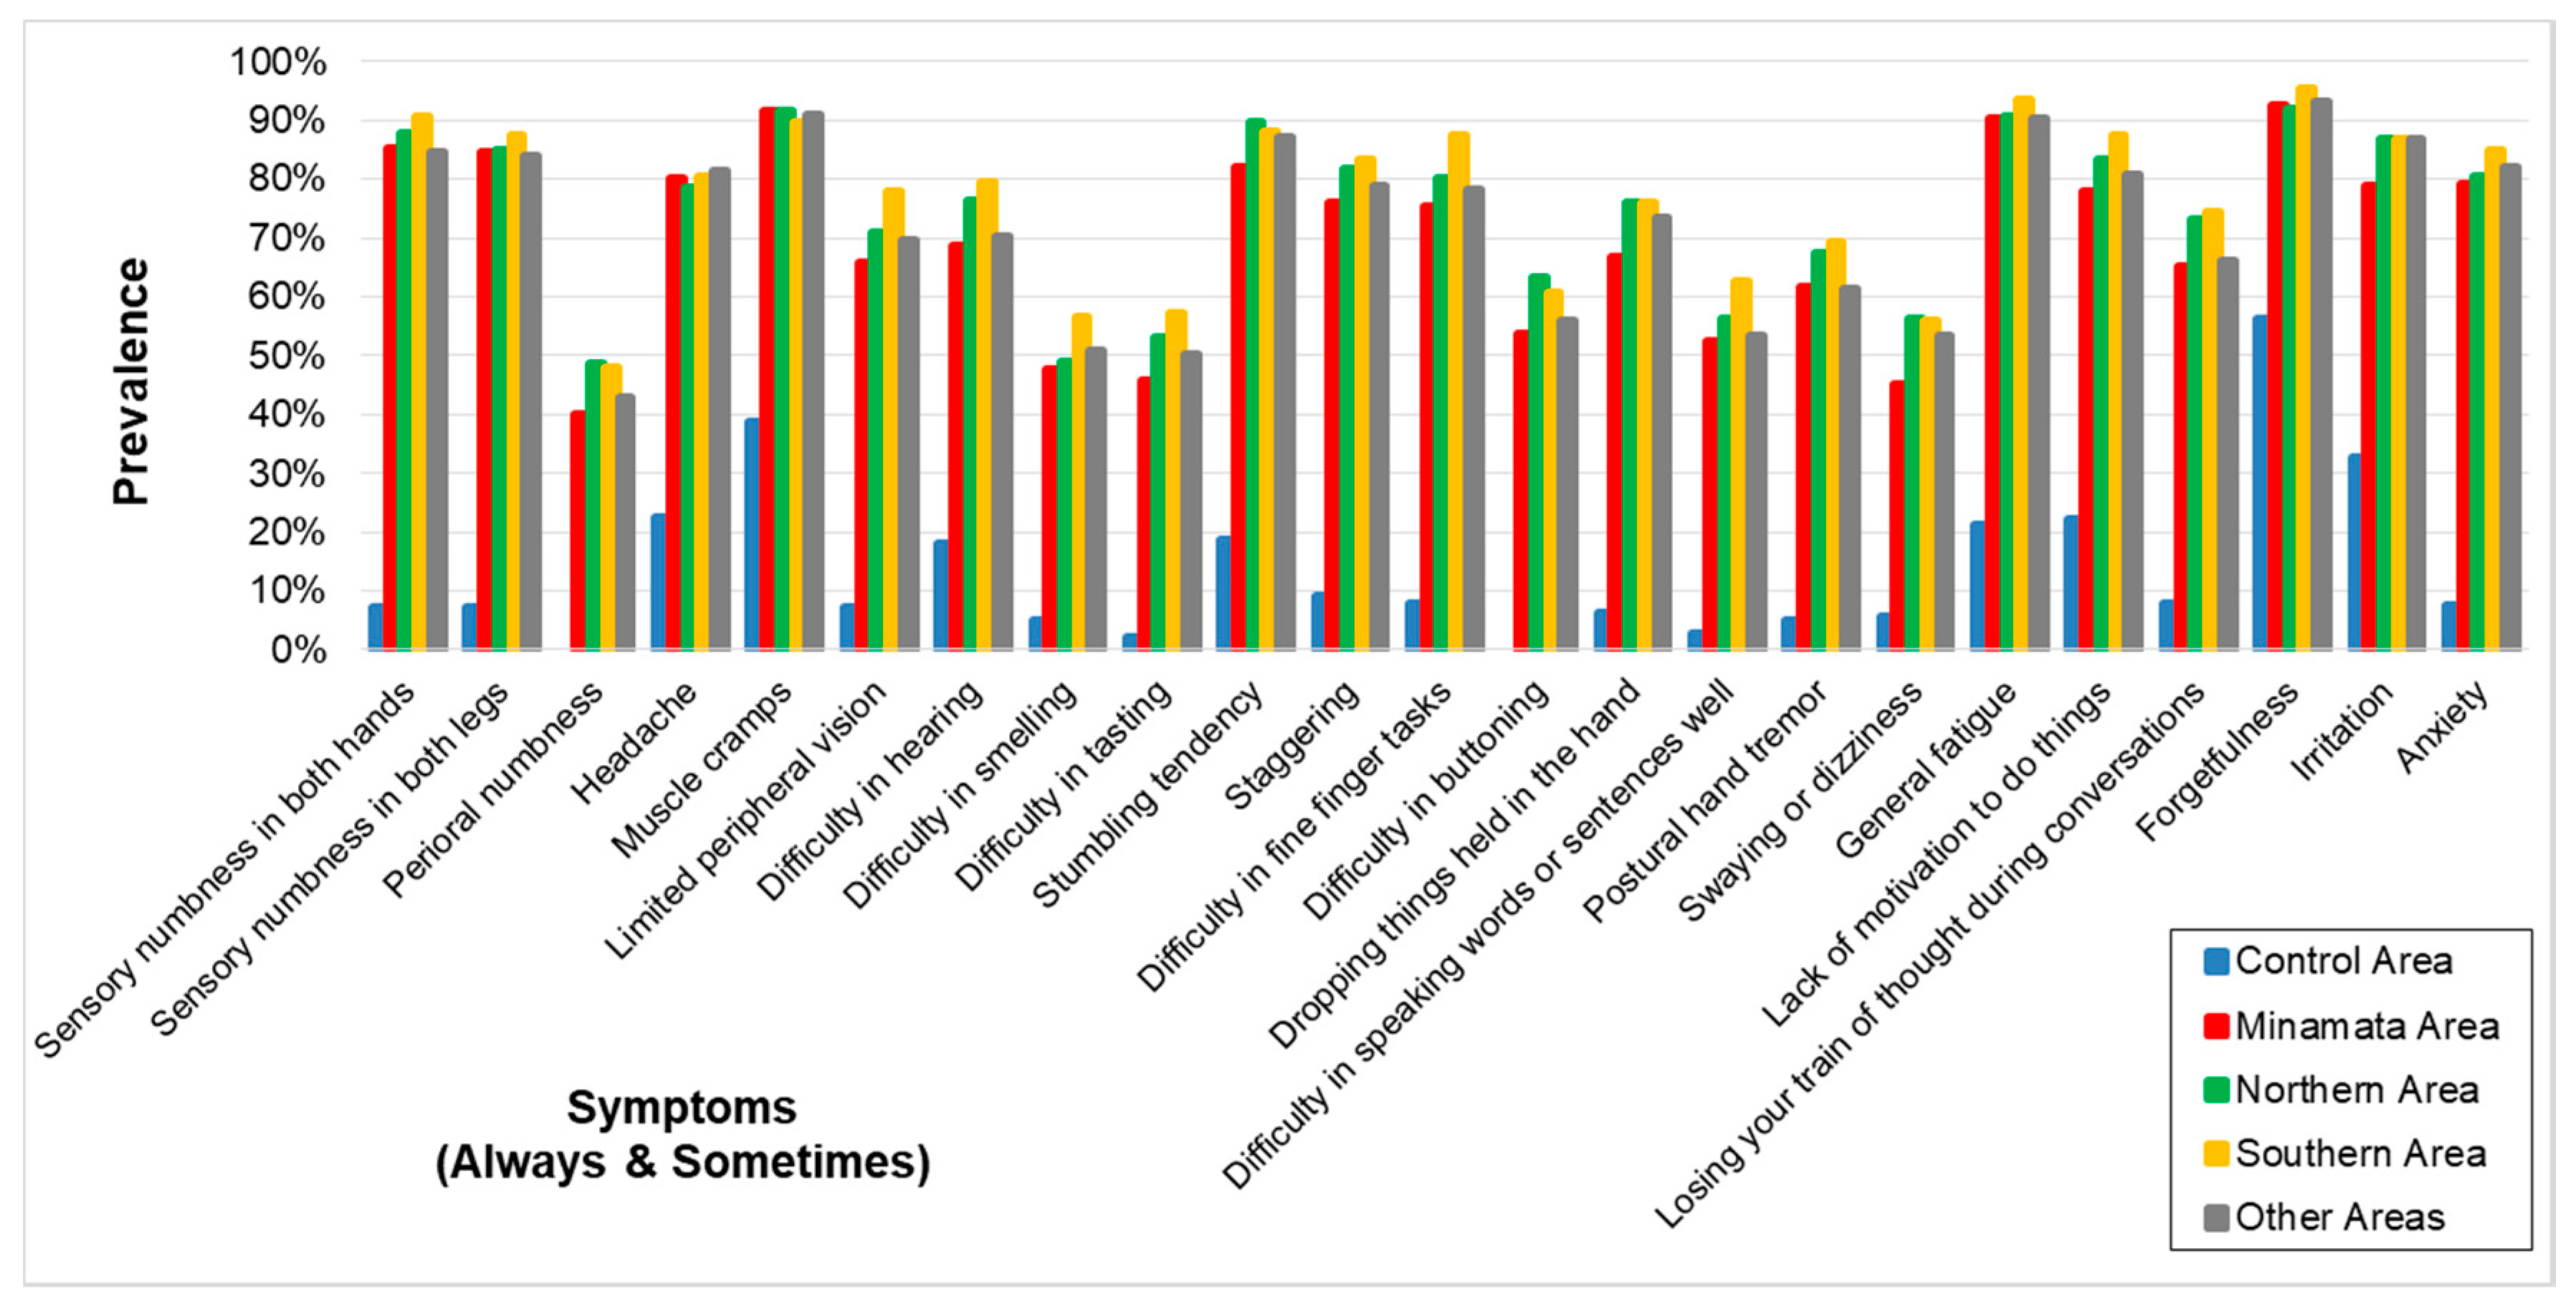
| Control Area | Minamata Area | Northern Area | Southern Area | Other Areas | |
|---|---|---|---|---|---|
| Sensory numbness in both hands | |||||
| case/N (%) | 10/138 (7.2) | 221/259 (85.3) | 244/278 (87.8) | 223/246 (90.7) | 160/189 (84.7) |
| OR (95% CI) | 1 (reference) | 79 (38–165) | 97 (46–206) | 130 (59–284) | 75 (35–161) |
| Sensory numbness in both legs | |||||
| case/N (%) | 10/139 (7.2) | 219/259 (84.6) | 237/279 (84.9) | 215/246 (87.4) | 159/189 (84.1) |
| OR (95% CI) | 1 (reference) | 77 (37–161) | 75 (36–156) | 94 (44–201) | 81 (37–175) |
| Perioral numbness ** | |||||
| case/N (%) | 0/107 (0.0) | 104/259 (40.2) | 136/279 (48.7) | 118/246 (48.0) | 81/189 (42.9) |
| OR (95% CI) | 1 (reference) | 73 (10–533) | 104 (14–760) | 101 (14–738) | 87 (12–636) |
| Headache | |||||
| case/N (%) | 31/137 (22.6) | 208/259 (80.3) | 219/279 (78.5) | 198/246 (80.5) | 154/189 (81.5) |
| OR (95% CI) | 1 (reference) | 17 (10–29) | 16 (9.8–28) | 18 (10–30) | 17 (9.7–30) |
| Muscle cramps | |||||
| case/N (%) | 53/137 (38.7) | 237/259 (91.5) | 256/279 (91.8) | 220/245 (89.8) | 172/189 (91.0) |
| OR (95% CI) | 1 (reference) | 18 (10–32) | 19 (11–33) | 15 (8.4–25) | 17 (9.2–32) |
| Limited peripheral vision | |||||
| case/N (%) | 10/138 (7.2) | 171/259 (66.0) | 198/279 (71.0) | 192/246 (78.0) | 132/189 (69.8) |
| OR (95% CI) | 1 (reference) | 25 (12–49) | 29 (15–59) | 44 (22–90) | 31 (15–63) |
| Difficulty in hearing | |||||
| case/N (%) | 25/137 (18.2) | 178/259 (68.7) | 212/278 (76.3) | 196/246 (79.7) | 133/189 (70.4) |
| OR (95% CI) | 1 (reference) | 9.8 (5.8–16) | 13 (8.0–23) | 17 (10–30) | 12 (6.8–21) |
| Difficulty in smelling | |||||
| case/N (%) | 7/139 (0.5) | 124/259 (47.9) | 137/279 (49.1) | 139/245 (56.7) | 96/189 (50.8) |
| OR (95% CI) | 1 (reference) | 17 (7.8–39) | 18 (8.1–40) | 25 (11–55) | 20 (8.8–45) |
| Difficulty in tasting | |||||
| case/N (%) | 3/140 (2.1) | 119/259 (45.9) | 148/279 (53.0) | 140/245 (57.1) | 95/189 (50.3) |
| OR (95% CI) | 1 (reference) | 39 (12–126) | 51 (16–166) | 61 (19–196) | 47 (14–152) |
| Stumbling tendency | |||||
| case/N (%) | 20/106 (18.9) | 213/259 (82.2) | 250/279 (89.6) | 217/246 (88.2) | 165/189 (87.3) |
| OR (95% CI) | 1 (reference) | 25 (13–46) | 42 (22–81) | 37 (19–72) | 39 (20–78) |
| Staggering | |||||
| case/N (%) | 10/107 (9.3) | 197/259 (76.1) | 227/278 (81.7) | 205/246 (83.3) | 149/189 (78.8) |
| OR (95% CI) | 1 (reference) | 35 (17–73) | 47 (22–98) | 53 (25–113) | 45 (21–97) |
| Difficulty in fine finger tasks | |||||
| case/N (%) | 11/140 (7.9) | 195/259 (75.3) | 224/279 (80.3) | 215/246 (87.4) | 148/189 (78.3) |
| OR (95% CI) | 1 (reference) | 36 (18–71) | 46 (23–92) | 81 (39–167) | 45 (22–93) |
| Difficulty in buttoning ** | |||||
| case/N (%) | 0/140 (0.0) | 139/259 (53.7) | 177/279 (63.4) | 149/245 (60.8) | 106/189 (56.1) |
| OR (95% CI) | 1 (reference) | 158 (22–1147) | 224 (31–1629) | 211 (29–1536) | 199 (27–1458) |
| Dropping things held in the hand | |||||
| case/N (%) | 9/140 (6.4) | 173/259 (66.8) | 212/279 (76.0) | 187/246 (76.0) | 139/189 (73.5) |
| OR (95% CI) | 1 (reference) | 33 (16–68) | 51 (24–106) | 50 (24–106) | 47 (22–100) |
| Difficulty in speaking words or sentences well | |||||
| case/N (%) | 4/140 (2.9) | 136/259 (52.5) | 157/279 (56.3) | 154/246 (62.6) | 101/189 (53.4) |
| OR (95% CI) | 1 (reference) | 39 (14–108) | 46 (16–128) | 60 (21–167) | 43 (15–122) |
| Postural hand tremor | |||||
| case/N (%) | 7/138 (5.1) | 160/259 (61.8) | 188/279 (67.4) | 171/246 (69.5) | 116/189 (61.4) |
| OR (95% CI) | 1 (reference) | 30 (13–66) | 37 (17–83) | 42 (19–94) | 31 (14–70) |
| Swaying or dizziness | |||||
| case/N (%) | 8/140 (5.7) | 117/259 (45.2) | 157/279 (56.3) | 138/246 (56.1) | 101/189 (53.4) |
| OR (95% CI) | 1 (reference) | 14 (6.6–30) | 22 (10–47) | 22 (10–47) | 20 (9.2–43) |
| General fatigue | |||||
| case/N (%) | 30/140 (21.4) | 234/259 (90.3) | 253/279 (90.7) | 230/246 (93.5) | 171/189 (90.5) |
| OR (95% CI) | 1 (reference) | 43 (23–79) | 46 (25–85) | 65 (33–128) | 37 (19–71) |
| Lack of motivation to do things | |||||
| case/N (%) | 31/140 (22.1) | 202/259 (78.0) | 233/279 (83.5) | 215/246 (87.4) | 153/189 (81.0) |
| OR (95% CI) | 1 (reference) | 15 (9.0–25) | 22 (13–38) | 30 (17–52) | 16 (9.2–28) |
| Losing your train of thought during conversations | |||||
| case/N (%) | 11/139 (7.9) | 169/259 (65.3) | 204/279 (73.1) | 183/246 (74.4) | 125/189 (66.1) |
| OR (95% CI) | 1 (reference) | 24 (12–46) | 34 (17–67) | 36 (18–72) | 26 (13–51) |
| Forgetfulness | |||||
| case/N (%) | 79/140 (56.4) | 240/259 (92.7) | 257/279 (92.1) | 235/246 (95.5) | 176/189 (93.1) |
| OR (95% CI) | 1 (reference) | 11 (6.2–20) | 10 (5.4–17) | 18 (8.8–37) | 13 (6.4–25) |
| Irritation | |||||
| case/N (%) | 46/140 (32.9) | 204/259 (78.8) | 242/279 (86.7) | 214/246 (87.0) | 164/189 (86.8) |
| OR (95% CI) | 1 (reference) | 8.0 (5.0–13) | 14 (8.6–24) | 14 (8.5–24) | 13 (7.6–23) |
| Anxiety | |||||
| case/N (%) | 8/106 (7.5) | 205/259 (79.2) | 225/279 (80.6) | 209/246 (85.0) | 155/189 (82.0) |
| OR (95% CI) | 1 (reference) | 49 (23–109) | 55 (25–122) | 74 (33–166) | 60 (27–136) |
| Correlation/(p-Value) | Control Area | Minamata Area | Northern Area | Southern Area |
|---|---|---|---|---|
| Minamata Area | 0.6921 | 1.0000 | ||
| (p-value) | (0.0003) | |||
| Northern Area | 0.6708 | 0.9778 | 1.0000 | |
| (p-value) | (0.0005) | (0.0000) | ||
| Southern Area | 0.6501 | 0.9787 | 0.9786 | 1.0000 |
| (p-value) | (0.0008) | (0.0000) | (0.0000) | |
| Other Areas | 0.7046 | 0.9875 | 0.9849 | 0.9795 |
| (p-value) | (0.0002) | (0.0000) | (0.0000) | (0.0000) |
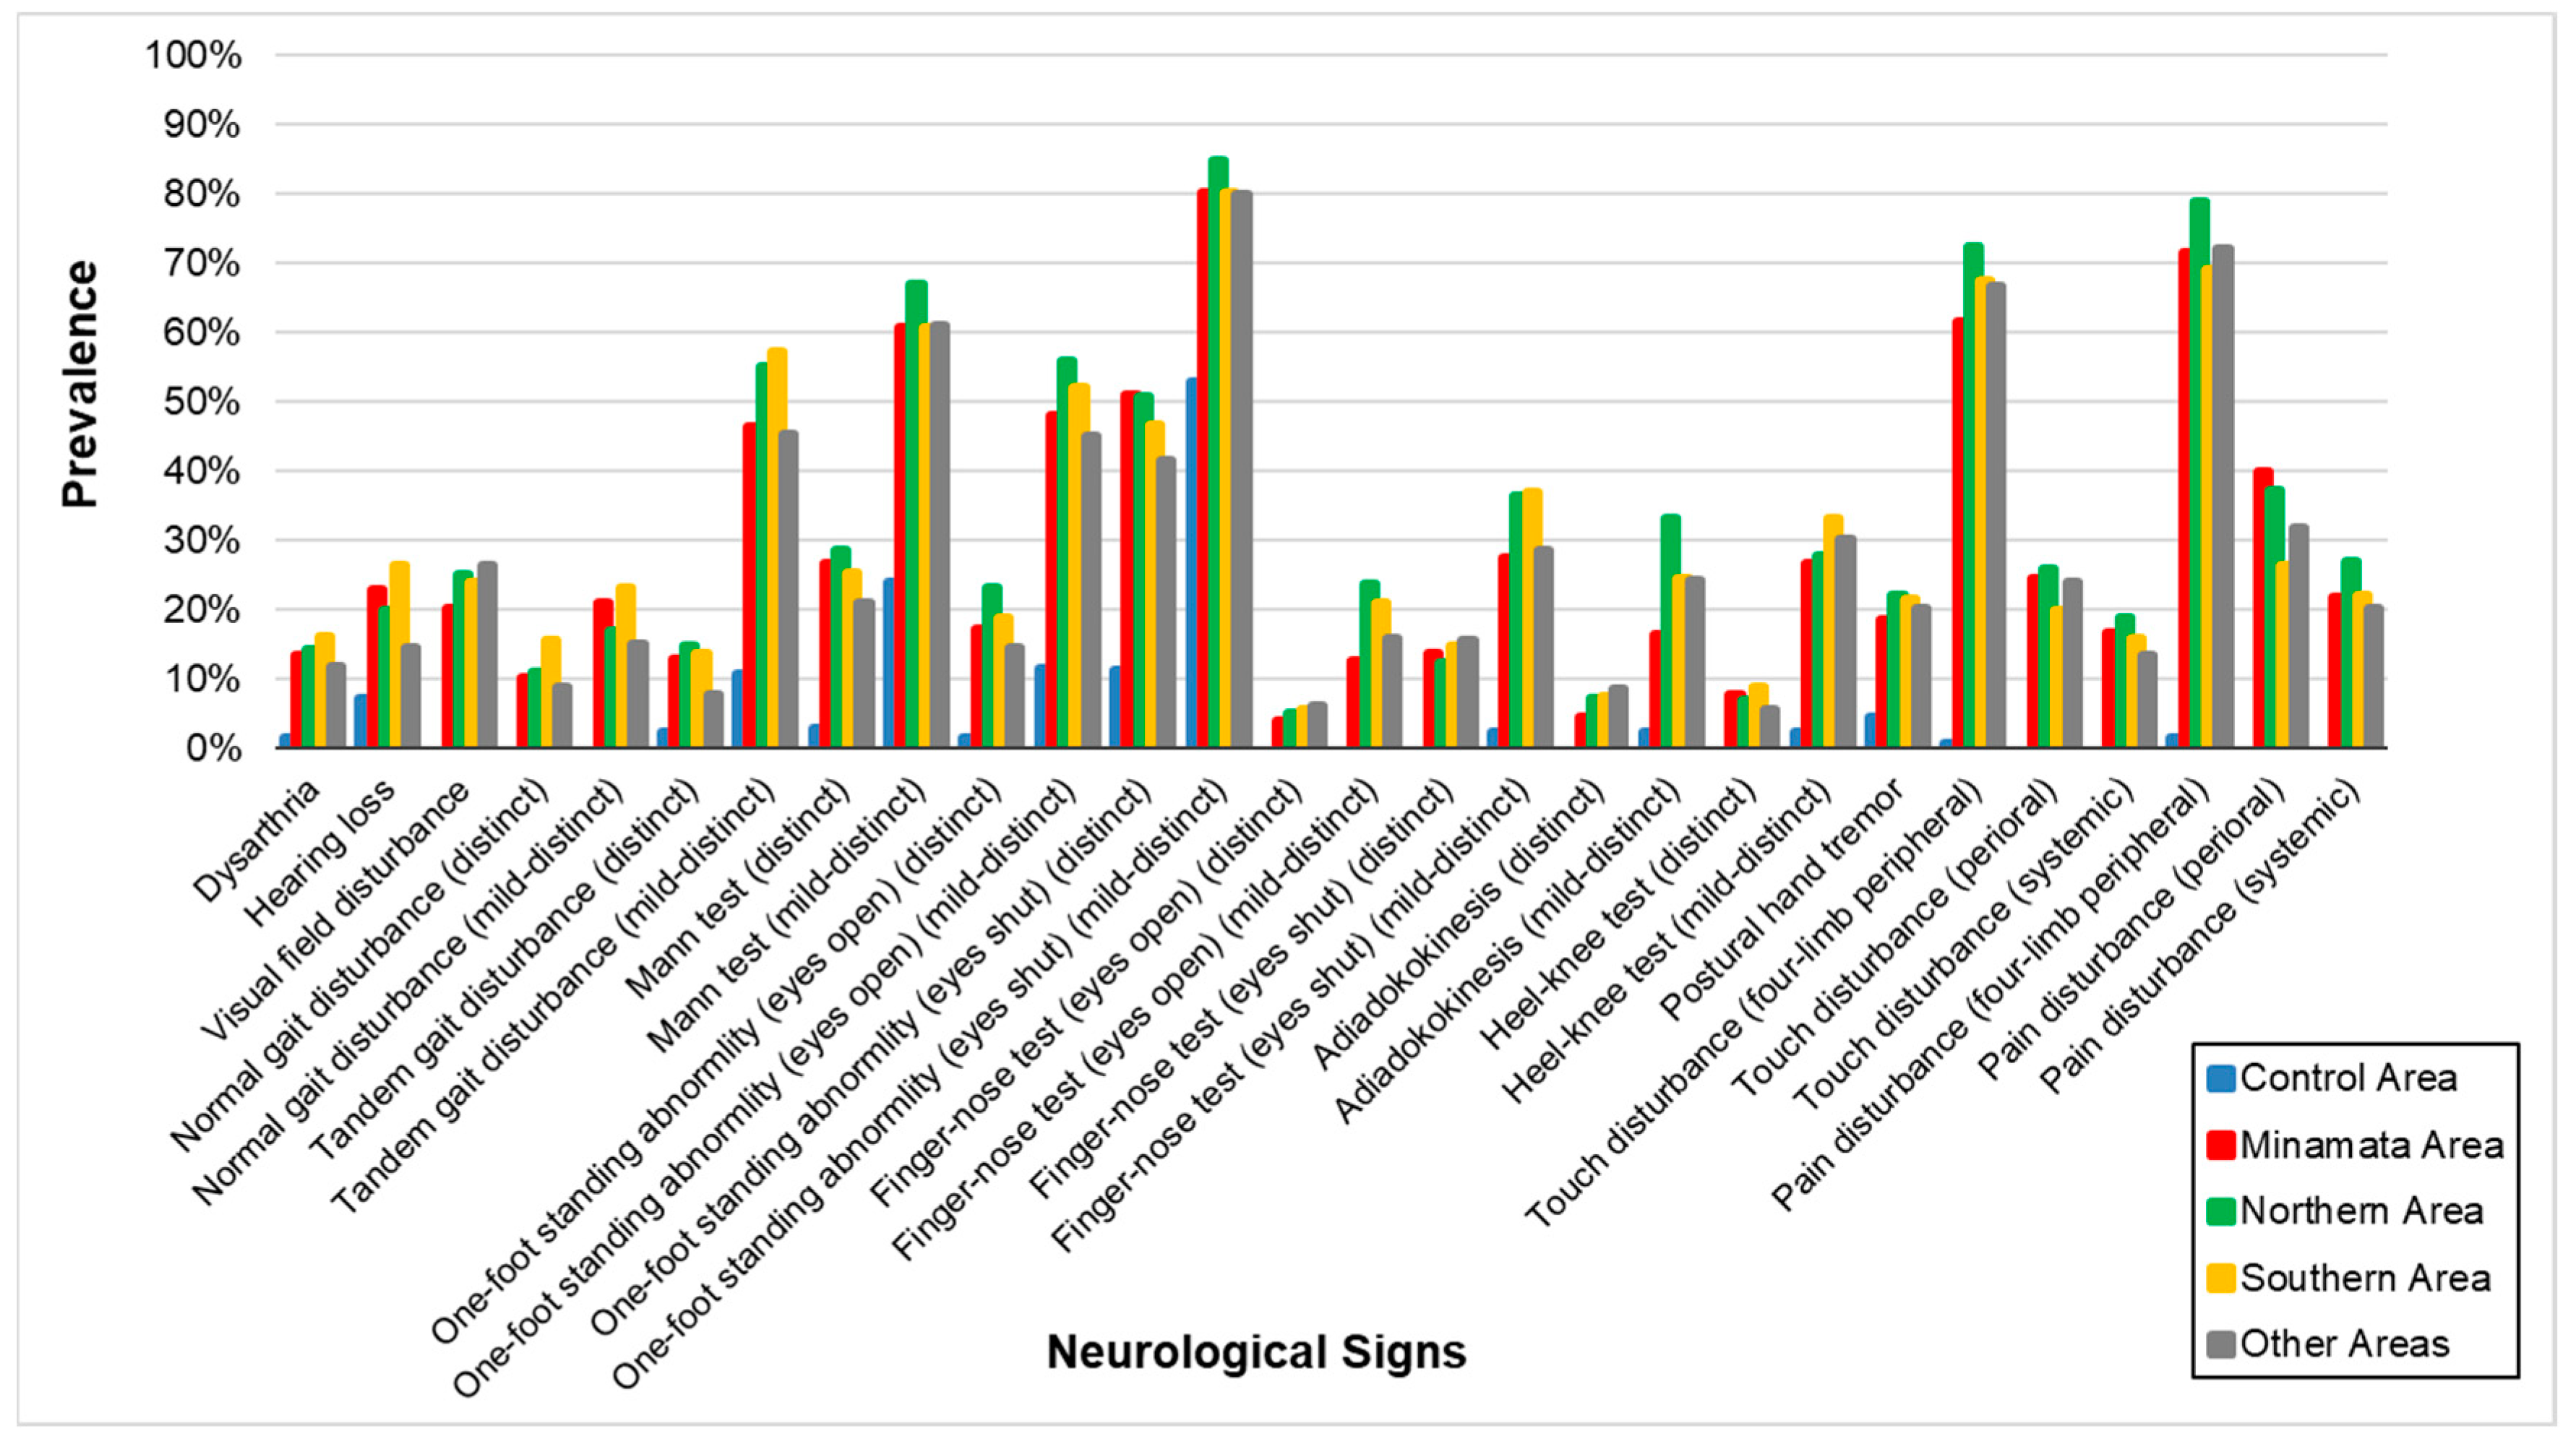
| Control Area | Minamata Area | Northern Area | Southern Area | Other Areas | |
|---|---|---|---|---|---|
| Dysarthria | |||||
| case/N (%) | 2/141 (1.4) | 34/256 (13.3) | 37/276 (13.4) | 41/242 (16.9) | 22/186 (11.8) |
| OR (95% CI) | 1 (reference) | 9.7 (2.3–41) | 9.3 (2.2–39) | 13 (3.1–55) | 9.5 (2.2–41) |
| Hearing loss | |||||
| case/N (%) | 10/141 (7.1) | 59/258 (22.9) | 54/279 (19.4) | 65/244 (26.6) | 27/186 (14.5) |
| OR (95% CI) | 1 (reference) | 3.5 (1.7–7.1) | 2.6 (1.3–5.4) | 4.4 (2.1–9.0) | 2.6 (1.2–5.7) |
| Visual field disturbance ** | |||||
| case/N (%) | 0/142 (0.0) | 51/255 (20.0) | 66/276 (23.9) | 61/243 (25.1) | 49/187 (26.2) |
| OR (95% CI) | 1 (reference) | 33 (4.4–240) | 39 (5.4–288) | 44 (6.0–322) | 53 (7.2–392) |
| Normal gait disturbance (distinct) ** | |||||
| case/N (%) | 0/137 (0.0) | 24/238 (10.1) | 25/255 (9.8) | 36/221 (16.3) | 15/174 (8.6) |
| OR (95% CI) | 1 (reference) | 12 (1.5–87) | 11 (1.5–83) | 22 (3.0–164) | 14 (1.8–107) |
| Normal gait disturbance (mild-distinct) ** | |||||
| case/N (%) | 0/137 (0.0) | 50/238 (21.0) | 41/255 (16.1) | 52/221 (23.5) | 26/174 (14.9) |
| OR (95% CI) | 1 (reference) | 30 (4.0–222) | 21 (2.8–156) | 39 (5.3–292) | 32 (4.2–242) |
| Tandem gait disturbance (distinct) | |||||
| case/N (%) | 3/141 (2.1) | 32/248 (12.9) | 41/271 (15.1) | 32/241 (13.3) | 14/186 (7.5) |
| OR (95% CI) | 1 (reference) | 6.0 (1.8–21) | 8.0 (2.4–27) | 7.2 (2.1–24) | 5.7 (1.6–21) |
| Tandem gait disturbance (mild-distinct) | |||||
| case/N (%) | 15/141 (10.6) | 115/248 (46.4) | 151/271 (55.7) | 135/241 (56.0) | 84/186 (45.2) |
| OR (95% CI) | 1 (reference) | 8.0 (4.3–15) | 11 (6.0–20) | 12 (6.7–23) | 10 (5.3–19) |
| Mann test (distinct) | |||||
| case/N (%) | 3/109 (2.8) | 67/252 (26.6) | 76/268 (28.4) | 62/242 (25.6) | 39/187 (20.9) |
| OR (95% CI) | 1 (reference) | 12 (3.7–40) | 13 (3.9–42) | 12 (3.5–39) | 11 (3.3–37) |
| Mann test (mild-distinct) | |||||
| case/N (%) | 26/109 (23.9) | 153/252 (60.7) | 176/268 (65.7) | 151/242 (62.4) | 114/187 (61.0) |
| OR (95% CI) | 1 (reference) | 5.4 (3.2–9.2) | 6.2 (3.6–11) | 5.6 (3.3–9.5) | 6.3 (3.6–11) |
| One-foot standing abnormality (eyes open) (distinct) | |||||
| case/N (%) | 2/141 (1.4) | 43/253 (17.0) | 61/269 (22.7) | 47/242 (19.4) | 27/189 (14.3) |
| OR (95% CI) | 1 (reference) | 14 (3.3–60) | 21 (5.0–89) | 18 (4.3–78) | 19 (4.4–85) |
| One-foot standing abnormality (eyes open) (mild-distinct) | |||||
| case/N (%) | 16/141 (11.3) | 121/253 (47.8) | 151/269 (56.1) | 125/242 (51.7) | 85/189 (45.0) |
| OR (95% CI) | 1 (reference) | 8.4 (4.6–15) | 11 (6.0–20) | 9.7 (5.3–18) | 9.7 (5.2–18) |
| One-foot standing abnormality (eyes shut) (distinct) | |||||
| case/N (%) | 16/142 (11.3) | 128/252 (50.8) | 135/269 (50.2) | 115/243 (47.3) | 78/188 (41.5) |
| OR (95% CI) | 1 (reference) | 9.7 (5.3–18) | 8.4 (4.6–15) | 8.0 (4.4–15) | 8.2 (4.4–15) |
| One-foot standing abnormality (eyes shut) (mild-distinct) | |||||
| case/N (%) | 75/142 (52.8) | 202/252 (80.2) | 228/269 (84.8) | 195/243 (80.2) | 150/188 (79.8) |
| OR (95% CI) | 1 (reference) | 4.5 (2.7–7.4) | 5.1 (3.1–8.5) | 3.9 (2.4–6.4) | 4.9 (2.9–8.3) |
| Finger-nose test (eyes open) (distinct) ** | |||||
| case/N (%) | 0/140 (0.0) | 10/254 (3.9) | 13/264 (4.9) | 13/233 (5.6) | 11/183 (6.0) |
| OR (95% CI) | 1 (reference) | 5.2 (0.6–41) | 6.5 (0.8–51) | 7.8 (0.99995–61) | 9.4 (1.2–75) |
| Finger-nose test (eyes open) (mild-distinct) ** | |||||
| case/N (%) | 0/140 (0.0) | 32/254 (12.6) | 61/264 (23.1) | 50/233 (21.5) | 29/183 (15.8) |
| OR (95% CI) | 1 (reference) | 19 (2.6–142) | 39 (5.4–288) | 37 (5.0–272) | 29 (3.8–214) |
| Finger-nose test (eyes shut) (distinct) ** | |||||
| case/N (%) | 0/139 (0.0) | 34/251 (13.5) | 31/262 (11.8) | 35/233 (15) | 28/182 (15.4) |
| OR (95% CI) | 1 (reference) | 21 (2.9–157) | 18 (2.5–137) | 25 (3.4–185) | 29 (3.8–215) |
| Finger-nose test (eyes shut) (mild-distinct) | |||||
| case/N (%) | 3/139 (2.2) | 69/251 (27.5) | 95/262 (36.3) | 86/233 (36.9) | 52/182 (28.6) |
| OR (95% CI) | 1 (reference) | 17 (5.1–54) | 24 (7.4–78) | 26 (7.9–84) | 20 (5.9–64) |
| Adiadokokinesis (distinct) ** | |||||
| case/N (%) | 0/135 (0.0) | 11/245 (4.5) | 17/270 (6.3) | 19/228 (8.3) | 15/178 (8.4) |
| OR (95% CI) | 1 (reference) | 5.3 (0.7–42) | 7.4 (0.96–56) | 10.3 (1.4–79) | 11.8 (1.5–91) |
| Adiadokokinesis (mild-distinct) | |||||
| case/N (%) | 3/135 (2.2) | 40/245 (16.3) | 85/270 (31.5) | 61/228 (26.8) | 43/178 (24.2) |
| OR (95% CI) | 1 (reference) | 7.9 (2.4–26) | 18 (5.6–59) | 15 (4.6–49) | 16 (4.7–52) |
| Heel-knee test (distinct) ** | |||||
| case/N (%) | 0/135 (0.0) | 17/226 (7.5) | 15/239 (6.3) | 19/207 (9.2) | 9/163 (5.5) |
| OR (95% CI) | 1 (reference) | 9.8 (1.3–75) | 7.8 (1.0–60) | 12 (1.6–93) | 8.4 (1.0–68) |
| Heel-knee test (mild-distinct) | |||||
| case/N (%) | 3/135 (2.2) | 60/226 (26.5) | 66/239 (27.6) | 68/207 (32.9) | 49/163 (30.1) |
| OR (95% CI) | 1 (reference) | 16 (4.8–51) | 16 (4.9–52) | 21 (6.5–70) | 22 (6.6–73) |
| Postural Hand tremor | |||||
| case/N (%) | 6/136 (4.4) | 48/259 (18.5) | 58/279 (20.8) | 56/246 (22.8) | 38/189 (20.1) |
| OR (95% CI) | 1 (reference) | 4.7 (2.0–11) | 5.3 (2.2–13) | 6.1 (2.5–15) | 5.6 (2.3–14) |
| Touch disturbance (four-limb peripheral) | |||||
| case/N (%) | 1/142 (0.7) | 159/259 (61.4) | 204/279 (73.1) | 164/246 (66.7) | 126/189 (66.7) |
| OR (95% CI) | 1 (reference) | 218 (30–1581) | 368 (50–2678) | 271 (37–1977) | 265 (36–1944) |
| Touch disturbance (perioral) ** | |||||
| case/N (%) | 0/142 (0.0) | 63/259 (24.3) | 71/279 (25.4) | 50/246 (20.3) | 45/189 (23.8) |
| OR (95% CI) | 1 (reference) | 45 (6.2–331) | 48 (6.6–353) | 36 (4.9–264) | 45 (6.1–330) |
| Touch disturbance (systemic) ** | |||||
| case/N (%) | 0/142 (0.0) | 43/259 (16.6) | 49/279 (17.6) | 43/246 (17.5) | 25/189 (13.2) |
| OR (95% CI) | 1 (reference) | 28 (3.9–209) | 30 (4.1–223) | 31 (4.2–225) | 24 (3.2–179) |
| Pain disturbance (four-limb peripheral) | |||||
| case/N (%) | 2/142 (1.4) | 185/259 (71.4) | 224/279 (80.3) | 167/246 (67.9) | 136/189 (72.0) |
| OR (95% CI) | 1 (reference) | 183 (44–760) | 296 (71–1238) | 153 (37–636) | 183 (44–767) |
| Pain disturbance (perioral) ** | |||||
| case/N (%) | 0/142 (0.0) | 103/259 (39.8) | 104/279 (37.3) | 65/246 (26.4) | 60/189 (31.7) |
| OR (95% CI) | 1 (reference) | 93 (13–673) | 83 (11–603) | 50 (6.9–367) | 67 (9.1–491) |
| Pain disturbance (systemic) ** | |||||
| case/N (%) | 0/142 (0.0) | 56/259 (21.6) | 73/279 (26.2) | 56/246 (22.8) | 38/189 (20.1) |
| OR (95% CI) | 1 (reference) | 38 (5.2–281) | 49 (6.7–355) | 41 (5.6–300) | 37 (5.0–273) |
| Correlation/(p-Value) | Control Area | Minamata Area | Northern Area | Southern Area |
|---|---|---|---|---|
| Minamata Area | 0.6709 | 1.0000 | ||
| (p-value) | (0.0001) | |||
| Northern Area | 0.6327 | 0.9792 | 1.0000 | |
| (p-value) | (0.0003) | (0.0000) | ||
| Southern Area | 0.6802 | 0.9716 | 0.9823 | 1.0000 |
| (p-value) | (0.0001) | (0.0000) | (0.0000) | |
| Other Areas | 0.6518 | 0.9778 | 0.9864 | 0.9771 |
| (p-value) | (0.0002) | (0.0000) | (0.0000) | (0.0000) |
| Control Area | Minamata Area | Northern Area | Southern Area | Other Areas | |
|---|---|---|---|---|---|
| (n = 142) | (n = 259) | (n = 279) | (n = 246) | (n = 189) | |
| Symptom score (always) | |||||
| Mean ± SD | 0.2 ± 0.5 | 5.1 ± 4.9 | 6.1 ± 5.0 | 6.9 ± 5.4 | 5.3 ± 4.9 |
| Range (min–max) | 0–3 | 0–22 | 0–23 | 0–22 | 0–23 |
| Symptom score (always and sometimes) | |||||
| Mean ± SD | 3.2 ± 3.0 | 21.2 ± 9.2 | 23.3 ± 9.0 | 24.7 ± 9.2 | 21.9 ± 9.4 |
| Range (min–max) | 0–15 | 2–45 | 1–46 | 3–45 | 2–46 |
| Cranial nerve score | |||||
| Mean ± SD | 0.2 ± 0.6 | 1.1 ± 1.7 | 1.1 ± 1.5 | 1.4 ± 1.8 | 1 ± 1.5 |
| Range (min–max) | 0–2 | 0–6 | 0–6 | 0–6 | 0–6 |
| Upper, lower ataxia and tremor score | |||||
| Mean ± SD | 0.1 ± 0.4 | 1.0 ± 1.2 | 1.3 ± 1.5 | 1.3 ± 1.5 | 1.1 ± 1.4 |
| Range (min–max) | 0–3 | 0–5 | 0–5 | 0–5 | 0–5 |
| Truncal ataxia score | |||||
| Mean ± SD | 0.9 ± 1.0 | 2.5 ± 1.7 | 2.7 ± 1.6 | 2.7 ± 1.6 | 2.4 ± 1.6 |
| Range (min–max) | 0–3 | 0–5 | 0–5 | 0–5 | 0–5 |
| Sensory score | |||||
| Mean ± SD | 0.0 ± 0.2 | 2.4 ± 1.5 | 2.6 ± 1.5 | 2.2 ± 1.3 | 2.3 ± 1.2 |
| Range (min–max) | 0–2 | 0–6 | 0–6 | 0–6 | 0–5 |
| Total neurological score | |||||
| Mean ± SD | 1.2 ± 1.4 | 6.9 ± 4.5 | 7.7 ± 4.2 | 7.6 ± 4.3 | 6.8 ± 4.0 |
| Range (min–max) | 0–8 | 0–20 | 0–21 | 0–21 | 0–19 |
| Control Area | DA | NDA | BA1968 | |
|---|---|---|---|---|
| Age (Mean ± SD) | 62.0 ± 10.5 | 63.0 ± 11.3 | 63.6 ± 10.0 | 37.4 ± 2.3 |
| (n) | (142) | (786) | (158) | (30) |
| Symptom score (always) | ||||
| Mean ± SD | 0.2 ± 0.5 | 5.9 ± 5.2 | 6.1 ± 4.9 | 4.0 ± 5.0 |
| Range (min–max) | 0–3 | 0–23 | 0–23 | 0–19 |
| Symptom score (always and sometimes) | ||||
| Mean ± SD | 3.2 ± 3.0 | 22.9 ± 9.2 | 23.1 ± 9.2 | 19.7 ± 9.9 |
| Range (min–max) | 0–15 | 2–46 | 1–46 | 2–42 |
| Cranial nerve score | ||||
| Mean ± SD | 0.2 ± 0.6 | 1.2 ± 1.7 | 1.1 ± 1.6 | 0.4 ± 0.8 |
| Range (min–max) | 0–2 | 0–6 | 0–6 | 0–2 |
| Upper, lower ataxia and tremor score | ||||
| Mean ± SD | 0.1 ± 0.4 | 1.2 ± 1.4 | 1.3 ± 1.5 | 1.0 ± 1.2 |
| Range (min–max) | 0–3 | 0–5 | 0–5 | 0–4 |
| Truncal ataxia score | ||||
| Mean ± SD | 0.9 ± 1.0 | 2.6 ± 1.6 | 2.7 ± 1.7 | 1.7 ± 1.3 |
| Range (min–max) | 0–3 | 0–5 | 0–5 | 0–4 |
| Sensory score | ||||
| Mean ± SD | 0.0 ± 0.2 | 2.4 ± 1.4 | 2.4 ± 1.4 | 2.0 ± 1.7 |
| Range (min–max) | 0–2 | 0–6 | 0–6 | 0–6 |
| Total neurological score | ||||
| Mean ± SD | 1.2 ± 1.4 | 7.3 ± 4.3 | 7.5 ± 4.2 | 5.1 ± 3.8 |
| Range (min–max) | 0–8 | 0–21 | 0–20 | 0–13 |
| Frequency | n | Age | Symptom (Always) Score | Symptom (Always & Sometimes) Score | Total Neurological Score | |
|---|---|---|---|---|---|---|
| 3/day | 459 | Mean ± SD | 62.9 ± 11.6 | 6.7 ± 5.5 | 24.4 ± 9.3 | 7.9 ± 4.3 |
| Min–Max | 33–90 | 0–23 | 3–46 | 0–21 | ||
| 2/day | 271 | Mean ± SD | 62.2 ± 11.5 | 5.9 ± 4.7 | 23.0 ± 8.8 | 7.1 ± 4.3 |
| Min–Max | 36–92 | 0–21 | 1–44 | 0–21 | ||
| 1/day | 146 | Mean ± SD | 61.9 ± 12.7 | 4.8 ± 4.7 | 20.8 ± 8.7 | 7.0 ± 4.3 |
| Min–Max | 34–89 | 0–21 | 2–44 | 0–20 | ||
| ≥1/week | 79 | Mean ± SD | 61.0 ± 11.3 | 3.4 ± 3.7 | 17.0 ± 8.4 | 5.7 ± 3.7 |
| Min–Max | 35–86 | 0–15 | 2–36 | 0–16 | ||
| <1/week | 18 | Mean ± SD | 58.9 ± 12.3 | 5.1 ± 4.6 | 20.7 ± 10 | 4.4 ± 3.3 |
| Min–Max | 39–81 | 0–16 | 4–38 | 1–11 | ||
| <1/day | 97 | Mean ± SD | 60.6 ± 11.4 | 3.7 ± 3.9 | 17.7 ± 8.8 | 5.5 ± 3.6 |
| (≥1/week & <1/week) | Min–Max | 35–86 | 0–16 | 2–38 | 0–16 | |
| Total | 973 | Mean ± SD | 62.3 ± 11.7 | 5.9 ± 5.1 | 22.8 ± 9.3 | 7.3 ± 4.3 |
| Min–Max | 33–92 | 0–23 | 1–46 | 0–21 |
| Minamata Area | Northern Area | Southern Area | Other Areas | Total of Polluted Areas | |
|---|---|---|---|---|---|
| First symptom | 1979.0 ± 14.8 | 1974.9 ± 16.1 | 1973.6 ± 14.2 | 1974.6 ± 13.7 | 1975.6 ± 15 |
| case/N (%) | 256/259 (98.8) | 275/279 (98.6) | 245/246 (99.6) | 189/189 (100) | 965/973 (99.2) |
| >1968/case (%) | 185/256 (72.3) | 175/275 (63.6) | 143/245 (58.4) | 124/189 (65.6) | 627/965 (65.0) |
| Muscle cramps | 1982.2 ± 15.1 | 1979.5 ± 15.6 | 1978.1 ± 15.1 | 1978.4 ± 14.1 | 1979.6 ± 15.1 |
| case/N (%) | 235/259 (90.7) | 255/279 (91.4) | 227/246 (92.3) | 182/189 (96.3) | 899/973 (92.4) |
| >1968/case (%) | 185/235 (78.7) | 192/255 (75.3) | 157/227 (69.2) | 139/182 (76.4) | 673/899 (74.9) |
| First symptom-Muscle cramps | 4.4 ± 8.8 | 5.5 ± 10.4 | 4.9 ± 8.6 | 4.2 ± 7.2 | 4.8 ± 8.9 |
| Four limb numbness | 1987.8 ± 14.2 | 1982.2 ± 15.9 | 1982.3 ± 14.5 | 1983.9 ± 13.9 | 1984 ± 14.9 |
| case/N (%) | 237/259 (91.5) | 254/279 (91.0) | 235/246 (95.5) | 172/189 (91.0) | 898/973 (92.3) |
| >1968/case (%) | 205/237 (86.5) | 205/254 (80.7) | 189/235 (80.4) | 151/172 (87.8) | 750/898 (83.5) |
| First symptom-Four limb numbness | 9.1 ± 12.5 | 8.1 ± 12.0 | 8.5 ± 11.2 | 9.4 ± 11.4 | 8.7 ± 11.8 |
| Stumbling tendency | 1990.7 ± 13.1 | 1989.2 ± 13.7 | 1987.9 ± 14.3 | 1986.8 ± 13.4 | 1988.8 ± 13.7 |
| case/N (%) | 188/259 (72.6) | 216/279 (77.4) | 196/246 (79.7) | 144/189 (76.2) | 744/973 (76.5) |
| >1968/case (%) | 176/188 (93.6) | 196/216 (90.7) | 175/196 (89.3) | 133/144 (92.4) | 680/744 (91.4) |
| First symptom-Stumbling tendency | 12.7 ± 13.2 | 15.4 ± 13.2 | 14.9 ± 14.0 | 14.1 ± 13.7 | 14.3 ± 13.5 |
| Difficulty in fine finger tasks | 1989.5 ± 13.6 | 1986.9 ± 14.4 | 1985.8 ± 13.5 | 1983.1 ± 13.8 | 1986.5 ± 14.0 |
| case/N (%) | 144/259 (55.6) | 182/279 (65.2) | 178/246 (72.4) | 114/189 (60.3) | 618/973 (63.5) |
| >1968/case (%) | 135/144 (93.8) | 161/182 (88.5) | 157/178 (88.2) | 95/114 (83.3) | 548/618 (88.7) |
| First symptom-Difficulty in fine finger tasks | 12.3 ± 12.7 | 14.4 ± 13.1 | 13.4 ± 12.9 | 12.1 ± 12.0 | 13.2 ± 12.7 |
| Limited peripheral vision | 1992.2 ± 13.8 | 1988.8 ± 14.6 | 1991.9 ± 10.9 | 1988.9 ± 12.7 | 1990.5 ± 13.2 |
| case/N (%) | 134/259 (51.7) | 179/279 (64.2) | 168/246 (68.3) | 110/189 (58.2) | 591/973 (60.7) |
| >1968/case (%) | 126/134 (94.0) | 160/179 (89.4) | 165/168 (98.2) | 103/110 (93.6) | 554/591 (93.7) |
| First symptom-Limited peripheral vision | 16.5 ± 13.6 | 16.9 ± 12.9 | 18.7 ± 13.1 | 16.8 ± 13.7 | 17.3 ± 13.3 |
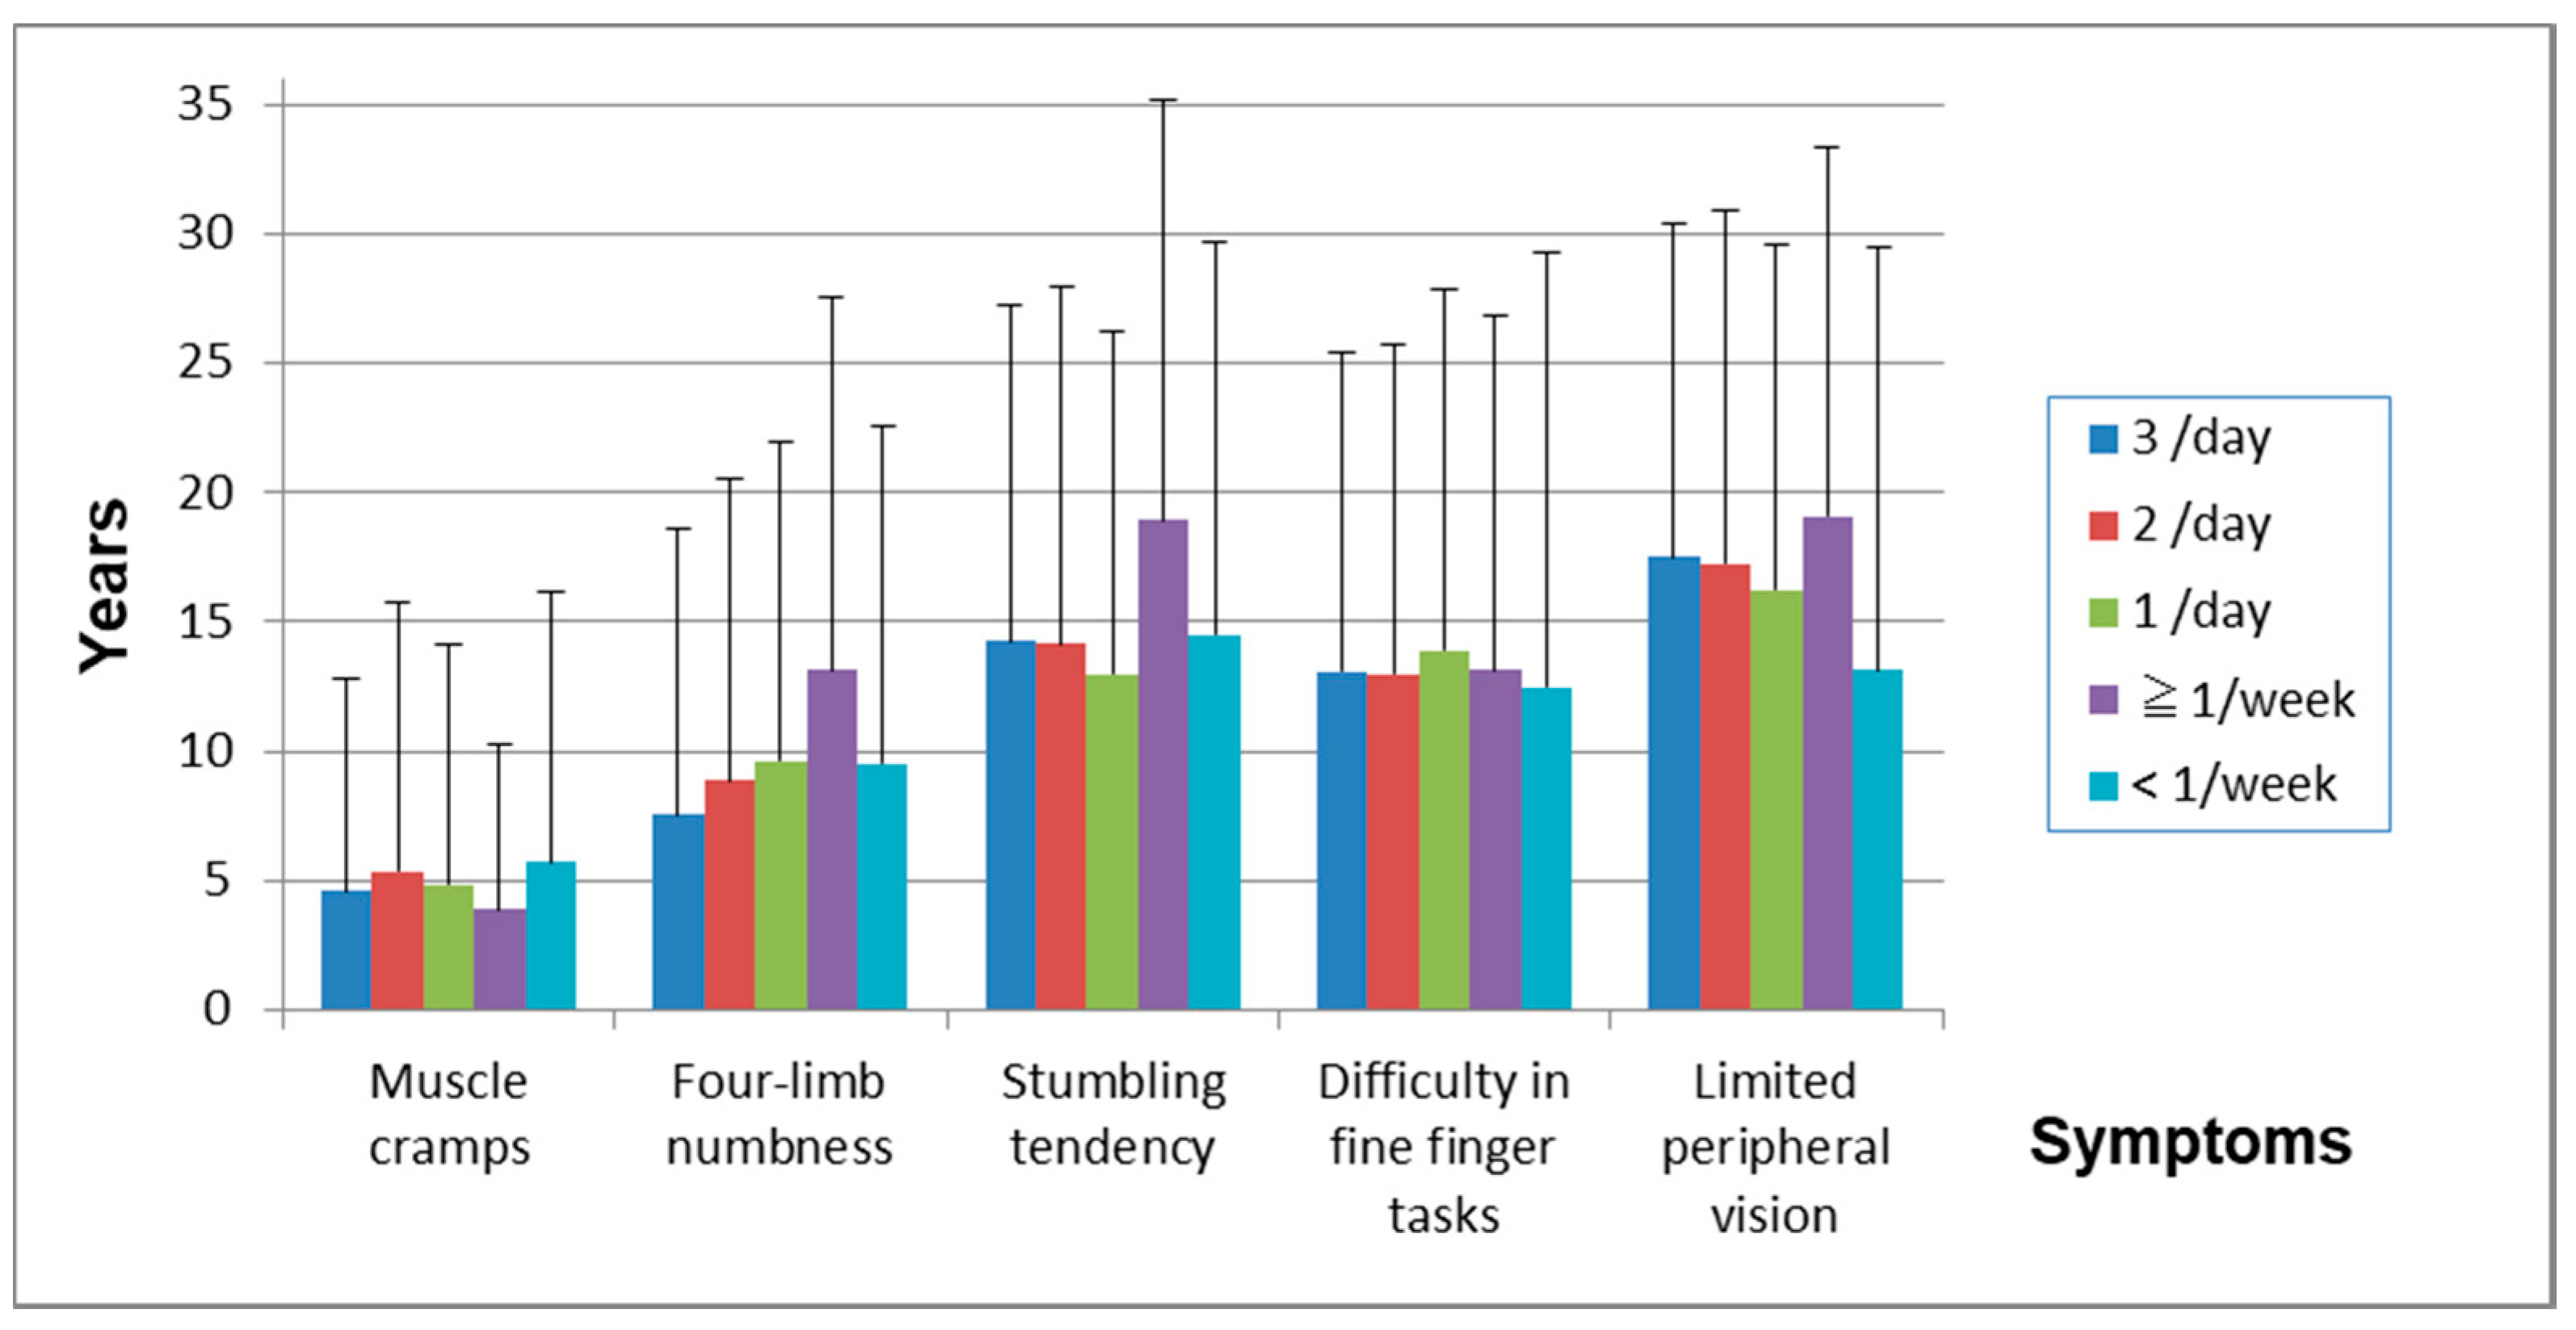
| 3/day | 2/day | 1/day | ≥1/week | <1/week | |
|---|---|---|---|---|---|
| (n = 455) | (n = 269) | (n = 144) | (n = 79) | (n = 18) | |
| First symptom | 1974.2 ± 15.1 | 1975.6 ± 14.6 | 1978.2 ± 14.8 | 1977.7 ± 15 | 1982.5 ± 15.2 |
| >1968/case (%) | 277/455 (60.9) | 174/269 (64.7) | 105/144 (72.9) | 56/79 (70.9) | 15/18 (83.3) |
| Muscle cramps | 1978 ± 15.1 | 1980.6 ± 14.9 | 1981.7 ± 14.5 | 1980.9 ± 15.5 | 1986.4 ± 17 |
| case/N (=965) (%) | 428/455 (94.1) | 255/269 (94.8) | 133/144 (92.4) | 69/79 (87.3) | 14/18 (77.8) |
| >1968/case (%) | 308/428 (72.0) | 194/255 (76.1) | 108/133 (81.2) | 52/69 (75.4) | 11/14 (78.6) |
| First symptom-Muscle cramps | 4.6 ± 8.2 | 5.4 ± 10.4 | 4.9 ± 9.3 | 3.9 ± 6.3 | 5.7 ± 10.5 |
| Four limb numbness | 1981.3 ± 15.5 | 1984.6 ± 13.8 | 1987.5 ± 14.6 | 1990.2 ± 12.6 | 1991.8 ± 11.7 |
| case/N (=965) (%) | 430/455 (94.5) | 251/269 (93.3) | 129/144 (89.6) | 73/79 (92.4) | 15/18 (83.3) |
| >1968/case (%) | 339/430 (78.8) | 216/251 (86.1) | 111/129 (86.0) | 69/73 (94.5) | 15/15 (100) |
| First symptom-Four limb numbness | 7.6 ± 11.1 | 8.9 ± 11.6 | 9.6 ± 12.4 | 13.1 ± 14.4 | 9.5 ± 13.1 |
| Stumbling tendency | 1987.2 ± 13.9 | 1988.9 ± 14.1 | 1990.6 ± 12.5 | 1994.5 ± 11.5 | 1993.8 ± 10.5 |
| case/N (=965) (%) | 368/455 (80.9) | 206/269 (76.6) | 112/144 (77.8) | 48/79 (60.8) | 10/18 (55.6) |
| >1968/case (%) | 332/368 (90.2) | 185/206 (89.8) | 105/112 (93.8) | 48/48 (100) | 10/10 (100) |
| First symptom-Stumbling tendency | 14.3 ± 13.0 | 14.2 ± 13.8 | 13 ± 13.2 | 18.9 ± 16.2 | 14.5 ± 15.2 |
| Difficulty in fine finger tasks | 1985.4 ± 13.6 | 1986.3 ± 14.4 | 1989.1 ± 14.2 | 1989.1 ± 14.4 | 1996.9 ± 8.4 |
| case/N (=965) (%) | 320/455 (70.3) | 168/269 (62.5) | 82/144 (56.9) | 40/79 (50.6) | 8/18 (44.4) |
| >1968/case (%) | 284/320 (88.8) | 147/168 (87.5) | 73/82 (89.0) | 36/40 (90.0) | 8/8 (100) |
| First symptom-Difficulty in fine finger tasks | 13.1 ± 12.3 | 13 ± 12.7 | 13.9 ± 13.9 | 13.1 ± 13.7 | 12.5 ± 16.7 |
| Limited peripheral vision | 1989.7 ± 12.8 | 1990.8 ± 13.3 | 1991.8 ± 12.9 | 1991.3 ± 16.1 | 1993.8 ± 13.8 |
| case/N (=965) (%) | 302/455 (66.4) | 165/269 (61.3) | 80/144 (55.6) | 36/79 (45.6) | 8/18 (44.4) |
| >1968/case (%) | 281/302 (93.0) | 155/165 (93.9) | 77/80 (96.3) | 33/36 (91.7) | 8/8 (100) |
| First symptom-Limited peripheral vision | 17.5 ± 12.9 | 17.3 ± 13.7 | 16.3 ± 13.4 | 19.1 ± 14.3 | 13.1 ± 16.3 |
| First Symptom | Muscle Cramps | Four Limb Numbness | Stumbling Tendency | Difficulty in Fine Finger Tasks | Limited Peripheral Vision | |
|---|---|---|---|---|---|---|
| Symptom score (always) | ||||||
| R2 | 0.0496 | 0.0329 | 0.0789 | 0.0453 | 0.0383 | 0.0567 |
| p-value | (0.000) | (0.000) | (0.000) | (0.000) | (0.000) | (0.000) |
| Symptom score (always and sometimes) | ||||||
| R2 | 0.0845 | 0.0612 | 0.1134 | 0.0641 | 0.0443 | 0.0716 |
| p-value | (0.000) | (0.000) | (0.000) | (0.000) | (0.000) | (0.000) |
| Cranial nerve score | ||||||
| R2 | 0.0193 | 0.0127 | 0.0222 | 0.0098 | 0.0105 | 0.0062 |
| p-value | (0.000) | (0.000) | (0.000) | (0.004) | (0.006) | (0.031) |
| Upper, lower ataxia and tremor score | ||||||
| R2 | 0.0298 | 0.0173 | 0.0438 | 0.0237 | 0.0121 | 0.0141 |
| p-value | (0.000) | (0.000) | (0.000) | (0.000) | (0.004) | (0.002) |
| Truncal ataxia score | ||||||
| R2 | 0.0143 | 0.0046 | 0.0291 | 0.0165 | 0.0115 | 0.008 |
| p-value | (0.023) | (0.000) | (0.000) | (0.004) | (0.017) | (0.000) |
| Sensory score | ||||||
| R2 | 0.0219 | 0.0163 | 0.0309 | 0.0272 | 0.022 | 0.0058 |
| p-value | (0.000) | (0.000) | (0.000) | (0.000) | (0.000) | (0.035) |
| Total neurological score | ||||||
| R2 | 0.0428 | 0.0248 | 0.0633 | 0.0385 | 0.0289 | 0.0189 |
| p-value | (0.000) | (0.000) | (0.000) | (0.000) | (0.000) | (0.000) |
| Control Area | BA1968 | Designated Area | Total | |
|---|---|---|---|---|
| (n = 88) | (n = 30) | (n = 84) | (n = 202) | |
| Sex, n (%) | ||||
| Male | 40 (45.5) | 21 (70.0) | 44 (52.4) | 105 (52.0) |
| Female | 48 (54.6) | 9 (30.0) | 40 (47.6) | 97 (48.0) |
| Age | ||||
| Mean ± SD | 37.5 ± 6.0 | 37.4 ± 2.3 | 44.8 ± 2.3 | 40.5 ± 5.6 |
| Range (min–max) | 30–48 | 33–40 | 40–48 | 30–48 |
| Smoking, n (%) | ||||
| Non-smoker | 56 (65.1) | 19 (63.3) | 49 (58.3) | 124 (62.0) |
| Smoker | 30 (34.9) | 11 (36.7) | 35 (41.7) | 76 (38.0) |
| Alcohol drinking, n (%) | ||||
| Non-drinker | 41 (47.7) | 11 (36.7) | 30 (35.7) | 82 (41.0) |
| Drinker | 45 (52.3) | 19 (63.3) | 54 (64.3) | 118 (59.0) |
| Frequency of fish intake, n (%) | ||||
| Three times a day | 3 (3.4) | 15 (50.0) | 30 (35.7) | 48 (23.8) |
| Twice a day | 1 (1.1) | 6 (20.0) | 24 (28.6) | 31 (15.4) |
| Once a day | 9 (10.2) | 5 (16.7) | 21 (25.0) | 35 (17.3) |
| More than once a week | 53 (60.2) | 2 (6.7) | 8 (9.5) | 63 (31.2) |
| Less than once a week | 20 (22.7) | 2 (6.7) | 1 (1.2) | 23 (11.4) |
| Occupation, n (%) | ||||
| Fishermen (subject) | 0 (0.0) | 1 (3.3) | 5 (6.0) | 6 (3.0) |
| Fishermen (subject’s parent) | 1 (1.2) | 9 (30.0) | 23 (27.4) | 33 (16.6) |
| Complications, n (%) | ||||
| Hypertension | 1 (1.1) | 0 (0.0) | 8 (9.5) | 9 (4.5) |
| Renal diseases | 0 (0.0) | 0 (0.0) | 3 (3.6) | 3 (1.5) |
| Liver diseases | 1 (1.1) | 0 (0.0) | 2 (2.4) | 3 (1.5) |
| Respiratory diseases | 8 (9.1) | 1 (3.3) | 6 (7.1) | 15 (7.4) |
| Diabetes Mellitus | 0 (0.0) | 1 (3.3) | 2 (2.4) | 3 (1.5) |
| Orthopedic diseases | 3 (3.4) | 3 (10) | 14 (16.7) | 20 (9.9) |
| Malignant diseases | 0 (0.0) | 0 (0.0) | 1 (1.2) | 1 (0.5) |
| History of application for inamata disease, n (%) | 0 (0.0) | 1 (3.3) | 13 (15.5) | 14 (6.9) |
| Family history of Minamata disease, n (%) | 0 (0.0) | 29 (96.7) | 76 (90.5) | 105 (52.0) |
| Have witnessed abnormal animal behavior, n (%) | No Data | 9 (30.0) | 27 (32.1) | 36 (31.6) |
| Control Area | BA1968 | Designated Area | |
|---|---|---|---|
| Age (Mean ± SD) | 37.5 ± 10.0 | 37.4 ± 10.0 | 44.8 ± 10.0 |
| (n) | (88) | (30) | (84) |
| Symptom score (always) | |||
| Mean ± SD | 0.1 ± 0.4 | 4.0 ± 5.0 | 4.2 ± 4.3 |
| Range (min–max) | 0–3 | 0–19 | 0–19 |
| Symptom score (always and sometimes) | |||
| Mean ± SD | 2.5 ± 2.9 | 19.7 ± 9.9 | 19.8 ± 9.1 |
| Range (min–max) | 0–16 | 2–42 | 2–42 |
| Cranial nerve score | |||
| Mean ± SD | 0.0 ± 0.2 | 0.4 ± 0.8 | 0.5 ± 1.1 |
| Range (min–max) | 0–2 | 0–2 | 0–4 |
| Upper, lower ataxia and tremor score | |||
| Mean ± SD | 0.0 ± 0.0 | 1.0 ± 1.2 | 0.6 ± 1.0 |
| Range (min–max) | 0–0 | 0–4 | 0–4 |
| Truncal ataxia score | |||
| Mean ± SD | 0.2 ± 0.5 | 1.7 ± 1.3 | 1.7 ± 1.5 |
| Range (min–max) | 0–3 | 0–4 | 0–5 |
| Sensory score | |||
| Mean ± SD | 0.0 ± 0.1 | 2.0 ± 1.7 | 2.2 ± 1.3 |
| Range (min–max) | 0–1 | 0–6 | 0–5 |
| Total neurological score | |||
| Mean ± SD | 0.2 ± 0.7 | 5.1 ± 3.8 | 5.0 ± 3.3 |
| Range (min–max) | 0–5 | 0–13 | 0–16 |
| Control Area | Sensory Disturbance (−) | Sensory Disturbance (+) | |
|---|---|---|---|
| (n = 142) | (n = 91) | (n = 882) | |
| Sex, n (%) | |||
| Male | 56 (39.4) | 64 (70.3) | 428 (48.5) |
| Female | 86 (60.6) | 27 (29.7) | 454 (51.5) |
| Age | |||
| Mean ± SD | 62.0 ± 10.5 | 59.7 ± 13.3 | 62.6 ± 11.6 |
| Range (min–max) | 36–86 | 33–87 | 33–92 |
| Residential history in designated area (DA) more than 1 year, n (%) | |||
| In DA > 1 year (DA) | 3 (2.1) | 69 (75.8) | 717 (81.3) |
| Not in DA > 1 year (NDA) | 139 (97.9) | 13 (14.3) | 144 (16.3) |
| Born after 1968 (BA1968) | 0 (0.0) | 9 (5.0) | 21 (2.4) |
| Smoking, n (%) | |||
| Non-smoker | 109 (77.3) | 66 (72.5) | 676 (81.0) |
| Smoker | 32 (22.7) | 25 (27.5) | 206 (19.0) |
| Alcohol drinking, n (%) | |||
| Non-drinker | 72 (51.1) | 43 (47.3) | 468 (53.1) |
| Drinker | 69 (48.9) | 48 (52.7) | 414 (47.0) |
| Frequency of fish intake, n (%) | |||
| Three times a day | 6 (4.4) | 34 (37.4) | 425 (48.2) |
| Twice a day | 7 (5.1) | 30 (33.0) | 241 (27.3) |
| Once a day | 27 (19.9) | 12 (13.2) | 134 (15.2) |
| More than once a week | 63 (46.3) | 13 (14.3) | 66 (7.5) |
| Less than once a week | 33 (24.3) | 2 (2.2) | 16 (1.8) |
| Occupation, n (%) | |||
| Fishermen (subject) | 0 (0.0) | 13 (14.3) | 118 (13.4) |
| Fishermen (subject’s parent) | 2 (1.6) | 28 (30.8) | 291 (33.0) |
| Complications, n (%) | |||
| Hypertension | 40 (28.2) | 28 (30.8) | 320 (36.3) |
| Renal diseases | 3 (2.1) | 7 (7.7) | 48 (5.4) |
| Liver diseases | 6 (4.2) | 10 (11.0) | 61 (6.9) |
| Respiratory diseases | 12 (8.5) | 4 (4.4) | 37 (4.2) |
| Diabetes Mellitus | 3 (2.1) | 9 (9.9) | 84 (9.5) |
| Orthopedic diseases | 13 (9.2) | 22 (24.2) | 224 (25.4) |
| Malignant diseases | 7 (4.9) | 3 (3.3) | 48 (5.4) |
| History of application for Minamata disease, n (%) | 0 (0.0) | 3 (3.3) | 109 (12.4) |
| Family history of Minamata disease, n (%) | 0 (0.0) | 48 (52.7) | 498 (56.5) |
| Have witnessed abnormal animal behavior, n (%) | No Data | 27 (29.7) | 360 (40.8) |
| Control Area | Sensory Disturbance (−) | Sensory Disturbance (+) | |
|---|---|---|---|
| Age (Mean ± SD) | 62.0 ± 10.5 | 59.7 ± 13.3 | 62.6 ± 11.6 |
| (n) | (142) | (91) | (882) |
| Symptom score (always) | |||
| Mean ± SD | 0.2 ± 0.5 | 4.0 ± 4.0 | 6.1 ± 5.2 |
| Range (min–max) | 0–3 | 0–16 | 0–23 |
| Symptom score (always and sometimes) | |||
| Mean ± SD | 3.2 ± 3.0 | 18.0 ± 8.7 | 23.3 ± 9.2 |
| Range (min–max) | 0–15 | 2–38 | 1–46 |
| Cranial nerve score | |||
| Mean ± SD | 0.2 ± 0.6 | 0.9 ± 1.4 | 1.2 ± 1.7 |
| Range (min–max) | 0–2 | 0–6 | 0–6 |
| Upper, lower ataxia and tremor score | |||
| Mean ± SD | 0.1 ± 0.4 | 0.6 ± 1.0 | 1.2 ± 1.4 |
| Range (min–max) | 0–3 | 0–4 | 0–5 |
| Truncal ataxia score | |||
| Mean ± SD | 0.9 ± 1.0 | 1.8 ± 1.7 | 2.7 ± 1.6 |
| Range (min–max) | 0–3 | 0–5 | 0–5 |
| Sensory score | |||
| Mean ± SD | 0.0 ± 0.2 | 0.0 ± 0.0 | 2.6 ± 1.2 |
| Range (min–max) | 0–2 | 0–0 | 1–6 |
| Total neurological score | |||
| Mean ± SD | 1.2 ± 1.4 | 3.4 ± 3.0 | 7.7 ± 4.2 |
| Range (min–max) | 0–8 | 0–15 | 1–21 |
© 2018 by the authors. Licensee MDPI, Basel, Switzerland. This article is an open access article distributed under the terms and conditions of the Creative Commons Attribution (CC BY) license (http://creativecommons.org/licenses/by/4.0/).
Share and Cite
Takaoka, S.; Fujino, T.; Kawakami, Y.; Shigeoka, S.-i.; Yorifuji, T. Survey of the Extent of the Persisting Effects of Methylmercury Pollution on the Inhabitants around the Shiranui Sea, Japan. Toxics 2018, 6, 39. https://doi.org/10.3390/toxics6030039
Takaoka S, Fujino T, Kawakami Y, Shigeoka S-i, Yorifuji T. Survey of the Extent of the Persisting Effects of Methylmercury Pollution on the Inhabitants around the Shiranui Sea, Japan. Toxics. 2018; 6(3):39. https://doi.org/10.3390/toxics6030039
Chicago/Turabian StyleTakaoka, Shigeru, Tadashi Fujino, Yoshinobu Kawakami, Shin-ichi Shigeoka, and Takashi Yorifuji. 2018. "Survey of the Extent of the Persisting Effects of Methylmercury Pollution on the Inhabitants around the Shiranui Sea, Japan" Toxics 6, no. 3: 39. https://doi.org/10.3390/toxics6030039
APA StyleTakaoka, S., Fujino, T., Kawakami, Y., Shigeoka, S.-i., & Yorifuji, T. (2018). Survey of the Extent of the Persisting Effects of Methylmercury Pollution on the Inhabitants around the Shiranui Sea, Japan. Toxics, 6(3), 39. https://doi.org/10.3390/toxics6030039