1. Introduction
Rapid urbanization and industrialization release enormous volumes of wastewater, which dramatically increase the possibility of water pollution. The toxic chemical and heavy metals within wastewater have caused a great number of serious water pollution problems, especially in developing countries [
1,
2,
3]. Heavy metals are very harmful, due to their features, such as the non-biodegradable nature, long biological half-lives and potential to easily accumulate in different organisms and plants [
4,
5,
6,
7,
8]. Even low concentrations of heavy metals in a water body can cause damaging effects on human and animals, because no good mechanism and effective ways have been found for the removal and elimination of heavy metals from the body [
2]. Therefore, it is urgent and necessary to evaluate these potential risks to help people avoid the hazardous sources. Health risk assessment (HRA) can be used to characterize the potential adverse health effects of human exposures to environmental hazards and is an effective tool for supporting decision-making and corrective actions in water quality management [
9,
10]. It can also help people to monitor and understand the air, water and environment quality to guide people to avoid potential risks.
Due to the incompleteness and imprecision of data, measurement error and other limitations of available information, uncertainty is inevitable in the HRA [
11,
12]. Usually, deterministic or point estimation techniques can be used to estimate the risk level of contaminants in a concerned site. To minimize the uncertainties and errors, risk levels can also be evaluated through probabilistic approaches using probability distribution functions (PDFs). Monte Carlo simulation is able to generate enough random values and to calculate the output value and the probability of its occurrence to obtain an output probability distribution. Quantification of risk levels using Monte Carlo simulation can provide a risk assessment by considering the uncertainty and bounding the true value of the risk [
13,
14].
Since environmental data are usually not well behaved, input data and parameters are the major sources of uncertainties in risk assessment [
15,
16]. For example, concentrations of contaminants in the water sample are sometimes below the analytical reporting limit of the laboratory (also called the detection limit). These “less-than” values make it impossible to compute a simple mean concentration, so the point estimation method is unsuitable for implementation. A robust statistical method was introduced in this study to deal with this type of censored data. The limited numbers of data also cause high uncertainties and variances to represent the real behavior of true data sets of concentrations in nature [
16]. If the point estimation is applied to risk assessment, more uncertainties will be involved, due to the lack of consideration of the variability of the data. The probabilistic methods can generate enough data after the distribution identification, which can be further applied to risk assessment. Therefore, probabilistic methods for risk assessment are preferred for some cases.
The purpose of this study is to conduct a non-cancer human risk assessment of dermal exposure through contaminated river water by considering uncertainty. Five heavy metals were selected to evaluate the risk level, including arsenic (As), manganese (Mn), molybdenum (Mo), uranium (U) and zinc (Zn). Due to the limitation of the collected concentration data of heavy metals, statistical methods and probabilistic methods were used to deal with censored data and to handle the limited number of data, respectively. Instead of using single point estimation, Monte Carlo simulation was used to generate the probabilistic distributions of the hazard index (HI) to consider the uncertainty and variability of HRA models for risk calculation. A case study in the Kelligrews River close to St. John’s, in Northeastern Canada, was conducted to demonstrate the feasibility of the proposed approaches.
2. Methodology
2.1. Health Risk Assessment (HRA)
HRA can be defined as the activity that evaluates the toxic properties of a chemical and the conditions of human exposure to this chemical by monitoring the human exposure and characterizing the nature of effects that may result [
9,
17,
18]. The purpose of HRA is to provide scientific references to different health authorities, related government departments and environmental protection organizations for helping their decision-making. Generally, the approach is composed of four procedures, including hazard identification, dose-response assessment, exposure assessment and risk characterization [
9].
In the hazard identification step, five heavy metals in the river water are considered in this study. All of these five selected heavy metals were considered as toxic chemicals and can cause adverse non-carcinogenic impacts on human at very low levels of concentration in the dose-response assessment step. In the third step, exposure assessment, the dermal contact is assumed the only pathway for risk assessment, and other parameters were estimated based on relevant references and local survey [
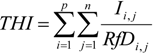
19]. In the last step, risk characterization, all the information collected from the previous three steps are used to estimate the magnitude of human risk and corresponding uncertainty. In order to calculate the risk, firstly, the intake dose should be obtained from some calculation. Equation (1) is used for calculating the intake dose through dermal exposure contact with contaminated water, and Equation (2) is used to calculate the HI [
20]. An HI value greater than 1 indicates that there are potential risks in the research area and the possibility of non-cancer effects cannot be neglected. People need to pay attention to those contaminations. If the HI value is much lower than 1, this means there is no observed adverse impacts to human beings.
where,
I = Intake rate (mg/kg·day)
C = Concentration at exposure point (e.g., mg/L)
CF = Conversion factor = 10−6 (kg/mg)
SA = Skin surface area available (cm2/event)
PC = Chemical-specific dermal permeability constant (cm/h)
ET = Length of exposure time (h/day)
EF = Exposure frequency (days/year)
ED = Exposure duration (years)
Abs = Absorption into bloodstream (decimal fraction)
BW = Body weight (kg)
AT = Average time (days)
HIj = Hazard index of one contaminant
RfD = Reference dose (mg/kg·day)
To be noticed, the ingestion pathway is another important pathway, because children sometimes swallow a certain amount of water by accident. However, it is complicated and inaccurate to estimate and quantify the volume of water accidently swallowed by the children in the study area. Therefore, in this study, the dermal exposure contact was considered as the major pathway for HRA from a long-term point of view.
2.2. Statistical Methods for Censored Data
Due to the detection limits caused by the limitation of current measuring methods and instruments, some data are recorded as “less than” or “greater than”, especially for some environmental data, such as the concentration of pollutants in water [
21]. In this study, the sample data report from the certified laboratory showed that some metal concentrations are less than the limits deemed reliable enough to report as numerical values, and these less-than values are called the values below detection limits (or called censored data). In order to scientifically estimate the summary statistics of censored data, three statistical methods can be applied, which include simple substitution, distributional and robust methods. Among the three methods, the robust method has advantages over the other two through several comparison studies [
22,
23,
24]. Therefore, the robust method was applied in this study to estimate the portion of heavy metals’ concentration data that are below the detection limits. Through the statistical procedures, the quality of the concentration data can be improved and uncertainty can be relatively controlled. The estimated value can be combined with the data above the detection limits to get the summary statistics of the original data. The following procedures show how to estimate the censored data [
16]:
Step 1: All “less-than” values are set to slightly different values below the detection limits;
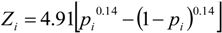
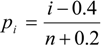
Step 2: A linear regression equation between
qi and
Zi was developed by using only above-limit data.
Zi can be obtained by (
qi is the ranked original data):
where
i is the rank of data and
n is sample size.
Step 3: Check the assumptions and performance of generated regressions to make sure the regression model can be used to estimate the censored data;
Step 4: The less-than values can be calculated.
3. Case Study
Situated in the outskirts of St. John’s, Newfoundland, the Nut Brook stream has been contaminated by wastewater containing toxic substances from the various industrial, commercial and residential places surrounding the areas. The main contributor of wastewater to Nut Brook are industrial activities, since midway along its path is a highly active industrial zone. Because of the toxic heavy metals in the Nut Brook stream, a greater concern arises from the fact that Nut Brook is the main head-water tributary of the Kelligrews River, which flows through a dense population region. Although the Kelligrews River is not a drinking water resource, it is sometimes used recreationally for fishing and swimming. Due to this reason, in the summer of 2005, the Northeast Avalon Atlantic Coastal Action Program (NAACAP) initiated a monitoring project on the Nut Brook stream system. In that report, the collection and analysis of water and sediment samples had been done for the purpose of compiling baseline information, helping NAACAP to determine and analyze the impact extent of environmental damage coming from heavy metal loadings and extensive sedimentation [
19,
25].
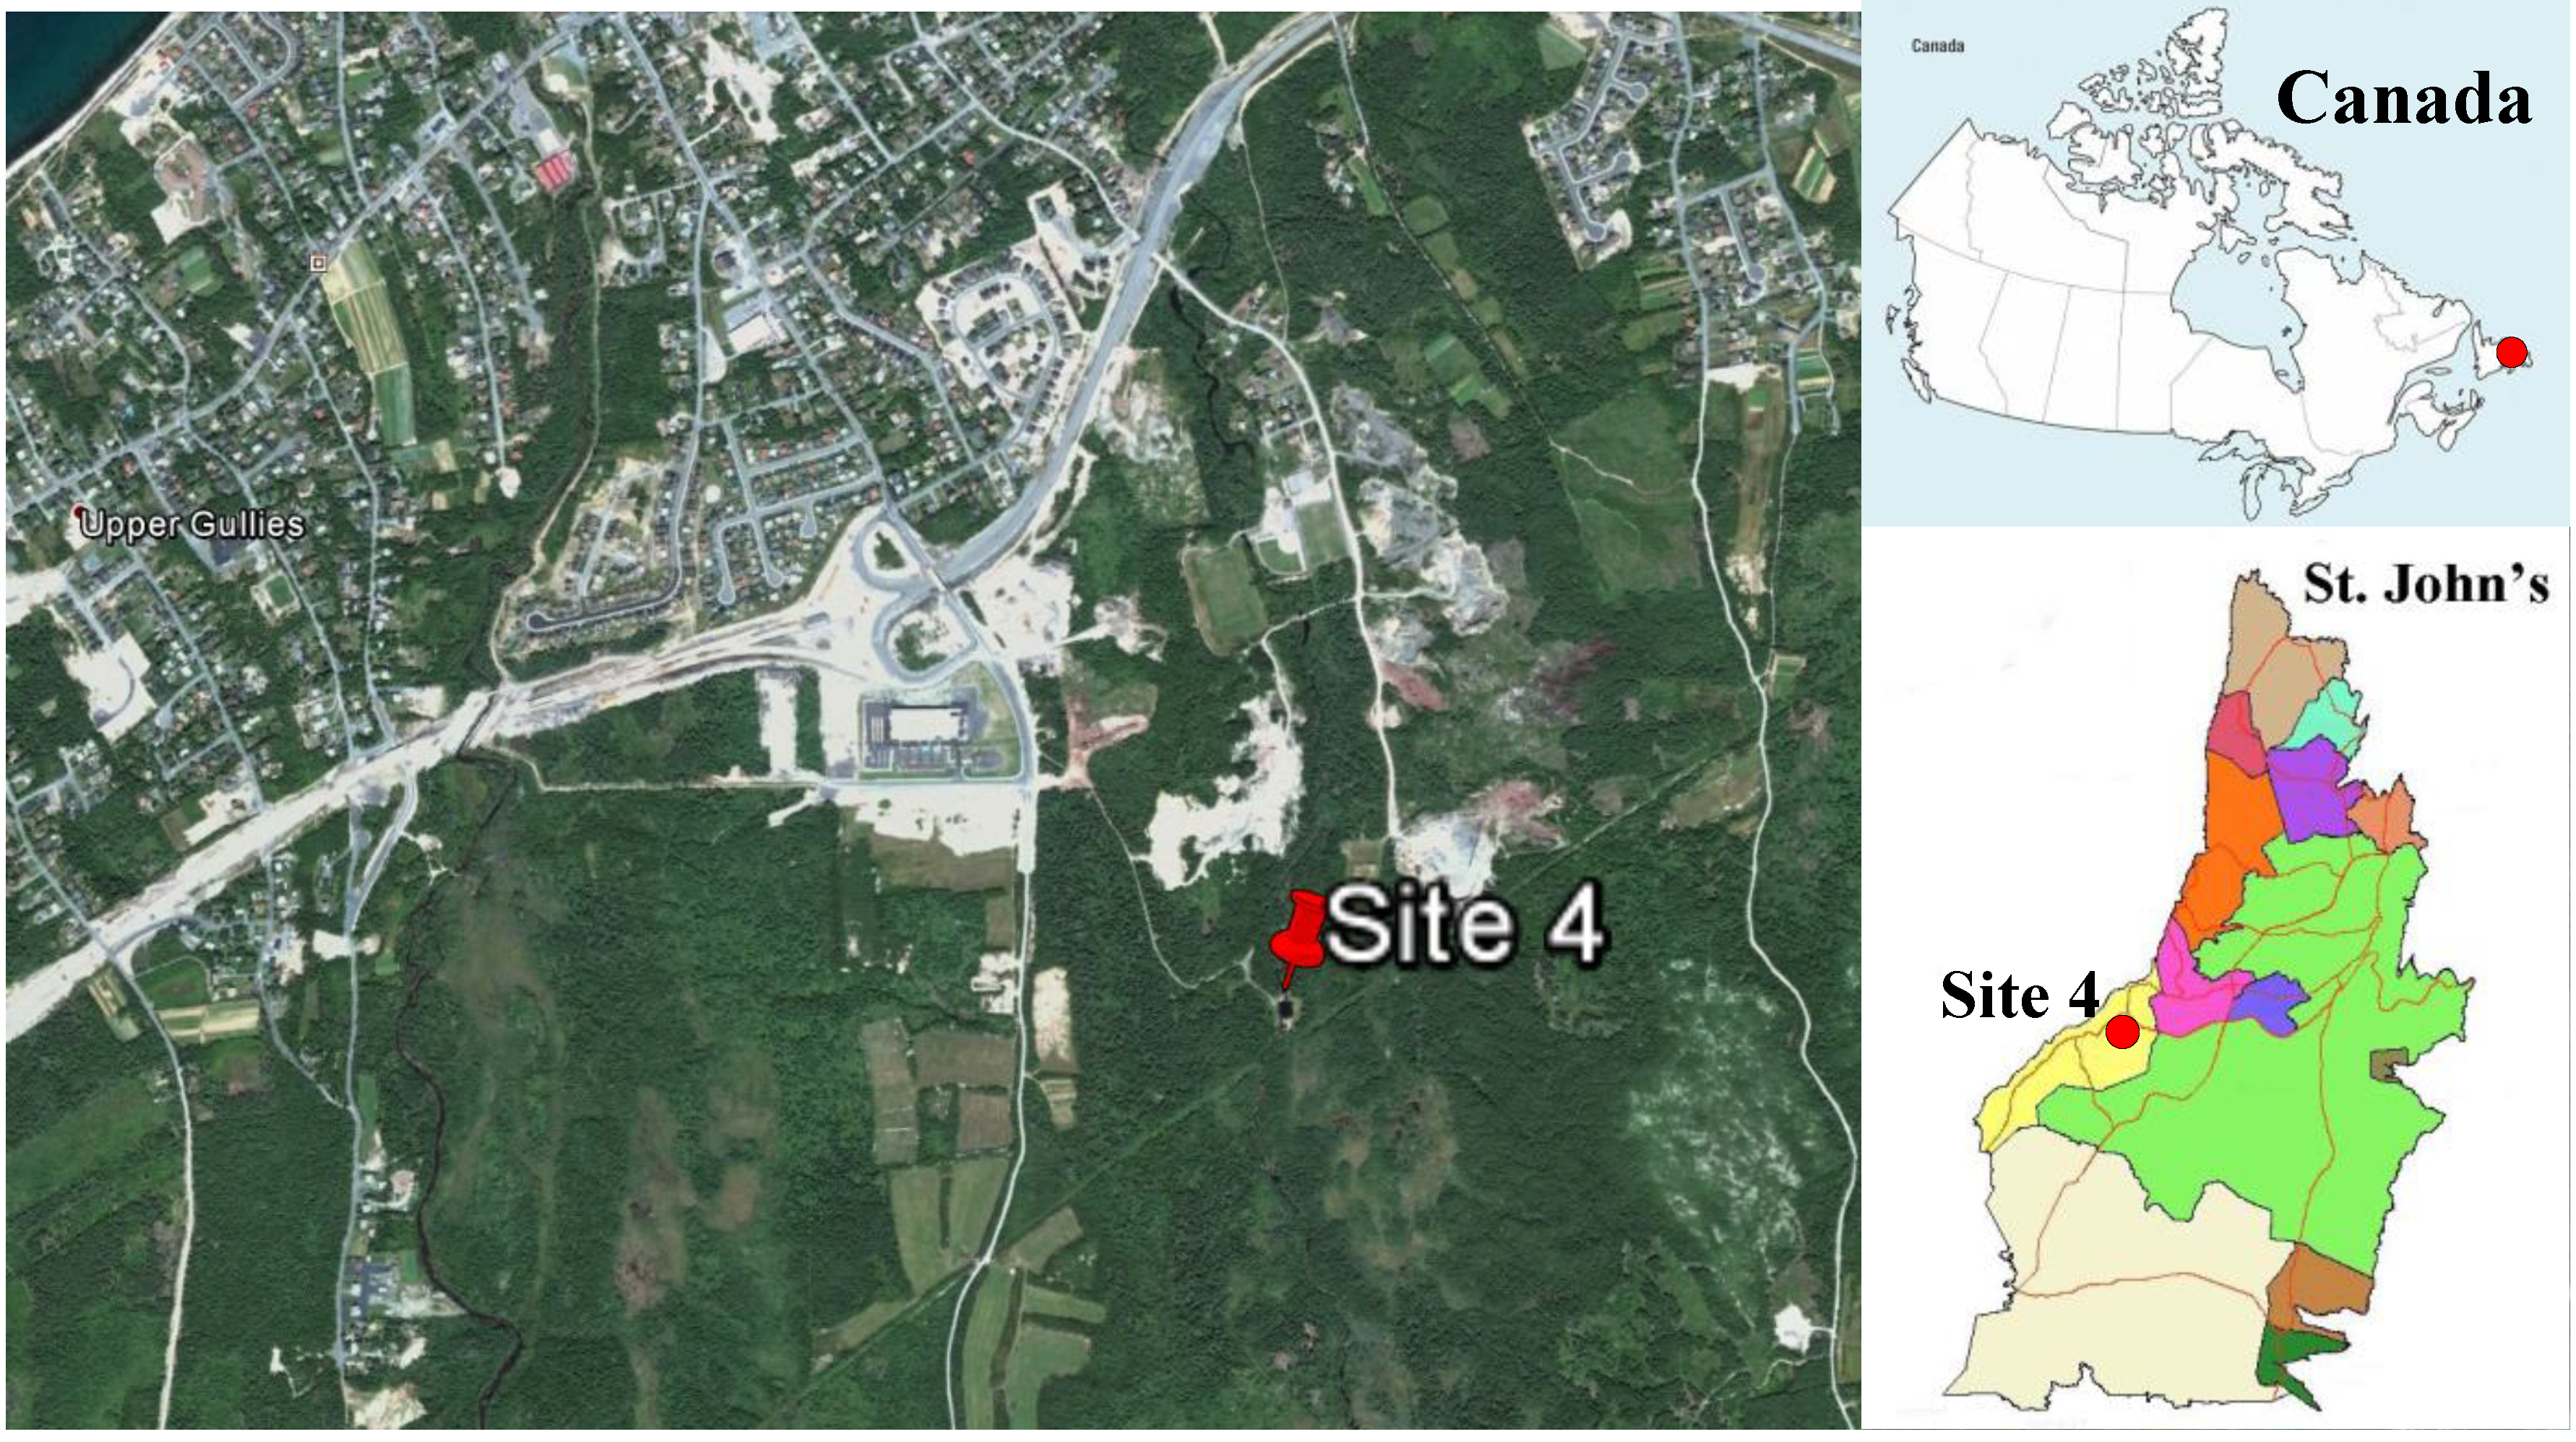
Investigation of the 8 sampling sites were conducted for 3 years, and water sample data were collected from these sites. Among the 8 sites, Site 4, located in the Kelligrews River, used to be a swimming pool for a long time, and there are still some human activities now.
Figure 1 shows the location of the sampling site. Because of one baseball court and soccer court located near that area, people often go there and have some recreational activities. In summer, some children often play there. It is inevitable to have some intake from dermal contact, with contaminated water causing potential health concerns, even though the water appears very clean. Therefore, it is necessary to conduct risk assessment for human beings. By considering some uncertainty factors, risk assessment has been conducted in the following part.
Figure 1.
Site 4 location in the Kelligrews River.
Figure 1.
Site 4 location in the Kelligrews River.
4. Data Preparation
4.2. Uncertainties in Concentration
The concentration of contaminants is one of the most important inputs in the risk assessment of dermal exposure, so it is necessary to provide accurate concentration data in order to obtain more reliable risk assessment. However, some censored concentration data (or called “less-than” data) were recorded for As, U and Zn in this study, making the analysis and assessment more complicated. Unlike the normal data, the data with less-than values present a serious interpretation problem for data analysts. From some previous studies, many researchers used one-half of the detection limit values or the values slightly smaller than the detection limit values, according to the suggestion from the U.S. EPA. However, this may cause more uncertainties and lose power to reflect the real distribution of the data.
The robust statistical method was applied to handle the censored data by using Equations (3) and (4). The concentration of As in Site 4 was selected as an example below. Since the data can usually fit the lognormal distribution for most of the environmental data [
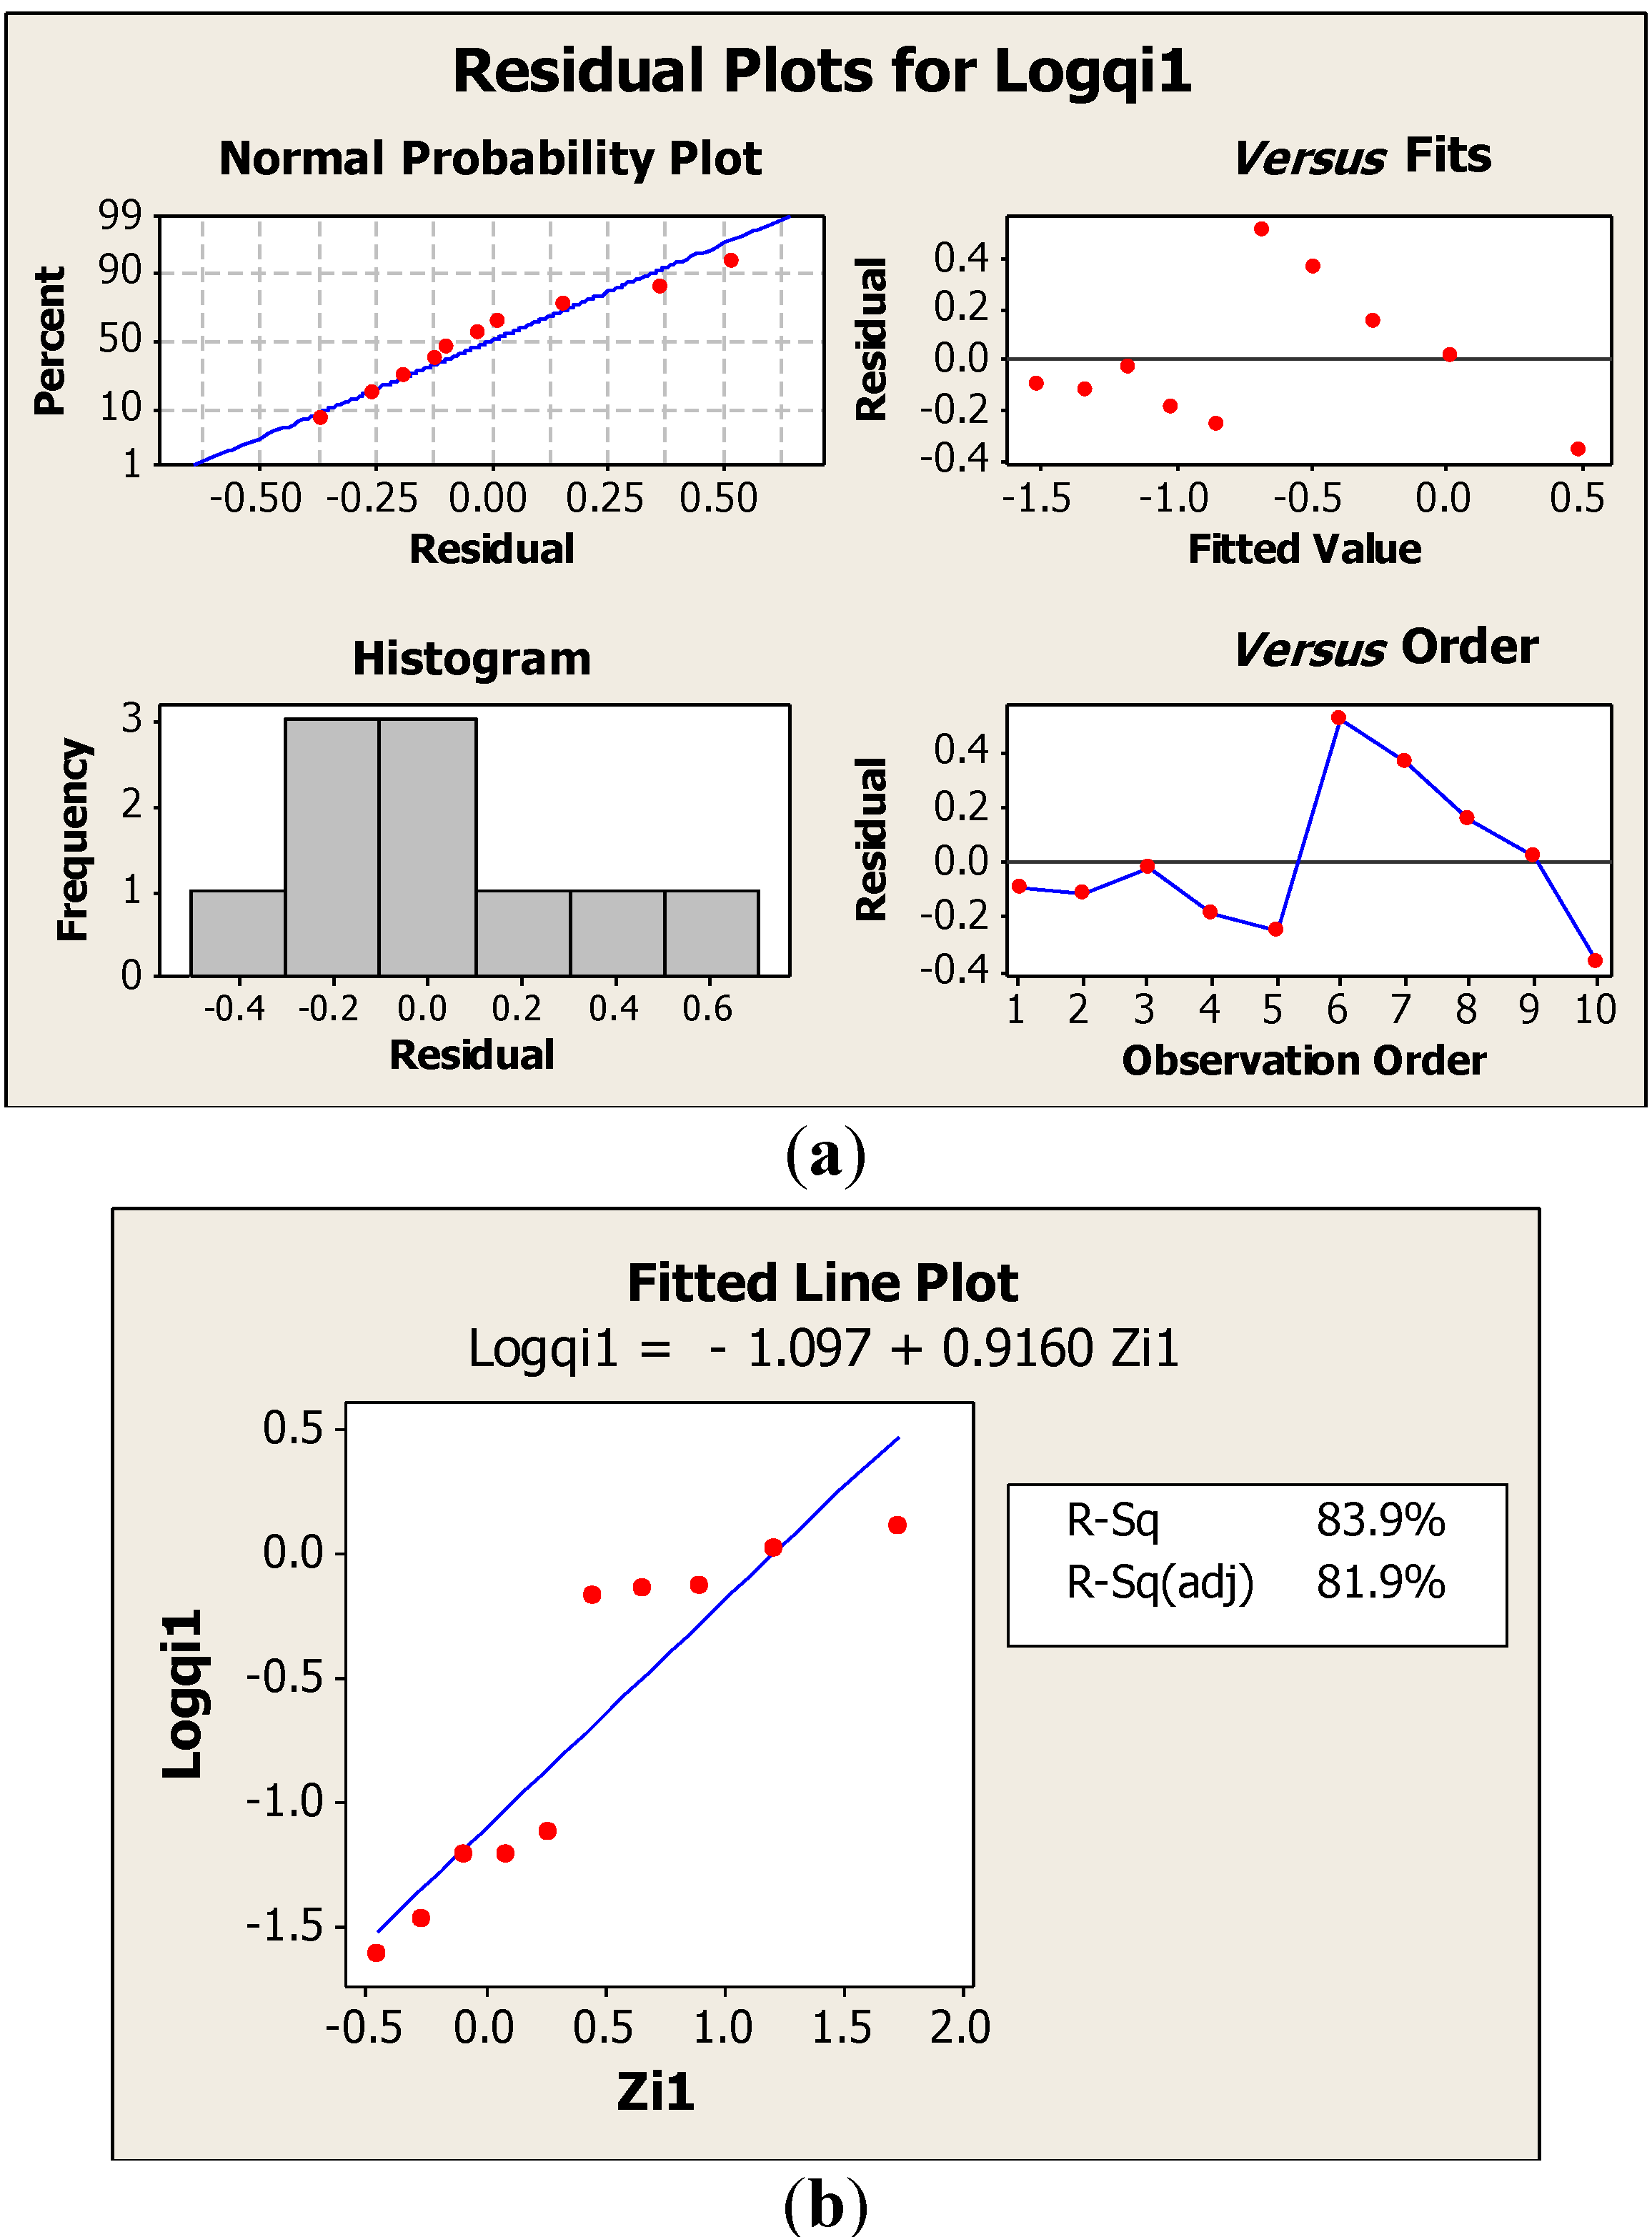
16], if the original data cannot fit the regression line very well, the logarithm data would be used to obtain the regression equation. For As in this study, the logarithm data would be more appropriate. The regression results are shown in
Table 2.
Table 2.
Regression analysis: Logqi1 vs. Zi1.
Table 2.
Regression analysis: Logqi1 vs. Zi1.
| Logqi1 = −1097 + 0.916 × Zi1 |
| S = 0.291865 | R-Sq = 83.9% | R-Sq(adj) = 81.9% |
| Analysis of variance |
| Source | DF | SS | MS | F | p |
| Regression | 1 | 3.5642 | 3.5642 | 41.84 | <0.001 |
| Error | 8 | 0.68148 | 0.08519 | | |
| Total | 9 | 4.24568 | | | |
Figure 3.
Residual plots (a) and fitted line plot (b) of linear regression for As.
Figure 3.
Residual plots (a) and fitted line plot (b) of linear regression for As.
As is shown in
Figure 3a, all the assumptions of the regression are met.
Figure 3b shows the data approximately following a straight line, and the adj-
R2 in (
Table 2) is 81.9%, indicating the good performance of the regression model. The
p-value is smaller than 0.001, indicating the significance of the regression model. Therefore, the predicted equation could be used to estimate the data value below the detection limit. After the above procedures, the data below the detection limit were estimated and combined with the above-limit data as treated concentration data. Similarly, U and Zn, which contained censored data, were also treated by this robust method. The values of adj-
R2 for U and Zn are 96.3% and 88.1%, respectively, and both
p-values for regression models are smaller than 0.001. Due to the significance of the regression models, all the estimated concentrations of U and Zn along with real concentrations were used for further tests.
4.3. Data Generalization
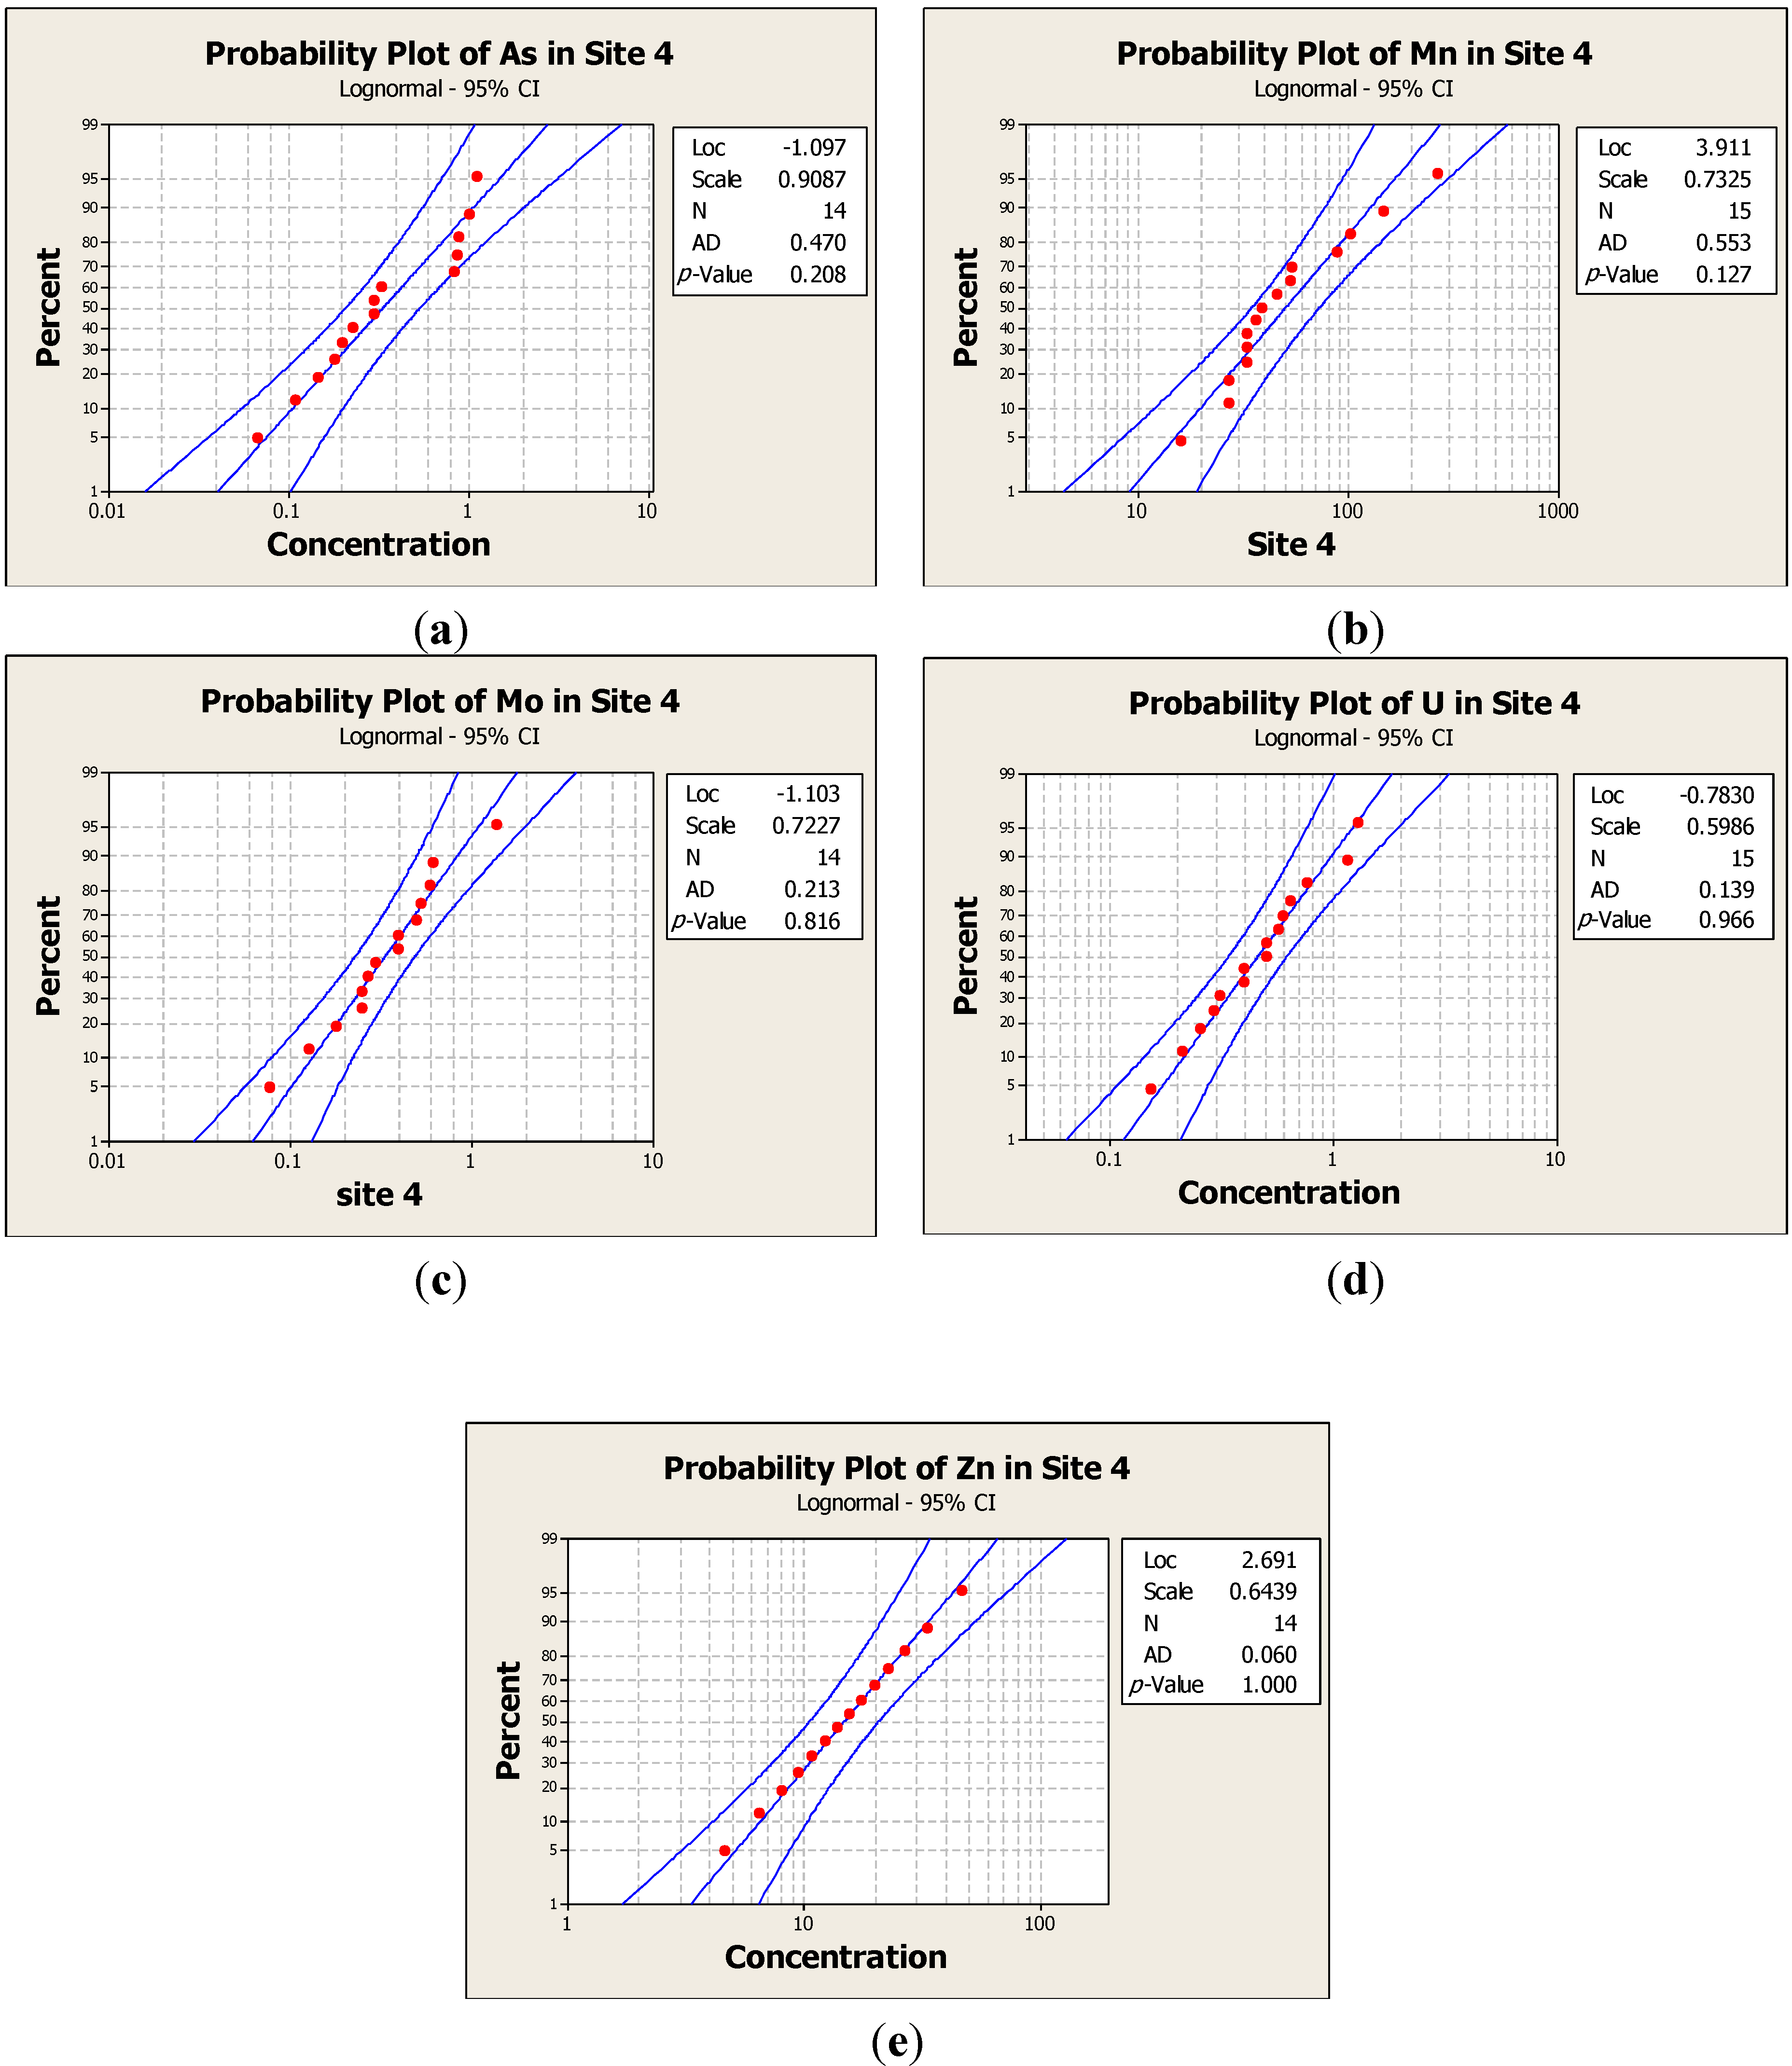
Because of the limited sample size, the mean value cannot stand for the typical value of the concentration of certain contaminants. In order to take the uncertainty into account, it is better to find a fit distribution for each contaminant and use those important parameters to calculate the risk. When the fit distribution of the concentration is found, the Monte Carlo simulation method can be used to generate enough data and apply the data for calculation to get the desired results. Through above statistical methods, the probability test plots of three treated concentrations along with the original concentrations of Mn and Mo were shown in
Figure 4.
Figure 4.
Probability test plots for a concentration of (a) As; (b) Mn; (c) Mo; (d) U; and (e) Zn.
Figure 4.
Probability test plots for a concentration of (a) As; (b) Mn; (c) Mo; (d) U; and (e) Zn.
According to the analysis results (the p-values of all the tests are greater than 0.05), there is no evidence to reject that the five concentration data sets follow a lognormal distribution. All the estimated parameters from the probability test could be easily used to generate enough data to conduct HRA.
4.4. Other Parameters
After the above procedures, all the concentration data were identified as lognormal distributions, and the associated parameters were also estimated. The obtained information can be used for Monte Carlo simulation to generate a set of data required for risk assessment. Some other parameters in Equation (1) are usually assumed as constants, such as the chemical-specific dermal permeability constant as 0.6 cm/h for dermal contact, absorption into the bloodstream as 6% and the conversion factor as 10
−6 kg/mg [
18,
25]. According to a survey, children mainly play in the water at Site 4. Due to the climate, there are just 3 months suitable for playing in water, and children cannot play for a very long time every day. Children would play there for about 15 years before they become adults [
19]. Therefore, considered as a practical case, some other parameters can be assumed as follows: the length of exposure time as 2 h/day, the exposure frequency as 50 days/year, the exposure duration as 15 years, and the average time as 365 days/year × 15 years = 5475 days. The rest of the parameters can be viewed as uncertain parameters, and it is better to use probability distributions to evaluate.
Table 3 shows some suggested distributions with typical values for important parameters in Equation (1).
Table 3.
Risk parameters considered as random variables (lognormal distribution with geometric mean and geometric stand deviation: LN (gm, gsd)) for different age groups [
12,
26].
Table 3.
Risk parameters considered as random variables (lognormal distribution with geometric mean and geometric stand deviation: LN (gm, gsd)) for different age groups [12,26].
| Definition | units | Infant | Children | Adult |
|---|
| Age | year | 0–1 | 5–19 | 20–70 |
| Body weight (BW) | kg | LN(6.79, 1.27) | LN(36.24, 1.05) | LN(59.78, 1.07) |
| Dermal surface exposure (SA) | cm2 | LN(719, 1.19) | LN(2196, 1.08) | LN(3067, 1.06) |
As can be seen in
Table 3, the body weight for children follows a lognormal distribution with a geometric mean of 36.24 and a geometric standard deviation of 1.05. Similarly, dermal surface exposure (SA) fits a lognormal distribution with a geometric mean of 2,196 and a geometric standard deviation of 1.08. These parameters can be used to generate the random data for calculation.
4.5. Reference Dose
Up to now, all the parameters in Equation (1) have been estimated or assumed. However, to get the HI, the reference dose (RfD) is necessary for each heavy metal. From the U.S. EPA, the RfDs of exposure for each selected heavy metal can be found. The RfDs of exposure are shown in
Table 4. The data were used for calculating HI by Equation (2).
Table 4.
Reference dose of exposure for five contaminants [
27]. RfD, reference dose.
Table 4.
Reference dose of exposure for five contaminants [27]. RfD, reference dose.
| Contaminants | Arsenic | Manganese | Molybdenum | | Uranium | Zinc |
|---|
| CAS No. | 7440-38-2 | 7439-96-5 | 7439-98-7 | | 7440-61-1 | 7440-66-6 |
| Carcinogenicity | Car. and Non-Car. | Non-car. | Non-car. | | Non-car. | Non-car. |
| RfD (mg/kg·day) | 3.0 × 10⁻⁴ | 1.4 × 10⁻¹ | 5.0 × 10⁻³ | | 3 × 10⁻³ | 0.3 |
4.6. Monte Carlo Simulation
To consider the uncertainty of HIs, the concentration of five heavy metals needs to be generalized. By using the Monte Carlo simulation method, the random concentration data following certain distributions with the corresponding mean and standard deviation of five heavy metals were generated. In this study, 10,000 random concentration data for each heavy metal were generated, and then, Equation (2) is used to calculate the intake rate for the five heavy metals, respectively.
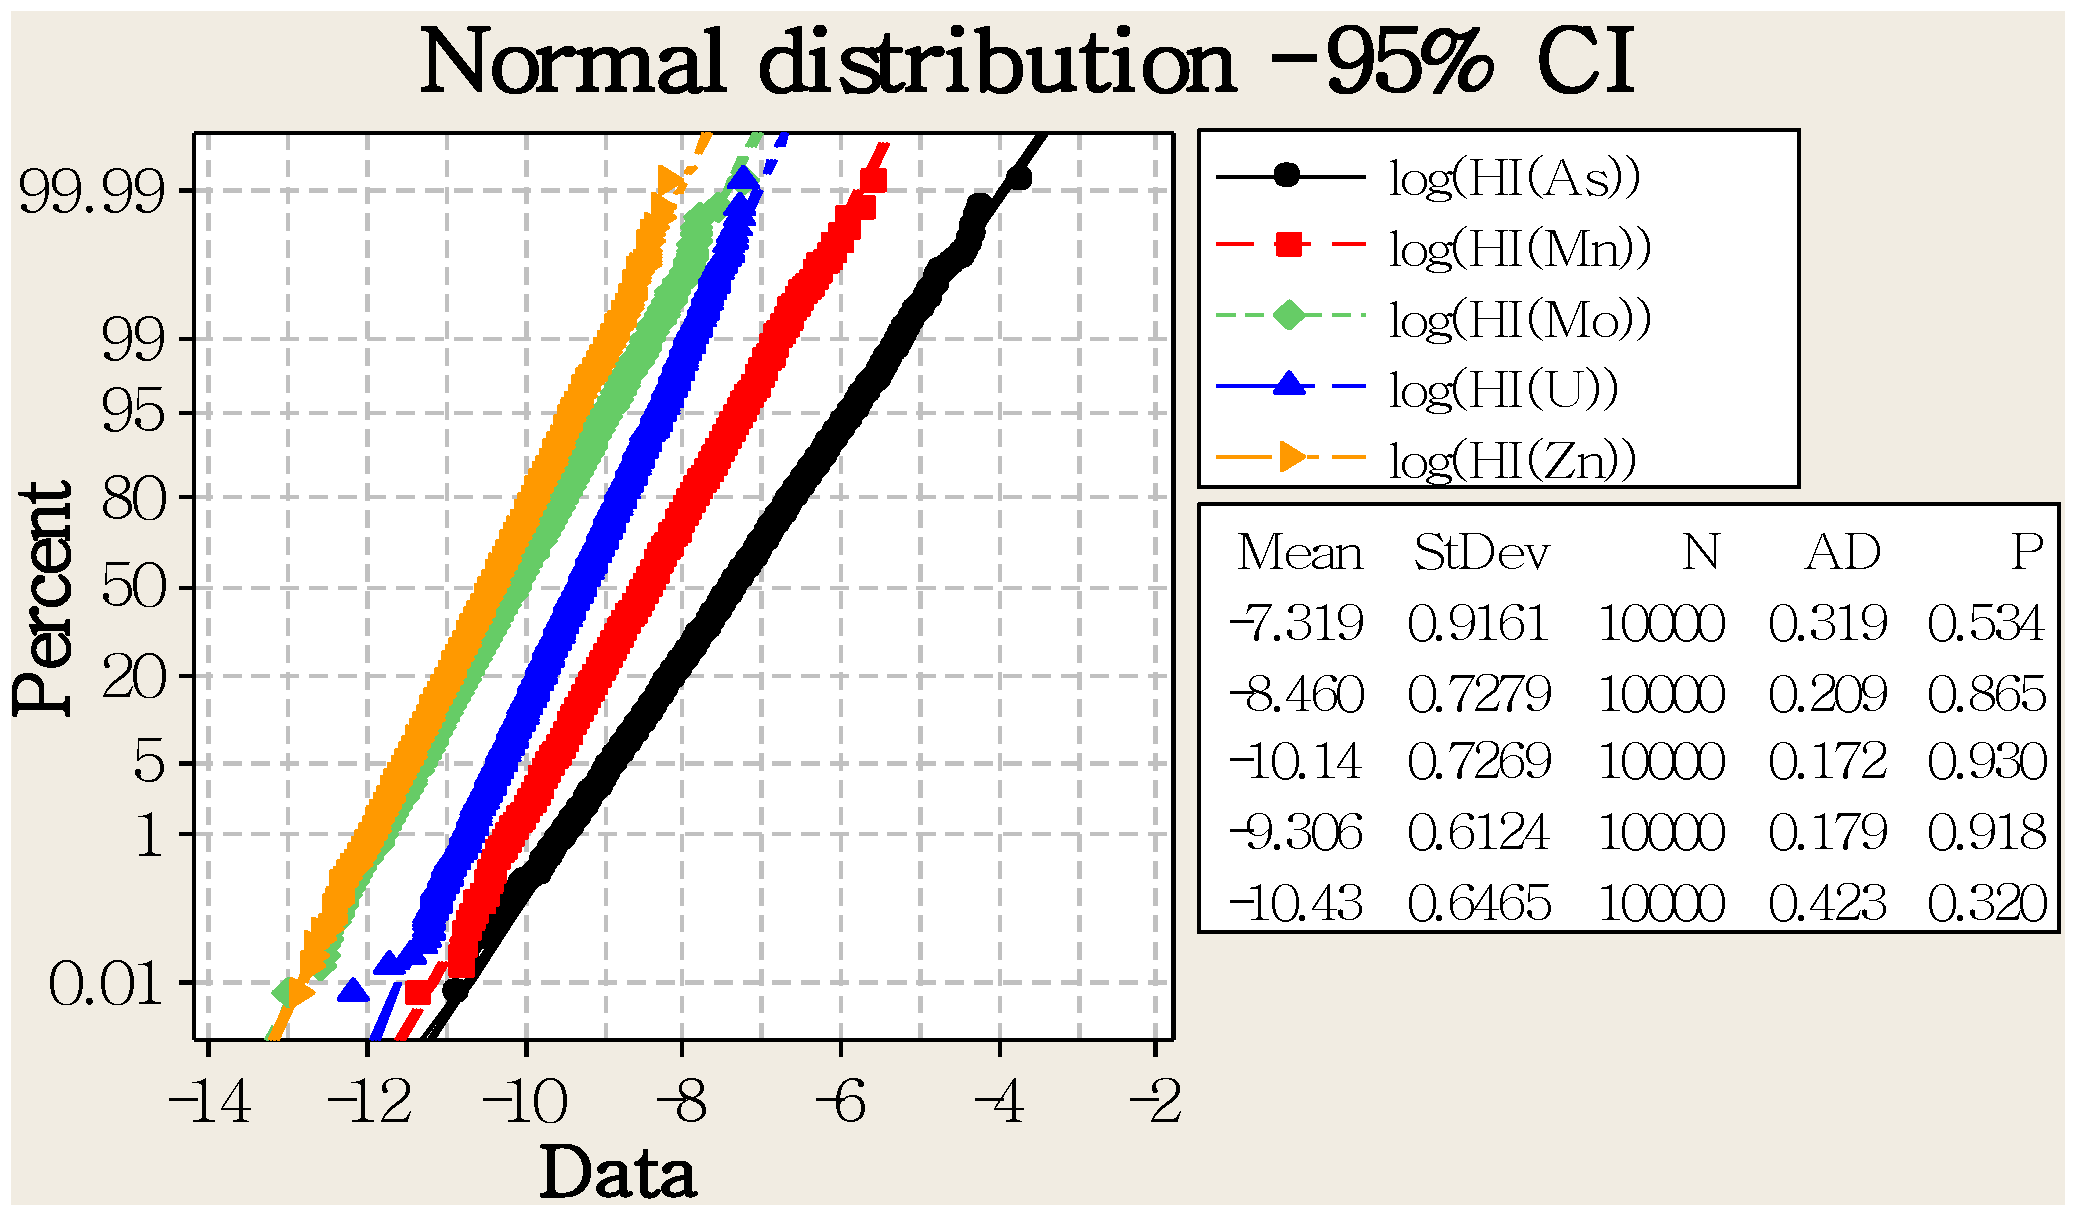
Figure 5.
Probability plot of log(hazard index (HI)) for five heavy metals and the corresponding parameters.
Figure 5.
Probability plot of log(hazard index (HI)) for five heavy metals and the corresponding parameters.
5. Results and Analysis
The results of HI for each heavy metal were obtained by using all of the collected data. To compute the risk level, a lognormal transformation was conducted. Because all the HIs can be assumed following a lognormal distribution and the results showed that they all passed the probability test, the logarithms of HIs should be able to pass the normality test of the normal distribution, as well.
Figure 5 shows the probability test plot of log(HI) for each heavy metal, and it demonstrates that there is no evidence to reject that all the log(HI)s follow a normal distribution, since the
p-values of each test are greater than 0.05.
By standardizing the normal distributions, the probability of HI greater than one can be calculated:
According to the table of the cumulative distribution function of a standard normal random variable [
16], the probability of log(HI) exceeding 3.59 is already less than 0.0002. In the results above, the smallest standardized log(HI
As) (7.989) among five heavy metals is greater than 3.59. Therefore, all of the probabilities of HI exceeding one for the five heavy metals are definitely less than 0.0001. It can be concluded that the concentration level of the five heavy metals in Site 4 is quite safe for dermal contact exposure for children. The total hazard index (THI) Equation (10) is shown as follows [
28]:
where,
Because the dermal contact exposure with contaminated water is the only pathway concerned in this case, Equation (10) can be transformed as:
Through individual distribution identification, the THI was identified as a normal distribution after Box-Cox transformation with lambda = −0.29.
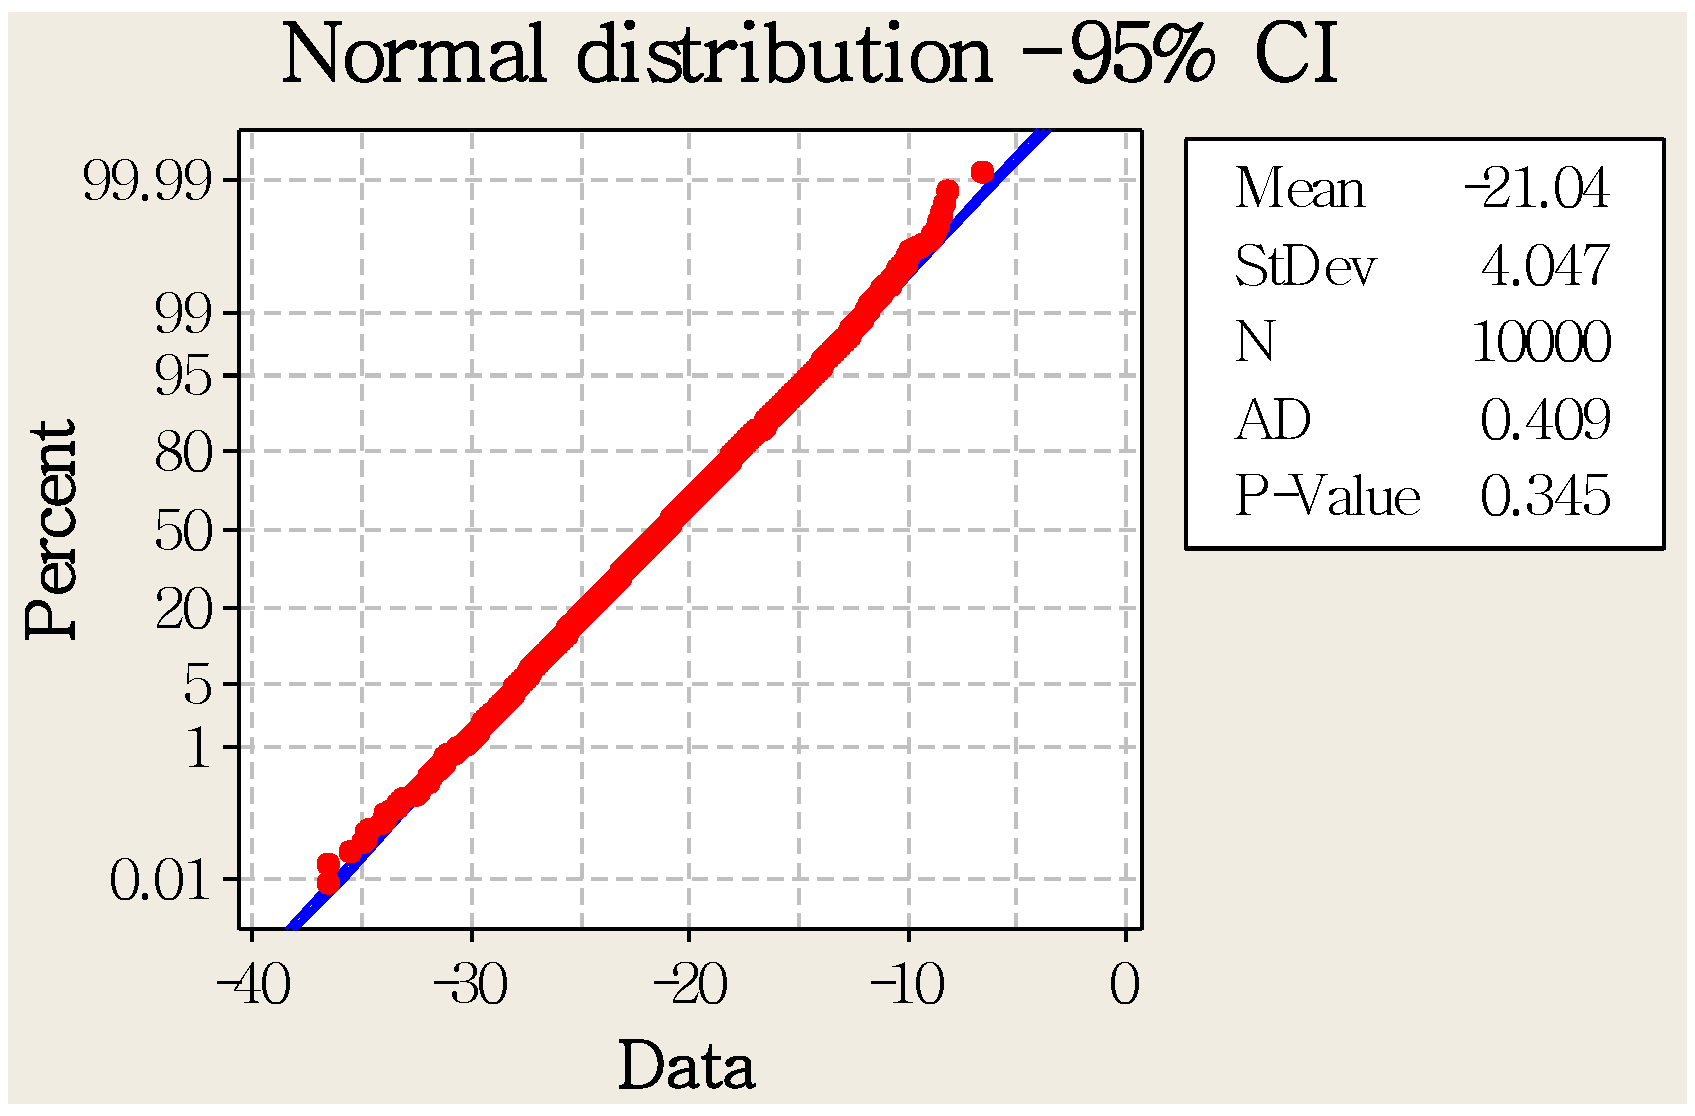
Making use of the Box-Cox transformation equation, the THI data can be transformed to normally distributed data. Through the probability test plot,
Figure 6, since the
p-value is greater than 0.05, there is no evidence to reject that the transformed data follows the normal distribution with a mean of −21.04 and a standard deviation of 4.047. The probability of THI exceeding one was used to calculate by using Equation (11):
Figure 6.
Probability test plot for the Box-Cox transformed total hazard index (THI).
Figure 6.
Probability test plot for the Box-Cox transformed total hazard index (THI).
From the results, it is easy to conclude that the probability of the THI of dermal contact exposure exceeding one is much less than 0.0001, as well, which means there is no evidence of risk for dermal contact exposure for children with contaminated water in Site 4 of the Kelligrews River if just these five heavy metals are considered.
6. Conclusions
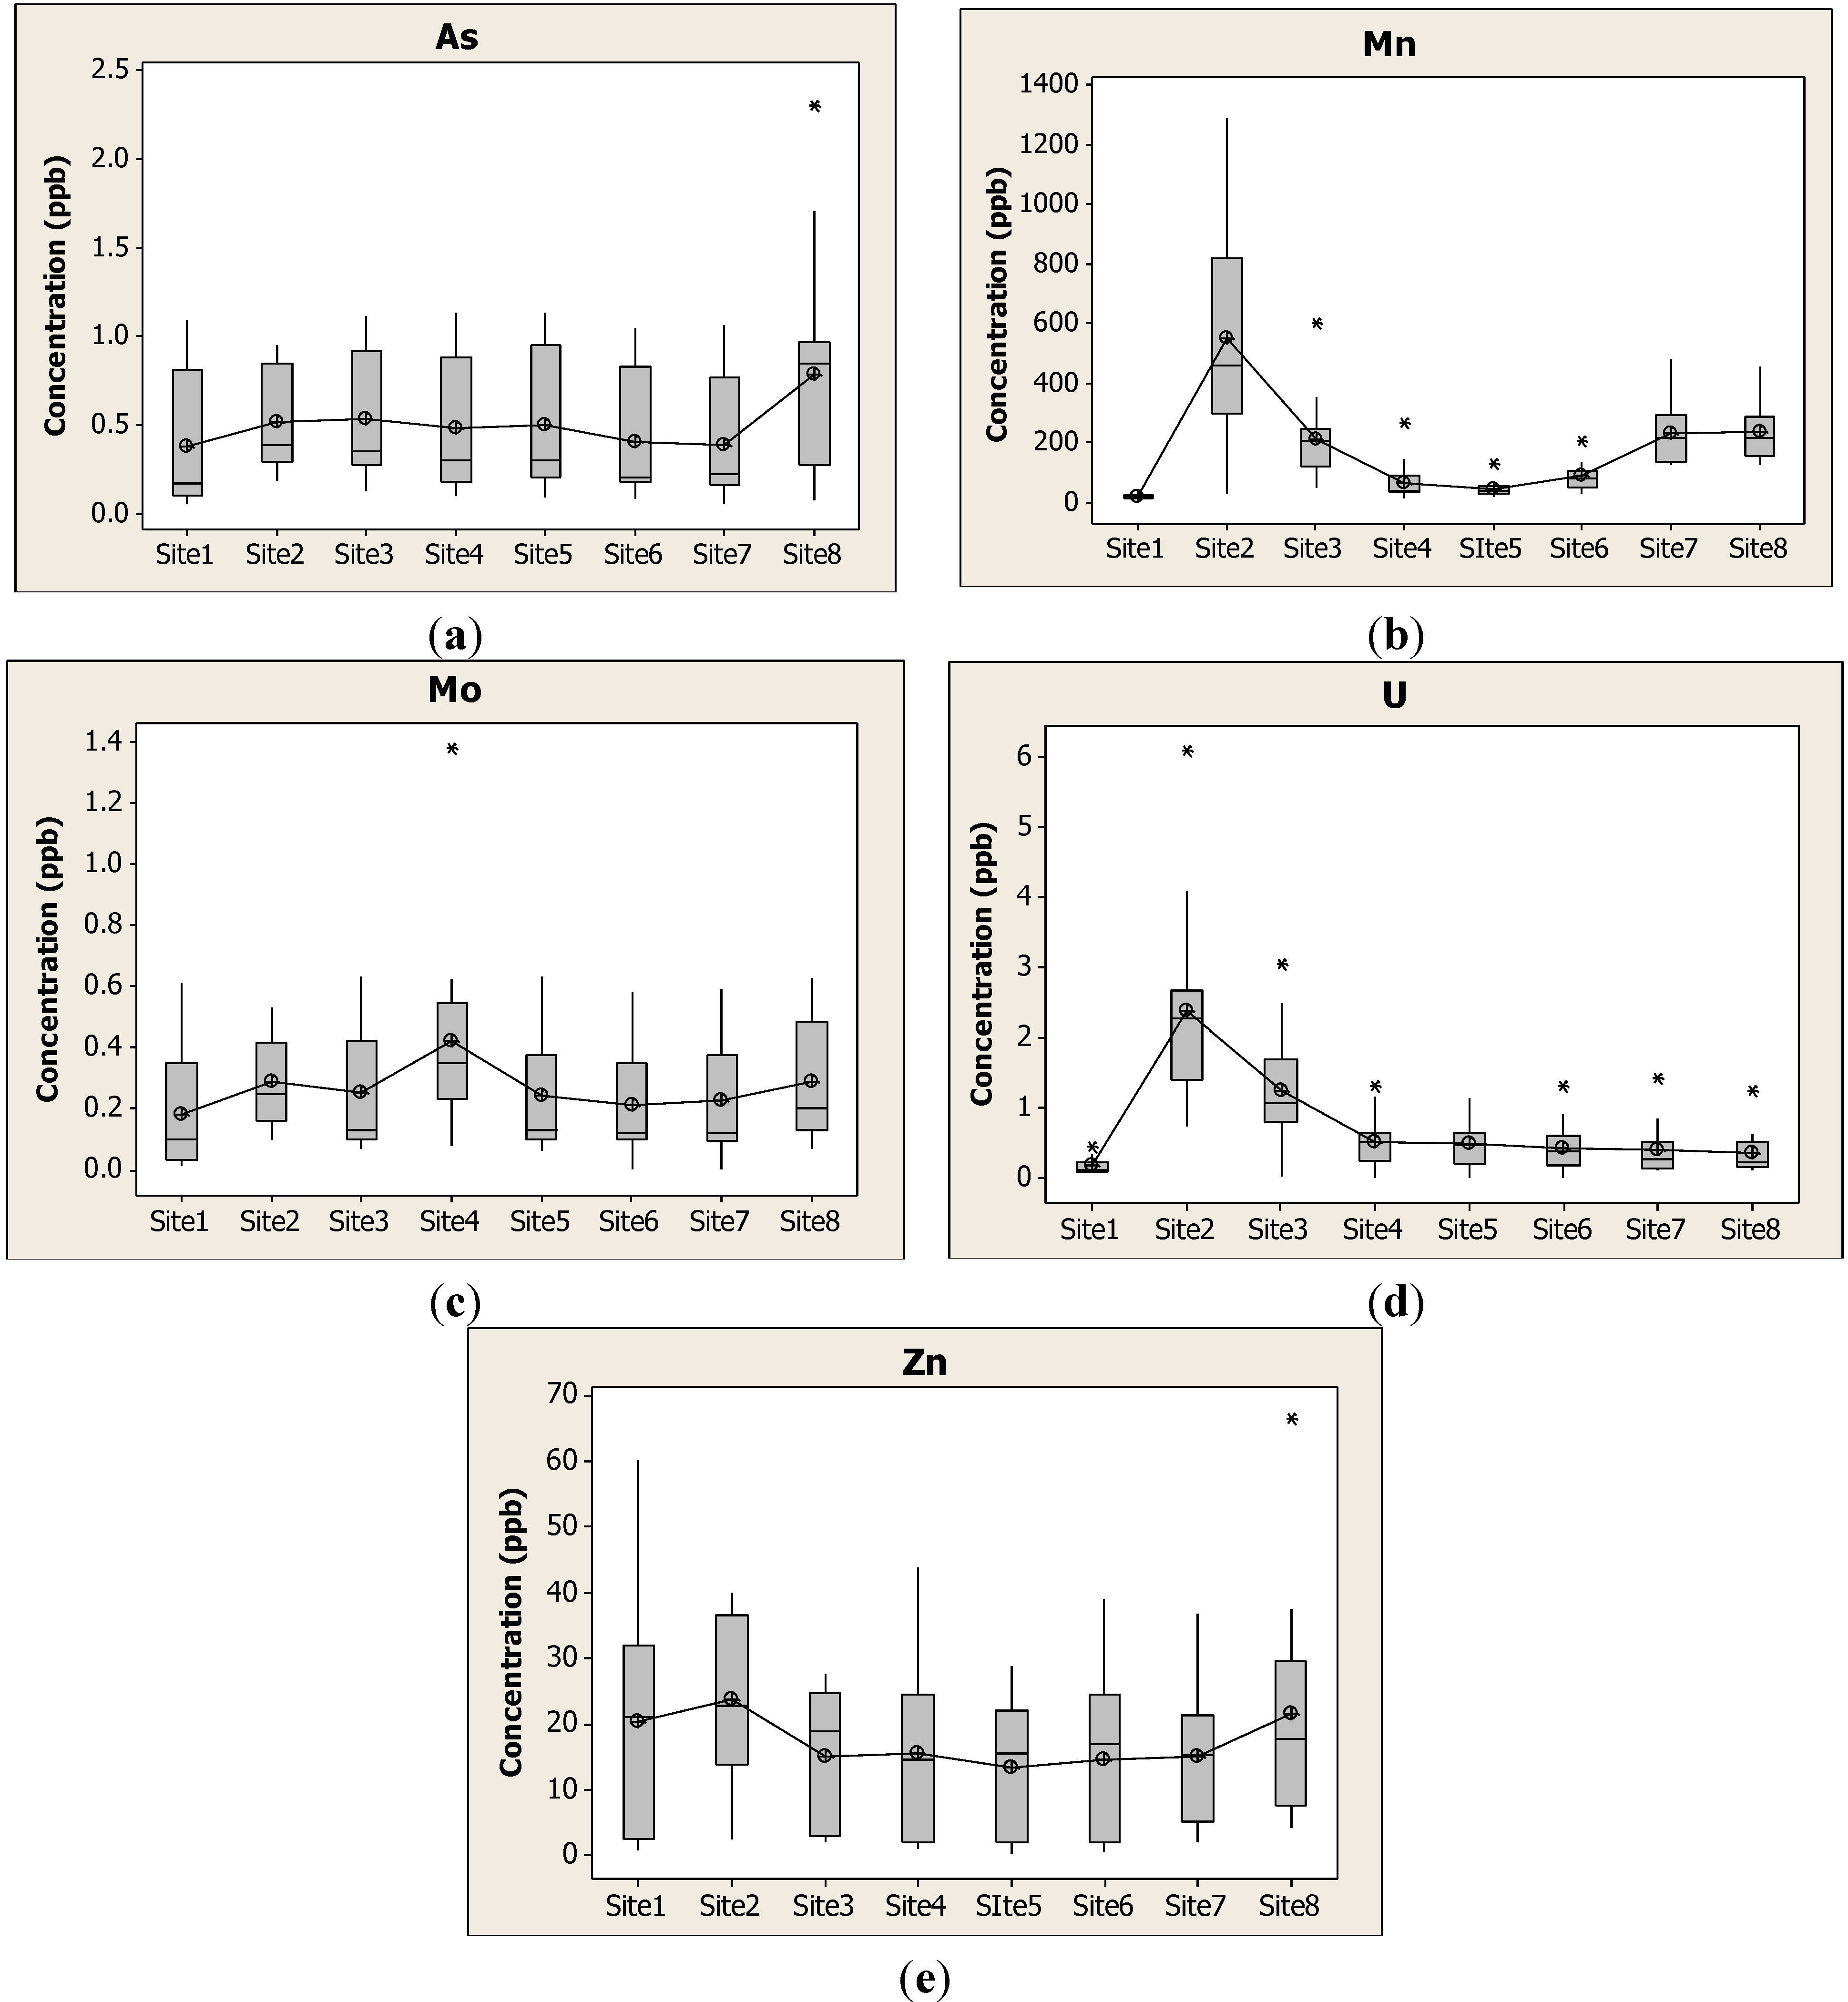
In this study, by using statistical and probabilistic methods, the non-cancer health risk assessment of dermal contact exposure with the consideration of uncertainties has been conducted. Five heavy metals, including As, Mn, Mo, U and Zn, were selected to evaluate the risk level. Through the site comparison, Site 2 was identified as having the highest concentrations of Mn and U, and there is no significant difference for concentrations between the eight sites for the other three heavy metals. Therefore, the concentration data in Site 4 are still able to stand for the risk level for As, Mo and U among the eight sites. Since there are some recreation activities for children at Site 4, only Site 4 was selected to evaluate the risk levels in this study.
A robust statistical method was novelly introduced in this study to estimate the censored data (for As, U and Zn) for risk assessment purposes. All the treated concentration data of three metals along with the original concentrations of Mn and Mo were identified as a lognormal distribution through the probability test plots. By using estimated parameters from probability tests, the random values from estimated distributions were generated through Monte Carlo simulation. Based on some basic assumptions, several parameters were estimated as fixed values in Equation (1), and the rest of the parameters were represented by probability distributions for the risk calculation. The results showed that the probability of THI exceeding one is much lower than 0.0001, indicating that there is no obvious evidence of risk for children playing at Site 4 of the Kelligrews River regarding these five contaminants. However, some concerns have been raised on certain river sections and levels of water contaminants in the river, indicating the need for continuous monitoring and further investigation.
The proposed method was highly capable of handling imperfect data (including the data below the detection limits and the limited number of input data) during risk assessment and also can be used to calculate the risk levels by considering the uncertainty and variability of HRA models. The method can be potentially applied to other risk assessment models to provide a more quantitative expression of the confidence in risk estimates and leads to a more reliable risk assessment.
The limited sample size and subjective assumptions caused some uncertainties in the final results. In addition, other pathways, such as the ingestion pathway, can also be considered for risk assessment when corresponding information is available. Further study can focus on collecting more accurate data from the study area to reduce the uncertainties and evaluating the risk levels from multiple pathways.


