Review

Evaluation of Glycol Ether as an Alternative to Perchloroethylene in Dry Cleaning

1
School of Sustainability Engineering and the Built Environment, Arizona State University, ISTB4 781 E. Terrace Road, Tempe, AZ 85287, USA
2
Center for Environmental Security, The Biodesign Institute, Security and Defense Systems Initiative, Arizona State University, 781 E. Terrace Road, Tempe, AZ 85287-5904, USA
*
Author to whom correspondence should be addressed.
Toxics 2014, 2(2), 115-133; https://doi.org/10.3390/toxics2020115
Submission received: 3 January 2014 / Revised: 25 February 2014 / Accepted: 18 March 2014 / Published: 3 April 2014
(This article belongs to the Special Issue Risk Assessment of Environmental Contaminants)

Abstract

:
Perchloroethylene (PCE) is a highly utilized solvent in the dry cleaning industry because of its cleaning effectiveness and relatively low cost to consumers. According to the 2006 U.S. Census, approximately 28,000 dry cleaning operations used PCE as their principal cleaning agent. Widespread use of PCE is problematic because of its adverse impacts on human health and environmental quality. As PCE use is curtailed, effective alternatives must be analyzed for their toxicity and impacts to human health and the environment. Potential alternatives to PCE in dry cleaning include dipropylene glycol n-butyl ether (DPnB) and dipropylene glycol tert-butyl ether (DPtB), both promising to pose a relatively smaller risk. To evaluate these two alternatives to PCE, we established and scored performance criteria, including chemical toxicity, employee and customer exposure levels, impacts on the general population, costs of each system, and cleaning efficacy. The scores received for PCE were 5, 5, 3, 5, 3, and 3, respectively, and DPnB and DPtB scored 3, 1, 2, 2, 4, and 4, respectively. An aggregate sum of the performance criteria yielded a favorably low score of “16” for both DPnB and DPtB compared to “24” for PCE. We conclude that DPnB and DPtB are preferable dry cleaning agents, exhibiting reduced human toxicity and a lesser adverse impact on human health and the environment compared to PCE, with comparable capital investments, and moderately higher annual operating costs.

Graphical Abstract

1. Introduction

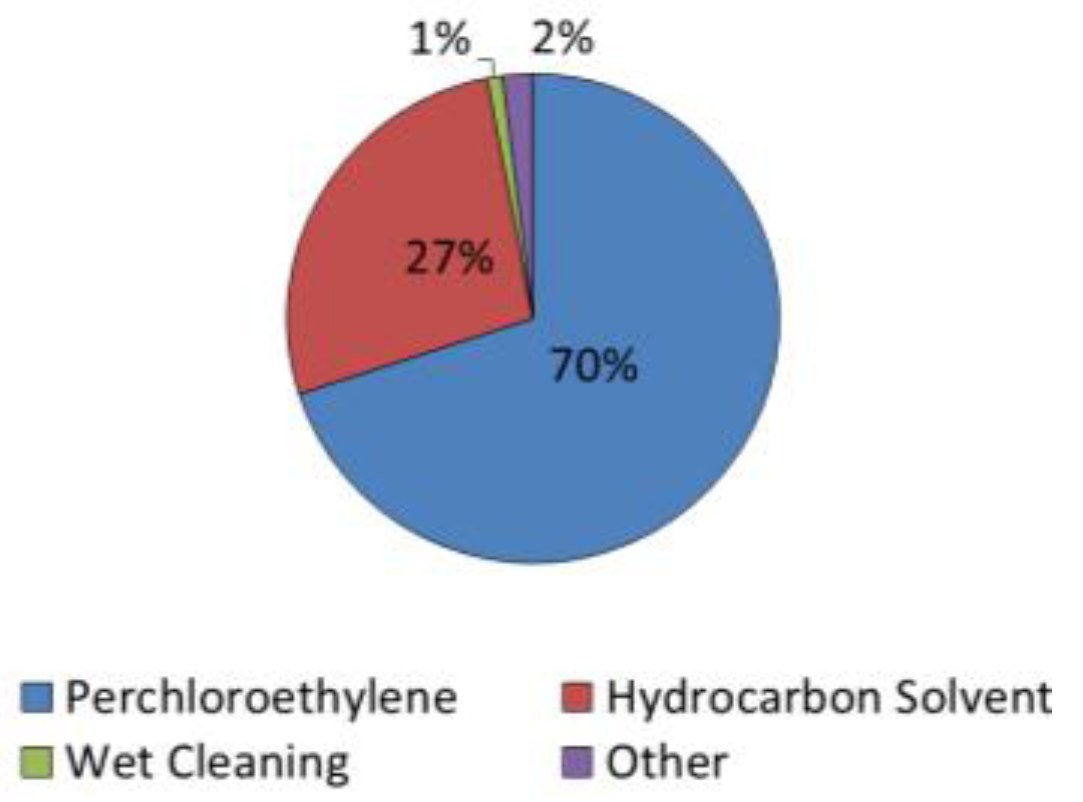
Due to the excellent solvent characteristics, degreasing properties and a non-flammable behavior, perchloroethylene (PCE) is widely used by the dry cleaning industry in the United States and Europe, with approximately 70% of dry cleaners using PCE as their primary solvent [1,2]. Studies have shown, however, that PCE is associated with various adverse human health effects, such as a stressed central nervous system and cancer of the liver, kidneys, and other organs [3,4,5]. These studies have prompted the United States Environmental Protection Agency (EPA) to reclassify PCE as a likely human carcinogen [6]. The chemical also is a known priority contaminant of air, soil, and groundwater. Increased regulation of PCE has been called for, including the EPA’s ban on installing PCE-utilizing dry cleaning machines in residential buildings in 2006, and banning all existing PCE dry cleaning machines in residential buildings by the year 2020 [3]. PCE is ranked 85 out of 129 regulated priority pollutants for which analytical methods have been developed [4]. Use of PCE also has been curtailed by the National Emission Standards for Hazardous Air Pollutants (NESHAP) passed in 1990, which significantly expanded the EPA’s authority on the regulation of toxic air pollutants.
The best means of control for PCE may be a continued decrease and ultimately the replacement of the solvent with more sustainable chemical alternatives. Characteristics of a suitable replacement for PCE in dry cleaning will include: limited environmental and human health impacts, relatively low capital and operational costs, as well as adequate cleaning efficacy. A range of alternatives exist, including super critical liquid carbon dioxide (CO2), hydrocarbon solvents, n-propyl bromide, and last but not least, various glycol ethers (GEs). Although CO2 is a greenhouse gas, use of supercritical CO2 does not add to the burden of greenhouse gas emissions in the atmosphere as the process relies on existing gas [7]. Super critical liquid CO2 is not widely used, however, because it currently is considered to be cost prohibitive [8]. Use of hydrocarbons as PCE alternatives are controversial, as these solvents can contribute to the formation of low-level ozone (O3), as well as adverse human health effects [7]. n-propyl bromide, another alternative, previously was determined to be cost-prohibitive and may cause adverse reproductive effects [9,10].
Among the PCE alternatives identified in the literature, GEs appear to be particularly attractive, and among these specifically dipropylene glycol n-butyl ether (DPnB) and dipropylene glycol tertiary-butyl ether (DPtB). Unfortunately, not all GEs are safe and some are known to be carcinogenic. For example, propylene glycol tertiary-butyl ether has toxicity and carcinogenic potential [10], and contributes to tumor growth in mice [11]; similarly, short chain ethylene GEs [12] can adversely affect testicular and ovarian functions [13,14]. In contrast, both DPnB and DPtB have been found to likely not pose adverse environmental effects [15], and the United Nations Environment Program (UNEP) publication of the Organization for Economic Co-operation and Development (OECD) Screening Information Data Sets (SIDS) considers DPnB within a category of chemicals that does not warrant further work, as known effects of the compounds are non-adverse, reversible, or transient in nature [16].
DPnB and DPtB both are relatively benign compounds not considered to act as carcinogens [15,16]. In contrast, PCE is known to have numerous adverse effects on humans, including: adverse effects on the neurobiological system, liver, and kidneys in acute and chronic exposure [5]; adverse reproductive effects in chronic exposure [17]; PCE also is classified as a likely human carcinogen [6]. The most common effects attributable to chronic PCE exposure in humans are neurological and sensory effects such as headaches and impaired color vision. Other adverse outcomes from PCE exposure include liver damage, cardiac arrhythmia, and possible kidney effects [5].
The purpose of this paper was to provide a systematic comparison of DPnB and DPtB to PCE using specific criteria capturing potential adverse impacts on human health and the environment from usage of these substances as dry cleaning solvents.

2. Methodology

For our study, DPnB and DPtB were assumed to be interchangeable with respect to all characteristics discussed in this study, as they are both dipropylene glycol butyl ethers of very similar structure; therefore, all data for dipropylene glycol butyl ethers are a compilation of DPnB and DPtB, unless explicitly stated otherwise. This is in concordance with other literature, which has also used the two GEs interchangeably [15]. Our review queried the United States National Library of Medicine’s Toxicology Data Network (Toxnet) and Web of Knowledge. Search terms included: perchloroethylene, tetrachloroethylene, dipropylene glycol tert-butyl ether, dipropylene glycol n-butyl ether, regulation, toxicity, and dry cleaning.
Several criteria were chosen for this study to summarize human-health and environmental impacts of their respective solvent. The criteria selected for comparison were: costs to an operator, chemical toxicity, employee exposure, customer airborne exposure, impacts to the general population (including water contamination impacts), and cleaning effectiveness.
Once the chemicals were analyzed for each criterion, scores were assigned to quantitatively assess disparities between the GEs (DPnB and DPtB) and PCE. The chemicals were scored using a rating system of “1” to “5”, with “1” being reflective of the most desirable characteristics with respect to adverse risk, cost, and acceptability of the cleaning solvent. Conversely, a high score of “5” in each category reflected the least desirable outcome. The scores in the various categories were weighted evenly for two primary reasons. First, to provide comparable importance to each criterion considered. Second, to acknowledge conclusions of the industry literature that shifting the usage pattern of chemical solvents is driven by both consumer demand and regulatory considerations [18]; thus a consumer may place equal weight on environmental risk as well as cleaning effectiveness. The following section explains the scoring methodology used for each criterion considered.
For chemical toxicity, a score of “5” would be assigned for a carcinogen, a “4” for possible carcinogenicity, a “3” for potential to bioaccumulate, a “2” for mild effects from exposure, and a “1” for no apparent toxicity. Comparisons for employee exposure rates are based on occupational exposure, relative to regulation. Multiple exposure possibilities over the permissible exposure levels (PEL) were assigned a “5”. Single exposure possibilities in excess of the 8-hour time-weighted average PEL were scored a “4”; a score of “3” was assigned for exposure limited to ranges within a given PEL; unregulated exposure because of a lack of regulatory data was assigned a “2”; and unregulated exposure with a chemical considered safe was assigned a “1”. For customer exposure levels, if garment off-gassing causes an exposure within 50% of employee PEL limits, a score of “5” was assigned. If exposure from garments between 25% and 50% of PEL limits, a score of “4” was assigned. Exposure less than 25% of a given PEL limit was assigned a score of “3”. If exposure is expected but no PEL is given, a “2” was assigned. If no exposure is expected, a “1” was assigned.
A comparison of solvents for the impact to the general public is based on exposure routes, and whether exposure exceeds regulatory levels. A “5” was assigned to exposure expected through multiple routes and exposure exceeding regulatory limits. A “4” was assigned for exposure through multiple routes, with one route exceeding regulatory limits. A “3” was assigned for multiple exposure routes, within regulatory limits. A “2” was assigned for a single exposure route; and a score of “1” was assigned for no expected exposure. Scoring for cost analysis was based on financial advantage over PCE usage: 50% or more expensive received a “5”, 20% to 50% more expensive a “4”, within 5% (+/−) a “3”, 20% to 50% savings a “2”, and greater than 50% savings earned a score of “1”, Scoring for cleaning was based on PCE as a baseline. Considerably worse performance was assigned a score of “5”, considerably better performance earned a score of “1”. For convenience, the above categorical scores were summed up to compute a composite total score; alternative, non-even weighting approaches were not considered in this study but the data are presented in a fashion enabling such secondary computations.

3. Results and Discussion

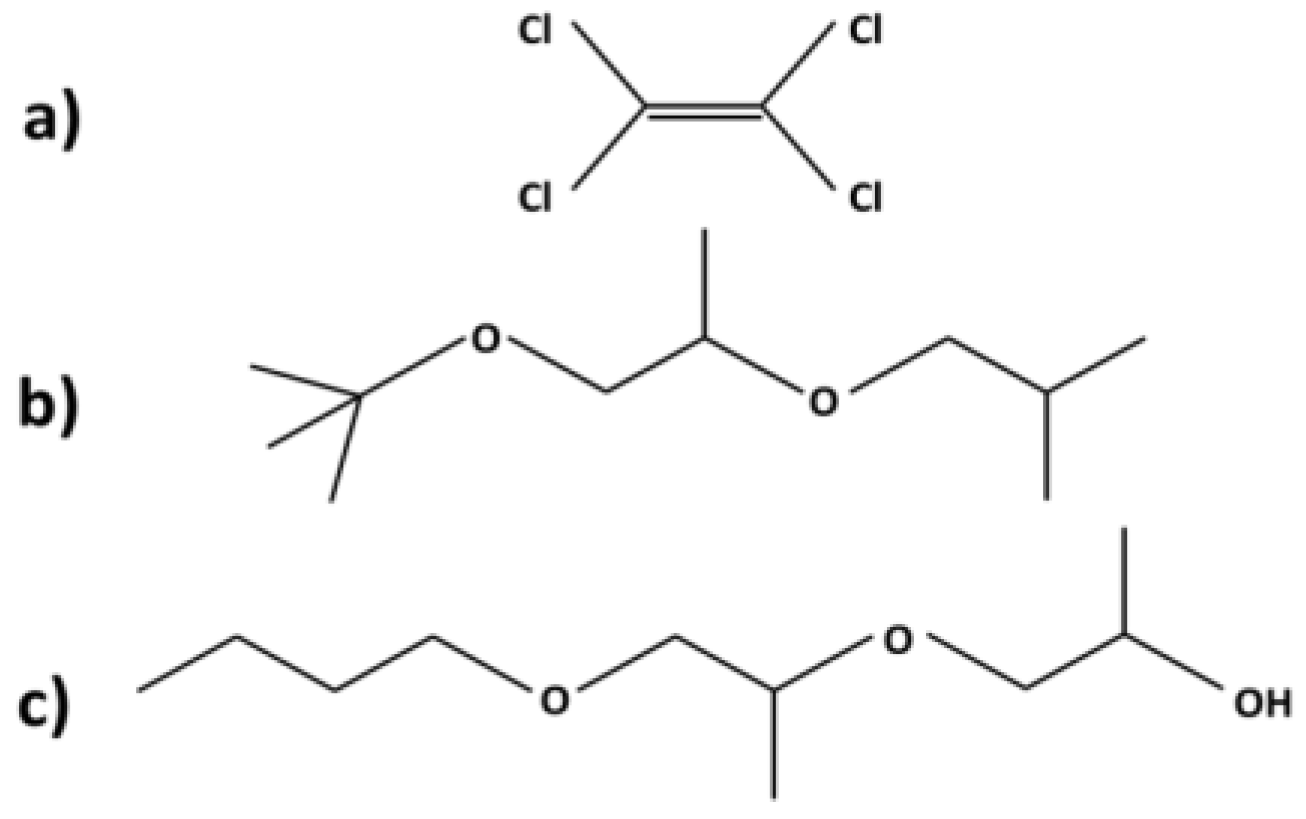
An extensive literature review revealed that the use of GEs and other non-PCE chemicals for dry cleaning purposes is still very limited compared to PCE as of data from 2010 (see Figure 1; data taken from [1]). In the present work, we concentrated our attention on DPnB and DPtB (Figure 2; computed from data in reference [10,19,20]), as these compounds are among the most promising alternatives within their class.
Figure 1. Relative chemical usage by dry cleaners in the United States.
Toxics 02 00115 g001
One class of alternatives that is generally considered non-toxic and relatively cost effective in replacing PCE in dry cleaning is GEs, or more specifically, DPnB and DPtB. Figure 2 shows the structure of PCE and both GE compounds.
Figure 2. Three chemicals under consideration in this study: (a) perchloroethylene (PCE) [19]; (b) dipropylene glycol tertiary-butyl ether (DPtB) [10]; and (c) dipropylene glycol n-butyl ether (DPnB) [20].
Toxics 02 00115 g002

3.1. Chemical Toxicity

The Agency for Toxic Substance and Disease Registry (ATSDR) has determined a chronic-duration minimum risk level (MRL) for PCE as low as 0.04 parts per million or ppm [21]. Any exposure above this value is considered to pose an increased risk. One common value for quantifying toxicity is the LD50, which is the dose at which 50% of the population dies from exposure; for this report only LD50 values for oral administration to rats were included for consistency. The average LD50 found for PCE is 10,150 ± 8277 milligram per kilogram (mg/kg) with a range of 2600 to 19,000 mg/kg [1,19,22]. The EPA recently reclassified PCE as a likely human carcinogen [6].
There is no MRL for DPnB or DPtB from the ATSDR. The average LD50 found for GEs is 3122 ± 1334 mg/kg with a range of 1850 to 5000 mg/kg [16,23,24]. Even at high exposure rates for both DPnB and DPtB, few adverse effects have been detected; and among those that have been detected, the effects were generally mild. Both chemicals are slightly irritating to the eyes, while exposures at elevated concentrations can cause depression of the central nervous system, resulting in headaches, weakness, slurred speech, tremors and blurred vision. At extreme concentrations, vapors may create erythema, edema, weeping, hyperpigmentation, photosensitization, and mucosal irritation [19]. The OECD SIDS considers DPnB a chemical that does not warrant further work as it is related to non-adverse, reversible, transient effects [16]. As such, because the effects of DPnB and DPtB are considered mild, a “2” was assigned. Because it is a likely human carcinogen, PCE was assigned a score of “5”.

3.2. Employee Exposure Levels

Due to its ubiquitous utilization throughout the traditional dry cleaning processes, PCE exposure is common among dry cleaning employees, customers, and in certain situations the local population as well. The U.S. Department of Labor’s Occupational Safety & Health Administration (OSHA) has set occupational exposure regulations for dry cleaning establishments, relative to PCE. OSHA’s 8-hour time-weighted average PEL is 100 ppm. The PEL for a five-minute period within three-hours is 200 ppm, with a maximum peak concentration exposure of 300 ppm at any point within that timeframe [25]. The OSHA PEL is based on neurotoxic effects; the current National Institute for Occupational Safety and Health (NIOSH) recommended exposure limit is “the lowest feasible level”, wherein these values were based on then-undetermined carcinogenicity [26].
Studies have shown that workers occupationally exposed to PCE are susceptible to several adverse reproductive effects, which include: menstrual disorders, altered sperm counts, and reduced fertility [17], and that workers have increased rates of a variety of cancers, including esophagus, bladder, kidney, lung, pancreas, and cervical cancer [4]. These studies are complicated by exposure to other chemicals and/or lifestyle factors (e.g., smoking, diet, etc.) that can be difficult to account for and quantify in epidemiological studies.
Generally, PCE studies have largely focused on the concentration of PCE in the air present where the measurements were taken, as inhalation is considered the primary route of concern with regard to human exposure [27]. Occupational exposure pathways related to dry cleaning with PCE included de-soiling, machine operators, customer service, and maintenance staff which are presented in Table 1. Reported concentrations of PCE ranged from 0.01 to 1139 ppm in air, with an average of 181 ± 294 ppm at dry cleaning establishments with a variety of operations including; dry-to-dry PCE machines, manual transfer machines, local exhaust ventilation, and non-ventilated systems [27,28,29].
Table 1. PCE dry cleaning exposure pathways and concentrations.
Exposure pathwayExposure level (ppm)8-h TWA (ppm)
De-soiling a0.0139N/AN/A
Transfer-based machine operated a13153N/AN/A
Dry-to-Dry machine operated b,c0.3834.15
Pressing a,b0.16.50.51.1
Customer Service a,b015N/A0.1
Maintenance aN/A334N/AN/A
a Gold et al. [28]; b Raisanen et al. [30], c McKernan et al. [31].
In contrast to PCE, dipropylene glycol butyl ethers are relatively unregulated in occupational settings. The California Department of Public Health’s Hazard Evaluation System and Information System (HESIS) factsheet for GEs [29,32] states that “all propylene glycol ethers are currently believed to be relatively safe,” whereas “most ethylene glycol ethers with ‘methyl’ in their names are relatively toxic” [33].
Similarly, OECD has found that exposure generally occurs when applying the chemical to surfaces, presumably indirect exposure risk may occur through inhalation of air containing DPnB released from products that have undergone or are the result of industrial processing. The off-gas from dry-cleaned garments was similarly categorized. OECD did not establish exposure limits for DPnB or DPtB [16]. Given that inhalation is the primary exposure of concern for employees, it is important to consider the degradation of PCE and the GEs of interest in the atmosphere. PCE undergoes degradation in the atmosphere by reacting with photo-chemically produced hydroxyl (OH) radicals. Degradation of PCE proceeds with a half-life in air ranging from 40 to 70 days, with an average of 52.3 ± 12.8 days [34,35,36]. While GE is a volatile organic compound (VOC), it is not categorized as a hazardous air pollutant (HAP); therefore, it is not regulated by the Clean Air Act.
The photodegradation rate for DPnB results in an atmospheric degradation half-life of 2.6 h based on a 12-h day of sunlight (Atkinson estimation methodology based on OH radical reaction in the atmosphere) and a half-life in air was found to be 7.6 h (Mackay Level III assumes equal releases to all media) [16]. Based upon these rates, the GEs of interest will cause significantly reduced exposure levels, due to the occurrence of rapid photodegradation. As PCE does not readily degrade in the atmosphere, it represents a significant long-term exposure risk to employees.
PCE was assigned a “5” because it has multiple documented exposures above PEL exposure limits as the result of multiple processes, whereas DPnB and DPtB were assigned a score of “1” because California Department of Public Health, which has yet to assign an occupational exposure PEL, has stated that DPnB and DPtB are relatively safe [32].

3.3. Customer Exposure Levels

Customer exposure to PCE principally occurs through exposure to residual PCE present on the garments. Chromatographic studies have shown that the residual amount of PCE on clothes that undergo dry cleaning varies based on the type of fabric. Studies have shown that polyester, cotton, and wool retain PCE at high levels, ranging anywhere from 10 to 56 nano-moles per centimeter squared (nmol/cm2), with polyester showing the greatest retention levels. Silk, on the other hand, does not retain appreciable amount of PCE. PCE residual concentrations were also found to increase over time with multiple dry cleaning applications, with cotton (peak concentration after two cycles), polyester (four cycles) and wool (peak concentration still increasing after six cycles) all demonstrating higher residual PCE levels [37]. Table 2 summarizes the residual concentration left on cotton, polyester, silk, and wool.
Table 2. Residual concentrations of PCE on textiles.
Concentration (nmol/cm2)AverageStandard deviation
Cotton 17.05.96
Polyester45.511.7
SilkND-
Wool31.511.8
For DPnB and DPtB no inhalation exposure assessments for consumers could be found, with regard to dry cleaning exposure risks, as these exposure levels would likely be at or below the occupational levels. As noted, customer exposure to DPnB and DPtB can be reasonably expected, but few adverse effects have been detected; amongst exposures that may occur, the effects are expected to be generally mild.
PCE yielded a score of “3” because its documented residuals are less than 25% of the given PEL. Comparatively, DPnB and DPtB were assigned a score of “2”, because exposure is expected (but not documented) and no PEL is assigned; this score acknowledges some ambiguity toward these compounds, due to still incomplete datasets when compared to PCE for dry cleaning.

3.4. Impacts to General Population

Exposure to the public occurs due to the intentional or unintentional release of dry cleaning chemicals to the surrounding environment. This includes the improper disposal and handling of chemicals, improper maintenance of dry cleaning systems, disposal to municipal sanitation systems, and venting and volatilization to the surrounding atmosphere [37].
The EPA has set risk assessment guidelines for oral and inhalation exposures of PCE, wherein the reference dose for chronic oral exposure is 0.006 mg/kg-day, and the reference dose for chronic inhalation exposure is 0.04 milligrams per meter cubed (mg/m3) [38]. PCE mass discharged to municipal sewage systems will typically be removed by aeration processes at wastewater treatment facilities, resulting in atmospheric discharges in the immediate vicinity of the aeration basins [39]. The atmospheric release of PCE during the aeration process does not appear to be a significant exposure pathway to the population; however, pathway exposure risk is increased within the proximity of wastewater treatment plants [40].
When PCE is discharged to surface waters, volatilization will occur to the atmosphere, with the mass remaining in water slowly decreasing, due to PCE’s higher density and modest water solubility. PCE will also readily leach through soil stratigraphy and is known to reach underlying saturated zones, resulting in groundwater contamination [38]. Reported Henry’s Law constants for PCE range from 1.44 × 10⁻² to 1.80 × 10⁻² atmospheres time meter cubed per mole (atm-m3/mol), with an average of 1.68 × 10⁻² ± 2.07 × 10⁻³ atm-m3/mol [16,19,41]. By comparison, equivalent data for release of GEs are lacking. But based upon estimated Henry’s Law constants for GEs in the range of 5.7 × 10⁻⁹ to 2.7 × 10⁻⁶ atm-m3/mol (average of 9.95 × 10⁻⁷ ± 1.48 × 10⁻⁶ atm-m3/mol), a limited potential exists for partitioning to occur from water to air; also, fugacity modeling indicates that GEs will partition in the environment approximately equally into soil and water, with small to negligible amounts remaining in air, sediment, and aquatic biota [16,38].
One study examining contamination of well water drawn downstream of a dry cleaning plant where PCE was stored in an underground storage tank, yielded PCE concentration between 120 to 27,000 microgram per liter (µg/L) for sampling locations [42]. At the Long Prairie, Minnesota Superfund site, improper disposal and leakage of PCE by a dry cleaning establishment yielded maximum PCE concentrations of 280 µg/L in municipal well water, private well maximum concentrations of 1000 μg/L, and monitoring well maximum concentrations of 22,000 μg/L [43].
Due to concerns over PCE contamination in drinking water, the EPA has set a maximum contaminant level (MCL) in water of 5 μg/L [44]. By comparison, no MCL has been set currently for dipropylene butyl GEs. This likely is because of research findings indicating that the chemicals are unlikely to persist in the environment [16].
In 2002, a study reporting PCE concentrations measured in two New York City apartment buildings in which dry cleaning facilities were sited on the first floor found that mean PCE concentration throughout the building ranged from 650 µg/m3 to 6100 µg/m3 [45]. In 2005, another team measured concentrations of PCE in the indoor air of apartment buildings sited with dry cleaners in New York City, and found that in 12 of 24 apartment buildings assessed, PCE concentrations ranged from 194 µg/m3 to 5000 µg/m3 [46]. Residents collocated with a dry cleaner, therefore, can expect to see consistently high concentrations long-term. These would decrease only with improved handling and release practices or with cessation of operations.
No similar studies were found for populations collocated in buildings with DPnB or DPtB cleaners. In contrast to PCE, DPnB rapidly photodegrades with a half-life of 2.6 h [16], suggesting a quickly diminishing risk to non-customers when compared to PCE. Each VOC reacts at different rates and by different reaction mechanisms. For example, the initial reaction rates of VOCs with the OH radical vary by factors of 10,000, and the different molecular structures of VOCs imply that they possess different potentials for photochemical O3 formation. In addition, depending on the local and regional industries, land-use and biogenic sources, they are also emitted into the atmosphere at different mass emission rates. Therefore, the relative contribution of VOCs to the photochemical O3 formation varies from one compound to another [47,48] and from region to region [49,50,51]. A photochemical trajectory model (PTM), using the Master Chemical Mechanism (MCM), has been used to simulate formation of photochemical O3 and generation of secondary oxidant in Europe [5,52,53,54]. The photochemical O3 creation potential (POCP), was developed to determine the contribution of each VOC to the regional O3 formation in north-west Europe. The POCP for a particular VOC is determined by quantifying the effect of a small incremental increase in its emission on O3 formation along the standard 5-day trajectory, relative to that resulting from an identical increase in the emission (on a mass basis) of a reference VOC, which is taken to be ethene [55]. Table 3 summarizes POCP values determined for PCE and GE compounds acting as oxygenated VOCs [56,57,58].
Table 3. Dimensionless photochemical ozone creation potential (POCP) for PCE and Glycol Ether (GE) compounds expressed relative to the reference compound, ethene.
POCPPCE a,b,cGE a,b
Average0.937.2
Standard Deviation0.721.6
Min0.017.0
Max2.080.0
a Derwent et al. [56]; b Altenstedt et al. [57], c Koppmann [58].
The PCOP for PCE is shown to be one order of magnitude less than GE, this shows that the O3 creation is minimal for PCE when compared to GE. The O3 created by GE will be released into the lower atmosphere which leads to photochemical smog and harmful effects to the human health and the environment. Because of PCE’s known persistence in groundwater and in residences co-located with dry cleaners, PCE was assigned a score of “5”, whereas the degradable compounds which form O3, DPnB and DPtB, were assigned a score of “2”.

3.5. Costs

The operating costs assessment was developed by using a model developed for the USEPA in 2005 [59] and by contacting solvent manufacturing companies for updated cost figures [60,61,62]. According to Union Dry Cleaning Products, USA the capital costs for both PCE and GE machines would be approximately $1000 per pound machine and each installation would cost approximately $5000 because the hook-up procedure is the same for each machine [63]. The model for the operating costs was created by analyzing case studies with various technologies and facility sizes. It must be stated that PCE had many cases but GE had only one case study that utilized the Rynex product. The assumptions for the PCE model are listed below:
  • Processing 40,000 pounds of clothing per year and 27 loads per week (1380 loads per year);
  • 35-pound dry-to-dry closed-loop machine including secondary control;
  • 60 gallons of PCE per year at a cost of $10 per gallon;
  • 50 gallons of detergent per year at a cost of $25 per gallon;
  • Annual electricity costs were based on case studies and brought to current 2014 dollars using CPI conversion factor for electricity prices;
  • Annual gas costs were based on case studies and brought to current 2014 dollars using CPI conversion factor for utility gas prices;
  • Spotting labor was found based on case studies to be 2.46 h per week at $10 per h labor cost;
  • Finishing labor was found based on case studies to be 9.85 h per week at $10 per hour labor cost;
  • Maintenance labor of one hour per week was found based on case studies at $10 per hour cost;
  • Due to use of spin disk filters in case studies, the maintenance equipment cost was assumed to be zero;
  • Compliance labor estimates were based on case studies and suggested one hour per week at $10 per hour labor cost;
  • Case studies showed that two drums of hazardous waste were produced per year and a disposal cost of $275 per drum;
The assumptions for the GE model are listed below:
  • Processing of 40,000 pounds of clothing per year and 27 loads per week (1380 loads per year);
  • 35-pound machine used;
  • Annual solvent use was found from the case study and lower volatility than PCE to be 50 gallons per year at a cost of $33 per gallon from Caled and Rynex prices;
  • No detergent was used based on case study;
  • Annual electricity was normalized to 40,000 pounds of clothing cleaned per year;
  • Annual gas was normalized to 40,000 pounds of clothing cleaned per year;
  • Spotting labor was estimated based on a case study to be 1 h per week at $10 per hour labor cost;
  • Finishing labor was estimated based on a case study to be 9.85 h per week at $10 per hour labor cost;
  • Maintenance labor of 18 h per week was determined based on a case study with $10-per-hour associated costs;
  • Maintenance equipment cost was assumed to be zero based on the case study;
  • Compliance labor was based on case studies and found to be one hour per week at $10 per hour labor cost;
  • The case study shows that two drums of hazardous waste were produced per year and a disposal cost of $275 per drum.
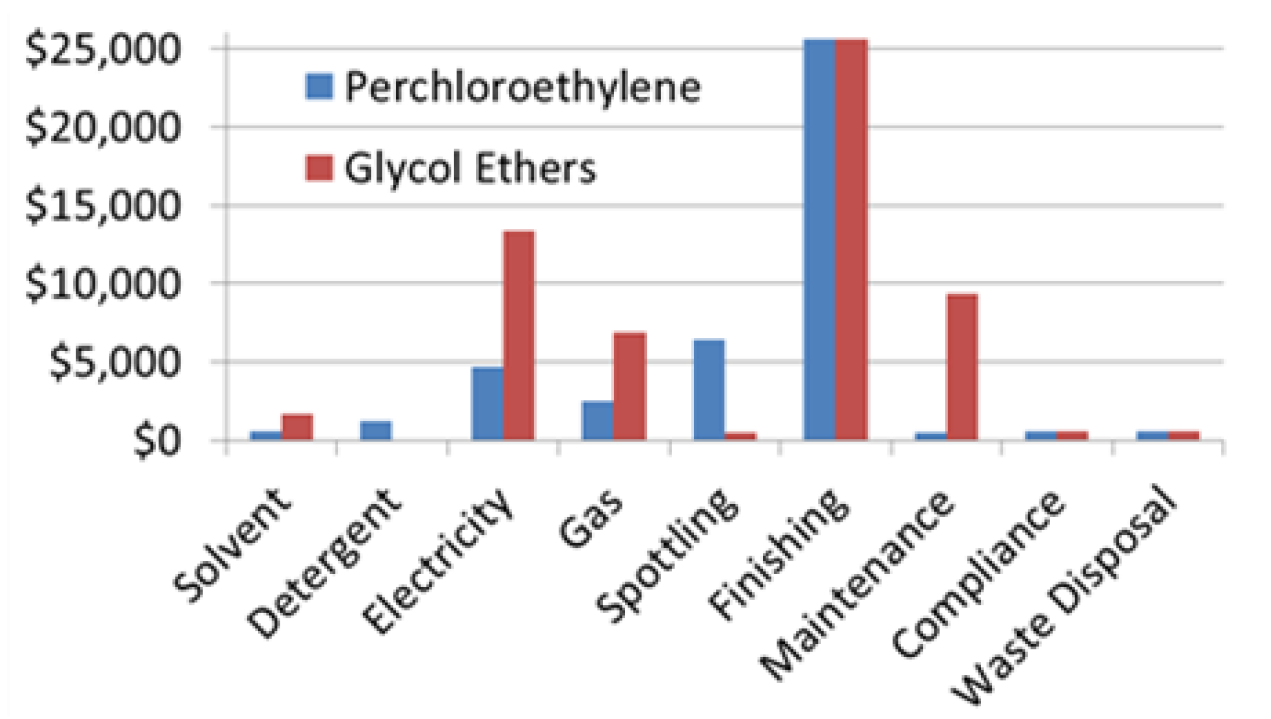
Total capital cost was $40,000 for both the PCE and GE systems, assuming 35-pound machines and installation. To update costs provided by the model, the CPI Index was used to adjust the PCE, detergent, gas, electricity, compliance, and waste disposal costs [64]. Figure 3 below provides an annual operating cost comparison for PCE and GEs use in dry cleaning facilities. The total annual operating cost for a PCE facility is $42,758 per year and a GE facility is $58,614 per year. The annual operating costs using GE is approximately 37% higher than operating a PCE facility. The assumptions above were used to find the cost of solvents, detergent, electricity to run the facility, gas to run the facility, spotting treatment labor, finishing treatment labor, compliance related activities, and waste disposal.
Figure 3. Cost comparison of annual operating costs using either PCE or GEs in dry cleaning operations.
Toxics 02 00115 g003
A side-by-side comparison suggests that GEs will always be more expensive than PCE, unless certain government eco-friendly incentives are realized, and costs are decreased by improved methods and favorable scales-of-economy in the manufacturing of GEs in dry cleaning. As such, DPtB and DPnB scored a “4” for associated costs, and PCE scored a “3”. This assessment did not consider the full life-cycle costs, which may be higher for PCE, due to the burden incurred by resultant health effects and significant costs associated with liabilities for environmental cleanup following spill events.

3.6. Cleaning Effectiveness

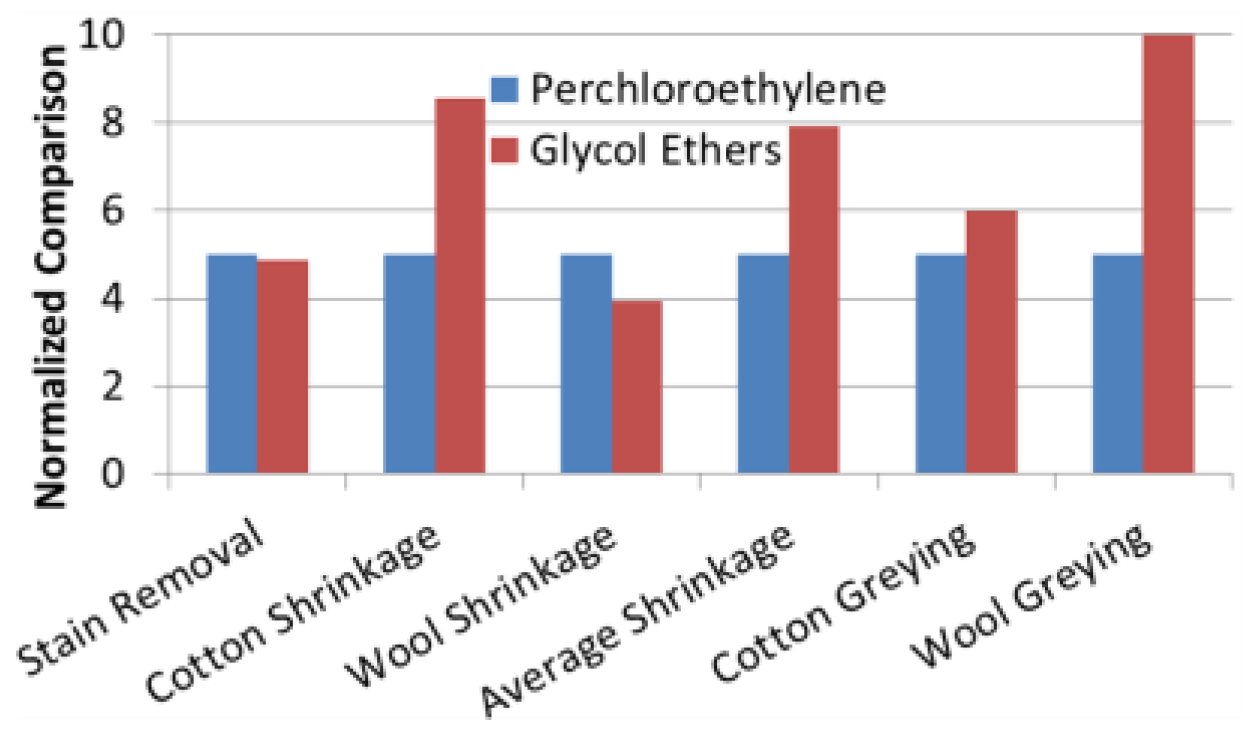
A study was completed by The International Committee of Professional Textile Care (CINET) evaluating the effectiveness of PCE alternatives in the dry cleaning industry. A textile mixture of nine items was bought new, the garments included a black men’s suit (composition: wool 88%, polyamide 8%, elastane 4%), a ladies skirt (composition: polyester 43%, wool 30%, viscose 6%, nylon 3%, polyacryl 18%), a tie (100% silk, PCE only), a sweater (100% wool), test cloths for shrinkage, and test cloths for graying. The garments and test materials were cleaned three times with each cleaning technology by medium-volume dry cleaners. The study was performed during typical working hours and using average-sized cleaning loads mixed with customer garment items. The GE solvent was tested on an older multi-solvent machine where the drying process was not optimized, which may cause a higher shrinkage when compared to PCE or an alternate, optimized drying process. The results for each cleaning performance parameter are presented in Figure 4. The model stain removal was calculated by the percent removal of the following stains: sebum (wool), red wine, tea, blood/milk/ink, blood, cacao/lanolin, olive oil/carbon, mineral oil/carbon, sebum (polyester/cotton), egg yolk, sebum, spinach (wool), grass, make-up, and lipstick. For the stain removal experiments, the garments were not treated for spotting before or after the wash cycle. The percent shrinkage of wool and cotton was found for the garments after three cleaning cycles without the finishing step. The average percent shrinkage of the garments was found after three cleaning cycles and the finishing step. The average greying of cotton and wool were measured after three cleaning cycles [1].
GEs showed encouraging results with respect to stain removal and avoidance of greying of the garments cleaned; yet, their level of greying induction was higher than that of PCE. GEs’ ability to remove stains is comparable to that of current PCE processes; however, increased shrinkage occurred with the GE solvent. Minimal pilling or roughening was seen on the test cloths for either of the solvents. The zippers on the garments were more difficult to operate after being cleaned with GEs [62]. Many of these findings have been duplicated by TURI, the Toxics Use Reduction Institute of the University of Massachusetts-Lowell [65]. A report for Cal EPA’s Department of Toxic Substances Control and EPA Region IX confirmed that GEs perform well in scaled-up spotting and tests [66].
Figure 4. Comparison of cleaning efficacy of GEs with PCE as a benchmark.
Toxics 02 00115 g004
Because GEs were found to perform generally similar and acceptable with higher cotton and average shrinkage and cotton and wool greying, DPnB and DPtB were assigned a score of “4”. PCE, as the baseline, received a score of “3”.

3.7. Overall Comparison

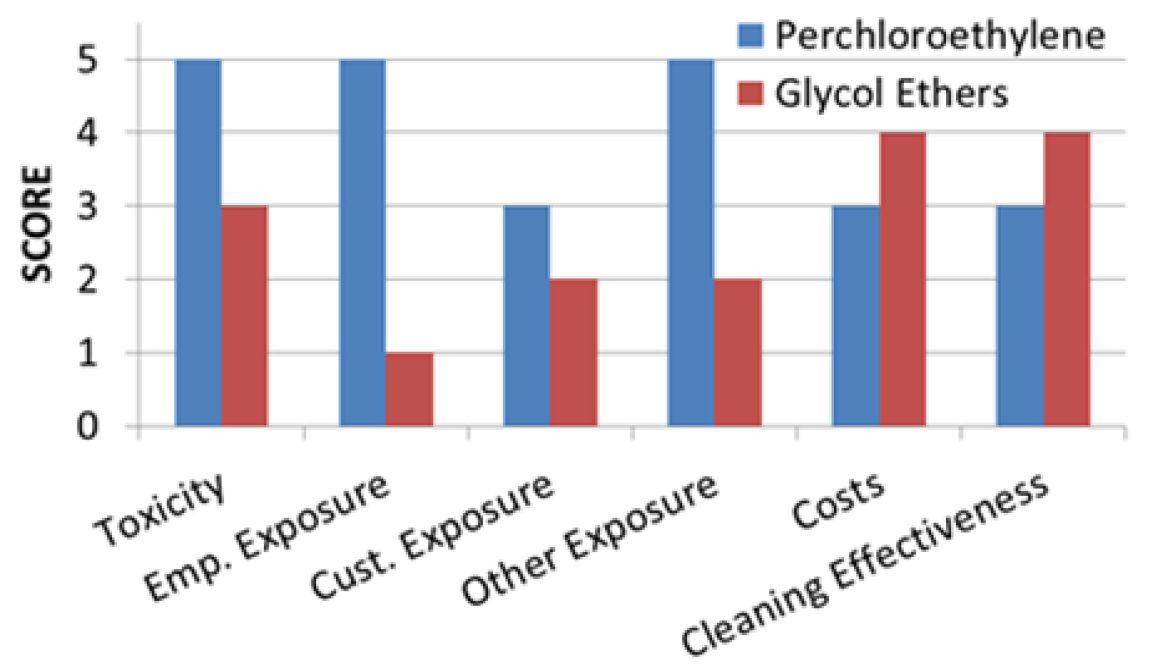
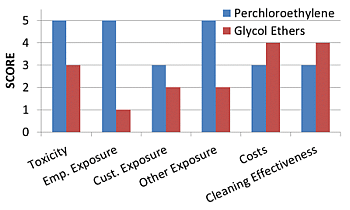
Use of both DPnB and DPtB was determined to result in significant reductions in adverse employee exposure and exposure to the general population when compared to PCE. These results can partially be attributed to: the classification of PCE as a carcinogen, the ability of PCE to persist in air, and uncontrolled venting of PCE to the ambient atmosphere. The performance criteria for scoring included chemical toxicity, employee and customer exposure levels, impacts on the general population, costs of each system, and cleaning efficacy. PCE received a score of “5” for chemical toxicity, “5” for employee exposure, “3” for customer exposure, “5” for impacts to the general population, “3” for cost of the system, and “3” for cleaning efficacy. DPnB and DPtB received a score of “3” for chemical toxicity, “1” for employee exposure, “2” for customer exposure, “2” for impacts to the general population, “4” for cost of the system, and “4” for cleaning efficacy. An aggregate sum of the performance criteria yielded a score of “16” for DPnB and DPtB, and “24” for PCE. The overall scores provided for DPnB, DPtB and PCE were not weighted for the purpose of allowing individual dry cleaner’s preferences to weigh each performance criterion according to customer needs. Figure 5 depicts these reduced impacts, as well as the results stated for each performance criterion.
Despite its reduced environmental and human health impacts, DPnB and DPtB still represent a higher economic investment than PCE, and they both have certain cleaning limitations not associated with PCE. Figure 3 illustrates similar capital investment and 37% higher annual operating cost for DPnB and DPtB when compared to PCE. Additionally, use of DPnB and DPtB is associated with cleaning disadvantages such as greying and impaired zipper functioning after cleaning. Table 4 includes a comprehensive look at the results found in this review comparing GEs to PCE.
Figure 5. Overall comparison of PCE to GEs using the scoring algorithm described in detail in the text.
Toxics 02 00115 g005
Table 4. Comprehensive results for PCE vs. GEs.
CriteriaPCEGE
Chemical ToxicityThe EPA reclassified PCE as a likely human carcinogen: The average LD50 is 10,150 ± 8277 mg/kgFewer adverse effects have been detected; and among having been detected, effects generally were mild: No HAP Lower fire-hazard cost, the average LD50 is 3122 ± 1334 mg/kg
Employee Exposure LevelsSusceptible to several adverse reproductive effects PCE with an average of 181 ± 294 ppm in air at dry cleaning establishments PCE degradation corresponds with a half-life in air ranging from 40 to 70 days with an average of 52.3 ± 12.8 days“All propylene GEs are currently believed to be relatively safe,” and “most ethylene GEs with ‘methyl’ in their names are relatively toxic.” A half-life in air was found to be 7.6 h
Customer Exposure LevelsPrincipally occurs through exposure to residual PCE present on the garments at high levels, ranging anywhere from 10 to 56 (nmol/cm2)No inhalation exposure assessments for consumers appears to have been conducted with regard to dry cleaning exposure risks
Impacts to General PopulationPCE’s persistence in groundwater and in residences co-located with dry cleaners The average of Henry’s Law constant for PCE is 1.68 × 10⁻² ± 2.07 × 10⁻³ atm-m3/mol at 25 °CDPnB and DPtB are readily biodegradable: The average of Henry’s Law constant for GEs is 9.95 × 10⁻⁷ ± 1.48 × 10⁻⁶ atm-m3/mol at 25 °C
Costs$1,000/lb machine cost with $1,000 install fee totalled a $40,000 capital investment (assuming 35-pound machine) approximately $43,000/year operating costWith a comparable capital investment (assuming 35-pound machine) the operating cost for GE is 37% higher than that of PCE at approximatly $59,000/year; Shorter wash cycle corresponds to less chemical usage
Cleaning EffectivenessLess cotton shrinkage, less average shrinkage, less wool greying when compared to GEEffective on water and oil-based stains Safer for most fabrics; impared zipper functions
The comparison is limited to two types of GEs even though the available GE solvents for dry cleaning applications may include other compounds. Due to the patented chemical mixture of the GE solvents the stated and likely compounds of GE ether (DPnB and DPtB) were considered. Limited data were available for GE in many areas of the evaluation, including exposure amount and cost evaluation case studies, chemical toxicity and exposure tests, and general information pertaining to the GEs in the dry cleaning industry. The solvent, detergent, machine, and installation costs were obtained by contacting various companies that provide these services. All other costs were based on a model created in 2005 for small dry cleaning establishments (40,000 pounds cleaned per year) based on case studies. The GE model was based on only a single, available case study, which could affect the results depending on location, size, and daily operation of facilities. The cleaning effectiveness was assessed using one comprehensive study including GE and various other solvents. Studies on cleaning effectiveness solely examining PCE were not considered for the present analysis. The evaluation completed was limited in detail due to the breadth of the subject; a number of more focused evaluations may be completed in the future for the various performance criteria of interest. This study used an approach of un-weighted scoring, and included rankings in a summary metric reported. Presented data may be reanalyzed to reflect the weighting preferences of individual readers.

4. Conclusions

This study identified DPnB and DPtB as acceptable and desirable alternatives to PCE in dry cleaning, using an evenly weighted scoring approach for six criteria. This conclusion is driven in part by the reduced environmental and human health impacts associated with the two dipropylene glycol butyl ethers when compared with PCE. The increased economic costs and cleaning limitations are compensated for by the decreased environmental and human health impacts. Future research opportunities include analyzing the properties of harmful GEs and examining the possible existence of parallels between these and DPnB and DPtB. This would give further insight into the potential for human health risks from using DPnB and DPtB. Other opportunities for future research include expanded toxicity studies specifically including DPtB and DPnB. The scoring algorithm presented here also may form the basis for a more comprehensive future study comparing DPnB, DPtB, and PCE to supercritical CO2, hydrocarbons, n-propyl bromide, and wet cleaning.

Acknowledgments

The authors would like to thank Samuel J. Jacoby, Josh G. Smith, and Scott R. Unger for their contributions to an early draft of this research article and Arjun Venkatesan for proof-reading the manuscript. This project was supported in part by awards R01ES015445, 1R01ES020889 and their supplements from the National Institute of Environmental Health Sciences (NIEHS). The content is solely the responsibility of the authors and does not necessarily represent the official views of the NIEHS or the National Institutes of Health (NIH).

Conflicts of Interest

The authors declare that there are no conflicts of interest.

Author Contributions

N.H. was responsible for the organization of this report and co-wrote the first draft. C.M.F. was responsible for the cost analysis and co-wrote the first draft of the manuscript. R.U.H. conceived and oversaw the project and edited the final draft.

References

  1. Anonymous. Solvetex ii Quality Performents of Solvents; CINET Professional Textile Care: Ophemert, Gelderland, The Netherlands, 2011. [Google Scholar]
  2. Rastkari, N.; Yunesian, M.; Ahmadkhaniha, R. Exposure assessment to trichloroethylene and perchloroethylene for workers in the dry cleaning industry. Bull. Environ. Contam. Toxicol. 2011, 86, 363–367. [Google Scholar] [CrossRef]
  3. Raaschou-Nielsen, O.; Hansen, J.; Christensen, J.M.; Blot, W.J.; McLaughlin, J.K.; Olsen, J.H. Urinary concentrations of trichloroacetic acid in danish workers exposed to trichloroethylene. 1947–1985. Am. J. Ind. Med. 2001, 39, 320–327. [Google Scholar] [CrossRef]
  4. Mundt, K.A.; Birk, T.; Burch, M.T. Critical review of the epidemiological literature on occupational exposure to perchloroethylene and cancer. Int. Arch. Occup. Environ. Health 2003, 76, 473–491. [Google Scholar] [CrossRef]
  5. Aschengrau, A.; Weinberg, J.M.; Janulewicz, P.A.; Romano, M.E.; Gallagher, L.G.; Winter, M.R.; Martin, B.R.; Vieira, V.M.; Webster, T.F.; White, R.F. Affinity for risky behaviors following prenatal and early childhood exposure to tetrachloroethylene (pce)-contaminated drinking water: A retrospective cohort study. Environ. Health 2011, 10, 1–13. [Google Scholar] [CrossRef]
  6. USEPA. Fact Sheet on Perchloroethylene, also Known as Tetrachloroethylene; EPA: Washington, DC, USA, 2012. [Google Scholar]
  7. USEPA. Dry Cleaning Alternative Solvents: Health and Environmental Impacts; California Environmental Protection Agency Air Resource Board: Sacramento, CA, USA, 2012. [Google Scholar]
  8. USEPA. Case Study: Liquid Carbon Dioxide (co2) Surfactant System for Garment Care; EPA: Washington, DC, USA, 2012. [Google Scholar]
  9. Lee, M.K.C. 10.5 Synthetic Solvent Drycleaning, Permit Handbook; Bay Area Air Quality Management District: Washington, DC, US, 2007. [Google Scholar]
  10. Hoover, S. Comments on Human Health and Environmental Hazards for Dry Cleaning Solvents Included in sf Environment’s Alternatives Assessment Fact Sheet; Office of Environmental Health Hazard Assessment: Sacramento, CA, USA, 2012. [Google Scholar]
  11. NTP. Toxicology and carcinogenesis studies of propylene glycol mono-t-butyl ether (cas no. 57018-52-7) in f344/n rats and b6c3f1 mice and a toxicology study of propylene glycol mono-t-butyl ether in male nbr rats (inhalation studies). Natl. Toxicol. Progr. Tech. Rep. 2004, 515, 1–306. [Google Scholar]
  12. Cordier, S.; Multigner, L. Occupational exposure to glycol ethers and ovarian function. Occup. Environ. Med. 2005, 62, 507–508. [Google Scholar] [CrossRef]
  13. Cordier, S.; Garnier, R.; Gazin, V.; Multigner, L.; Vasseur, P.; Beausoleil, C.; Laudet-Hesbert, A.; Bonnin, F.; Bonvallot, N.; Chenu, C. Éthers de glycol: Nouvelles données toxicologiques; Inserm: Paris, France, 2006. [Google Scholar]
  14. Hsieh, G.; Wang, J.; Cheng, T.; Chen, P. Prolonged menstrual cycles in female workers exposed to ethylene glycol ethers in the semiconductor manufacturing industry. Occup. Environ. Med. 2005, 62, 510–516. [Google Scholar] [CrossRef]
  15. Staples, C.A.; Davis, J.W. An examination of the physical properties, fate, ecotoxicity and potential environmental risks for a series of propylene glycol ethers. Chemosphere 2002, 49, 61–73. [Google Scholar] [CrossRef]
  16. OECD Screening Information Data Set. Initial Assessment Report for Siam 17—Propylene Glycol Ethers; SIAM: Arona, Italy, 2003. [Google Scholar]
  17. Brown Dzubow, R.; Makris, S.; Siegel Scott, C.; Barone, S. Early lifestage exposure and potential developmental susceptibility to tetrachloroethylene. Birth Defects Res. Part B 2010, 89, 50–65. [Google Scholar]
  18. Murphy, I.P. Rather Switch than Fight? Available online: ttps://americandrycleaner.com/articles/rather-switch-fight-part-2-2 (accessed on 13 June 2012).
  19. Office of Pollution Prevention and Toxics U.S. Environmental Protection Agency. Chemical Summary for Perchloroethylene; EPA: Washington, DC, USA, 1994. [Google Scholar]
  20. Anhui Lixing Chemical Co., Ltd. Chemical Book, Di(Propylene Glycol) Tert-Butyl Ether Basic Information. Available online: http://www.chemicalbook.com/ProductIndex_EN.aspx (accessed on 1 June 2008).
  21. MacWilliam, L. The Dry Cleaning Dilemma. Available online: http://www.myhealthyhome.com/wp-content/uploads/2011/02/TheDryCleaningDilemmawReferences.pdf (accessed on 5 June 2010).
  22. Company, M.A. Material Safety Data Sheet-Pce. Available online: http://www.MartinAsphalt.com (accessed on 17 December 2006).
  23. Environmental Health Dept.-Grace Construction Products. Material Safety Data Sheet. Available online: http://www.na.graceconstruction.com/concrete/download/DARACMMR.PDF (accessed on 27 January 2000).
  24. EMD Millipore. Dipropylene Glycol Monomethyl Ether. Available online: http://www.emdmillipore.com/is-bin/INTERSHOP.enfinity/WFS/Merck-US-Site/en_CA/-/USD/ViewPDF-Print.pdf?RenderPageType=ProductDetail&CatalogCategoryID=CDSb.s1LnJwAAAEWgeEfVhTl&ProductUUID=FUCsHfETqKQAAAE2scxwtCII&PortalCatalogUUID=t02b.s1LX0MAAAEWc9UfVhTl (accessed on 25 March 2014).
  25. U.S. Department of Labor Occupational Safety and Health Administration. Reducing Worker Exposure to Perchloroethylene (perc) in Dry Cleaning. Available online: http://www.osha.gov/Publications/osha3253.html (accessed on 24 April 2005).
  26. USDHH. Centers for Disease Control and Prvention, National Institute for Occupational Safety and Health, Niosh Pocket Guide to Chemical Hazards; National Institute for Occupational Safety and Health: Cincinnati, OH, USA, 2010. [Google Scholar]
  27. USEPA. Cleaner Technologies Substitutes Assessment: Professional Fabricare Processes (Appendix c); EPA: Washington, DC, USA, 1998. [Google Scholar]
  28. Gold, L.S.; De Roos, A.J.; Waters, M.; Stewart, P. Systematic literature review of uses and levels of occupational exposure to tetrachloroethylene. J. Occup. Environ. Hyg. 2008, 5, 807–839. [Google Scholar]
  29. Materna, B.L. Occupational exposure to perchloroethylene in the dry cleaning industry. Am. Ind. Hyg. Assoc. J. 1985, 46, 268–273. [Google Scholar] [CrossRef]
  30. Räisänen, J.; Niemelä, R.; Rosenberg, C. Tetrachloroethylene emissions and exposure in dry cleaning. J. Air Waste Manag. Assoc. 2001, 51, 1671–1675. [Google Scholar] [CrossRef]
  31. McKernan, L.T.; Ruder, A.M.; Petersen, M.R.; Hein, M.J.; Forrester, C.L.; Sanderson, W.T.; Ashley, D.L.; Butler, M.A. Biological exposure assessment to tetrachloroethylene for workers in the dry cleaning industry. Environ. Health 2008, 7, 1–10. [Google Scholar]
  32. California Department of Public Health Division of Environmental and Occupational Disease Control Occupational Health Branch. Glycol ethers. Hazard Evaluation System and Information System, Fact Sheet; California Department of Public Health Division of Environmental and Occupational Disease Control Occupational Health Branch: Sacramento, CA, USA, 2009. [Google Scholar]
  33. Permissible Exposure Limits for Chemical Contaminants. Available online: https://www.dir.ca.gov/title8/ac1.pdf (accessed on 15 August 1994).
  34. Edney, E.; Kleindienst, T.; Corse, E. Room temperature rate constants for the reaction of oh with selected chlorinated and oxygenated hydrocarbons. Int. J. Chem. Kinet. 1986, 18, 1355–1371. [Google Scholar]
  35. Tuazon, E.C.; Atkinson, R.; Aschmann, S.M.; Goodman, M.A.; Winer, A.M. Atmospheric reactions of chloroethenes with the oh radical. Int.J. Chem. Kinet. 1988, 20, 241–265. [Google Scholar] [CrossRef]
  36. Chiao, F.; Currie, R.; McKone, T. Intermedia Transfer Factors for Contaminants Found at Hazardous Waste Sites: Trichloroethylene (tce). Final Draft Report, Risk Science Program; Department of Environmental Toxicology, University of California: Davis, CA, USA, 1994. [Google Scholar]
  37. Sherlach, K.S.; Gorka, A.P.; Dantzler, A.; Roepe, P.D. Quantification of perchloroethylene residues in dry-cleaned fabrics. Environ. Toxicol. Chem. 2011, 30, 2481–2487. [Google Scholar] [CrossRef]
  38. USEPA. Toxicological Review of Tetrachloroethylene (Perchloroethylene); EPA: Washington, DC, USA, 2012. [Google Scholar]
  39. Agency for Toxic Substances and Registry (ASTDR). Toxicological Profile for Tetrachloroethylene; ASTDR: Atlanta, GA, USA, 2012. [Google Scholar]
  40. Tansel, B.; Eyma, R.R. Volatile organic contaminant emissions from wastewater treatment plants during secondary treatment. Water Air Soil Pollut. 1999, 112, 315–325. [Google Scholar] [CrossRef]
  41. Science in the Courtroom. TCE and PCE Toxicity, Uses, and Properties. Available online: http://serc.carleton.edu/woburn/issues/tce_toxicity.html (accessed on 18 June 2009).
  42. Kido, K.; Shiratori, T.; Watanabe, T.; Nakatsuka, H.; Ohashi, M.; Ikeda, M. Correlation of tetrachloroethylene in blood and in drinking water: A case of well water pollution. Bull. Environ. Contam. Toxicol. 1989, 43, 444–453. [Google Scholar]
  43. Canter, L.W.; Sabatini, D.A. Contamination of public ground water supplies by superfund sites. Int. J. Environ. Stud. 1994, 46, 35–57. [Google Scholar] [CrossRef]
  44. USEPA. Basic Information about Tetrachloroethylene in Drinking Water; EPA: Washington, DC, USA, 2012. [Google Scholar]
  45. Schreiber, J.S.; Hudnell, H.K.; Geller, A.M.; House, D.E.; Aldous, K.M.; Force, M.S.; Langguth, K.; Prohonic, E.J.; Parker, J.C. Apartment residents’ and day care workers’ exposures to tetrachloroethylene and deficits in visual contrast sensitivity. Environ. Health Perspect. 2002, 110, 655. [Google Scholar]
  46. McDermott, M.J.; Mazor, K.A.; Shost, S.J.; Narang, R.S.; Aldous, K.M.; Storm, J.E. Tetrachloroethylene (pce, perc) levels in residential dry cleaner buildings in diverse communities in New York city. Environ. Health Perspect. 2005, 113, 1336. [Google Scholar] [CrossRef]
  47. Atkinson, R. Gas-phase tropospheric chemistry of organic compounds: A review. Atmos. Environ. Part A 1990, 24, 1–41. [Google Scholar] [CrossRef]
  48. Carter, W.P. Development of ozone reactivity scales for volatile organic compounds. Air Waste 1994, 44, 881–899. [Google Scholar] [CrossRef]
  49. Derwent, R.; Jenkin, M.; Saunders, S. Photochemical ozone creation potentials for a large number of reactive hydrocarbons under european conditions. Atmos. Environ. 1996, 30, 181–199. [Google Scholar] [CrossRef]
  50. Chang, C.-C.; Chen, T.-Y.; Lin, C.-Y.; Yuan, C.-S.; Liu, S.-C. Effects of reactive hydrocarbons on ozone formation in southern taiwan. Atmos. Environ. 2005, 39, 2867–2878. [Google Scholar] [CrossRef]
  51. Cheng, H.; Guo, H.; Saunders, S.; Lam, S.; Jiang, F.; Wang, X.; Simpson, I.; Blake, D.; Louie, P.; Wang, T. Assessing photochemical ozone formation in the pearl river delta with a photochemical trajectory model. Atmos. Environ. 2010, 44, 4199–4208. [Google Scholar] [CrossRef]
  52. Derwent, R.; Jenkin, M.; Passant, N.; Pilling, M. Reactivity-based strategies for photochemical ozone control in Europe. Environ. Sci. Policy 2007, 10, 445–453. [Google Scholar] [CrossRef]
  53. Evtyugina, M.; Pio, C.; Nunes, T.; Pinho, P.; Costa, C. Photochemical ozone formation at Portugal west coast under sea breeze conditions as assessed by master chemical mechanism model. Atmos. Environ. 2007, 41, 2171–2182. [Google Scholar] [CrossRef]
  54. Pinho, P.; Lemos, L.; Pio, C.; Evtyugina, M.; Nunes, T.; Jenkin, M. Detailed chemical analysis of regional-scale air pollution in western portugal using an adapted version of mcm v3. 1. Sci. Total Environ. 2009, 407, 2024–2038. [Google Scholar] [CrossRef]
  55. Saunders, S.; Jenkin, M.; Derwent, R.; Pilling, M. Protocol for the development of the master chemical mechanism, mcm v3 (part a): Tropospheric degradation of non-aromatic volatile organic compounds. Atmos. Chem. Phys. 2003, 3, 161–180. [Google Scholar] [CrossRef]
  56. Derwent, D. Reactivity Scales as Comparative Tools for Chemical Mechanisms: SAPRC vs. MCM. Available online: http://www.arb.ca.gov/research/reactivity/3-25-2009/derwent-present.pdf (accessed on 28 March 2009).
  57. Altenstedt, J.; Karin, P. POCP for Individual VOC under European Conditions; Swedish Environmental Research Institute: Stockholm, Sweden, 1998. [Google Scholar]
  58. Koppmann, R. Volatile Organic Compounds in the Atmosphere; John Wiley & Sons: Hoboken, NJ, USA, 2008; pp. 1–512. [Google Scholar]
  59. Morris, M.; Wolf, K. Evaluation of New and Emerging Technologies for Textile Cleaning. Available online: https://dtsc.ca.gov/PollutionPrevention/upload/P2_REP_Emerging_Technology_Textile_Cleaning.pdf (accessed on 1 August 2005).
  60. The Dow Chemical Company. Product Safety Assessment Dipropylene Glycol n-Butyl Ether; The Dow Chemical Company: Midland, MI, USA, 2008. [Google Scholar]
  61. CALED. Caled better Cleaning with Chemistry. Available online: http://www.caledclean.com/index.cfm/category/37/solvents.cfm (accessed on 1 August 2014).
  62. Rynex. Rynex-3 Dry Cleaning Solvent Equinox Chemicals. Available online: http://rynex.com/PDF/Rynex%20MSDS%20WEBSITE.pdf (accessed on 10 November 2010).
  63. UNION. Drycleaning Products, Perchloreoethylene machines L & P 800 series. Available online: http://www.uniondc.com/products/union-products-perc-lp800.html (accessed on 17 August 2012).
  64. Index, C.P. Archived Consumer Price Index Detailed Report Information. Available online: http://www.bls.gov/cpi/cpi_dr.htm (accessed on 1 May 2007).
  65. Anonymous. Assessment of Alternatives to Perchloroethylene for the Dry Cleaning Industry; Toxic Use Reduction Institute: University of Massachusetts, Lowell, 2007. [Google Scholar]
  66. Wolf, K.; Morris, M. Spotting Chemicals: Alternatives to Perchloroethylene and Trichloroethylene in the Textile Cleaning Industry; Institute for Research and Technical Assistance: Los Angeles, CA, USA, 2007. [Google Scholar]