Article

Ozone Pollution in the Western Yangtze River Delta During the 2020 and 2021 Warm Seasons: Roles of Meteorology and Air Mass Transport

1
Collaborative Innovation Center of Atmospheric Environment and Equipment Technology, Jiangsu Key Laboratory of Atmospheric Environment Monitoring and Pollution Control, School of Environmental Science and Engineering, Nanjing University of Information Science & Technology, Nanjing 210044, China
2
Jiangsu Nanjing Environmental Monitoring Center, Nanjing 210041, China
*
Author to whom correspondence should be addressed.
Toxics 2025, 13(8), 670; https://doi.org/10.3390/toxics13080670
Submission received: 8 July 2025 / Revised: 4 August 2025 / Accepted: 7 August 2025 / Published: 9 August 2025

Abstract

Surface ozone (O3), a key hurdle in air quality improvement in China, often displays regional pollution characteristics. This study investigated the influence of meteorological conditions and air mass transport on O3 and non-methane hydrocarbons (NMHCs) concentrations in Nanjing, located in the western Yangtze River Delta (YRD) region of China during April–September of 2020 and 2021 based on online observations of O3 and its precursors and meteorological conditions, backward-trajectory analysis, and an observation-based box model (OBM). O3 concentrations rose with temperature, albeit non-linearly. Southeastern trajectories constituted the most dominant air mass transport pathway (29.3%) and were associated with the highest O3 concentrations. The concentration-weighted trajectory analyses of O3 and NMHCs during four O3 pollution episodes suggested that urban/industrial areas in central and eastern YRD were potential source regions. The OBM results indicated that while O3 sensitivity was dominated by the NMHCs-limited regime, the relative contributions of three O3 sensitivity regimes varied across air mass trajectory clusters. The southeastern air masses with long-range transport showed the highest frequency of the transition and NOx-limited O3 sensitivity regimes. These findings underscore the crucial role of regional air mass transport not only in determining O3 and NMHCs concentrations but also in shaping O3 formation sensitivity, highlighting the necessity of implementing regionally coordinated control strategies for effective O3 and NMHCs pollution mitigation.

Graphical Abstract

1. Introduction

Over the past decade, primary air pollution issues such as sulfur dioxide (SO2) have improved significantly in China; however, secondary pollutants such as surface ozone (O3) still constitute a pressing concern [1,2,3,4]. Numerous studies have indicated that elevated concentrations of O3 can harm human health [5,6], reduce crop yields [7], and cause other detrimental effects. As a secondary pollutant, O3 formation is influenced by precursor emissions and meteorological conditions [8,9] that pose a considerable challenge to control efforts [10]. In recent years, O3 pollution has become one of the main obstacles in improving air quality in China [11].
Studies have shown that surface O3 often displays typical regional pollution characteristics [12], suggesting that atmospheric transport significantly influences the spatiotemporal distribution of O3 concentrations [13]. Firstly, O3 is primarily formed through photochemical reactions involving volatile organic compounds (VOCs) and nitrogen oxides (NOx), and its formation is thus strongly influenced by emission intensity and spatiotemporal distribution of VOCs and NOx [14,15]. Furthermore, air mass transport processes can also influence photochemical reaction intensity and prevailing meteorological conditions [16,17,18]. Several studies have documented the significant impact of air mass transport on O3 concentrations. For example, Sahu et al. (2021) demonstrated the influence of long-range atmospheric transport from outside China on O3 levels in its eastern coastal and southwestern regions [19]. Gong et al. (2020) reported that in the Beijing–Tianjin–Hebei region, air mass transport contributed to a 36% increase in O3 concentrations [20]. Li et al. (2021) observed in the Yangtze River Delta (YRD) that high concentrations of O3 originating from within Shanghai spread horizontally and were subsequently transported downward from the free troposphere to northern YRD, significantly increasing regional O3 concentrations [21]. Similarly, Li et al. (2024) found that during autumn 2019, 42% of O3 concentrations in the Pearl River Delta (PRD) region was attributed to air mass transport mostly from Guangdong province and eastern China [22]. Besides the direct influence on O3 concentration, air mass transport can also indirectly affect regional O3 levels by altering the extent of photochemical reactions [23]. Some studies indicated that shifts in the ratio of VOCs versus NOx during air mass transport can modify the sensitivity of O3 formation to VOCs and NOx [24,25,26], while others found the chemical composition of VOCs also changed during air mass transport, further impacting O3 formation [27,28].
The YRD region, a major urban agglomeration in eastern China, is one of the areas with the highest O3 concentrations in the country [29]. Within the YRD, O3 concentrations typically elevated in the central and western areas [18,30]. Since 2016, southern cities in Jiangsu Province have experienced notable increases in O3 concentrations, with some periods showing higher levels than other major YRD cities such as Shanghai and Hangzhou [30]. Nanjing, a central city located in western YRD and southern Jiangsu, has been particularly affected [31]. From 2017 to 2019, the number of O3 exceedance days in urban Nanjing remained above 60 annually, with exceedance rates over 15% (https://sthjj.nanjing.gov.cn/index.html (accessed on 21 March 2025)). While O3 pollution saw a slight dip in 2020 (6.9% year-on-year decrease in exceedance rate), it unfortunately rebounded in 2021 and 2022. Despite some observed reductions in concentrations in 2023 and 2024, O3 remains a significant contributor to air pollution in Nanjing (https://sthjj.nanjing.gov.cn/index.html (accessed on 21 March 2025)).
To assess the impact of meteorological conditions and air mass transport on urban O3 in Nanjing, this study analyzed the diurnal variations of O3 and its precursors concentrations, their relationship of temperature and wind, and investigated major pathways of air mass transport based on air mass backward-trajectory analysis. Four O3 pollution episodes occurring between April to September in 2020 and 2021 were then selected to further analyze the impact of synoptic conditions on O3 and investigate the sensitivity of O3 with NOx and non-methane hydrocarbons (NMHCs) using an observation-based box model (OBM). Potential source regions of O3 and NMHCs in these four episodes were identified using the concentration-weighted trajectory (CWT) method. Furthermore, concentrations of O3 and its precursor, along with the O3-NMHCs-NOx sensitivity was compared across various air mass back-trajectory clusters to discuss the influence of air mass transport. The results of this study can provide a scientific basis for O3 pollution prevention in Nanjing and YRD, while enhancing our understanding of how air mass transport influences O3 formation.

2. Materials and Methods

2.1. Field Observations

This study focuses on the high O3 pollution season (April–September) (Figure 1) during 2020 and 2021, following the implementation of the Three-Year Action Plan for the Battle of the Blue Sky (2018–2020). Hourly concentrations of O3, NMHCs, NOx, carbon monoxide (CO), and meteorological parameters were observed at an urban site (NJ, 118.76°E, 32.06°N) in Nanjing, Jiangsu Province, a central city within the YRD region of China. This site is located approximately 300 km west of Shanghai, 250 km northwest of Hangzhou in Zhejiang Province, and 170 km east of Hefei in Anhui Province. The surroundings of this site are residential and commercial buildings, with no significant local industrial emission sources in the immediate vicinity. The nearest road network includes the West Inner Ring Road (approximately 250 m to the east), the North Inner Ring Road (approximately 1.5 km to the north), and an expressway (approximately 1.3 km to the west). The two major petrochemical industrial zones in Nanjing are located approximately 20 km northeast of the site. Detailed descriptions of this site and measurement methods for O3 and its precursors were provided in Lu et al. (2023) [32]. In brief, ambient NMHCs were pre-concentrated using a dual-channel ultra-low-temperature cold trap, thermally desorbed, and then analyzed using a gas chromatography system with a flame ionization detector and mass spectrometry (GC–MS/FID) (Agilent Technologies, Inc., Santa Clara, CA, USA). A total of 57 NMHCs, comprising 28 alkanes, 11 alkenes, acetylene, and 17 aromatics, were measured during the 2020 and 2021 campaigns (Appendix A). Details about this system following the protocol of Wang et al. (2014) [33]. O3, NO/NO2, and CO were measured with Model 49i ultraviolet absorption, Model 42i chemiluminescence, and Model 48i infrared analyzers (Thermo Fisher Scientific, Waltham, MA, USA), respectively.

2.2. Backward-Trajectory and Concentration-Weighted Trajectory (CWT) Analysis

Air-mass backward-trajectories and CWT analyses were performed using MeteoInfo (Version 3.9.4) [34]. The inputted gridded meteorological data were obtained from the Global Data Assimilation System (GDAS) at a 0.1° × 0.1° resolution (ftp://arlftp.arlhq.noaa.gov/pub/archives/gdas1). In published literatures on O3 transport, air mass transport times for backward trajectories are typically set at 24 to 72 h (1–3 days) [21,35,36,37]. For this study, given our focus on air transport within the YRD region and eastern China, and considering the relative short lifetimes of NMHCs and NOx, we selected 12 h, 24 h, and 48 h trajectories for analysis. The time interval for each trajectory was set at one hour. The trajectory ending height was set at 500 m above ground level following the published literatures on air mass transport [36,37] and the reported boundary layer height in Nanjing [38]. The trajectories for each air mass transport time were then clustered into six types based on Euclidean distance.
In this study, the weighted concentration-weighted trajectory (WCWT) method was applied to identify potential source regions of O3 and NMHCs during four O3 pollution episodes (detailed dates are provided in Section 3.3.1). The WCWT value for each grid cell (ij) is calculated using the following equations:
W C W T i j = W i j × C W T i j
C W T i j = l = 1 M C l × τ i j l / i = 1 n τ i j l
W i j = 1.00 ,   n i j > 80 0.70 ,   20 < n i j 80 0.42 ,   10 < n i j 20 0.05 ,   n i j 10
where M is the total number of trajectories; C l means the concentration of O3 or NMHCs observed upon arrival of trajectory l ; τ i j l represents the residence time of trajectory l in the i j grid cell; n i j is the number of trajectory endpoints in the i j grid cell. Higher WCWT values signify a greater potential for the respective grid cell to contribute to the observed levels of O3 or NMHCs at the NJ site. In accordance with China’s National Ambient Air Quality Standard, the O3 threshold concentrations for the four episodes were set at 160 μg m−3. This threshold corresponds to the Grade II standard for the daily maximum 8 h moving average (DMA-8h) O3 (general residential areas) and matches the Grade I standard for the daily maximum 1 h average O3 (special protection areas). The NMHCs thresholds were set as its average mixing ratios during each episode, specifically 13.2, 18.2, 11.0, and 13.2 ppbv.

2.3. Observation-Based Box Model (OBM)

To evaluate the formation sensitivity of O3 to its precursors, a 0-dimension observation-based box model (OBM) incorporating the carbon bond lumped chemical reaction mechanism (CB05) was employed to simulate the photochemical processes governing O3 formation and removal. The OBM was constrained by observed hourly averaged concentrations of NO, O3, CO, 57 NMHCs (lumped according to the CB05 mechanism), along with temperature, and relative humidity (RH) to simulate O3 formation and removal processes. Photolysis frequencies for O3, NO2, and other relevant species were determined using the Tropospheric Ultraviolet–Visible Radiation (TUV) model. Simulations were conducted for the period spanning 07:00 to 19:00. Further details regarding the OBM are available in Cardelino and Chameides (1995) [39] and Wang et al. (2020) [24]. In this study, an index of agreement (IOA) of 0.87 for observed versus simulated O3 concentrations suggested the good performance of OBM in O3 simulations.
The relative incremental reactivity (RIR) of individual precursors was calculated using the following equation:
RIR ( X ) = P O 3 N O X P O 3 N O X X / P O 3 N O X S ( X ) / S ( X )
where P O 3 N O X represents the net O3 formation potential (i.e., the time integral of O3 formation rate during daytime 07:00–19:00) corresponding to the measured concentration of precursor X. P O 3 N O X X means the net O3 formation potential resulting from a specific reduction ( X ) in the amount of X. S ( X ) denotes the source function of precursor X, primarily encompassing influences from emissions and horizontal air mass transport not accounted for within the OBM. S ( X ) represents the change in S ( X ) resulting from X . In this study, the S ( X ) / S ( X ) was set as 10%.
The sensitivity of O3 formation to NMHCs and NOx was classified into three regimes based on the relative incremental reactivity (RIR) values of anthropogenic NMHCs (AHC) and NOx proposed by Xu et al. (2022) [40]. When RIR(NOx) is negative and RIR(AHC) is positive, it indicates that a reduction in NOx leads to an increase in O3, while a reduction in anthropogenic NMHCs results in a decrease in O3. In this case, O3 formation is classified as NMHCs-limited, suggesting that reducing anthropogenic NMHCs is a more effective strategy for controlling O3 levels. When both RIR(NOx) and RIR(AHC) are positive, the sensitivity of O3 formation can be further classified based on the ratio of RIR(NOx) to RIR(AHC). Specifically, if the ratio RIR(NOx)/RIR(AHC) is less than 0.5, it indicates that O3 formation is still NMHCs-limited, meaning reductions in anthropogenic NMHCs are more effective than NOx for O3 control. If the ratio exceeds 2, the O3 formation is considered NOx-limited, suggesting that reducing NOx emissions would more effectively lower O3 levels. When the ratio falls between 0.5 and 2, the O3 formation is in transition regime, where both anthropogenic NMHCs and NOx contribute significantly to O3 formation, and coordinated control of both precursors is necessary.

3. Results

3.1. Variation of O3 and Its Precursors and Influence of Meterological Conditions

3.1.1. Diurnal Variations of O3 and Its Precursors Levels

For the period of April to September in 2020 and 2021, the average daily maximum 1 h (DMA-1h) O3 concentration was 149 ± 50.5 μg m−3. The number of days on which DMA-1h O3 concentrations surpassed the China’s National Ambient Air Quality Standard thresholds of 200 μg m−3 (Grade II) and 160 μg m−3 (Grade I) was 64 and 147, respectively. The average concentrations of NMHCs and NOx were 16.7 ± 10.7 ppbv and 18.0 ± 14.5 ppbv, respectively. The average O3 concentrations during April–September of 2020 and 2021 were 86.0 ± 28.3 and 80.3 ± 28.7 μg m−3, respectively, with no statistically significant difference at the 0.05 level (two-tailed t-test) [32]. In contrast, NMHCs and NOx levels significantly declined in 2021 compared to 2020, with relative decreases of 17.6% and 14.0%, respectively [32]. Temperature and wind speed between 2020 and 2021 also showed no significant differences at the 0.05 level (two-tailed t-test), with predominant wind directions from the east and southeast [32], indicating similar meteorological conditions between the two years.
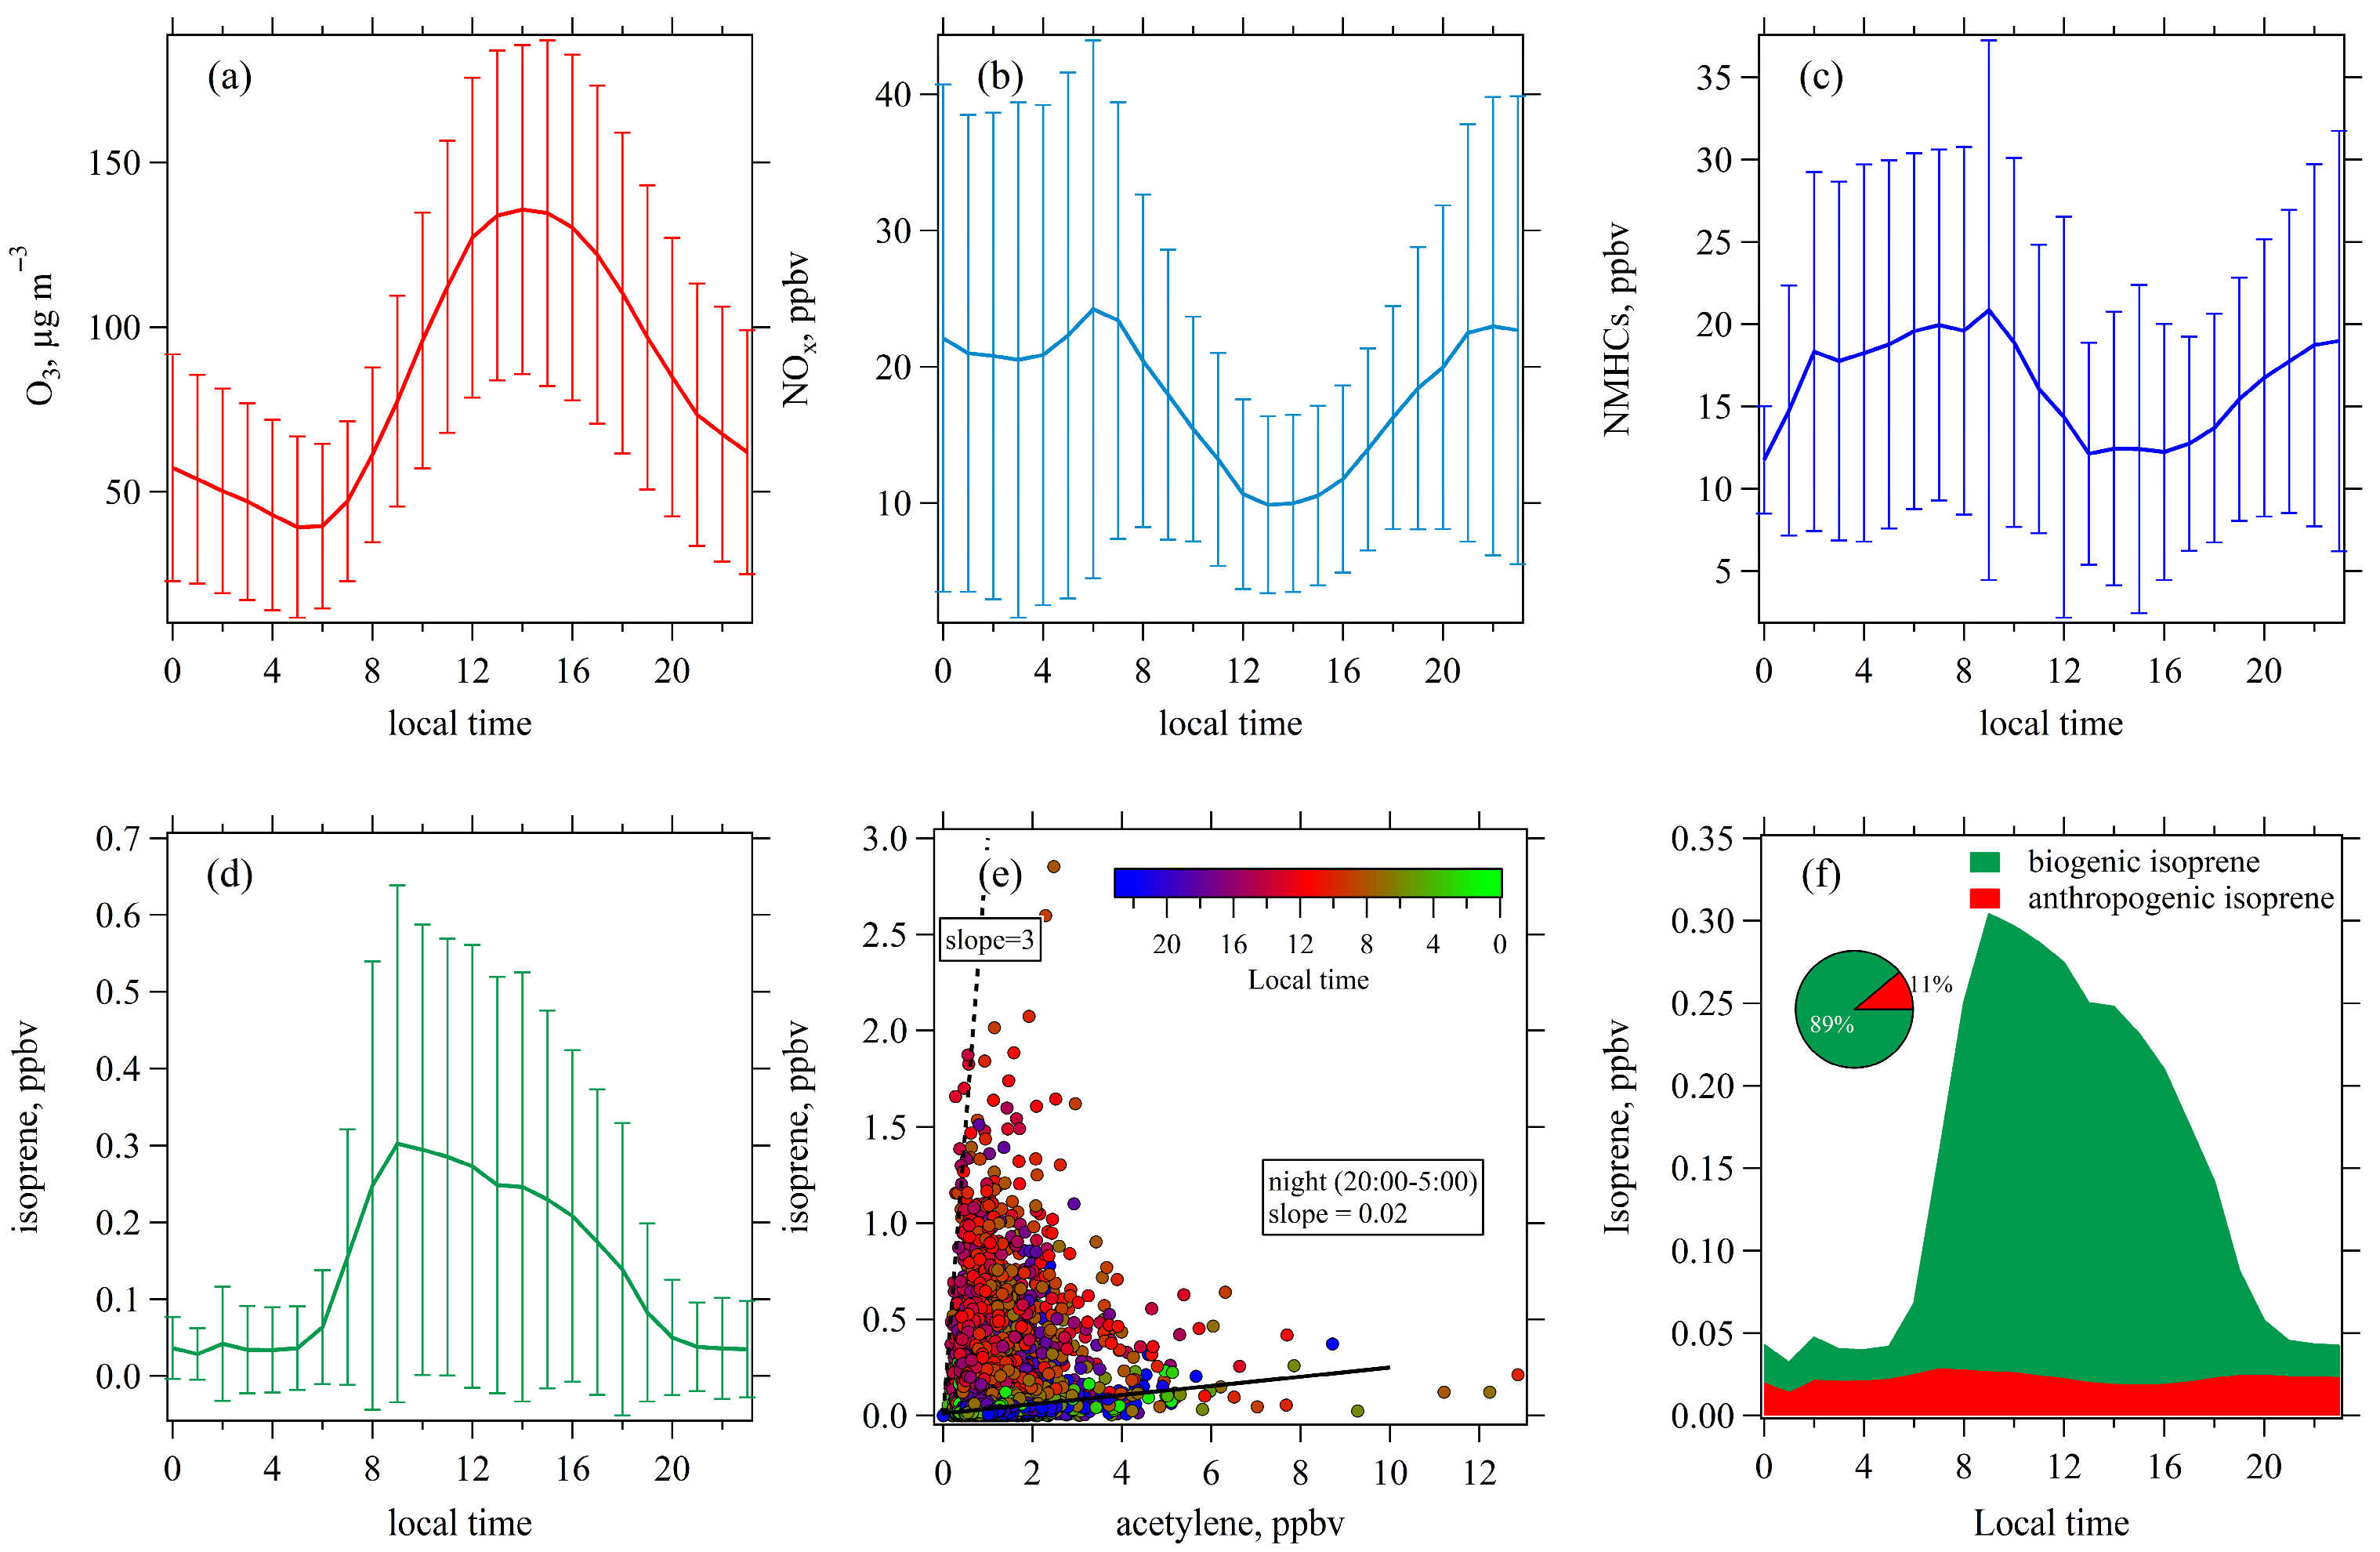
Figure 2 shows the average diurnal variation patterns of O3, NOx, NMHCs, and isoprene levels. As depicted in Figure 2a, O3 concentrations peaked between 13:00 and 15:00. Conversely, NOx and NMHCs concentrations exhibited peak values during the morning rush hour (05:00–07:00) and reached their lowest values in the early afternoon (13:00–15:00) (Figure 2b,c). Isoprene concentrations displayed a distinct diurnal profile compared to MMHCs, with high values observed from 10:00 to 16:00 and the lowest values occurring at night (Figure 2d). Furthermore, we analyzed the relationship between isoprene and acetylene (Figure 2e), which was mainly emitted from vehicular exhaust in urban Nanjing [24]. These two species showed poor correlations, with higher isoprene/acetylene ratios observed during daytime, with the highest isoprene/acetylene ratio approaching three. The ratio of anthropogenic isoprene to acetylene was estimated using two methods: (1) the slope of a linear regression between their concentrations during nighttime (20:00–23:00 and 00:00–05:00), and (2) the median of their ratios over the same period. These methods gave values of 0.024 and 0.020, respectively. Accordingly, we estimated anthropogenic isoprene as 0.02 times the measured acetylene, attributing the remaining isoprene to biogenic sources. Biogenic sources accounted for approximately 88% of total isoprene levels during daytime (Figure 2f), confirming that isoprene was predominantly biogenically emitted.

3.1.2. Influence of Temperature on O3 and Its Precursors Levels

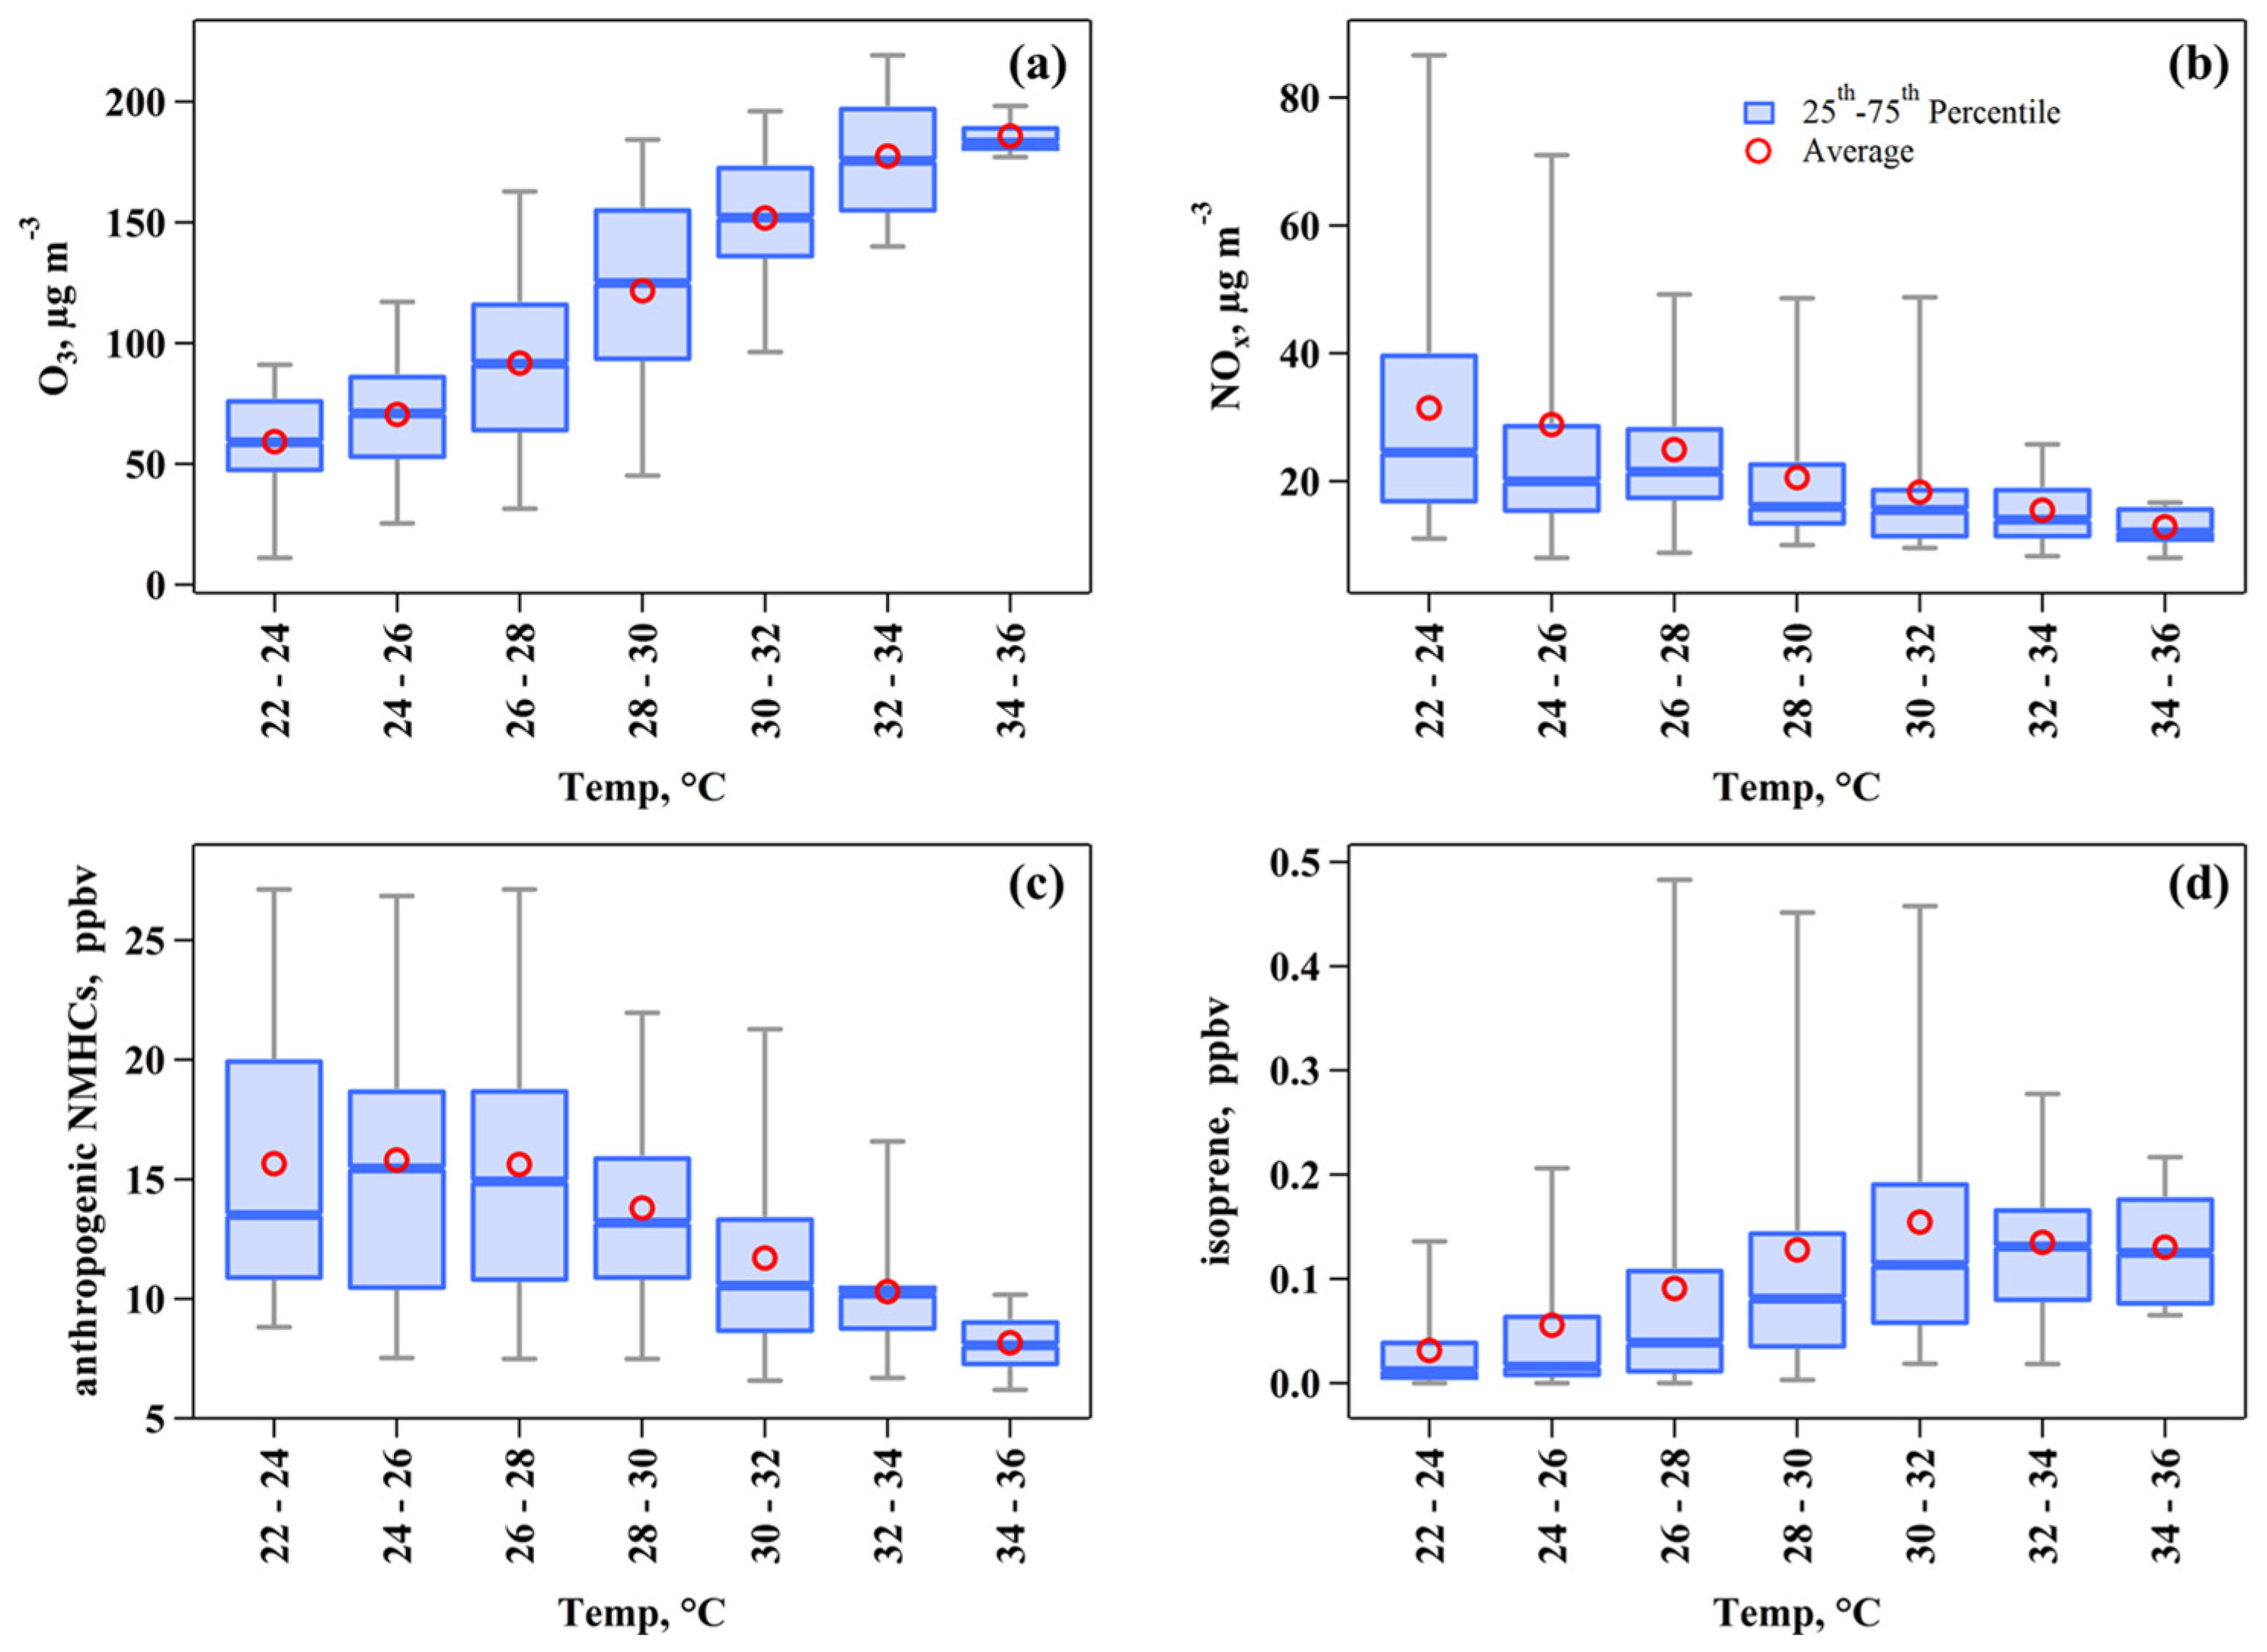
High temperatures frequently coincide with strong solar radiation, a combination that accelerates the photochemical reactions leading to O3 formation. Furthermore, these elevated temperatures enhance the release of NMHCs into the atmosphere, increasing evaporation from sources like paints, solvents, and gasoline, as well as promoting higher biogenic emission rates [41]. Figure 3a illustrates the relationship between O3 concentration and temperature observed in this study. O3 concentrations exhibited a positive, yet non-linear, relationship with temperature. Specifically, the rate of O3 concentration increase reached 15.0 μg m−3 °C−1 between 26–28 °C and 30–32 °C temperature ranges. This rate significantly decreased to 4.14 μg m−3 °C−1 across the 32–34 °C and 34–36 °C temperature ranges. In contrast, the concentrations of NOx and anthropogenic NMHCs exhibited a decrease with rising temperature (Figure 3b,c), aligning with the diurnal variation patterns presented in Figure 2. This finding can be attributed to the combined effects of enhanced dilution resulting from a higher boundary layer and increased photochemical removal driven by strong solar radiation during midday and early afternoon. Furthermore, isoprene levels increased with rising temperature within the 22–24 °C and 30–32 °C temperature ranges (Figure 3d), which is expected as high temperatures and solar radiation typically enhance biogenic emission rates [42].

3.1.3. Wind Analysis of O3 and Its Precursors

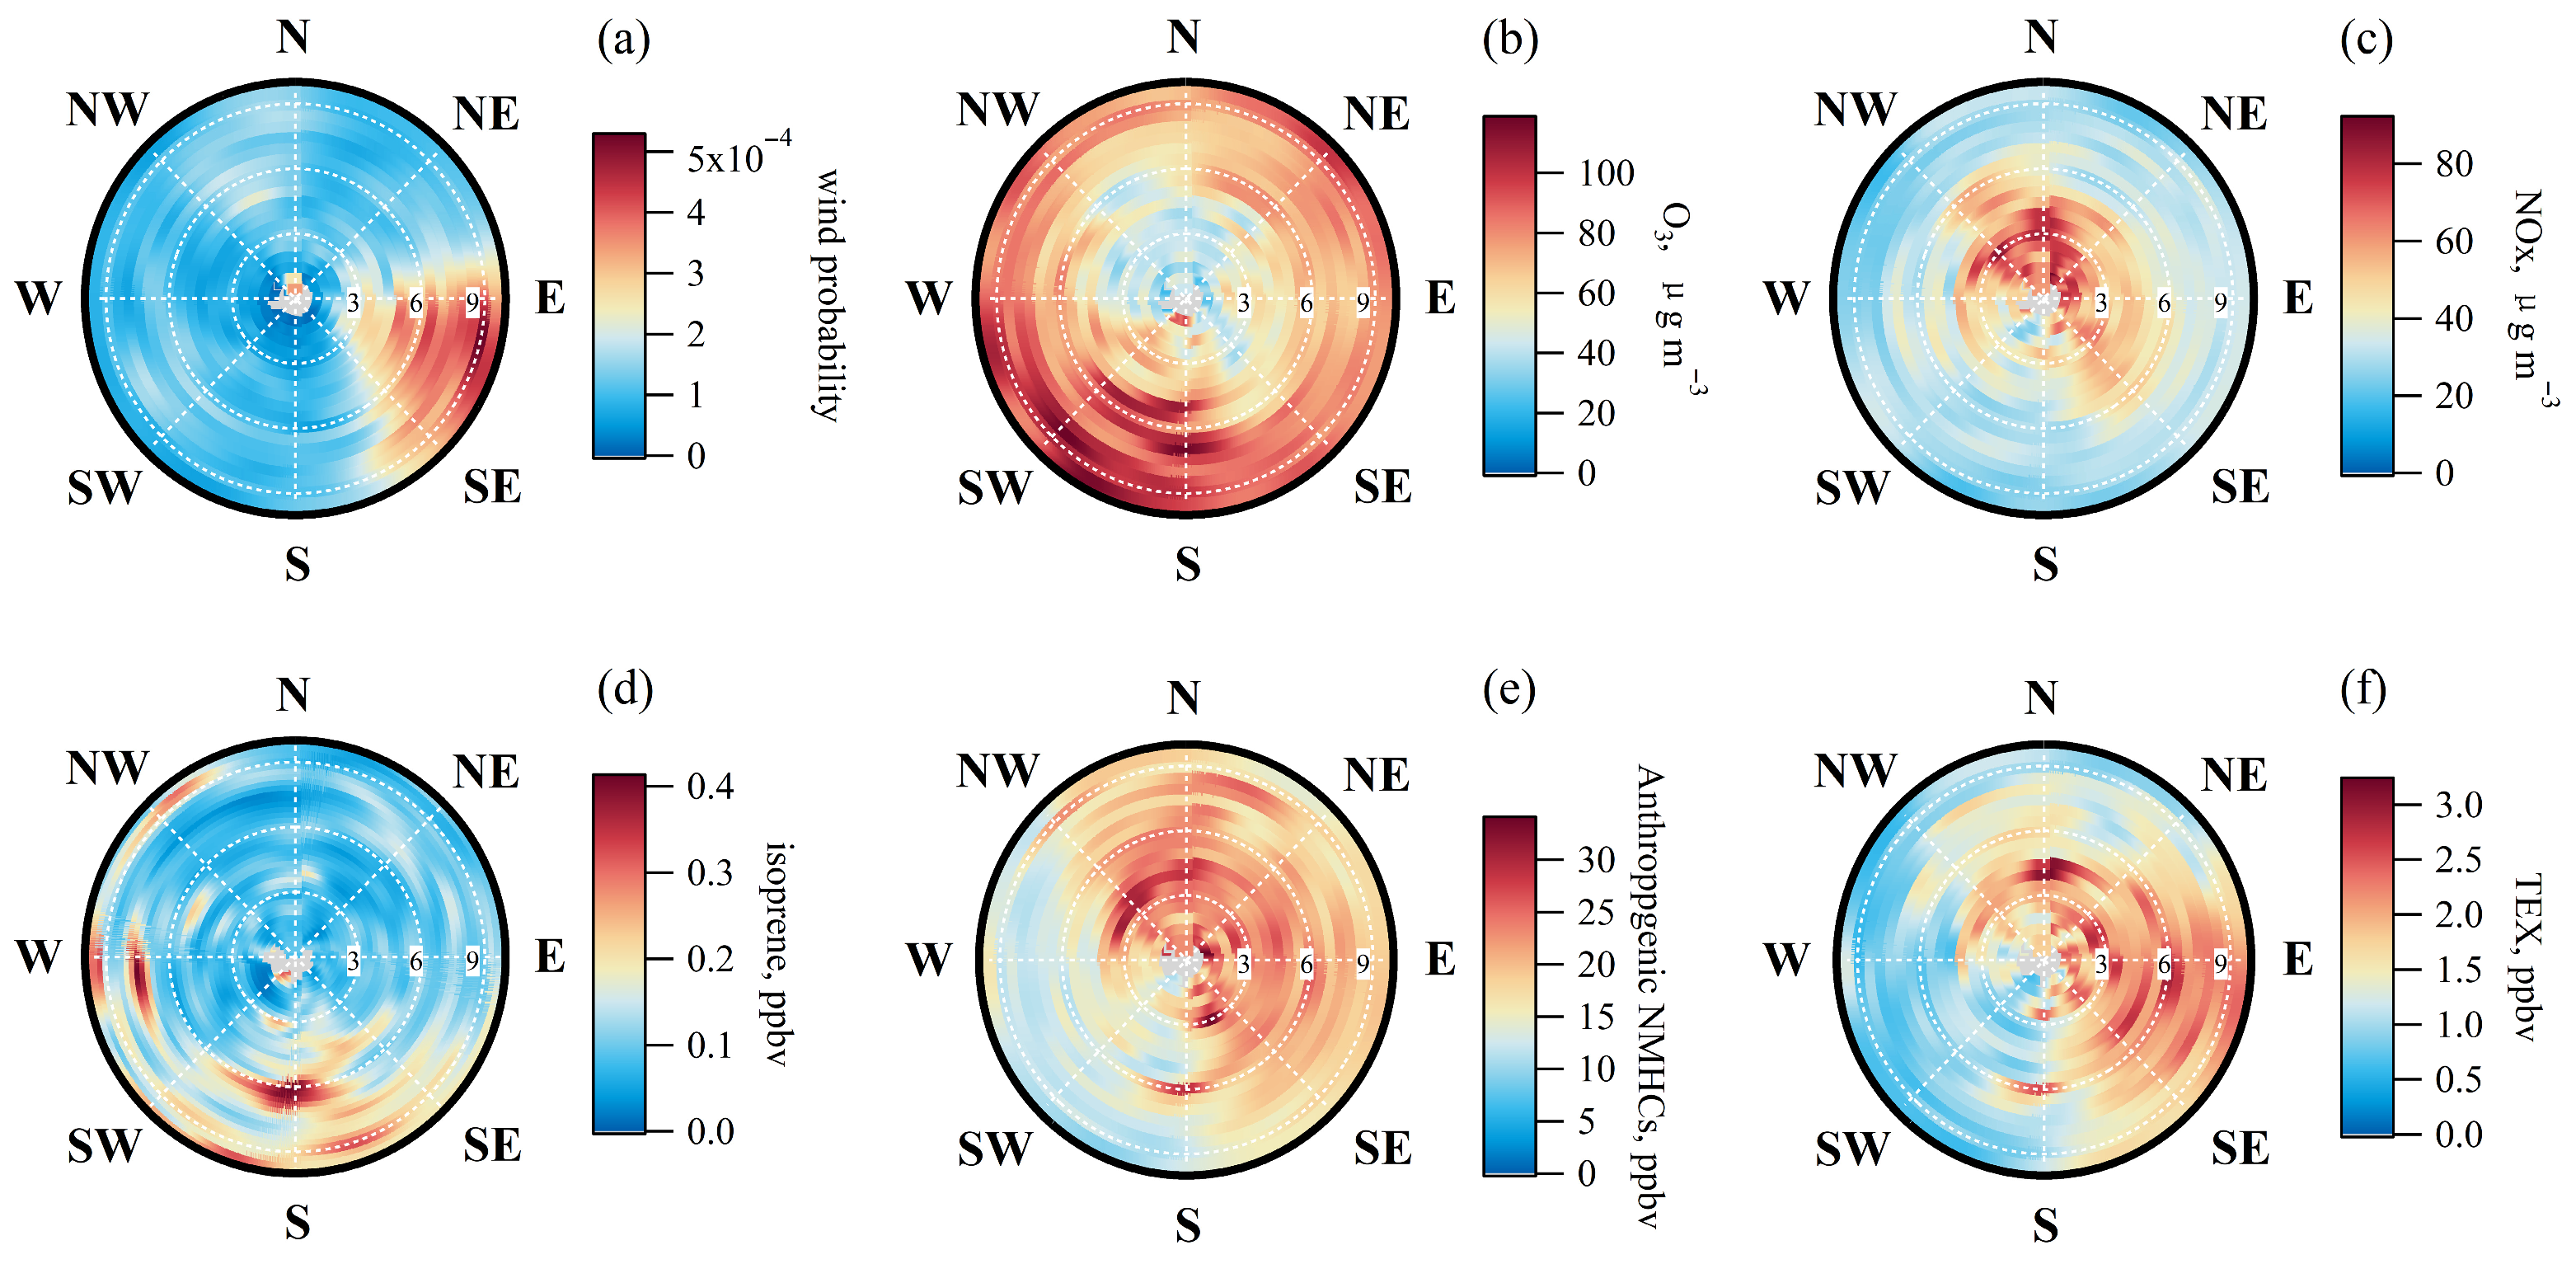
We investigated the influence of wind speed and directions on O3 and its precursors using the ZeFir toolkit [43]. The wind rose analysis for April–September in 2020 and 2021 revealed that the prevailing winds originated from the east and southeast (90–145°) (Figure 4a). O3 concentrations showed a distinct relationship with wind speed: lower levels were observed at speeds below 3 km h−1, while higher concentrations occurred at speeds exceeding 6 km h−1. Although elevated O3 was recorded from all directions, the highest values were associated with southerly winds (135–225°) (Figure 4b). In contrast, NOx concentrations were inversely related to O3, peaking under low wind speeds (<6 km h−1) from the north (Figure 4c). This suggests that at lower wind speeds, locally emitted NOx possibly accumulated and depleted O3 through titration. Isoprene and anthropogenic NMHCs also exhibited unique patterns based on wind conditions. High isoprene concentrations were predominantly observed with southerly winds exceeding 5 km h−1 (Figure 4d). Conversely, elevated anthropogenic NMHCs were recorded from a broader range of wind directions, from northwest to south (0–180° and 315–360°), under both low and high wind speeds (Figure 4e), indicating a potential influence from air mass transport. This pattern was further clarified by specific tracers for solvents and paint use—toluene, ethylbenzene, and xylenes [44]. At low wind speeds, their summed concentrations (TEX) were highest from the northwest-to-south sector (Figure 4f). Crucially, under high wind speeds, elevated levels of these compounds were also observed from the east and southeast, suggesting that their presence was possibly augmented by regional transport from these specific directions.

3.2. Air Mass Transport Pathways in Urban Nanjing

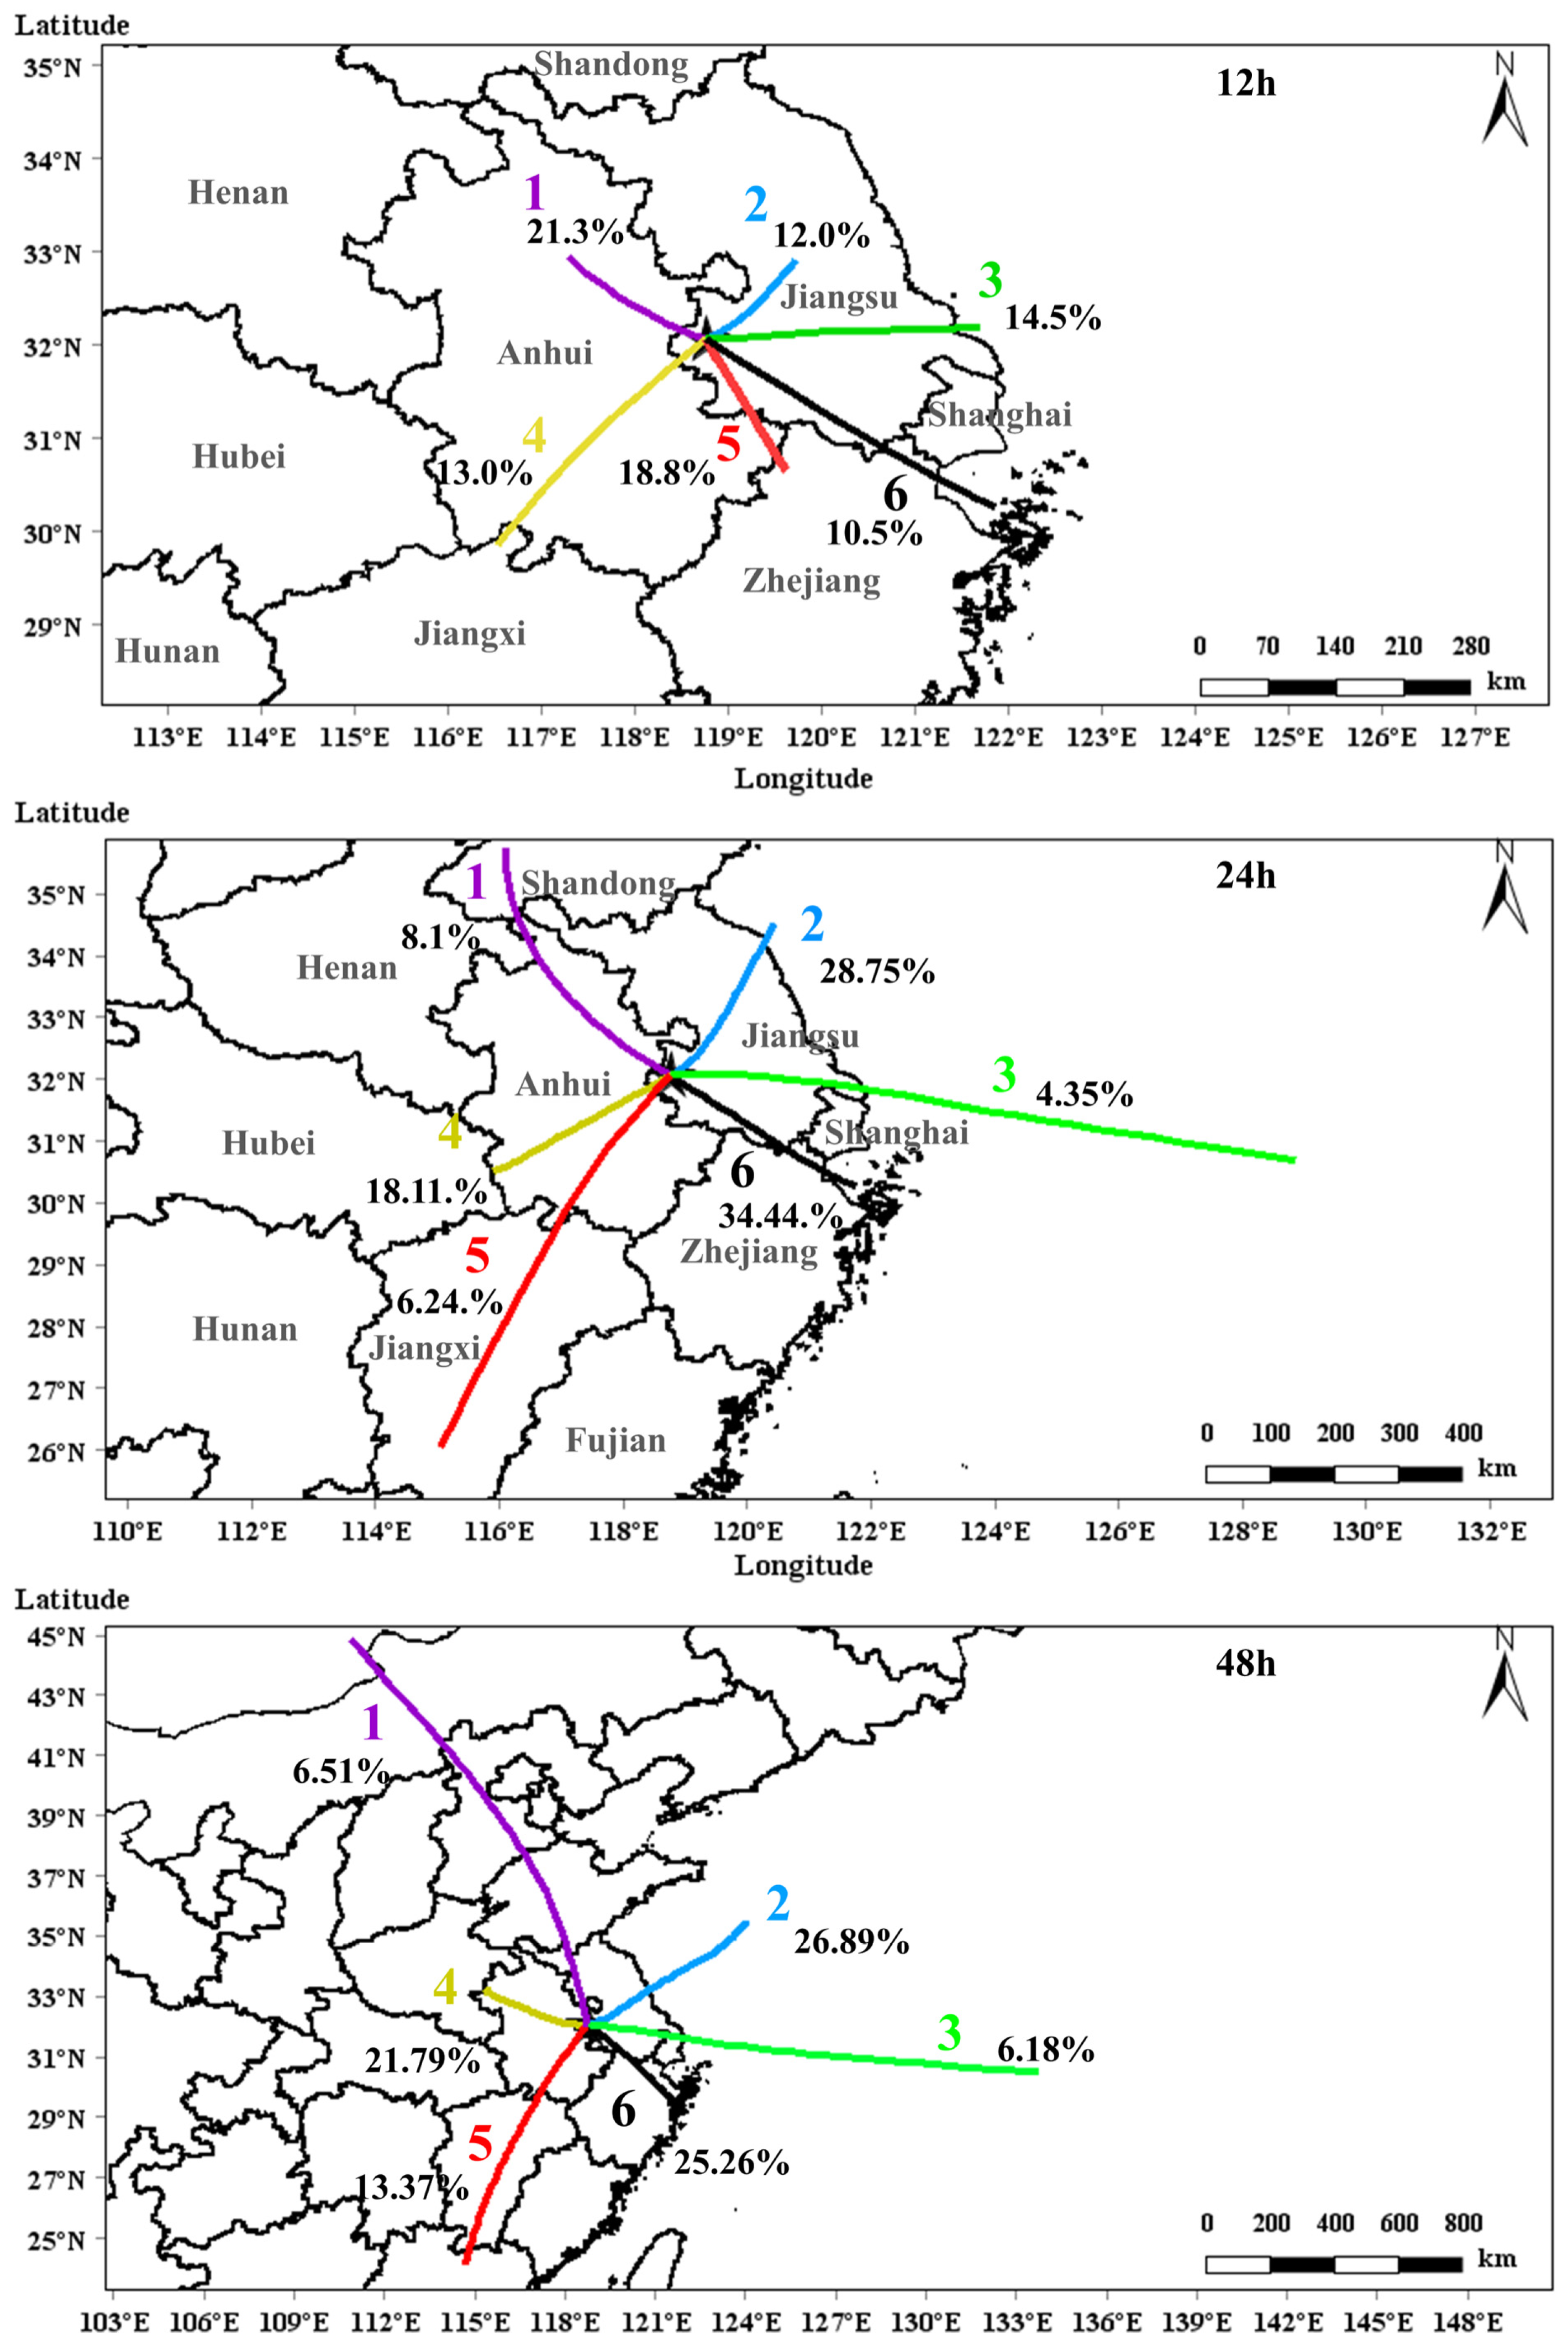
Figure 5 illustrates the six clusters of 12 h, 24 h, and 48 h backward-trajectory affecting urban Nanjing during April–September of 2020 and 2021 obtained using the MeteoInfo. The six clusters of 12 h backward trajectories indicate that all air mass origins were located within the YRD region. The Cluster 1 originated from the northwest of Nanjing, traveled a short distance across northern Anhui Province to reach the NJ site, and accounted for 21.3% of total air mass trajectories. The Cluster 2, representing air masses from the northeast that traversed central Jiangsu Province, constituted 12.0% of total trajectories. Originating east of Nanjing, the Cluster 3 tracked back to the southeast coastal area and traversed the southern Jiangsu Province, representing 14.5% of the total trajectories. The Cluster 4 originated from the southwest, with its source region in southern Anhui Province, and accounted for 13.0% of the total trajectories. The Clusters 5 and 6 both originated from the southeast of the YRD regions but exhibited different transport distances and source locations. The Cluster 5 followed a more southerly and shorter transport path, originating near the intersection of Jiangsu, Zhejiang, and Anhui provinces, and accounted for 18.8% of air mass trajectories. In contrast, the Cluster 6 involved long-range transport from the East China Sea off the coasts of northern Zhejiang Province and Shanghai, passing through southern Jiangsu and northern Zhejiang Province before reaching NJ, accounting for 10.5% of all trajectories. Air masses from eastern and southeastern pathways (Clusters 3, 5, and 6) accounted for 43.8% of the total trajectories, consistent with the observed prevailing east and southeast winds during April–September based on ground wind speed and direction measurements (Figure 4).
Analysis of the 24 h backward trajectories indicated that, like the 12 h trajectories, the dominant air mass origin was the southeast (Cluster 6, 34.4%). However, a key distinction in the 24 h results was the substantial increase in northeasterly trajectories (Cluster 2, 28.8%), while contributions from the northwest (Cluster 1, 8.1%) and east (4.35%) decreased. Two separate southwesterly clusters were identified: a shorter-range trajectory from southern Anhui Province (Cluster 4, 18.1%) and a long-range trajectory from Jiangxi Province (Cluster 5, 6.24%). When extending the trajectory duration to 48 h, the contribution of long-range southwesterly transport (Cluster 5) more than doubled to 13.4%. Furthermore, the short-range southwesterly air mass observed in the 24 h analysis (Cluster 4) shifted, becoming a short-range northwesterly-by-westerly cluster that accounted for 21.8% of the 48 h backward trajectories.
In this study, we focused on the influence of air mass transport on daytime (10:00–16:00) O3 concentrations. During this period, the reaction with OH radical is the dominant removal pathway for NMHCs [45]. Assuming the OH-oxidation of NMHCs follows a pseudo-first-order process, the atmospheric lifetimes (τ) of NMHCs can be calculated using the following equation:
τ i = 1 O H k O H , i
where [OH] represents the average concentration of OH radical during 10:00–16:00, which was assumed to 5 × 10⁶ molecule cm−3 according to the OBM-simulated OH concentrations, which is consistent with the value for Shanghai [45]; kOH,i denotes the reaction rate constant of species i with OH radical. Based on this assumption, the τ values for the 57 NMHCs ranged from 0.83 to 224 h. Notably, 47 of these species (approximately 80%) had τ values shorter than 12 h. Consequently, given the short atmospheric lifetime of many NMHCs, we selected the 12 h backward trajectory results for our analysis of air mass transport’s influence on O3 and its precursors.

3.3. Characteristics of O3 and Its Precursors During Four O3 Pollution Episodes

3.3.1. Temporal Variations in Concentrations of O3 and Its Precursors

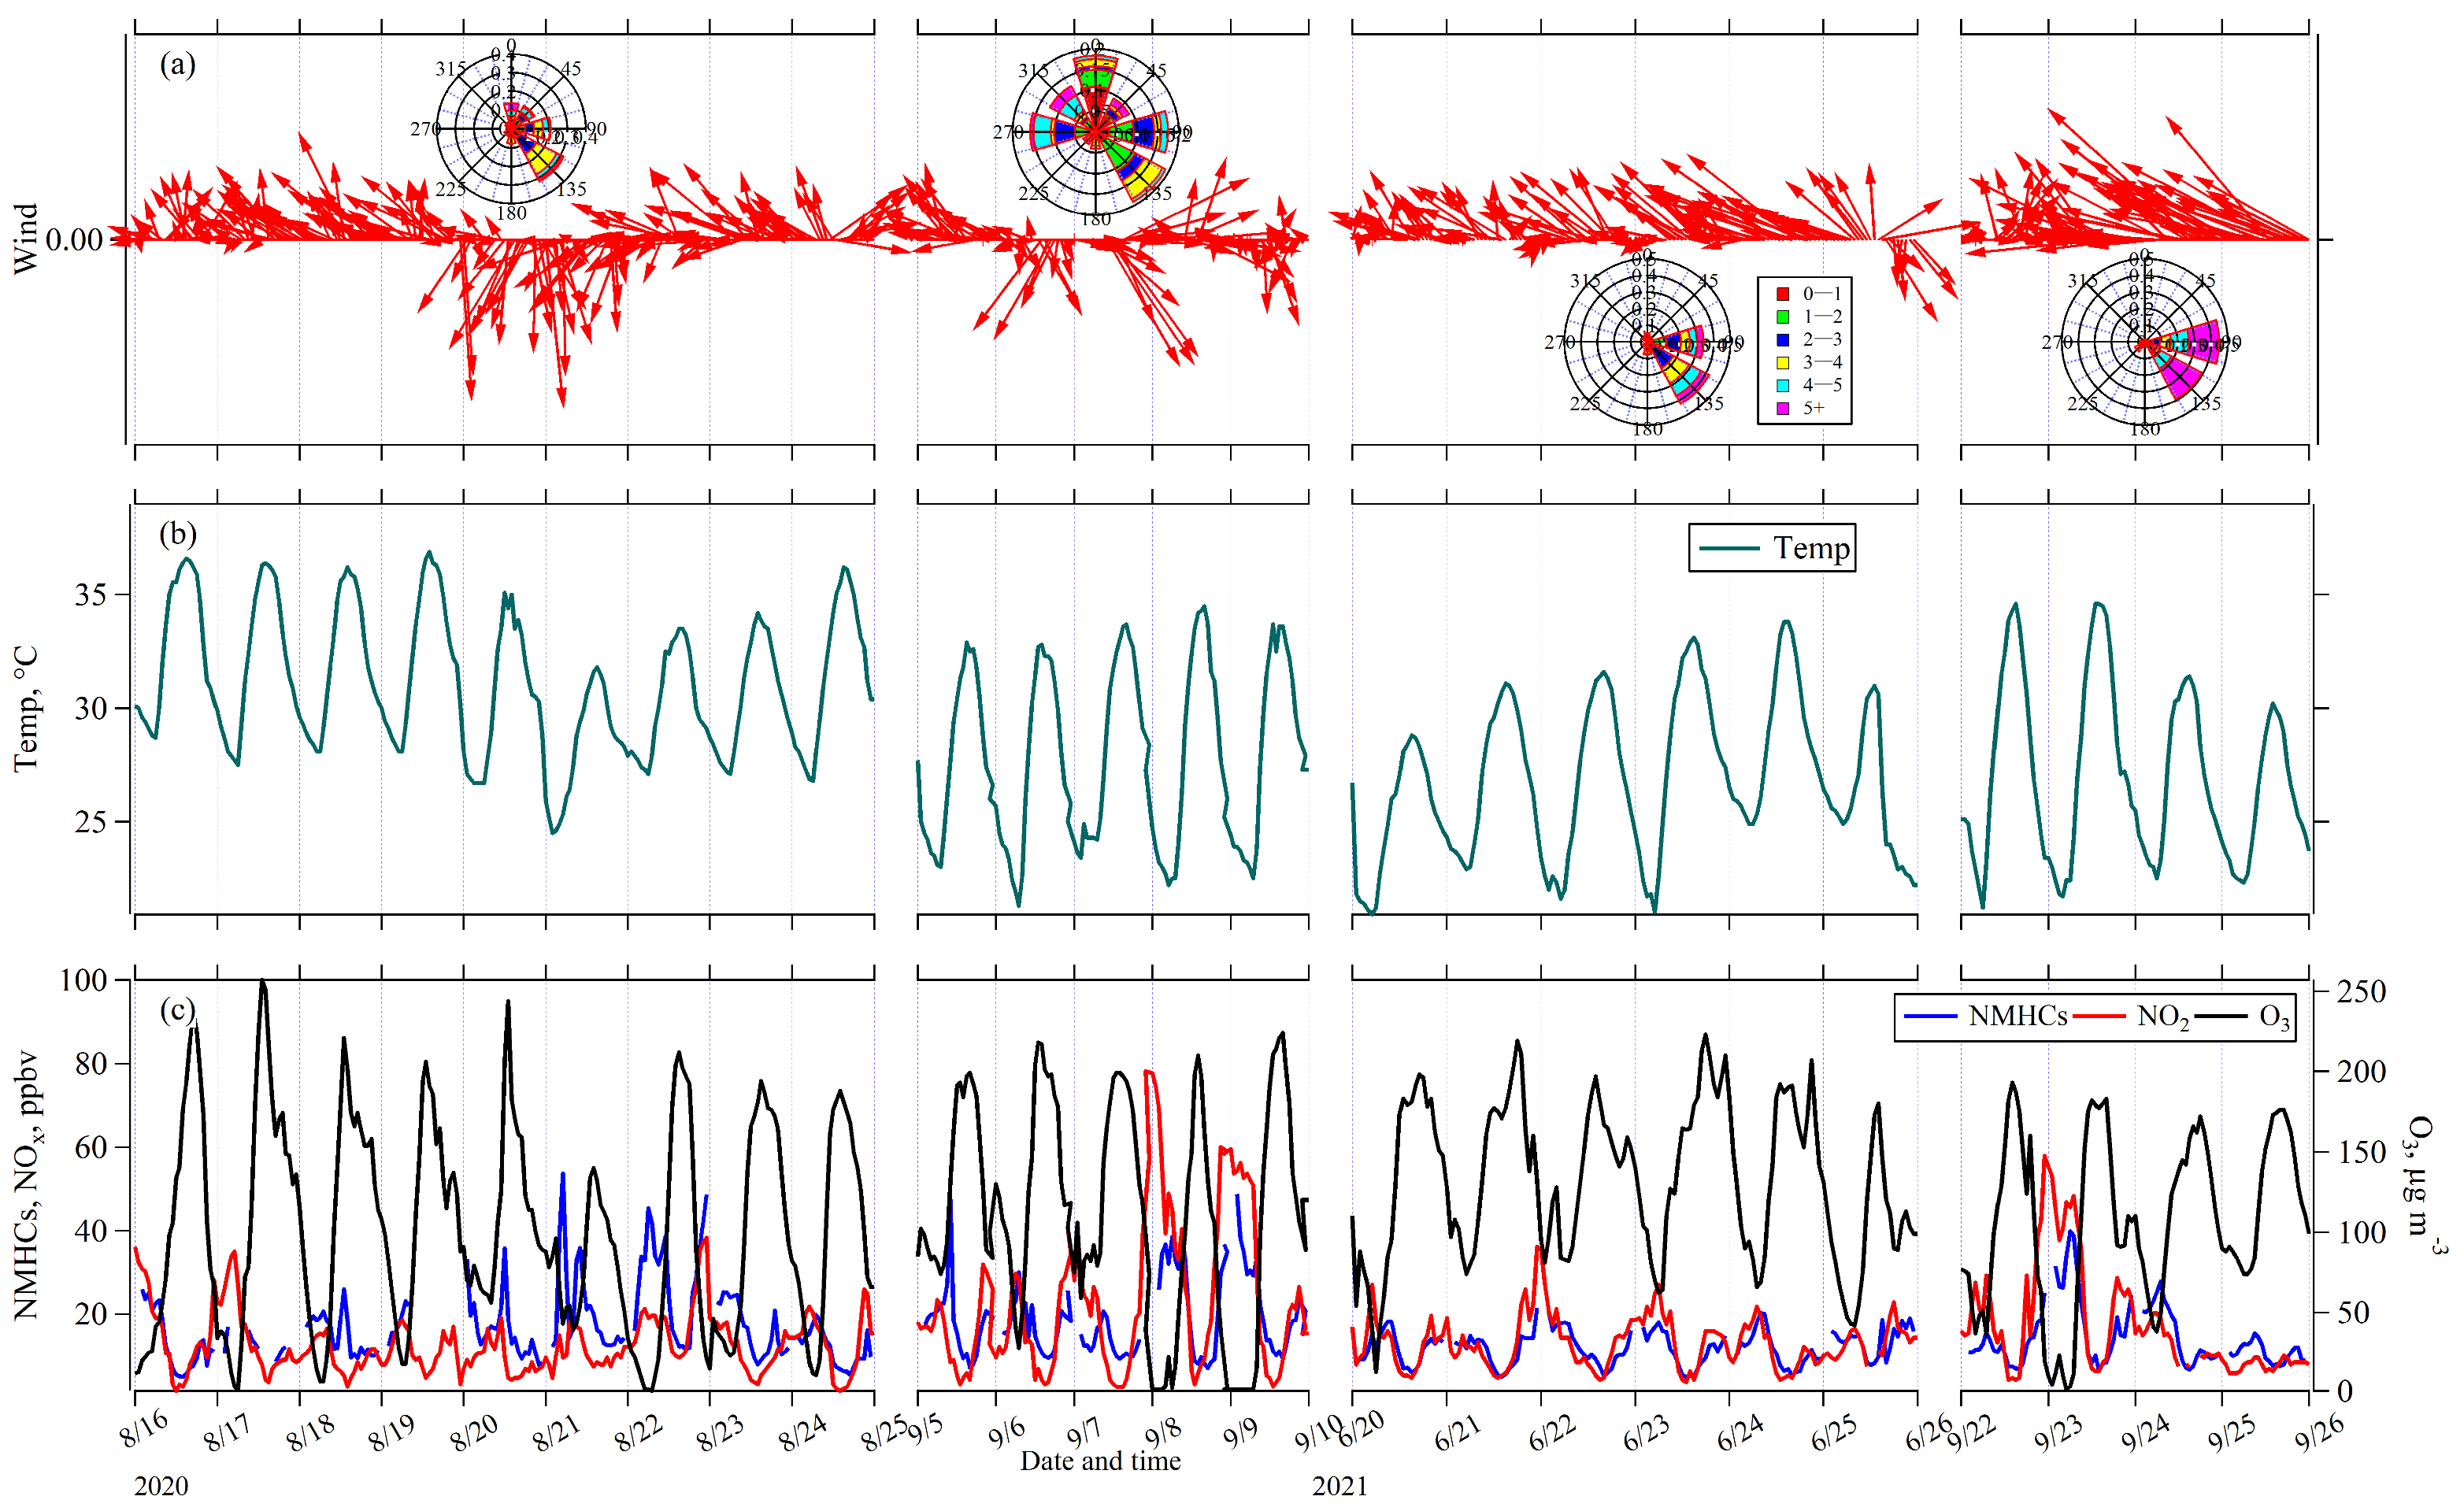
In this study, four O3 pollution episodes were selected for further analyses to evaluate the influence of air mass transport on O3 and its precursors NMHCs and NO2: 16–24 August 2020 (Episode I); 5–9 September 2020 (Episode II); 20–25 June 2021 (Episode III); and 22–26 September 2021 (Episode IV). Figure 6 presents the temporal variations of wind, temperature, O3, NMHCs, and NO2 concentrations during these four episodes. During four episodes, O3 exhibited a diurnal pattern characterized by elevated concentrations during early afternoon hours (13:00–15:00) and lower concentrations during nighttime (01:00–06:00). These patterns are consistent with typical photochemical O3 production driven by solar radiation [46]. In contrast, NO2 and NMHCs peaked during nighttime and early morning, showing an inverse diurnal variation pattern compared to O3. Hourly O3 concentrations exceeding 160 μg m−3 were recorded during these four episodes, with exceeding hours of 55 h, 37 h, 53 h, and 27 h, respectively. The average O3 concentrations during these hours for Episodes I through IV were 187, 194, 184, and 174 μg m−3, respectively. Meanwhile, the highest average NMHCs mixing ratio (12.80 ppbv) was observed in Episode I, followed by Episode II (11.40 ppbv), Episode III (8.95 ppbv), and Episode IV (8.92 ppbv). Conversely, the average NO2 mixing ratios peaked in Episode III (9.5 ppbv), followed by Episode IV (7.7 ppbv), Episode I (7.2 ppbv), and Episode II (6.2 ppbv). These results indicated that O3 concentrations were not linearly related to NMHCs and NO2, highlighting the intricate influences from air mass transport or O3 formation sensitivity.
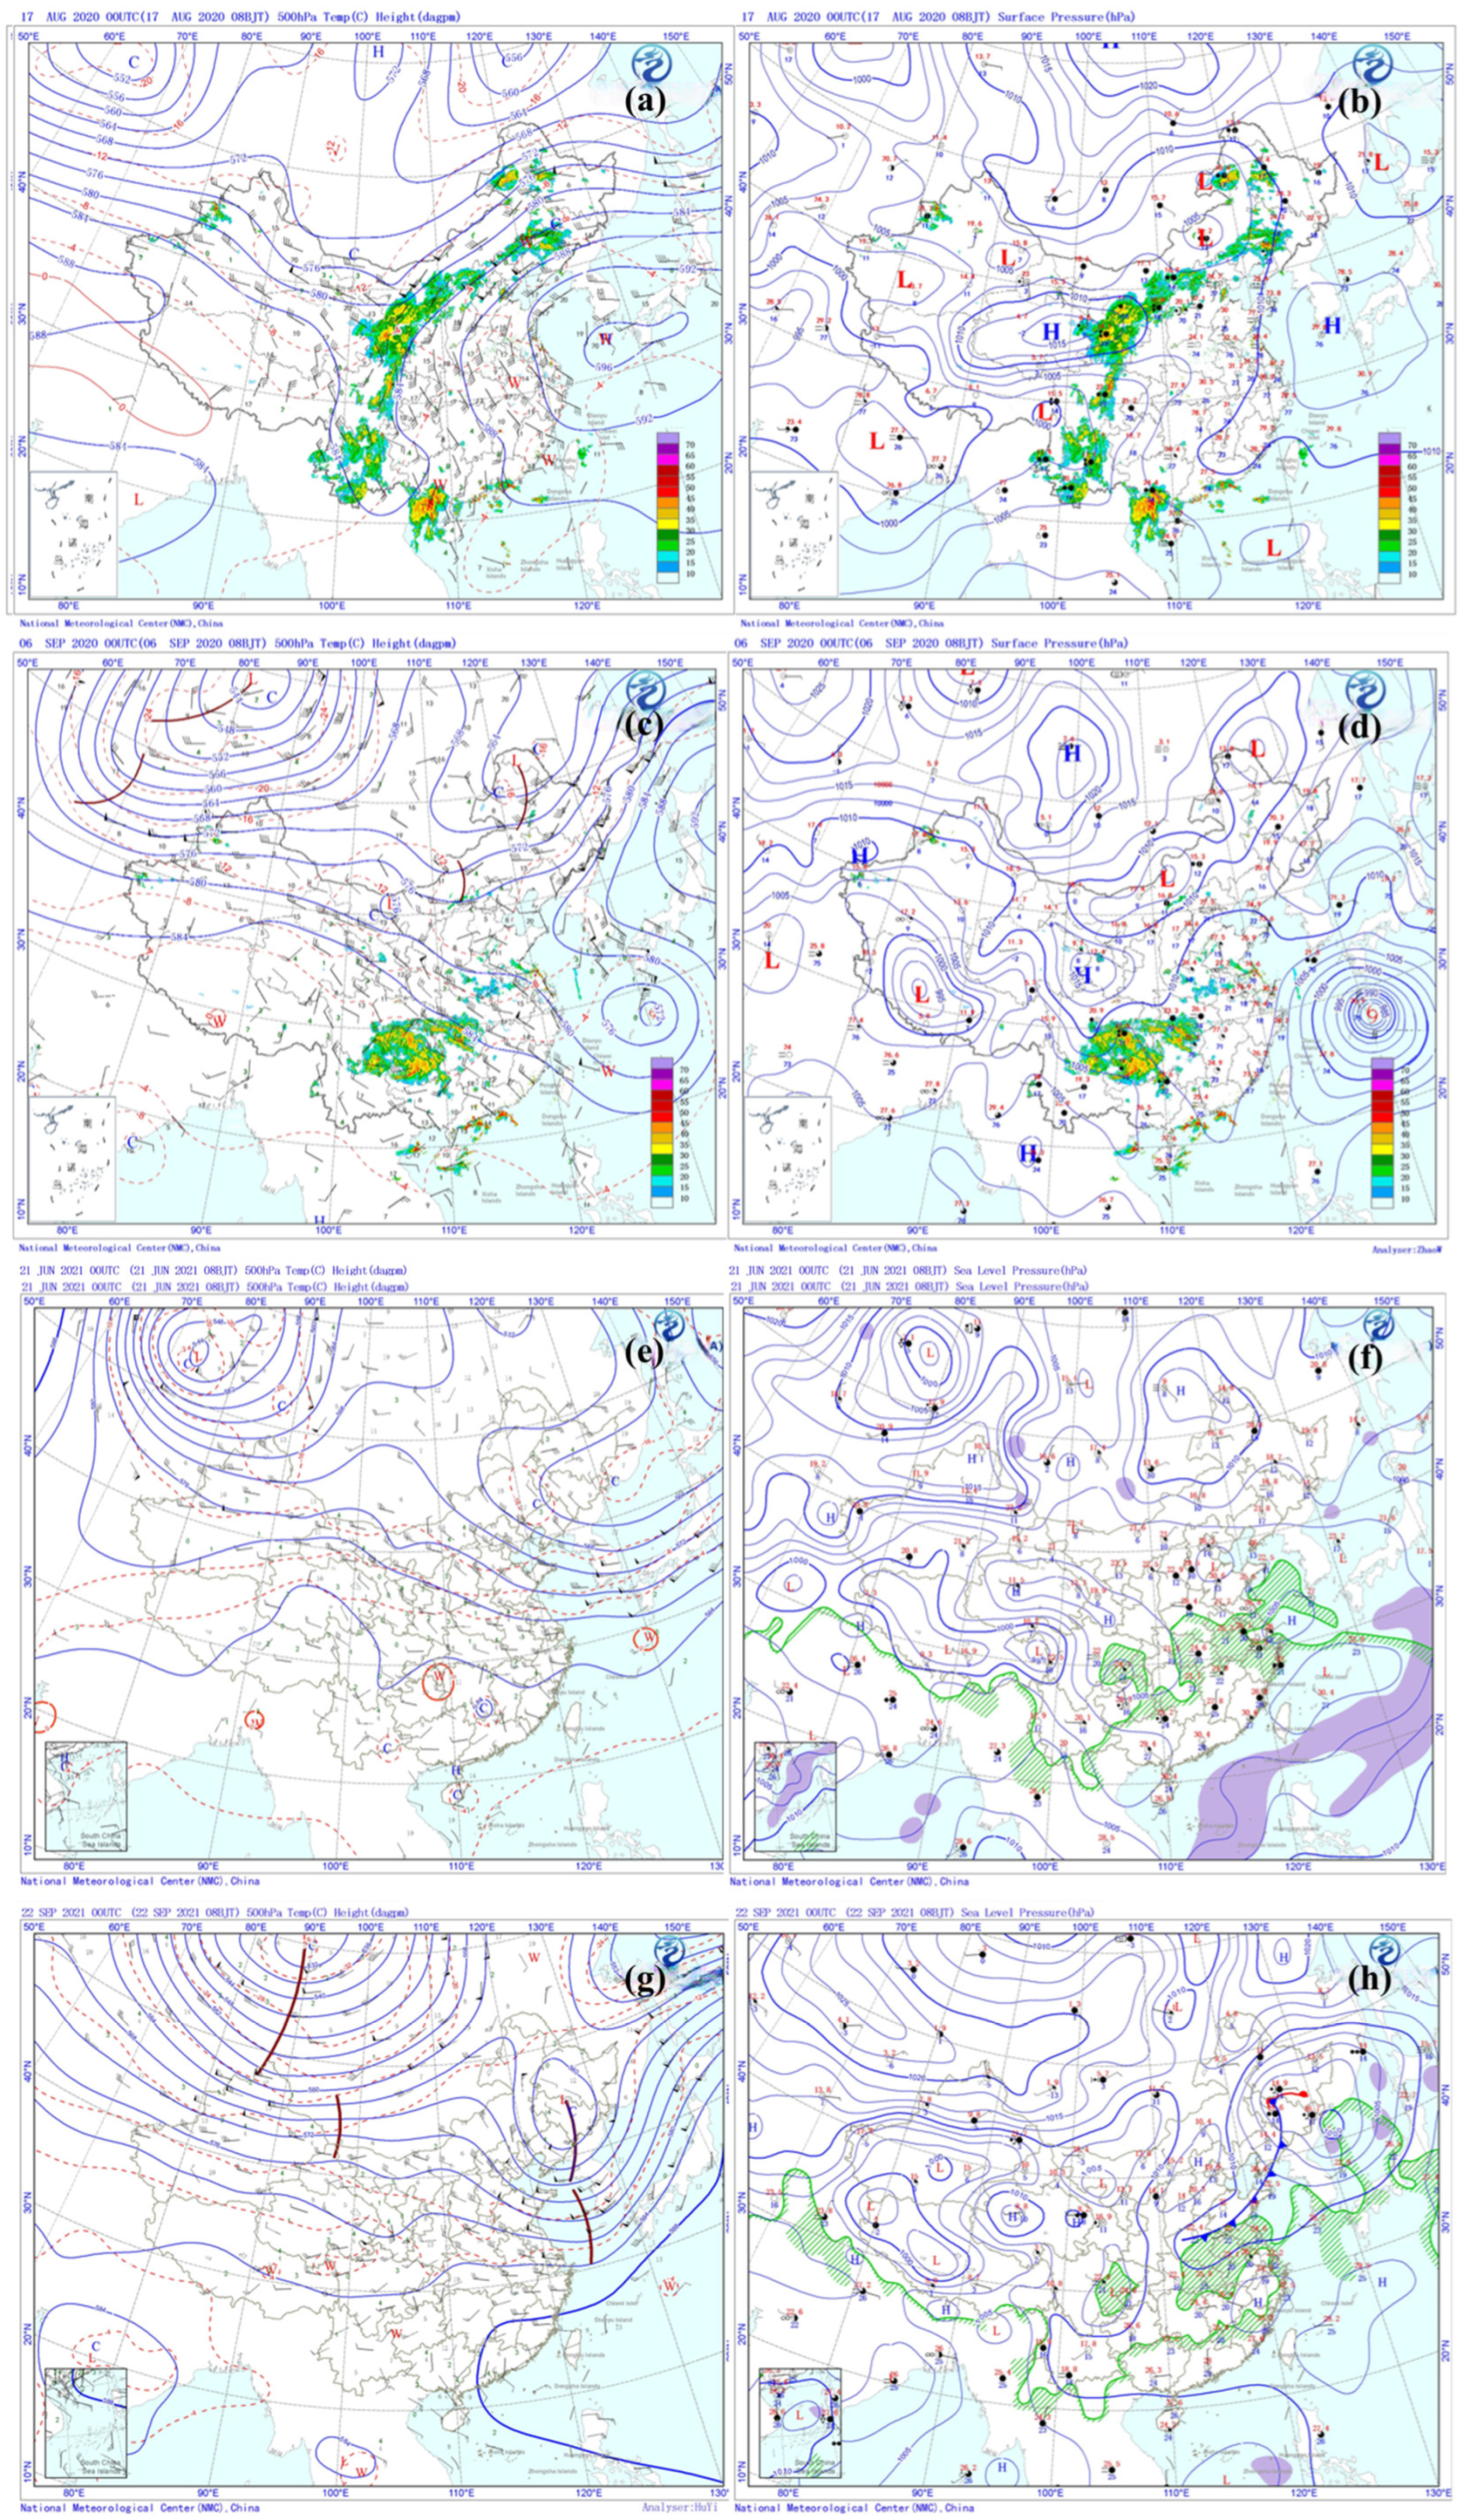
As depicted in Figure 7a, Nanjing and the YRD region were under the influence of a strong western Pacific subtropical high at 500 hPa on 17 August 2020, during Episode I. This dominant high-pressure system created conditions highly conducive to O3 formation, including strong sinking air, clear skies, and weak vertical mixing. Concurrently, the surface weather chart (Figure 7b) indicates that Nanjing was situated at the rear of a weak high-pressure system, experiencing prevailing southeasterly winds. These winds played a crucial role in transporting O3 and its precursors from the southeastern YRD towards Nanjing, aligning with the observed wind directions at monitoring sites (Figure 6a).
For 5 September 2020, during Episode II, Nanjing was located on the northwestern edge of the outer circulation of Super Typhoon Haishen at 500 hPa (Figure 7c). This positioning resulted in the area being affected by northwesterly winds and significant downward air movement, which effectively limited vertical mixing. At the surface, Figure 7d shows conditions dominated by a uniform pressure field with light southeast and southwest winds. These stable surface conditions were unfavorable for the horizontal dispersion of O3 and its precursors near the ground. During this episode, the average wind speed (2.33 m/s) was the lowest among the four episodes, and wind direction was complex, with influences from the north, southeast, and east (Figure 6a).
Episodes III (21 June 2021) and IV (22 September 2021) exhibited similar 500 hPa weather patterns (Figure 7e,g). Nanjing and the YRD region were influenced by northwesterly flow, situated behind a moving upper trough. This atmospheric configuration led to strong sinking motion and a prominent temperature inversion, both of which severely restricted the vertical dispersion of air pollutants. The accompanying descending dry air further enhanced clear-sky radiation. At the surface, the weather charts (Figure 7f,h) simultaneously show distinct but consistently stable atmospheric conditions. On 21 June Nanjing experienced a weak saddle-shaped pressure field, while on 22 September, it was situated within a weak warm sector ahead of a front. The predominant winds during these two episodes were both from the southeast and the east (Figure 6a).

3.3.2. Sensitivity of O3 Formation to NMHCs and NOx

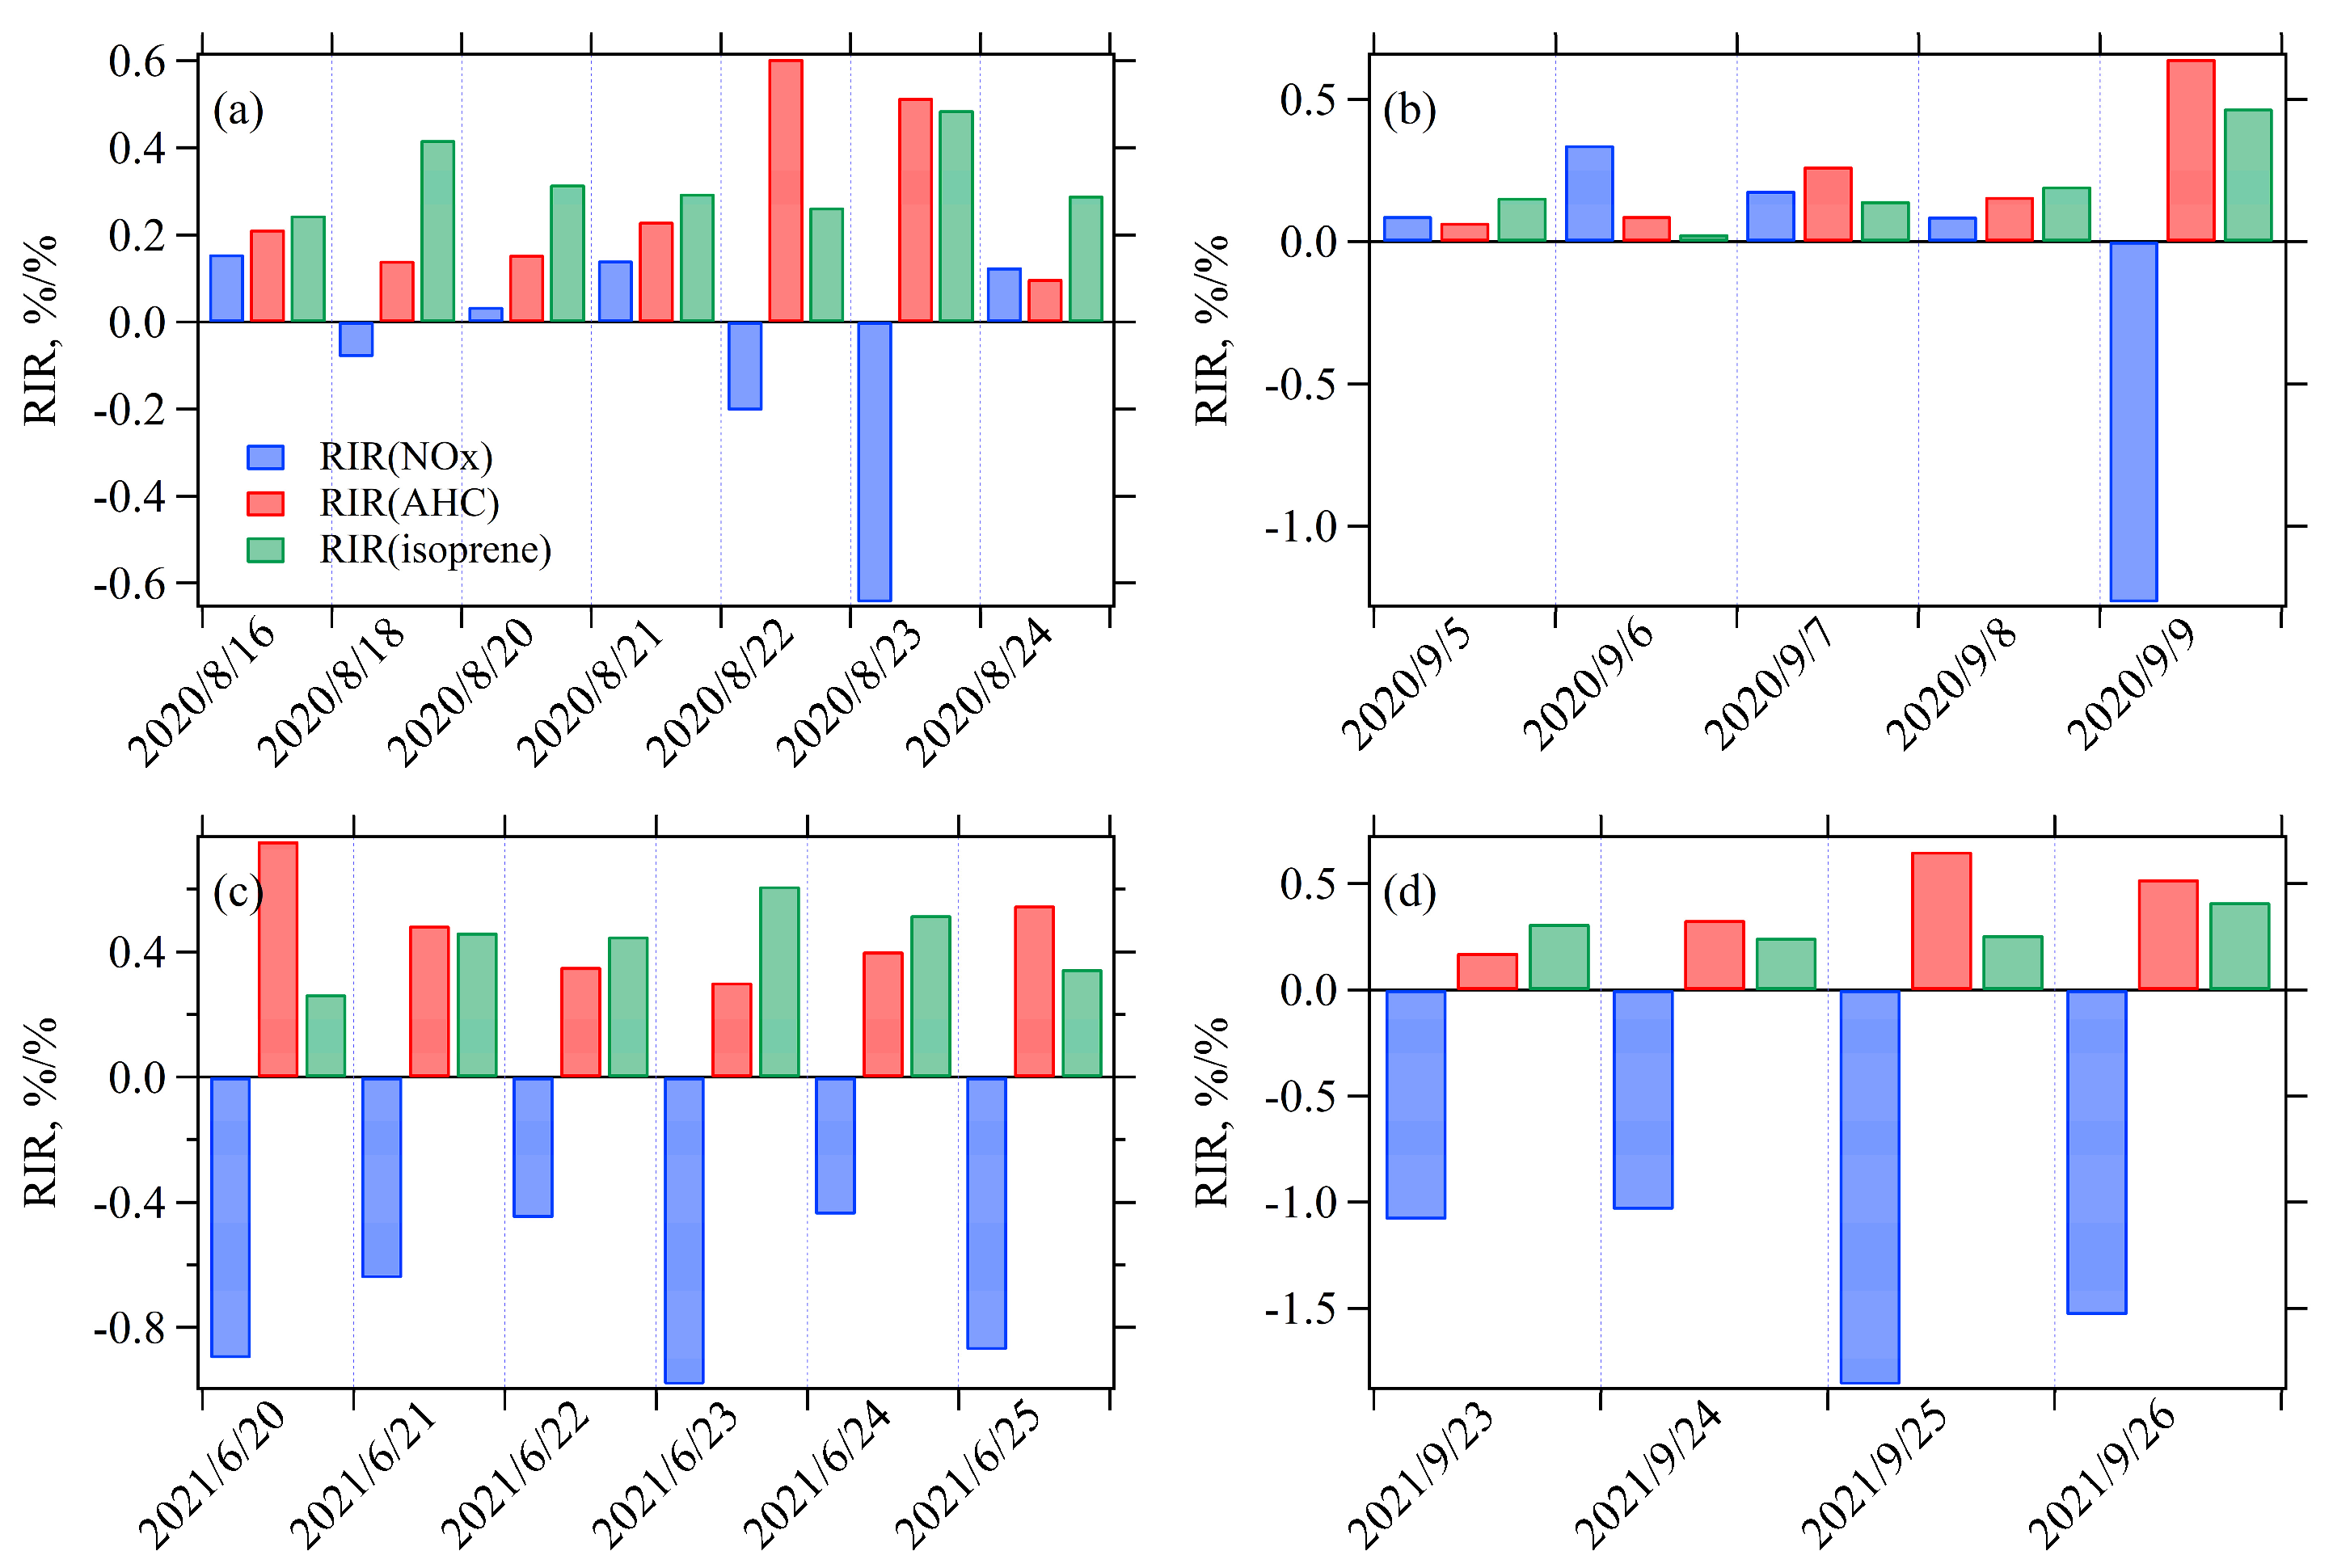
Figure 8a–d displays the average RIR values of NOx, isoprene (mainly from biogenic emissions), and anthropogenic hydrocarbons (AHC) during four O3 episodes. During Episode I, the RIR(NOx) was negative for three days (18, 22, and 23 August 2020), and the RIR(NOx)/RIR(AHC) was 0.23 on August 20, 2020, indicating NMHCs-limited O3 sensitivity on these four days. For the other three days, the RIR(NOx)/RIR(AHC) ratios ranged from 0.62 to 1.27, suggesting the O3 sensitivity in the transition regime. During Episode II, the RIR(NOx) was negative on 9 September 2020 (indicating NMHCs-limited regime), while the RIR(NOx)/RIR(AHC) ratios ranged from 0.56 to 1.36 on three days (transition regime) and reached 3.8 on September 6, 2020 (NOx-limited regime). During Episodes III and IV, RIR(NOx) was negative on all days, suggesting NMHCs-limited O3 sensitivity. Furthermore, across the four episodes, RIR(isoprene) approximated RIR(AHC) on 10 days (with ratios of 0.7–1.3), yet surpassed it on seven days (with ratios > 1.3). These findings highlight the significant contribution of biogenic emissions to O3 formation, with biogenic reactivity reaching comparable or exceeding levels of anthropogenic NMHCs during certain days. This suggests that under specific atmospheric conditions, biogenic emissions can play an equally, or even more, critical role than anthropogenic pollutants in driving O3 formation. This vital insight for O3 control strategies underscores the need to consider both anthropogenic and biogenic influences.

3.4. Potential Source Regions of O3 and NMHCs

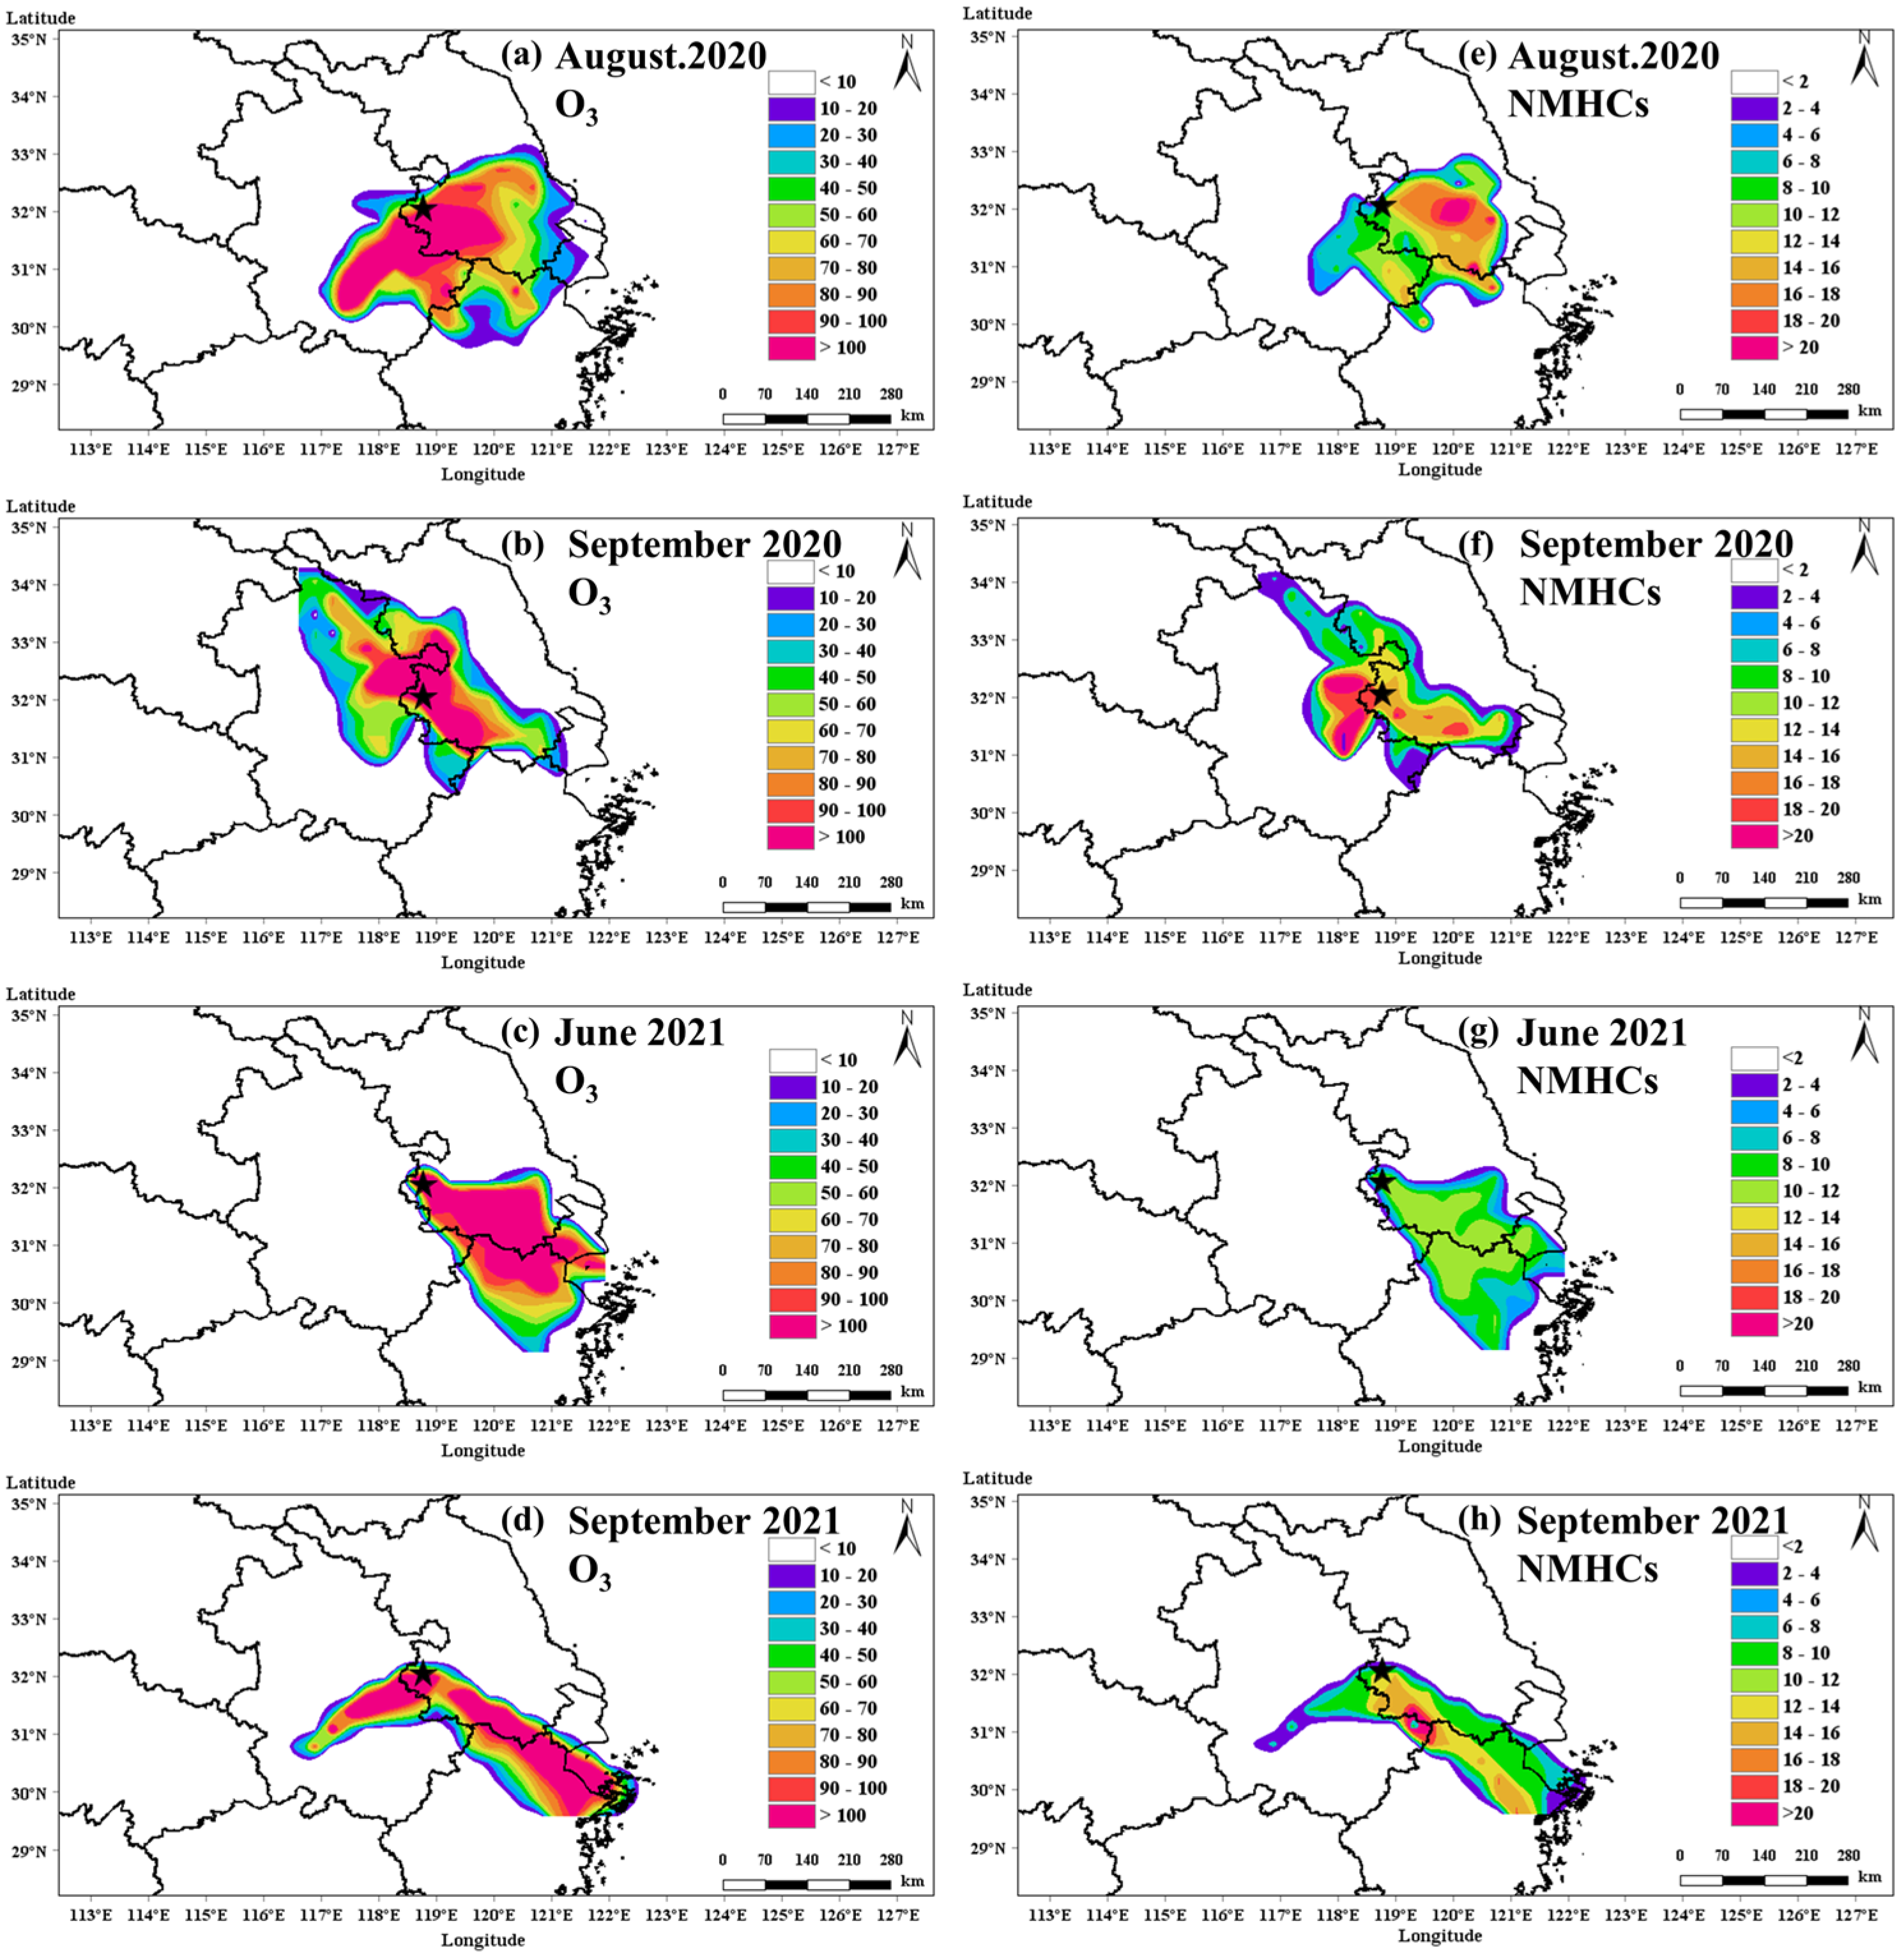
Figure 9a–d presents the spatial distribution of WCWT values for O3 during the four O3 pollution episodes. During Episode I, high WCWT values for O3 were distributed across a broad area to the east, southeast, south, and southwest of the NJ site, extending from the southeastern coastal region of Jiangsu Province to southern Anhui Province (Figure 9a). In contrast, O3 WCWT hotspots during Episode II were primarily located northwest and southeast of the NJ site (Figure 9b). During Episodes III and IV, the high WCWT regions were primarily situated to the southeast, encompassing major urban areas along the Yangtze River in Shanghai, southern Jiangsu Province, and northern Zhejiang Province (Figure 9c,d). Compared to Episodes I and II, the contributions from northern regions were notably lower in Episodes III and IV. Additionally, Episode IV showed a secondary WCWT hotspot to the southwest of the NJ site.
The spatial distribution of WCWT values for NMHCs exhibited some differences from that of O3. In Episode I, the NMHCs WCWT hotspot was primarily concentrated to the east of the NJ site, with no high values were observed in the southwest despite elevated O3 contributions from that direction (Figure 9e). This discrepancy likely arises because southwestern areas like southern Nanjing and southern Anhui Province, characterized by high vegetation cover and limited anthropogenic activity [47], are unlikely major source regions of total NMHCs, which are influenced by both biogenic and anthropogenic sources [48]. Nonetheless, biogenic NMHCs such as isoprene, emitted during air mass transport across vegetated regions, can undergo photochemical reactions and enhance O3 formation. In Episode II, high NMHCs WCWT values were concentrated to the west, south, and southeast of the NJ site, particularly in urban and industrial areas such as Changzhou, Suzhou, and Wuxi in Jiangsu Province (Figure 9f). During Episodes III and IV, NMHCs hotspots were also observed to the southeast, encompassing southern Jiangsu Province, northern Zhejiang Province, and Shanghai (Figure 9g,h). Consistent with the emission inventory developed by An et al. (2021) [48], these regions are recognized as non-methane VOCs (NMVOCs) and NOx emission hotspots along the Yangtze River, with significant contributions also from power plants and the automotive sector in central and eastern Anhui Province. These emisison inventory findings are largely consistent with the WCWT analyses in this study. However, it is also evident that variations in air mass back trajectories can lead to distinct shifts in the sources impacting the NJ site. Overall, the findings suggest that O3 and its precursor concentrations in urban Nanjing were strongly influenced by intra-regional transport within the Yangtze River Delta during these episodes, with industrial emissions from the southeast playing a particularly important role in elevating both O3 and NMHCs levels.

4. Discussion

4.1. Influence of Air Mass Transport on O3 and Its Precursors Levels

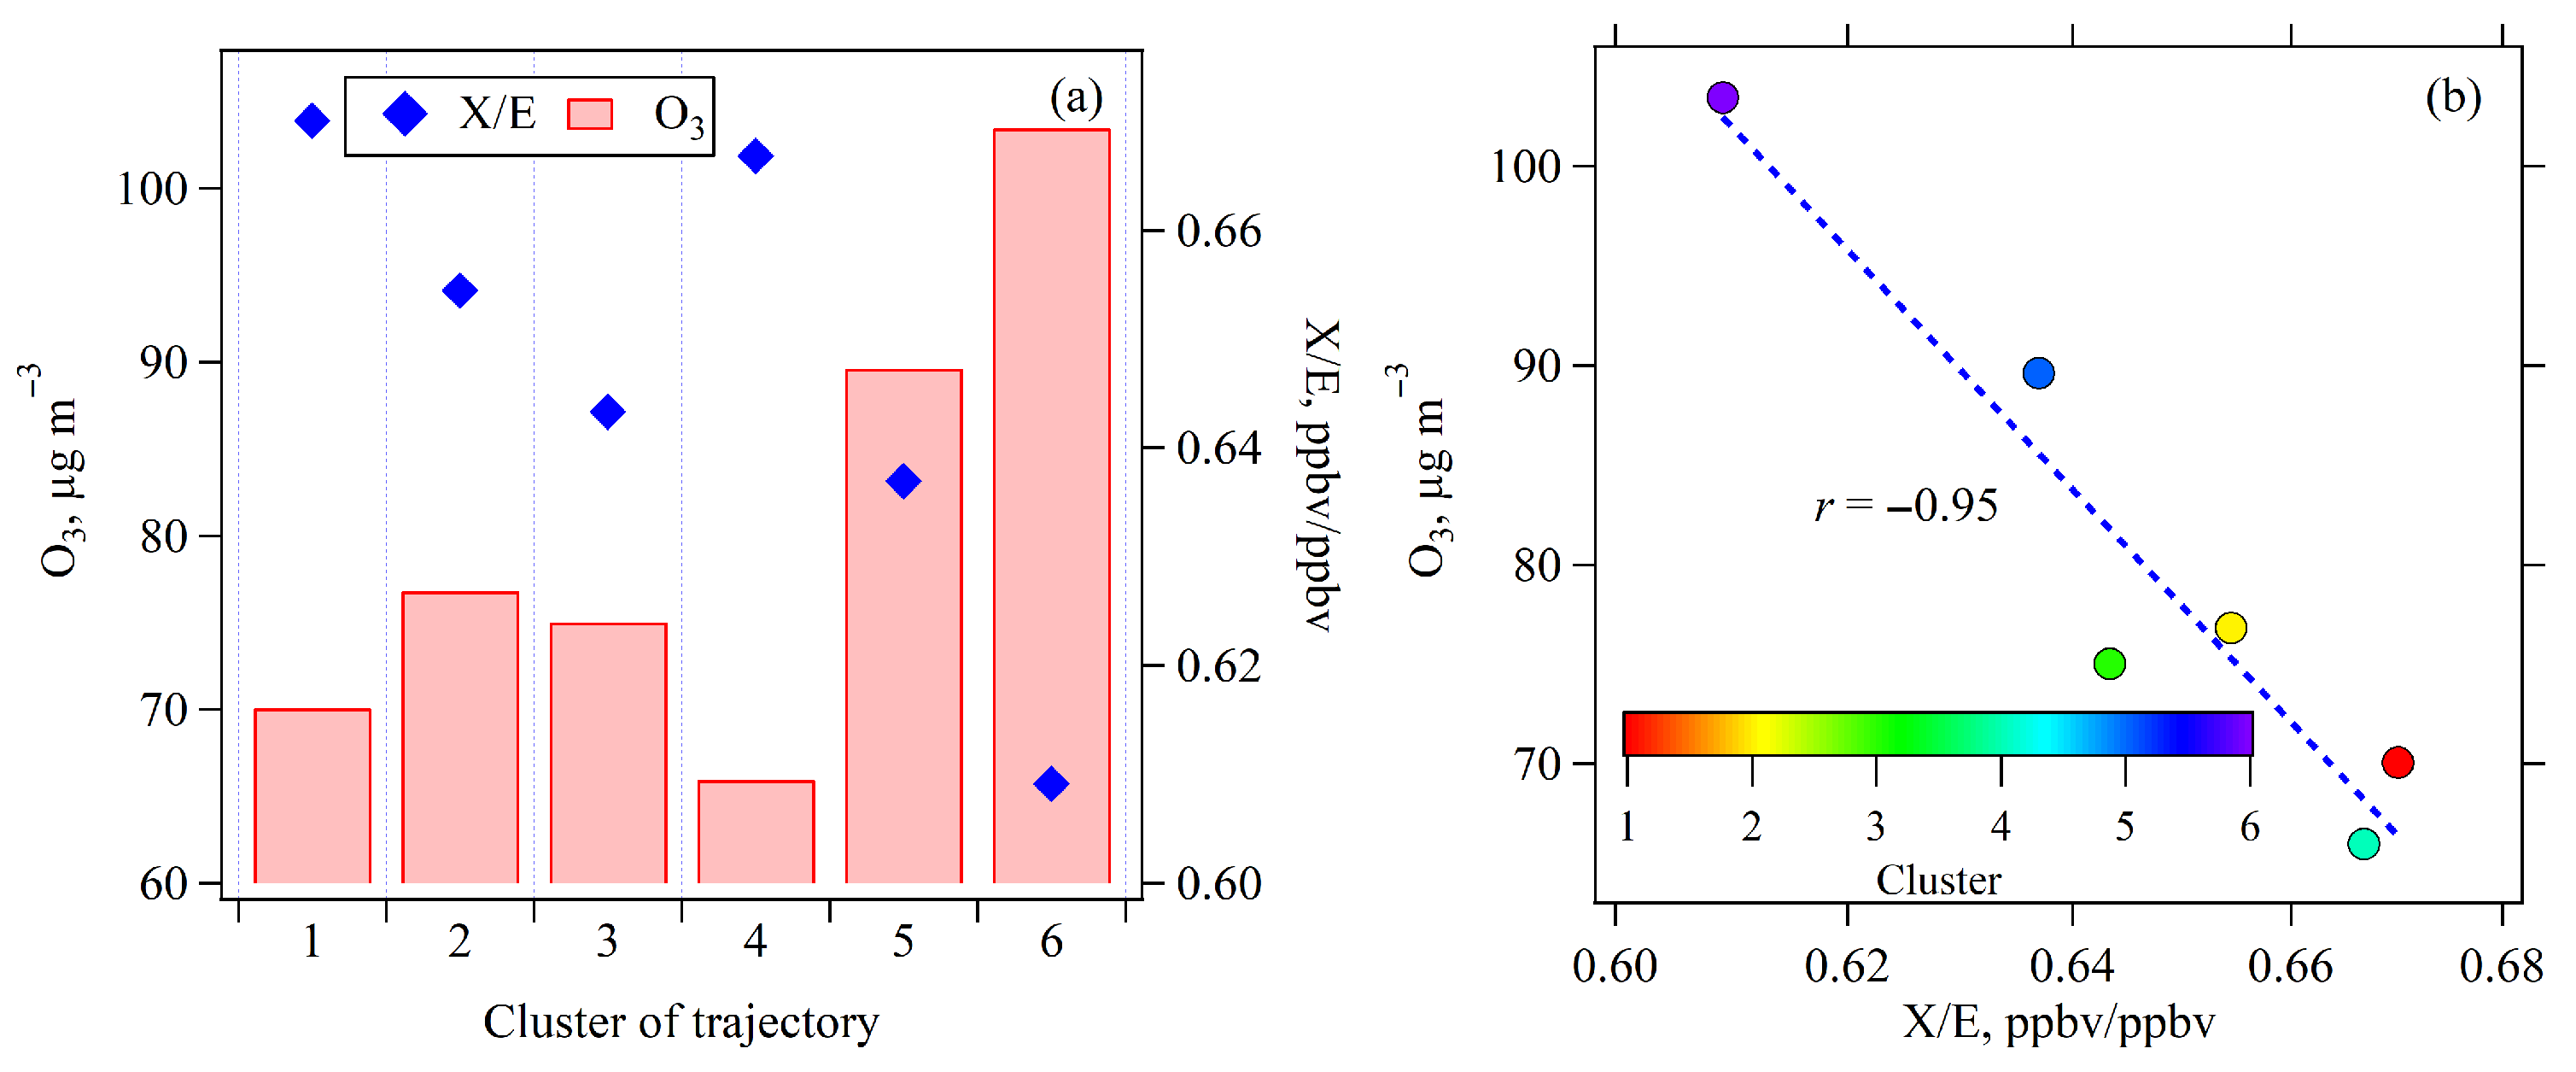
Figure 10a displays the average O3 concentrations observed between 10:00 and 16:00 during April–September of 2020 and 2021, categorized by the six identified air mass 12 h trajectory clusters. Notably, Cluster 6, originating from the east–southeast and characterized by long-distance back trajectories, exhibited the highest average O3 concentration (100 μg m−3), closely followed by Cluster 5 from the southeast (90 μg m−3). These results aligned with the high O3 WCWT values observed in the southeast regions across the four O3 pollution episodes (Figure 9). In contrast, Cluster 1, Cluster 2, and Cluster 3, originating from the north and northeast, showed moderate O3 levels (70–78 μg m−3), while Cluster 4 from the southwest recorded the lowest O3 concentration (65 μg m−3).
To further explore the relationship between air mass transport and O3 concentrations, the average ratios of o-xylene to ethylbenzene (X/E) during 10:00–16:00 were calculated for each trajectory cluster to indicate its photochemical aging degree. Considering that the emission ratio of o-xylene and ethylbenzene is relatively consistent, and given that o-xylene has a higher reactivity with OH radical than ethylbenzene, a lower X/E therefore indicates that air masses have undergone a longer period of atmospheric aging [49,50]. As presented in Figure 10b, average O3 concentrations exhibited a significant negative correlation with X/E ratios across the six trajectory clusters (r = −0.95, p < 0.05). This strong inverse relationship demonstrates that as air masses age (indicated by lower X/E values), O3 concentrations tend to increase. This pattern strongly suggests that photochemical reactions occurring during air mass transport are one of the important drivers of O3 formation.
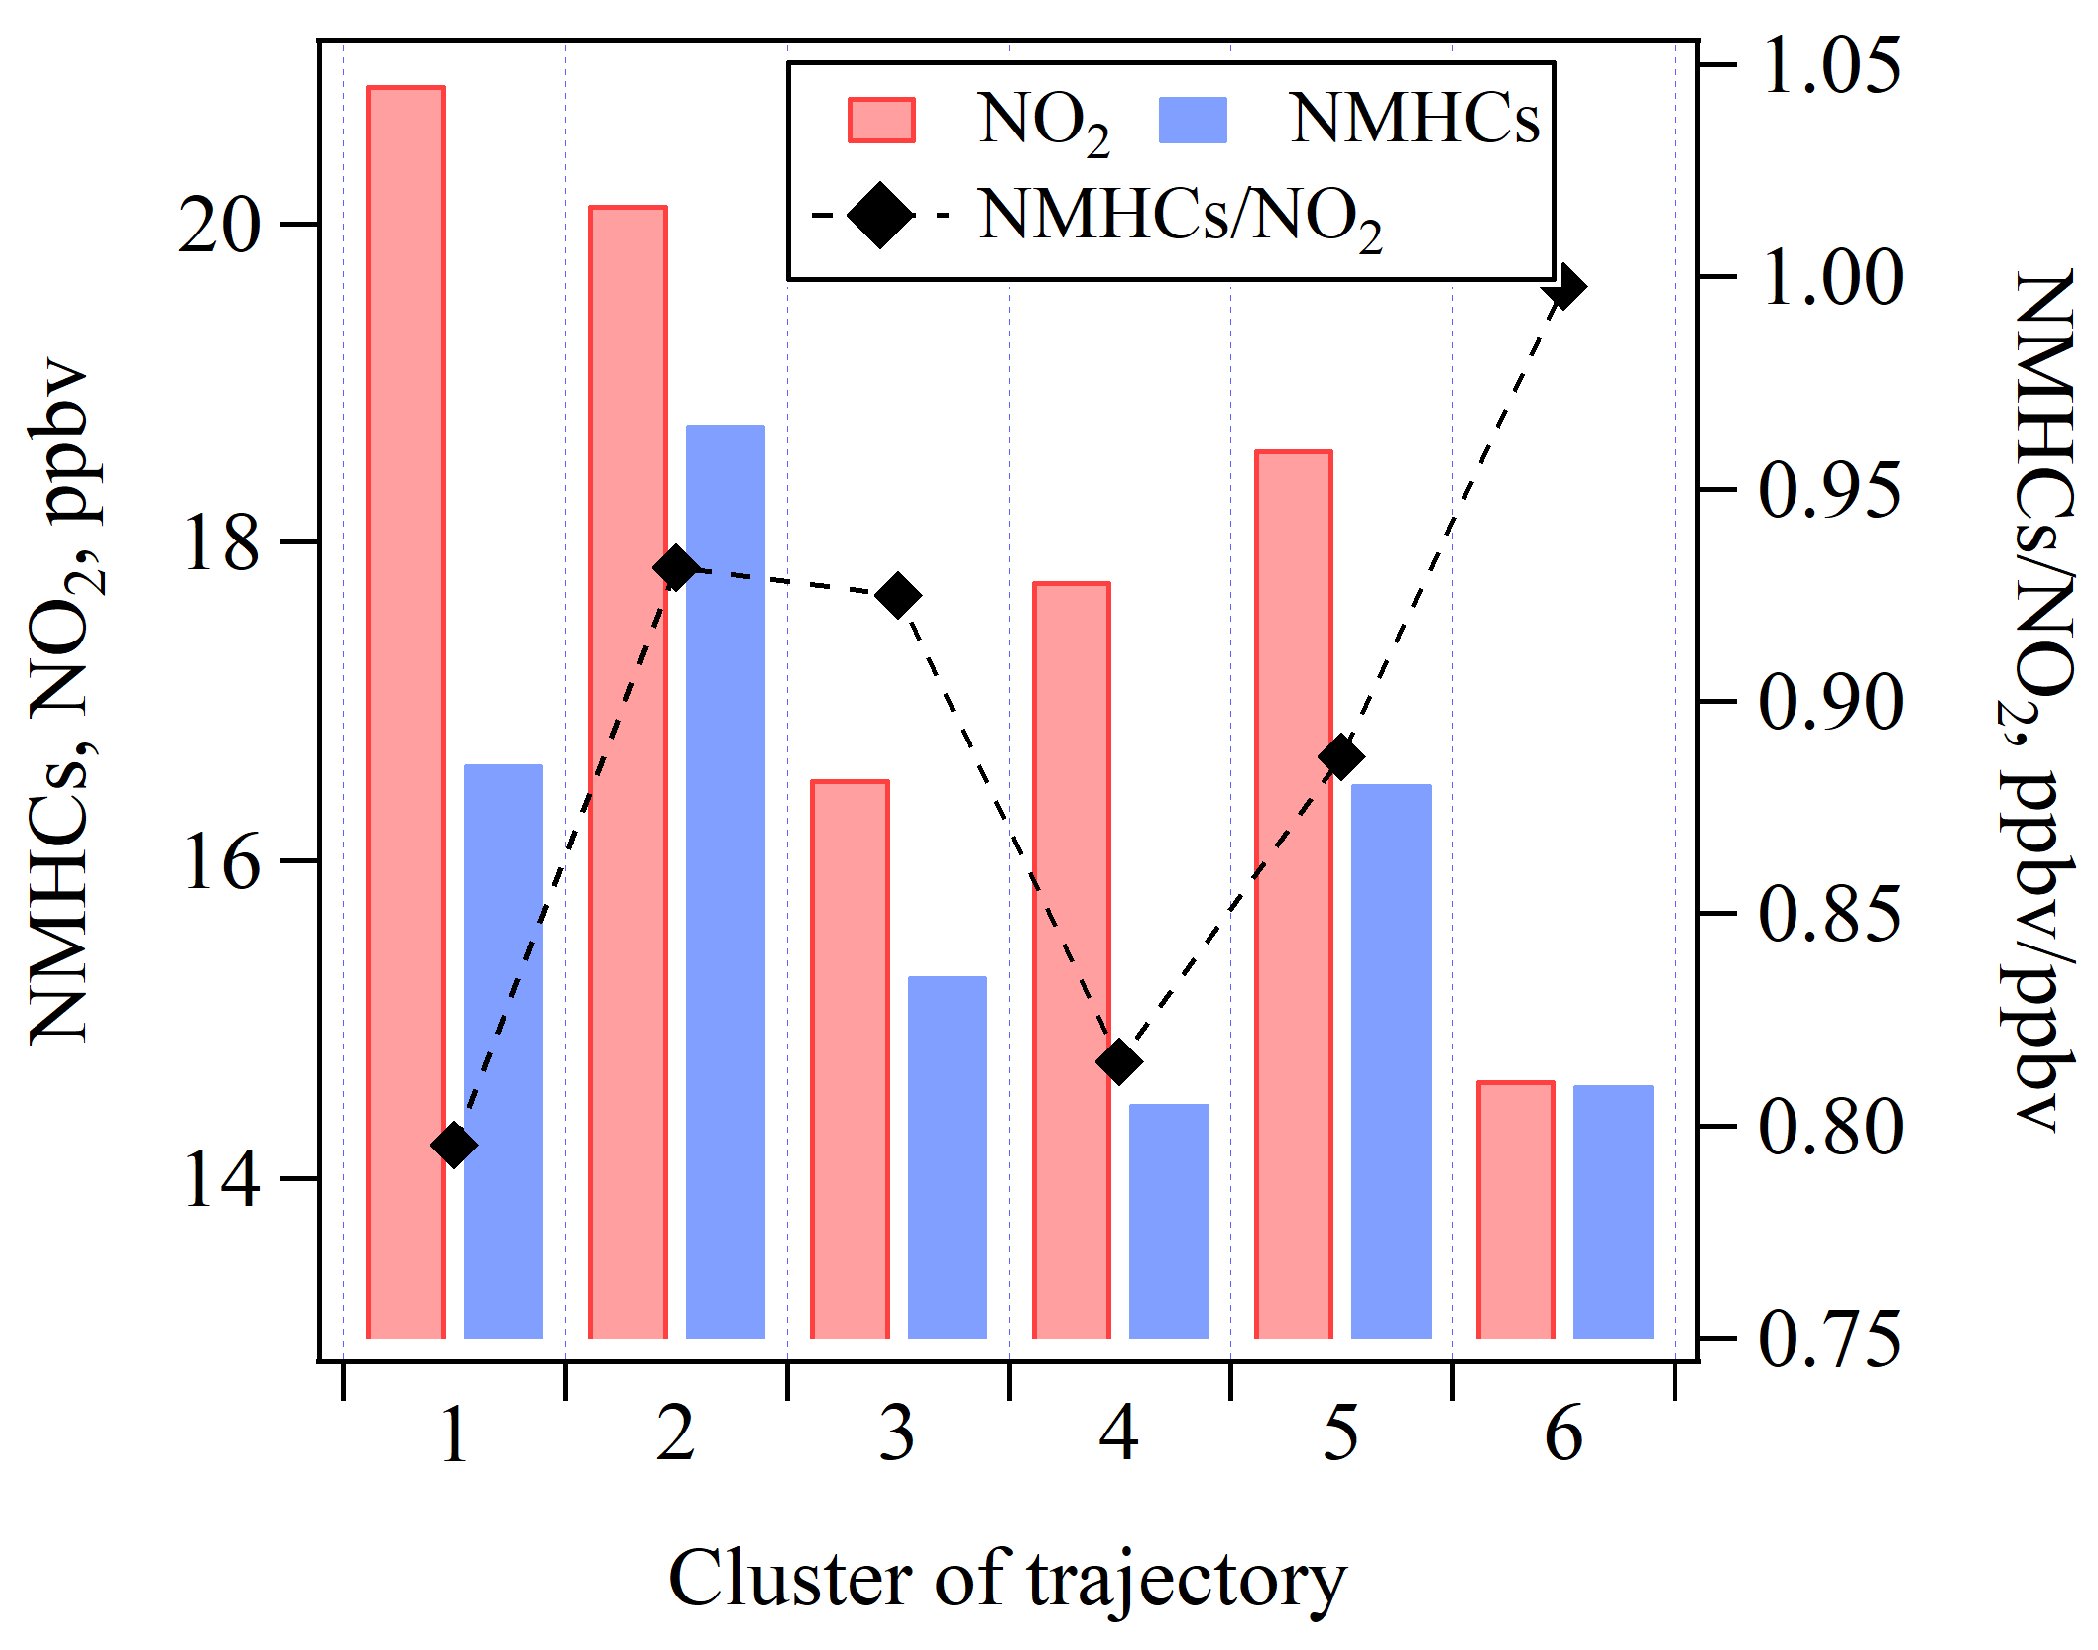
Figure 11 illustrates the average concentrations of NO2 and NMHCs, as well as the average ratio of NMHCs/NO2, for the six 12 h trajectory clusters. A comparison of Figure 10a and Figure 11 reveals that O3 levels are not directly determined by the absolute concentrations of its precursors. Notably, Cluster 6, which was associated with the highest O3 concentrations, exhibited lower levels of NO2 (14 ppbv) and NMHCs (14 ppbv) compared to the other trajectory clusters. However, this trajectory cluster exhibited the highest ratio of NMHCs/NO2. This may be attributed to the long transport distance of air mass, leading to differential photochemical aging of NMHCs and NO2, and potentially the spatial distribution of emission sources. Previous studies have shown that higher ratios of NMHCs/NO2 promote more efficient O3 formation due to enhanced radical propagation chains [4,51]. Consequently, the elevated NMHCs/NO2 ratio in Cluster 6 likely enhances O3 formation. In contrast, Clusters 1, 2, and 5 exhibited the highest NO2 and NMHCs concentrations. These air masses were associated with the shortest air mass transport distances (Figure 5), suggesting more stagnant meteorological conditions that potentially hinder air pollutants dispersion and lead to the accumulation of locally emitted NMHCs and NOx. However, despite higher precursor concentrations, the lower aging extents of air masses (Figure 10b) imply limited photochemical processing, thereby resulting in lower O3 levels in these three trajectory clusters. An exception was Cluster 5, which exhibited high concentrations for both O3 and its precursors, underscoring the significance of local photochemical O3 formation. Conversely, Clusters 1 and 4 showed the lowest NMHCs/NO2 ratios, aging extents of air mass, and O3 concentrations, thereby further highlighting the critical role of photochemical reactions during air mass transport in determining O3 levels.

4.2. Influence of Air Mass Transport on O3 Sensitivity to Its Precursors

4.2.1. Comparison of O3 Sensitivity Across Six Trajectory Clusters

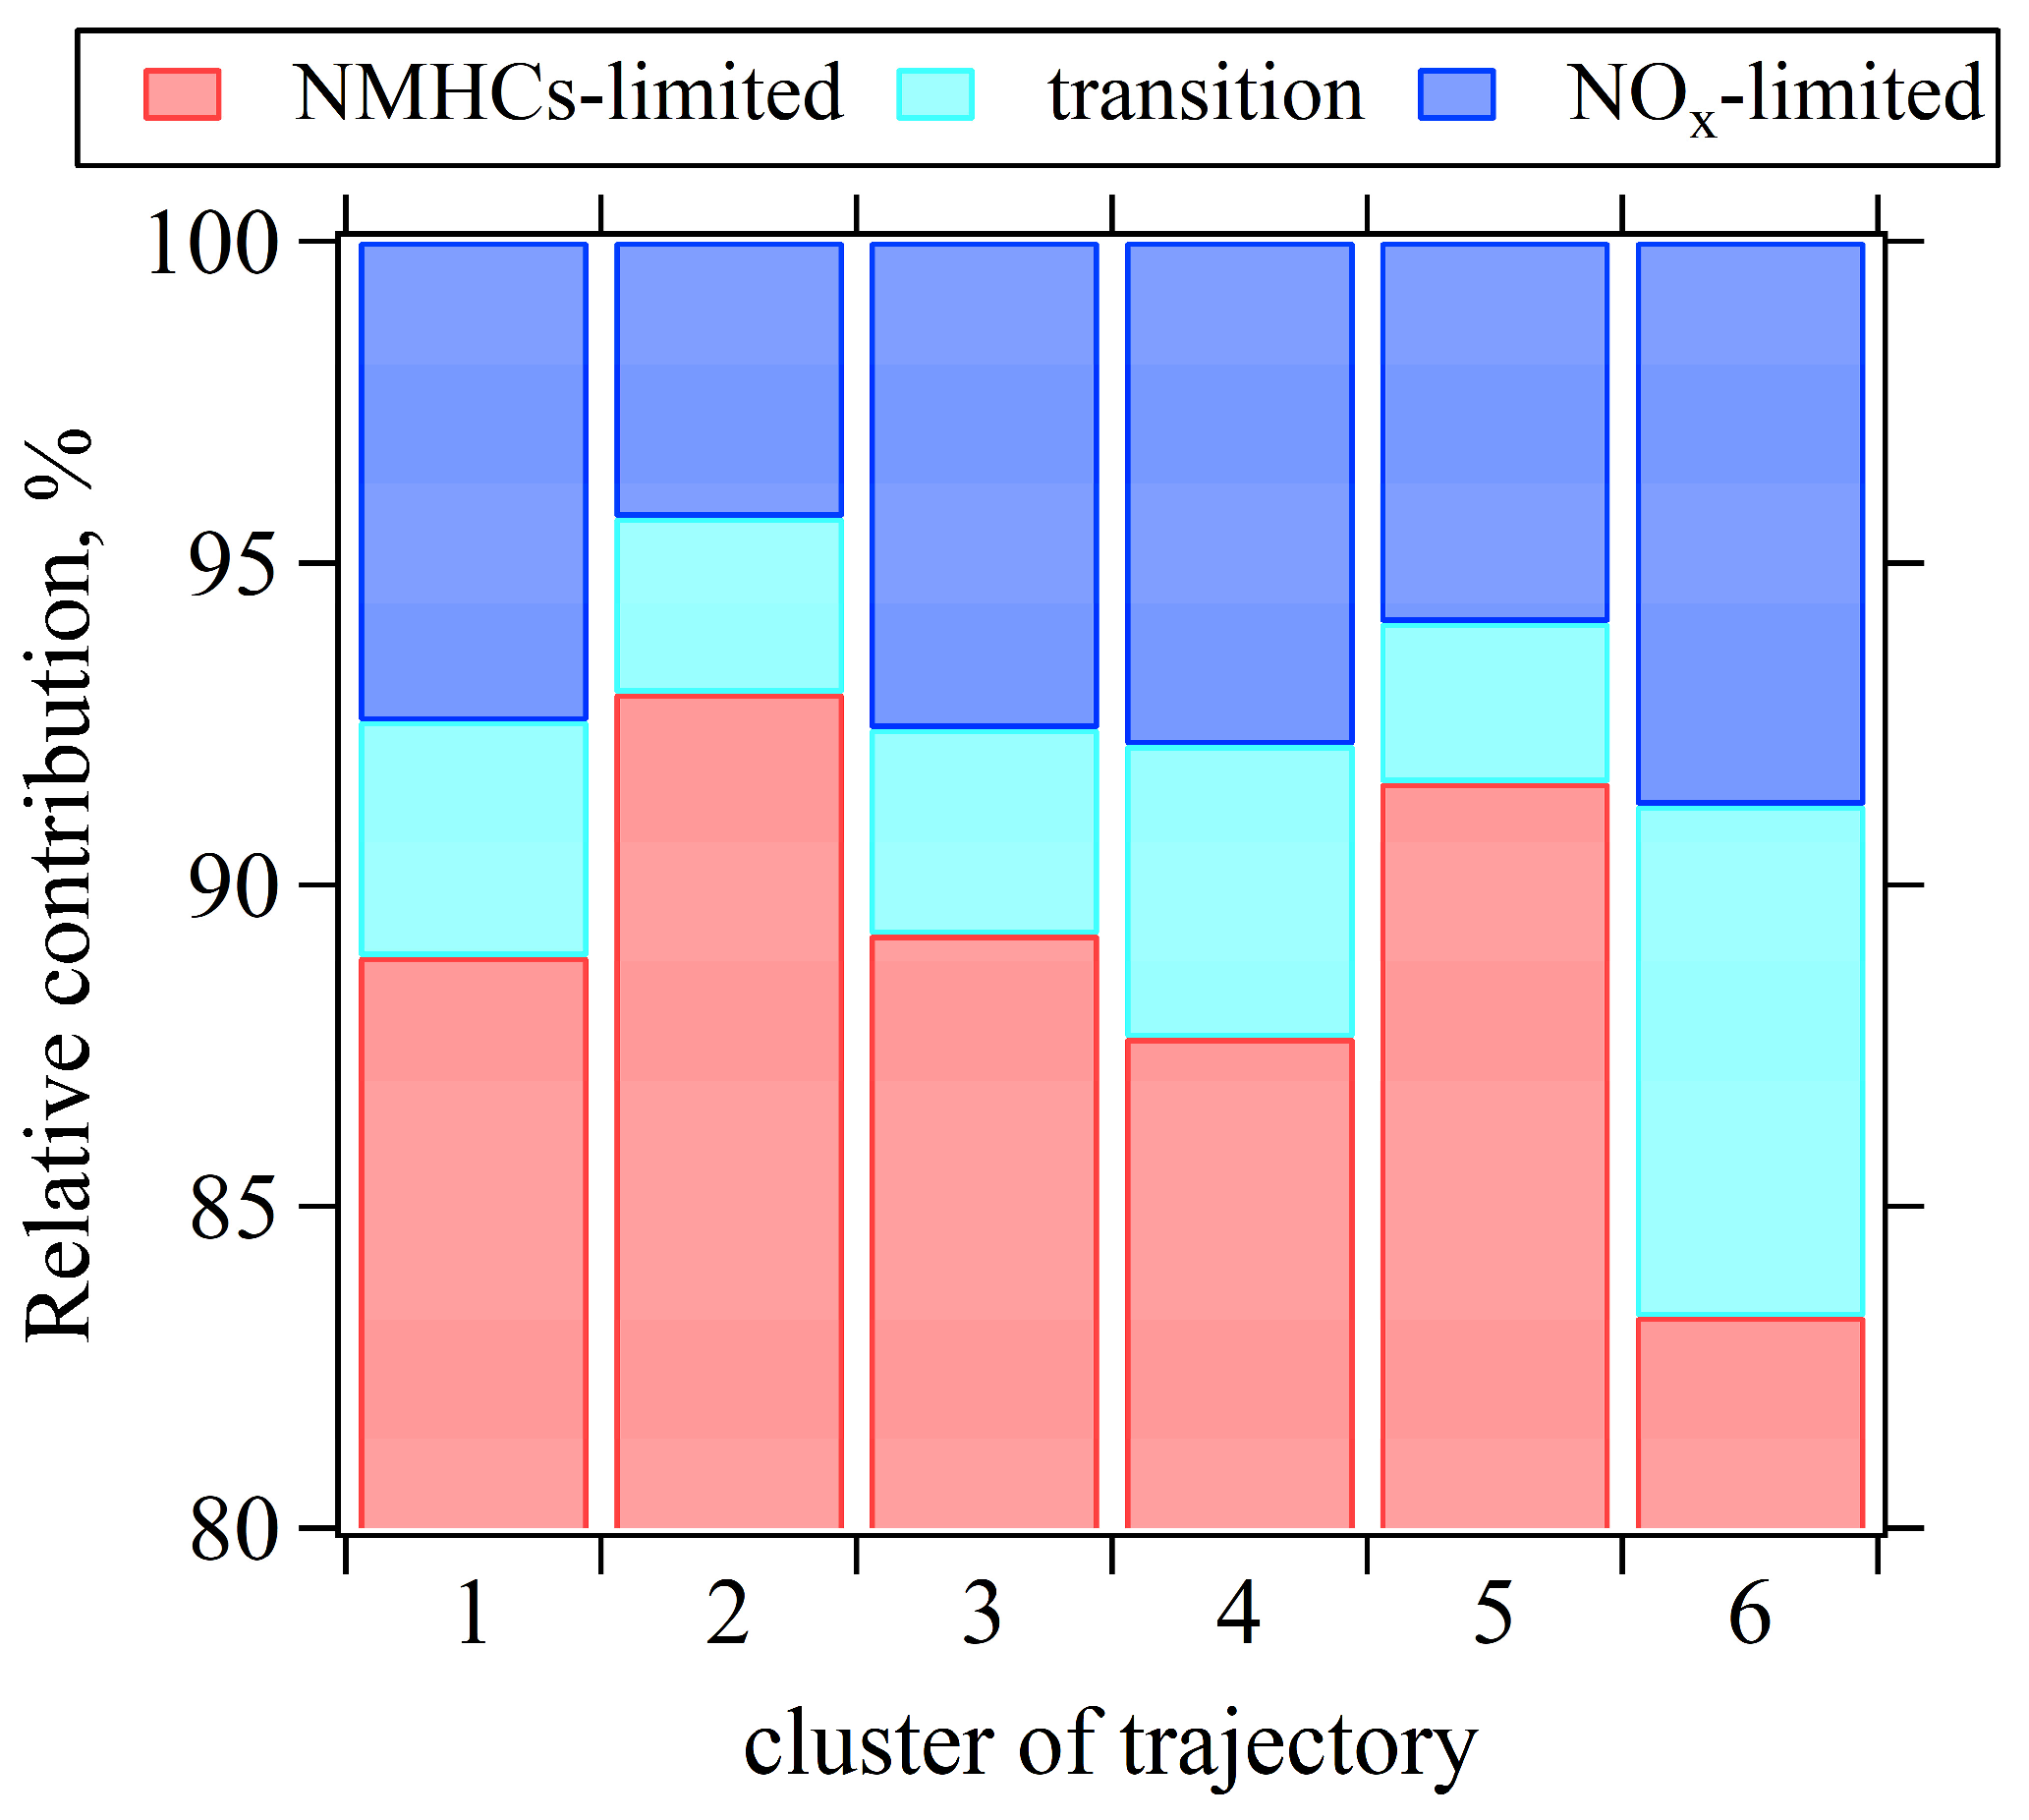
Simulations of O3 formation were conducted using the OBM for the daytime hours of a total of 312 days (146 days in 2020 and 162 days in 2021). The RIR values of NOx and AHC were calculated for each hour between 08:00 and 18:00. Subsequently, O3 sensitivity in each hour was classified into three types (NMHCs-limited, NOx-limited, and transition regime) based on the classification criteria recommended by Xu et al. (2022) [40]. Figure 12 presents the relative contributions of three O3 sensitivity regimes across the six trajectory clusters, revealing that O3 sensitivity during daytime hours was dominated by the NMHCs-limited regime, accounting for 83% to 93% of the time for each trajectory cluster. Nevertheless, Cluster 6, originating from the southeast, showed the highest frequency of the transition (9%) and NOx-limited (8%) O3 sensitivity regimes. This is likely because this air mass trajectory crossed major NMHCs source regions and had a longer transport distance, resulting in a relatively higher NMHCs/NO2 ratio due to faster degradation of NOx. Similarly, Cluster 4 also showed a relatively higher frequency of transition and NOx-limited O3 sensitivity regimes (12%), likely influenced by the passage of air masses over forested regions (with abundant biogenic NMHCs emissions) and long transport distances. In contrast, Clusters 2 and 5 showed the lowest occurrence of transition and NOx-limited O3 sensitivity regimes (7–8%). This likely attributes to their short transport distances and strong influence from urban vehicular emissions.

4.2.2. Air Mass Transport Influence on O3 Sensitivity During Four O3 Pollution Episodes

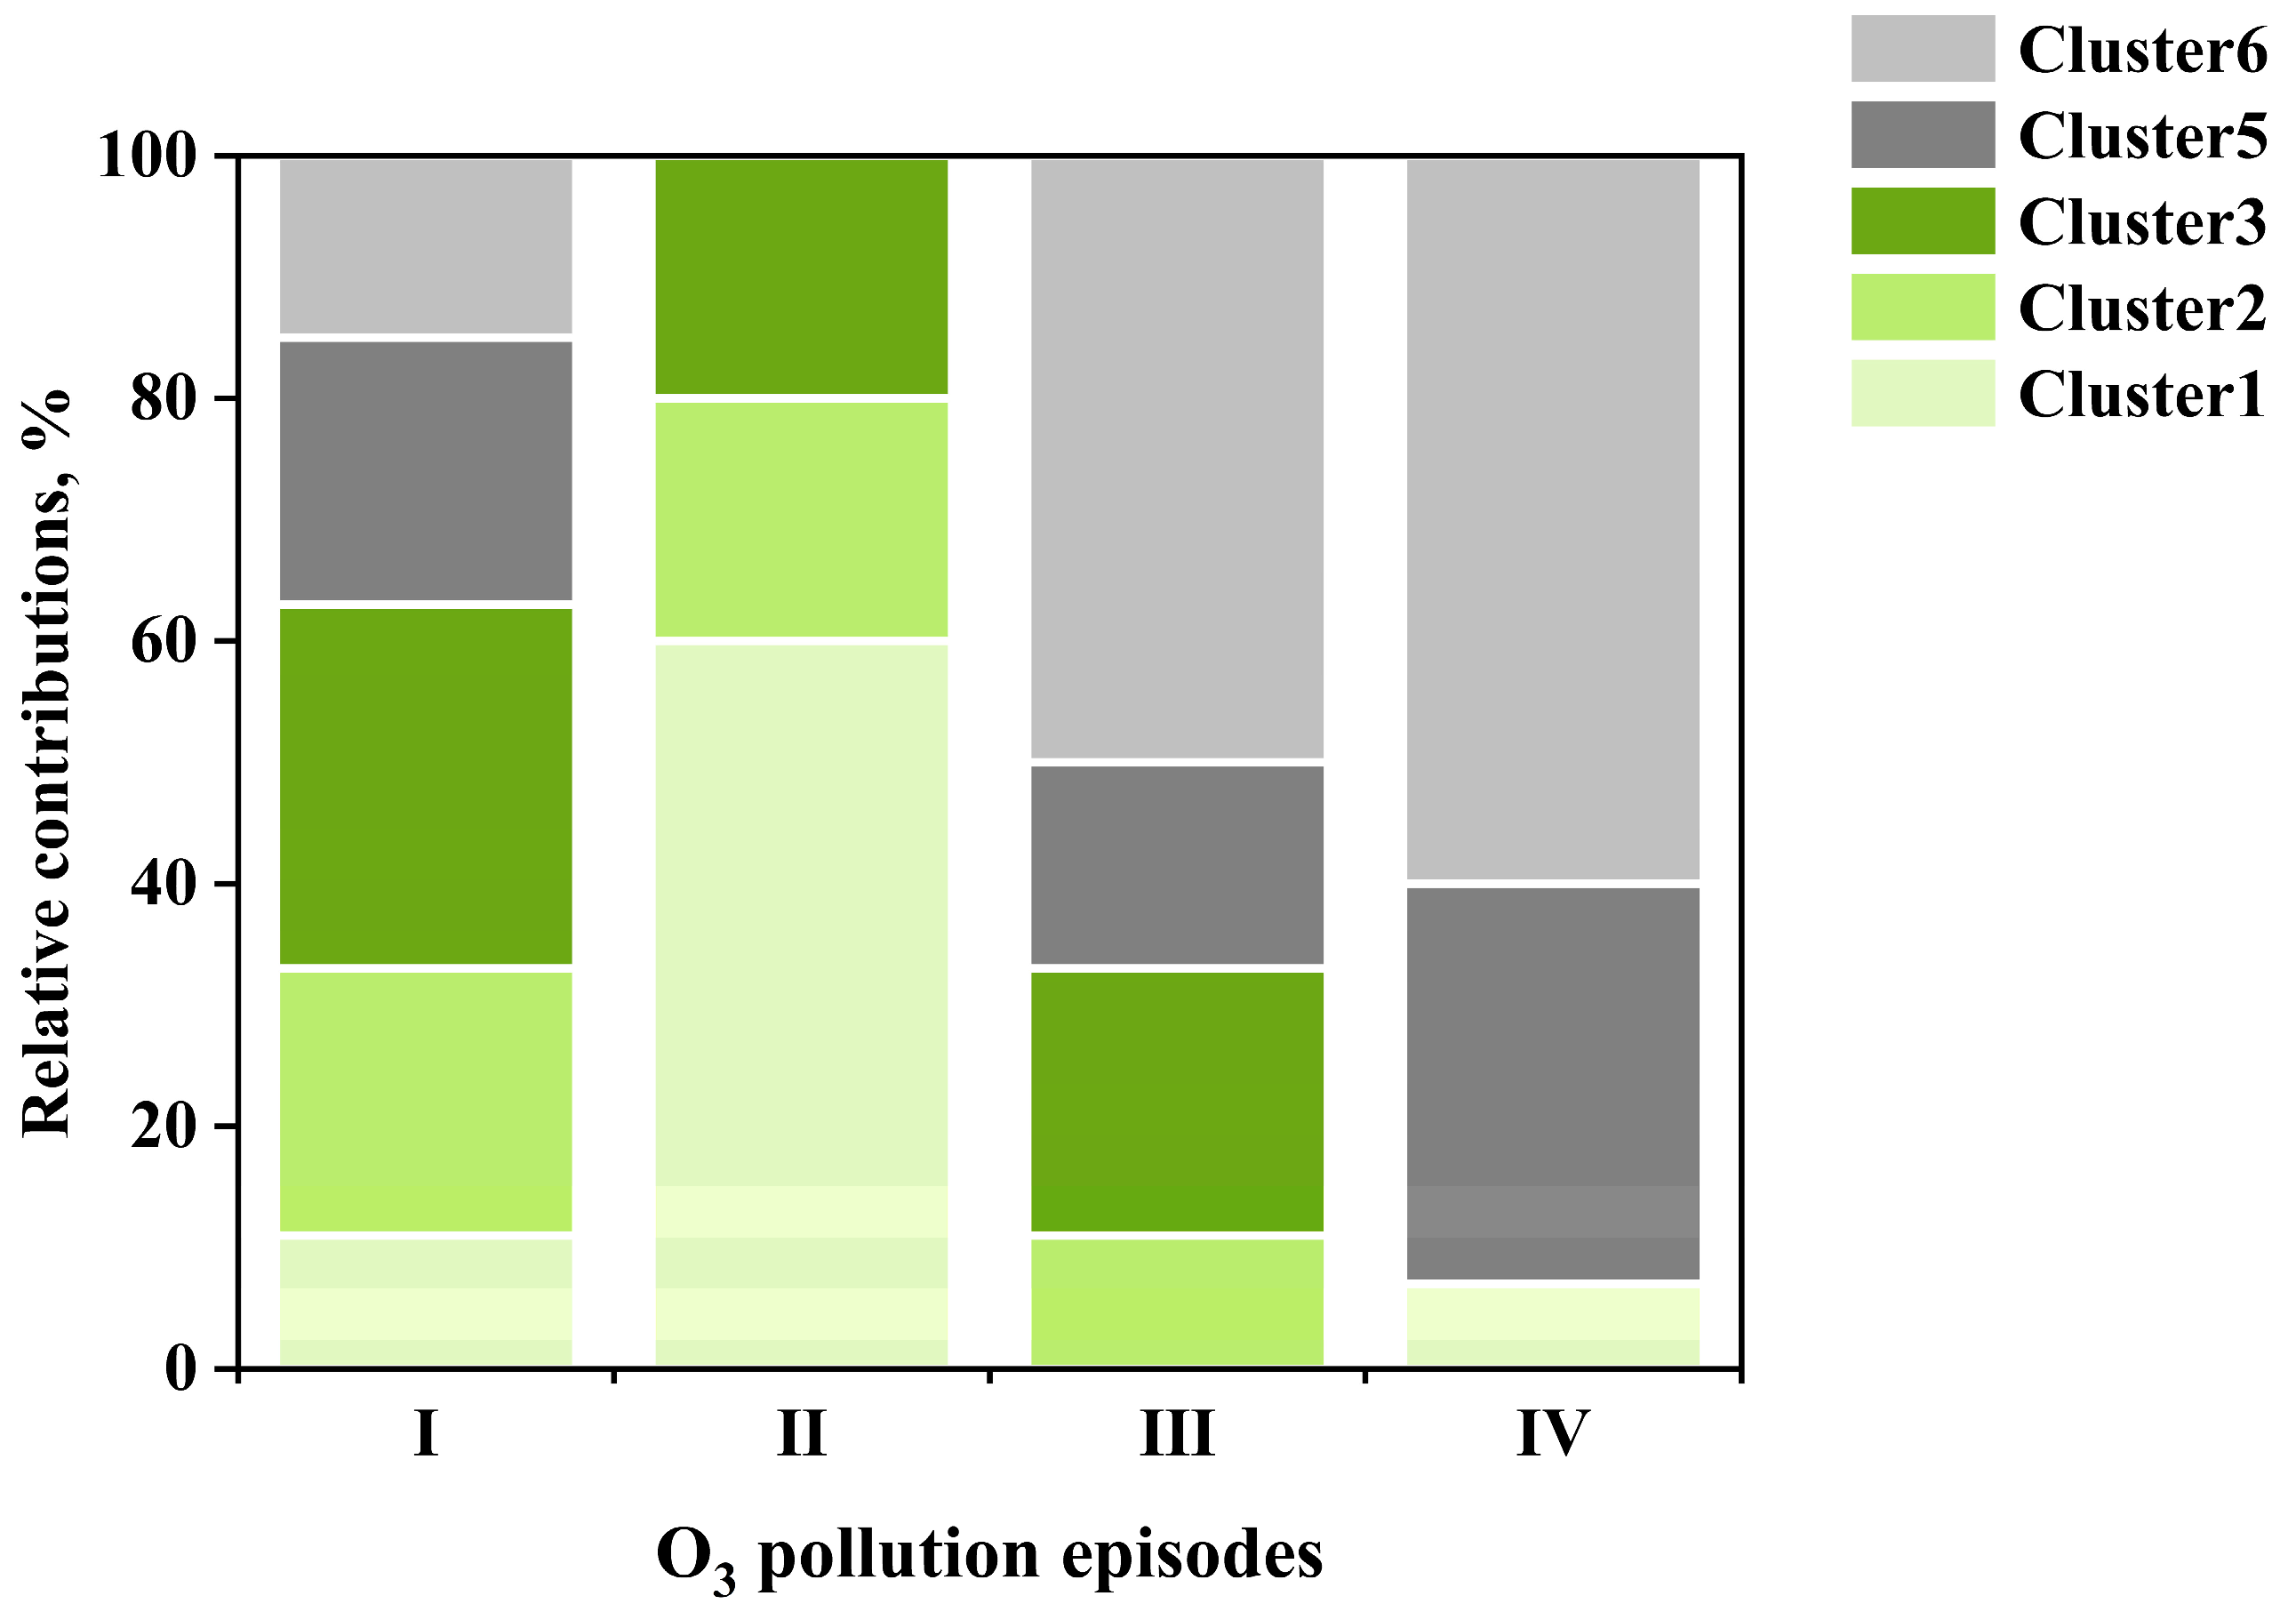
Figure 13 compares the relative contributions of the six backward 12 h trajectory clusters during the O3 peak periods (13:00–15:00) across the four O3 pollution episodes (Section 3.3). While Cluster 4, originating from the southwest, had negligible contributions during all O3 pollution episodes, the other five trajectory clusters exhibited variable contributions across different episodes. In Episode I, five trajectory clusters were involved, with origins predominantly from the east and north (Clusters 1–3, 63%), and the remaining from the southeast (Clusters 5 and 6, 37%). Episode II was dominated by transport from the northwest (Cluster 1; 60%), followed by contributions from the northeast (Cluster 2; 20%) and east (Cluster 3; 20%). By contrast, Episodes III and IV during their peak O3 periods were primarily influenced by southeastern transport pathways. Specifically, Clusters 5 and 6 together accounted for 67% of air masses in Episode III and a remarkable 93% in Episode IV. Minor contributions in Episode III came from easterly (Cluster 3, 22%) and northeasterly (Cluster 2, 11%) transport, while Episode IV included a small fraction (7%) from the northwest (Cluster 1). These differing air mass origins during these episodes corresponded to distinct O3 sensitivity regimes. As discussed earlier (Figure 8), Episodes I and II displayed mixed O3 sensitivity regimes—some days they exhibited NMHCs-limited O3 sensitivity, while others fell into transition or NOx-limited regimes. This variability may be attributed to the complexity of air mass origins during these episodes (Figure 13). Conversely, Episodes III and IV, dominated by southeast air mass transport (Clusters 5 and 6), consistently exhibited NMHCs-limited O3 sensitivity. This disparity in sensitivity regimes further confirms the significant influence of air mass transport in shaping the sensitivity of O3 formation to its precursors.

4.3. Limitations and Uncertainties

In this study, we employed the WCWT and OBM approaches to investigate the transport of O3 and its precursors, as well as the sensitivity of O3 formation. However, several sources of uncertainty may affect the WCWT results. These include potential errors in trajectory calculations due to the resolution of meteorological input data and inherent assumptions in the trajectory model. For example, the assumption that pollutant concentrations are solely transported along back trajectories may overlook atmospheric chemical transformations and removal processes, particularly for reactive species such as NMHCs and NOx. To mitigate these uncertainties, we tested multiple trajectory lengths (12, 24, and 48 h; Figure 5) and cross-validated the WCWT results with known regional emission characteristics reported by An et al. (2021) [48] and prevailing wind directions (Figure 6), thereby enhancing the robustness of the identified potential source regions.
In addition to WCWT and OBM, air quality models based on emissions, such as CMAQ and WRF-Chem, have been widely applied to study O3 formation and transport in the YRD region. For instance, Wang et al. (2023) found that both NOx and NMHCs had strong transport potential, and cities including Nanjing were primarily under NMHCs-limited O3 formation regimes [52]. Li et al. (2021) demonstrated that NMHCs sources contributed more significantly to O3 formation than NOx [53], further supporting the NMHCs-limited regime identified by our OBM results. Hu et al. (2018) reported that regional transport substantially contributed to O3 pollution, even under unfavorable local meteorological conditions [54]. Furthermore, Li et al. (2021) employed lidar measurements to observe O3 transport from Shanghai to other areas within the YRD region, resulting in elevated regional O3 levels [21]. These findings support our WCWT-based conclusion that regional transport of O3 and its precursors plays a critical role in O3 pollution within the YRD region.
We also used the RIR of isoprene calculated using the OBM to assess the impact of biogenic emissions on O3 formation. However, this method only provides a preliminary estimate, and a more comprehensive assessment of biogenic NMHCs, including monoterpenes and other species, and their interactions with anthropogenic emissions is needed to fully characterize their role in O3 formation. Future studies incorporating receptor modeling (e.g., positive matrix factorization (PMF) or chemical mass balance (CMB) models), high-resolution emission inventories, and chemical transport modeling would significantly improve the accuracy of source apportionment for O3 and its precursors. Given the complexity and spatiotemporal variability of NMHC emissions, such investigations would be a valuable direction for future research.

5. Conclusions

During April–September in 2020 and 2021, the average concentrations for DMA-1h O3, NMHCs, and NOx were 149 ± 50.5 μg m−3, 16.7 ± 10.7 ppbv, and 31.7 ± 25.5 μg m−3, respectively. The diurnal variation analyses indicated that O3 and isoprene concentrations peaked during the midday and early afternoon, while NOx and anthropogenic NMHCs presented their lowest observed values. Isoprene showed poor correlation with acetylene, suggesting its primary origin from biogenic emissions. O3 and isoprene concentrations displayed a positive, yet non-linear, relationship with temperature, whereas NOx and NMHCs decreased when temperature rose. Wind analysis further indicated the potential influence of air mass transport on O3 and its precursors.
Cluster analyses of 12 h, 24 h, and 48 h backward-trajectories consistently identified the east and southeast as the dominant air mass transport pathway. Given our focus on air transport within the YRD region and eastern China, and considering the relative short lifetimes of NMHCs and NOx, the six clusters derived from 12 h backward trajectories were selected to discuss impact of air mass transport on O3 and its precursors. Two southeastern trajectories (Clusters 5 and 6) were the most dominant air mass transport pathways, together accounting for 29.3%, followed by eastern (26.5%), northwestern (21.3%), southwestern (13.0%), and northeastern (12.0%) pathways. Notably, the southeastern clusters were associated with the highest O3 concentrations (100 μg m−3 and 90 μg m−3, respectively), significantly surpassing values observed for other trajectory clusters (65–78 μg m−3). Furthermore, O3 concentrations exhibited a strong negative correlation with the X/E ratios, signifying that higher O3 levels were associated with more photochemically aged air masses. This finding suggested that O3 concentrations were not directly determined by the levels of NMHCs or NO2. Instead, long-range transport trajectory clusters were characterized by lower absolute O3 precursor concentrations but exhibited higher NMHCs/NO2 ratios and consequently higher O3 levels, whereas shorter-range trajectory clusters showed elevated precursor concentrations but lower O3 levels. This pattern underscores the critical role of photochemical reactions in air mass transport for O3 accumulation.
To evaluate the impact of air mass transport on O3 sensitivity, four O3 pollution episodes with peak concentrations exceeding 160 μg m−3 were selected. While the controlling synoptic systems varied—with Episode I dominated by a 500 hPa subtropical high and Episodes II–IV by post-low-pressure circulation—all four episodes shared critical meteorological characteristics. Specifically, each featured strong downward airflow and suppressed vertical diffusion, which are conditions highly favorable for the formation and accumulation of O3. The air mass origins differed between the O3 pollution episodes for these two years; the 2020 episodes involved a more diverse mix of southeastern and northern transport pathways, whereas the 2021 episodes were predominantly influenced by southeastern transport pathways. The WCWT analysis results confirmed these findings, showing that high O3 contributions originated from the southeast, south, and southwest during Episode I, and from the northwest and southeast during Episode II. For Episodes III and IV, high contributions were mainly associated with transport from urban-industrial regions in southeastern Jiangsu Province, northern Zhejiang Province, and Shanghai. Mapping potential NMHCs source regions revealed a partial spatial overlap with O3 concentrations. However, distinct features were also evident, particularly in vegetated areas, suggesting a significant role for biogenic emissions in O3 formation.
The OBM simulations further revealed that O3 formation across all six trajectories clusters were primarily in the NMHCs-limited regime (accounting for 83–93% of daytime hours). However, Cluster 6 (southeastern long-range transport) exhibited the highest frequency of the transition (9%) and NOx-limited (8%) regimes. This can be attributed to the relatively high NMHCs/NO2 ratios in these aged air masses and to the passage through regions featuring substantial anthropogenic NMHCs emissions. Cluster 4 also presented relatively higher frequency of transition and NOx-limited O3 sensitivity, likely due to biogenic emissions. In contrast, Clusters 2 and 5, characterized by shorter transport distances and a strong influence from urban vehicular emissions, demonstrated the lowest occurrence of these sensitivity regimes. Further supporting these findings, analysis of four selected O3 pollution episodes revealed that the two episodes in 2020, associated with more complex air mass trajectory combinations, exhibited varied O3 sensitivity regimes, while the 2021 episodes, dominated by southeastern air masses, were consistently NMHCs-limited. Collectively, these results corroborate that O3 sensitivity in Nanjing is significantly modulated by the origin and transport characteristics of incoming air masses. This study demonstrates that regional air mass transport plays a important role not only in determining O3 and precursor concentrations but also in shaping the sensitivity of O3 formation, highlighting the necessity of implementing regionally coordinated control strategies for effective mitigation of O3 pollution across the YRD in China.

Author Contributions

Conceptualization, M.W. and F.D.; methodology, Y.W. and X.C.; software, Y.W. and X.C.; validation, M.W.; formal analysis, Y.W.; investigation, M.W.; resources, F.D.; data curation, F.D. and L.Z.; writing—original draft preparation, Y.W.; writing—review and editing, M.W., F.D., and L.Z.; visualization, Y.W. and M.W.; supervision, M.W. and F.D.; funding acquisition, M.W. All authors have read and agreed to the published version of the manuscript.

Funding

This research was funded by the National Key Research and Development Program of China, grant number 2023YFC3706204 and the National Natural Science Foundation of China, grant number 42477108.

Data Availability Statement

Researchers wishing to access the data used in this study can make a request to the corresponding author: wangming@nuist.edu.cn.

Conflicts of Interest

The authors declare no conflicts of interest.

Abbreviations

O3ozone
SO2sulfur dioxide
VOCsvolatile organic compounds
NOxnitrogen oxides
NOnitric oxide
NO2nitrogen dioxide
COcarbon monoxide
YRDthe Yangtze River Delta
PRDthe Pearl River Delta
CWTconcentration-weighted trajectory
OBMobservation-based box model
GC–MSgas chromatography–mass spectrometry
GDASglobal data assimilation system
WCWTweighted concentration-weighted trajectory
CB05carbon bond lumped chemical reaction mechanism
RIRrelative incremental reactivity
NMHCsnon-methane hydrocarbons
AHCanthropogenic non-methane hydrocarbons
X/Eratio of o-xylene to ethylbenzene
NJNanjing
DMA-1hdaily maximum 1 h moving average
DMA-8hdaily maximum 8 h moving average
TUVtropospheric ultraviolet–visible radiation
IOAindex of agreement
TEXthe sum of toluene, ethylbenzene, and xylenes
NWRnon-parametric wind regression
RHrelative humidity

Appendix A

Table A1. The measured 57 NMHC species in this study.
AlkanesAlkenes and AlkynesAromatics
ethane2,4-dimethylpentaneethenebenzene
propane2-methylhexanepropenetoluene
n-butane3-methylhexane1-buteneethylbenzene
i-butanecyclohexanecis-2-butenem,p-xylene
n-pentanemethylcyclopentanetrans-2-buteneo-xylene
i-pentanen-octane1,3-butidenestyrene
cyclopentane2,2,4-trimethylpentane1-pentenei-propylbenzene
n-hexane2,3,4-trimethylpentanecis-2-pentenen-propylbenzene
2,2-dimethylbutanemethylcyclohexanetrans-2-pentene3-ethyltoluene
2,3-dimethylbutane2-methylheptaneisoprene4-ethyltoluene
2-methylpentane3-methylheptane1-hexene2-ethyltoluene
3-methylpentanen-nonaneacetylene1,3,5-trimethylbenzene
n-heptanen-decane 1,2,4-trimethylbenzene
2,3-dimethylpentanen-undecane 1,2,3-trimethylbenzene
1,3-diethylbenzene
1,4-diethylbenzene

References

  1. Jin, Y.; Andersson, H.; Zhang, S. Air pollution control policies in China: A retrospective and prospects. Int. J. Environ. Res. Public Health 2016, 13, 1219–1240. [Google Scholar] [CrossRef]
  2. Chen, H.; Zhuang, B.; Liu, J.; Wang, T.; Li, S.; Xie, M.; Li, M.; Chen, P.; Zhao, M. Characteristics of ozone and particles in the near-surface atmosphere in the urban area of the Yangtze River Delta, China. Atmos. Chem. Phys. 2019, 19, 4153–4175. [Google Scholar] [CrossRef]
  3. Wang, H.; Lu, X.; Palmer, P.; Zhang, L.; Lu, K.D.; Li, K.; Nagashima, T.; Koo, J.H.; Tanimoto, H.; Wang, H.C.; et al. Deciphering decadal urban ozone trends from historical records since 1980. Natl. Sci. Rev. 2024, 11, nwae369. [Google Scholar] [CrossRef]
  4. Wang, W.; Li, X.; Cheng, Y.; Parrish, D.; Ni, R.; Tan, Z.; Liu, Y.; Lu, S.; Wu, Y.; Chen, S.; et al. Ozone pollution mitigation strategy informed by long-term trends of atmospheric oxidation capacity. Nat. Geosci. 2023, 17, 20–25. [Google Scholar] [CrossRef]
  5. Schraufnagel, D.E.; Balmes, J.R.; Matteis, S.D.; Hoffman, B.; Kim, W.J.; Perez-Padilla, R.; Rice, M.; Sood, A.; Vanker, A.; Wuebbles, D.J. Health Benefits of Air Pollution Reduction. Ann. Am. Thorac. Soc. 2019, 16, 1478–1487. [Google Scholar] [CrossRef]
  6. Liu, H.; Liu, S.; Xue, B.; Lv, Z.; Meng, Z.; Yang, X.; Xue, T.; Yu, Q.; He, K. Ground-level ozone pollution and its health impacts in China. Atmos. Environ. 2018, 173, 223–230. [Google Scholar] [CrossRef]
  7. Xie, Y.; Dai, H.; Zhang, Y.; Wu, Y.; Hanaoka, T.; Masui, T. Comparison of health and economic impacts of PM2.5 and ozone pollution in China. Environ. Int. 2019, 130, 104881. [Google Scholar] [CrossRef] [PubMed]
  8. Wang, T.; Xue, L.; Feng, Z.; Dai, J.; Zhang, Y.; Tan, Y. Ground-level ozone pollution in China: A synthesis of recent findings on influencing factors and impacts. Environ. Res. Lett. 2022, 17, 063003. [Google Scholar] [CrossRef]
  9. Lu, X.; Zhang, L.; Chen, Y.F.; Zhou, M.; Zheng, B.; Li, K.; Liu, Y.M.; Lin, J.T.; Fu, T.M.; Zhang, Q. Exploring 2016–2017 surface ozone pollution over China: Source contributions and meteorological influences. Atmos. Chem. Phys. 2019, 19, 8339–8361. [Google Scholar] [CrossRef]
  10. Wang, T.; Xue, L.; Brimblecombe, P.; Lam, Y.F.; Li, L.; Zhang, L. Ozone pollution in China: A review of concentrations, meteorological influences, chemical precursors, and effects. Sci. Total Environ. 2017, 575, 1582–1596. [Google Scholar] [CrossRef]
  11. Wang, Y.; Zhao, Y.; Liu, Y.; Jiang, Y.; Zheng, B.; Xing, J.; Liu, Y.; Wang, S.; Nielsen, C.P. Sustained emission reductions have restrained the ozone pollution over China. Nat. Geosci. 2023, 16, 967–974. [Google Scholar] [CrossRef]
  12. Shen, L.; Liu, J.; Zhao, T.; Xu, X.; Han, H.; Wang, H.; Shu, Z. Atmospheric transport drives regional interactions of ozone pollution in China. Sci. Total Environ. 2022, 830, 154634. [Google Scholar] [CrossRef]
  13. Zheng, Y.; Jiang, F.; Feng, S.; Cai, Z.; Shen, Y.; Ying, C.; Wang, X.; Liu, Q. Long-range transport of ozone across the eastern China seas: A case study in coastal cities in southeastern China. Sci. Total Environ. 2021, 768, 144520. [Google Scholar] [CrossRef]
  14. Wu, R.; Xie, S. Spatial distribution of ozone formation in China derived from emissions of speciated volatile organic compounds. Environ. Sci. Technol. 2017, 51, 2574–2583. [Google Scholar] [CrossRef]
  15. Zhou, X.; Xie, J.; Zhang, R.; Ma, M.; Li, X.; Gong, P. Recent advances in different catalysts for synergistic removal of NOx and VOCs: A minor review. J. Environ. Chem. Eng. 2024, 12, 111764. [Google Scholar] [CrossRef]
  16. Saavedra, S.; Rodríguez, A.; Taboada, J.J.; Souto, J.A.; Casares, J.J. Synoptic patterns and air mass transport during ozone episodes in northwestern Iberia. Sci. Total Environ. 2012, 441, 97–110. [Google Scholar] [CrossRef] [PubMed]
  17. Moghani, M.; Archer, C.L.; Mirzakhalili, A. The importance of transport to ozone pollution in the U.S. Mid-Atlantic. Atmos. Environ. 2018, 191, 420–431. [Google Scholar] [CrossRef]
  18. Qian, J.; Liao, H.; Yang, Y.; Li, K.; Chen, L.; Zhu, J. Meteorological influences on daily variation and trend of summertime surface ozone over years of 2015–2020: Quantification for cities in the Yangtze River Delta. Sci. Total Environ. 2022, 834, 155107. [Google Scholar] [CrossRef] [PubMed]
  19. Sahu, S.K.; Liu, S.; Liu, S.; Ding, D.; Xing, J. Ozone pollution in China: Background and transboundary contributions to ozone concentration & related health effects across the country. Sci. Total Environ. 2021, 761, 144131. [Google Scholar] [PubMed]
  20. Gong, C.; Liao, H.; Zhang, L.; Yue, X.; Dang, R.; Yang, Y. Persistent ozone pollution episodes in North China exacerbated by regional transport. Environ. Pollut. 2020, 265, 115056. [Google Scholar] [CrossRef]
  21. Li, X.; Fan, G.; Lou, S.; Yuan, B.; Wang, X.; Shao, M. Transport and boundary layer interaction contribution to extremely high surface ozone levels in eastern China. Environ. Pollut. 2021, 268, 115804. [Google Scholar] [CrossRef]
  22. Li, J.; Yuan, B.; Yang, S.; Peng, Y.; Chen, W.; Xie, Q.; Wu, Y.; Huang, Z.; Zheng, J.; Wang, X.; et al. Quantifying the contributions of meteorology, emissions, and transport to ground-level ozone in the Pearl River Delta, China. Sci. Total Environ. 2024, 932, 173011. [Google Scholar] [CrossRef] [PubMed]
  23. Liu, T.; Hong, Y.; Li, M.; Xu, L.; Chen, J.; Bian, Y.; Yang, C.; Dan, Y.; Zhang, Y.; Xue, L.; et al. Atmospheric oxidation capacity and ozone pollution mechanism in a coastal city of southeastern China: Analysis of a typical photochemical episode by an observation-based model. Atmos. Chem. Phys. 2022, 22, 2173–2190. [Google Scholar] [CrossRef]
  24. Wang, M.; Chen, W.; Zhang, L.; Qin, W.; Zhang, Y.; Zhang, X.; Xie, X. Ozone pollution characteristics and sensitivity analysis using an observation-based model in Nanjing, Yangtze River Delta Region of China. J. Environ. Sci. 2020, 93, 13–22. [Google Scholar] [CrossRef] [PubMed]
  25. Chatani, S.; Shimadera, H.; Itahashi, S.; Yamaji, K. Comprehensive analyses of source sensitivities and apportionments of PM2.5 and ozone over Japan via multiple numerical techniques. Atmos. Chem. Phys. 2020, 20, 10311–10329. [Google Scholar] [CrossRef]
  26. Deng, Y.; Li, J.; Li, Y.; Wu, R.; Xie, S. Characteristics of volatile organic compounds, NO2, and effects on ozone formation at a site with high ozone level in Chengdu. J. Environ. Sci. 2019, 75, 334–345. [Google Scholar] [CrossRef]
  27. Sharma, S.; Sharma, P.; Khare, M. Photo-chemical transport modelling of tropospheric ozone: A review. Atmos. Environ. 2017, 159, 34–54. [Google Scholar] [CrossRef]
  28. Li, J.; Lewis, A.C.; Hopkins, J.R.; Andrews, S.J.; Murrells, T.; Passant, N.; Richmond, B.; Hou, S.; Bloss, W.J.; Harrison, R.M.; et al. The impact of multi-decadal changes in VOC speciation on urban ozone chemistry: A case study in Birmingham, United Kingdom. Atmos. Chem. Phys. 2024, 24, 6219–6231. [Google Scholar] [CrossRef]
  29. Mousavinezhad, S.; Choi, Y.; Pouyaei, A.; Ghahremanloo, M.; Nelson, D.L. A comprehensive investigation of surface ozone pollution in China, 2015–2019: Separating the contributions from meteorology and precursor emissions. Atmos. Res. 2021, 257, 105599. [Google Scholar] [CrossRef]
  30. Yao, Y.; Wang, W.; Ma, K.; Tan, H.; Zhang, Y.; Fang, F.; He, C. Transmission paths and source areas of near-surface ozone pollution in the Yangtze River delta region, China from 2015 to 2021. J. Environ. Manag. 2023, 330, 117105. [Google Scholar] [CrossRef]
  31. Wang, M.; Ma, J.; Tao, C.; Gao, Y.; Zhang, R.; Wang, P.; Zhang, H. Regional source contributions to summertime ozone in the Yangtze River Delta. Atmos. Environ. 2024, 338, 120822. [Google Scholar] [CrossRef]
  32. Lu, X.; Wang, M.; Ding, F.; Yu, Y.; Zhang, Z.; Hu, K. Changes in O3-VOCs-NOx sensitivity and VOCs sources at an urban site of Nanjing between 2020 and 2021. Environ. Sci. 2023, 44, 144–154. (In Chinese) [Google Scholar]
  33. Wang, M.; Zeng, L.; Lu, S.; Shao, M.; Liu, X.; Yu, X.; Chen, W.; Yuan, B.; Zhang, Q.; Hu, M.; et al. Development and validation of a cryogen-free automatic gas chromatograph system (GC-MS/FID) for online measurements of volatile organic compounds. Anal. Methods 2014, 6, 9424–9434. [Google Scholar] [CrossRef]
  34. Wang, Y. MeteoInfo: GIS software for meteorological data visualization and analysis. Meteorol. Appl. 2014, 21, 360–368. [Google Scholar] [CrossRef]
  35. Cao, Y.; Ma, J.; Wang, X.; Bian, J. An analysis of regional ozone pollution generation and intercity transport characteristics in the Yangtze River Delta. Atmosphere 2025, 16, 158. [Google Scholar] [CrossRef]
  36. Wang, X.; Xiang, Y.; Liu, W.; Lv, L.; Dong, Y.; Fan, G.; Ou, J.; Zhang, T. Vertical profiles and regional transport of ozone and aerosols in the Yangtze River Delta during the 2016 G20 summit based on multiple lidars. Atmos. Environ. 2021, 259, 118506. [Google Scholar] [CrossRef]
  37. Wang, X.; Zhang, H.; Hong, X.; Xiang, Y.; Wang, S.; Zhang, T.; Qin, Z.; Ou, J. Vertical profiles and regional transport of ozone in typical area of Yangtze-Huaihe River Basin during the autumn base on multiple lidars. Atmos. Pollut. Res. 2024, 15, 101983. [Google Scholar] [CrossRef]
  38. Huang, X.; Wang, Y.; Shang, Y.; Song, X.; Zhang, R.; Wang, Y.; Li, Z.; Yang, Y. Contrasting the effect of aerosol properties on the planetary boundary layer height in Beijing and Nanjing. Atmos. Environ. 2023, 308, 119861. [Google Scholar] [CrossRef]
  39. Cardelino, C.A.; Chameides, W.L. An observation-based model for analyzing ozone precursor relationships in the urban atmosphere. J. Air Waste Manag. Assoc. 1995, 45, 161–180. [Google Scholar] [CrossRef]
  40. Xu, D.; Yuan, Z.; Wang, M.; Zhao, K.; Liu, X.; Duan, Y.; Fu, Q.; Wang, Q.; Jing, S.; Wang, H.; et al. Multi-factor reconciliation of discrepancies in ozone-precursor sensitivity retrieved from observation- and emission-based models. Environ. Int. 2022, 158, 106952. [Google Scholar] [CrossRef] [PubMed]
  41. Qin, M.; She, Y.; Wang, M.; Wang, H.; Chang, Y.; Tan, Z.; An, J.; Huang, J.; Yuan, Z.; Lu, J.; et al. Increased urban ozone in heatwaves due to temperature-induced emissions of anthropogenic volatile organic compounds. Nat. Geosci. 2025, 18, 50–56. [Google Scholar] [CrossRef]
  42. Yang, Y.; Sun, F.; Chen, Y.; Yang, S.; Dai, Y.; Qin, Y.; Zhang, N.; Shu, Z.; Yan, H.; Ge, X.; et al. Impact of temperature on the biogenic volatile organic compound (BVOC) emissions in China: A review. J. Environ. Sci. 2025, in press. [CrossRef]
  43. Petit, J.E.; Favez, O.; Albinet, A.; Canonaco, F. A user-friendly tool for comprehensive evaluation of the geographical origins of atmospheric pollution: Wind and trajectory analyses. Environ. Modell. Softw. 2017, 88, 183–187. [Google Scholar] [CrossRef]
  44. Yuan, B.; Shao, M.; Lu, S.; Wang, B. Source profiles of volatile organic compounds associated with solvent use in Beijing, China. Atmos. Environ. 2010, 44, 1919–1926. [Google Scholar] [CrossRef]
  45. Tan, Z.; Lu, K.; Jiang, M.; Su, R.; Wang, H.; Lou, S.; Fu, Q.; Zhai, C.; Tan, Q.; Yue, D.; et al. Daytime atmospheric oxidation capacity in four Chinese megacities during the photochemically polluted season: A case study based on box model simulation. Atmos. Chem. Phys. 2019, 19, 3493–3513. [Google Scholar] [CrossRef]
  46. Lu, X.; Zhang, L.; Shen, L. Meteorology and climate influences on tropospheric ozone: A review of natural sources, chemistry, and transport patterns. Curr. Pollut. Rep. 2019, 5, 238–260. [Google Scholar] [CrossRef]
  47. Yan, Y.; Tang, J.; Liu, G.; Wu, J. Effects of vegetation fraction: Variation on regional climate simulation over Eastern China. Glob. Planet. Change 2019, 175, 173–189. [Google Scholar] [CrossRef]
  48. An, J.; Huang, Y.; Huang, C.; Wang, X.; Yan, R.; Wang, Q.; Wang, H.; Jing, S.a.; Zhang, Y.; Liu, Y.; et al. Emission inventory of air pollutants and chemical speciation for specific anthropogenic sources based on local measurements in the Yangtze River Delta region, China. Atmos. Chem. Phys. 2021, 21, 2003–2025. [Google Scholar] [CrossRef]
  49. de Gouw, J.A.; Middlebrook, A.M.; Warneke, C.; Goldan, P.D.; Kuster, W.C.; Roberts, J.M.; Fehsenfeld, F.C.; Worsnop, D.R.; Canagaratna, M.R.; Pszenny, A.A.P.; et al. Budget of organic carbon in a polluted atmosphere: Results from the New England Air Quality Study in 2002. J. Geophys. Res. 2005, 110, D16305. [Google Scholar] [CrossRef]
  50. Liu, Y.; Shao, M.; Kuster, W.C.; Goldan, P.D.; Li, X.H.; Lu, S.H.; De Gouw, J.A. Source identification of reactive hydrocarbons and oxygenated VOCs in the Summertime in Beijing. Environ. Sci. Technol. 2009, 43, 75–81. [Google Scholar] [CrossRef] [PubMed]
  51. Rickly, P.S.; Coggon, M.M.; Aikin, K.C.; Alvarez, R.J., II; Baidar, S.; Gilman, J.B.; Gkatzelis, G.I.; Harkins, C.; He, J.; Lamplugh, A.; et al. Influence of wildfire on urban ozone: An observationally constrained box modeling study at a site in the Colorado Front Range. Environ. Sci. Technol. 2023, 57, 1257–1267. [Google Scholar] [CrossRef]
  52. Wang, Y.; Jiang, S.; Huang, L.; Lu, G.; Kasemsan, M.; Yaluk, E.A.; Liu, H.; Liao, J.; Bian, J.; Zhang, K.; et al. Differences between VOCs and NOx transport contributions, their impacts on O3, and implications for O3 pollution mitigation based on CMAQ simulation over the Yangtze River Delta, China. Sci. Total Environ. 2023, 872, 162118. [Google Scholar] [CrossRef] [PubMed]
  53. Li, L.; Hu, J.; Li, J.; Gong, K.; Wang, X.; Ying, Q.; Qin, M.; Liao, H.; Guo, S.; Hu, M.; et al. Modelling air quality during the EXPLORE-YRD campaign—Part II. Regional source apportionment of ozone and PM2.5. Atmos. Environ. 2021, 247, 118063. [Google Scholar] [CrossRef]
  54. Hu, J.; Li, Y.; Zhao, T.; Liu, J.; Hu, X.-M.; Liu, D.; Jiang, Y.; Xu, J.; Chang, L. An important mechanism of regional O3 transport for summer smog over the Yangtze River Delta in eastern China. Atmos. Chem. Phys. 2018, 18, 16239–16251. [Google Scholar] [CrossRef]
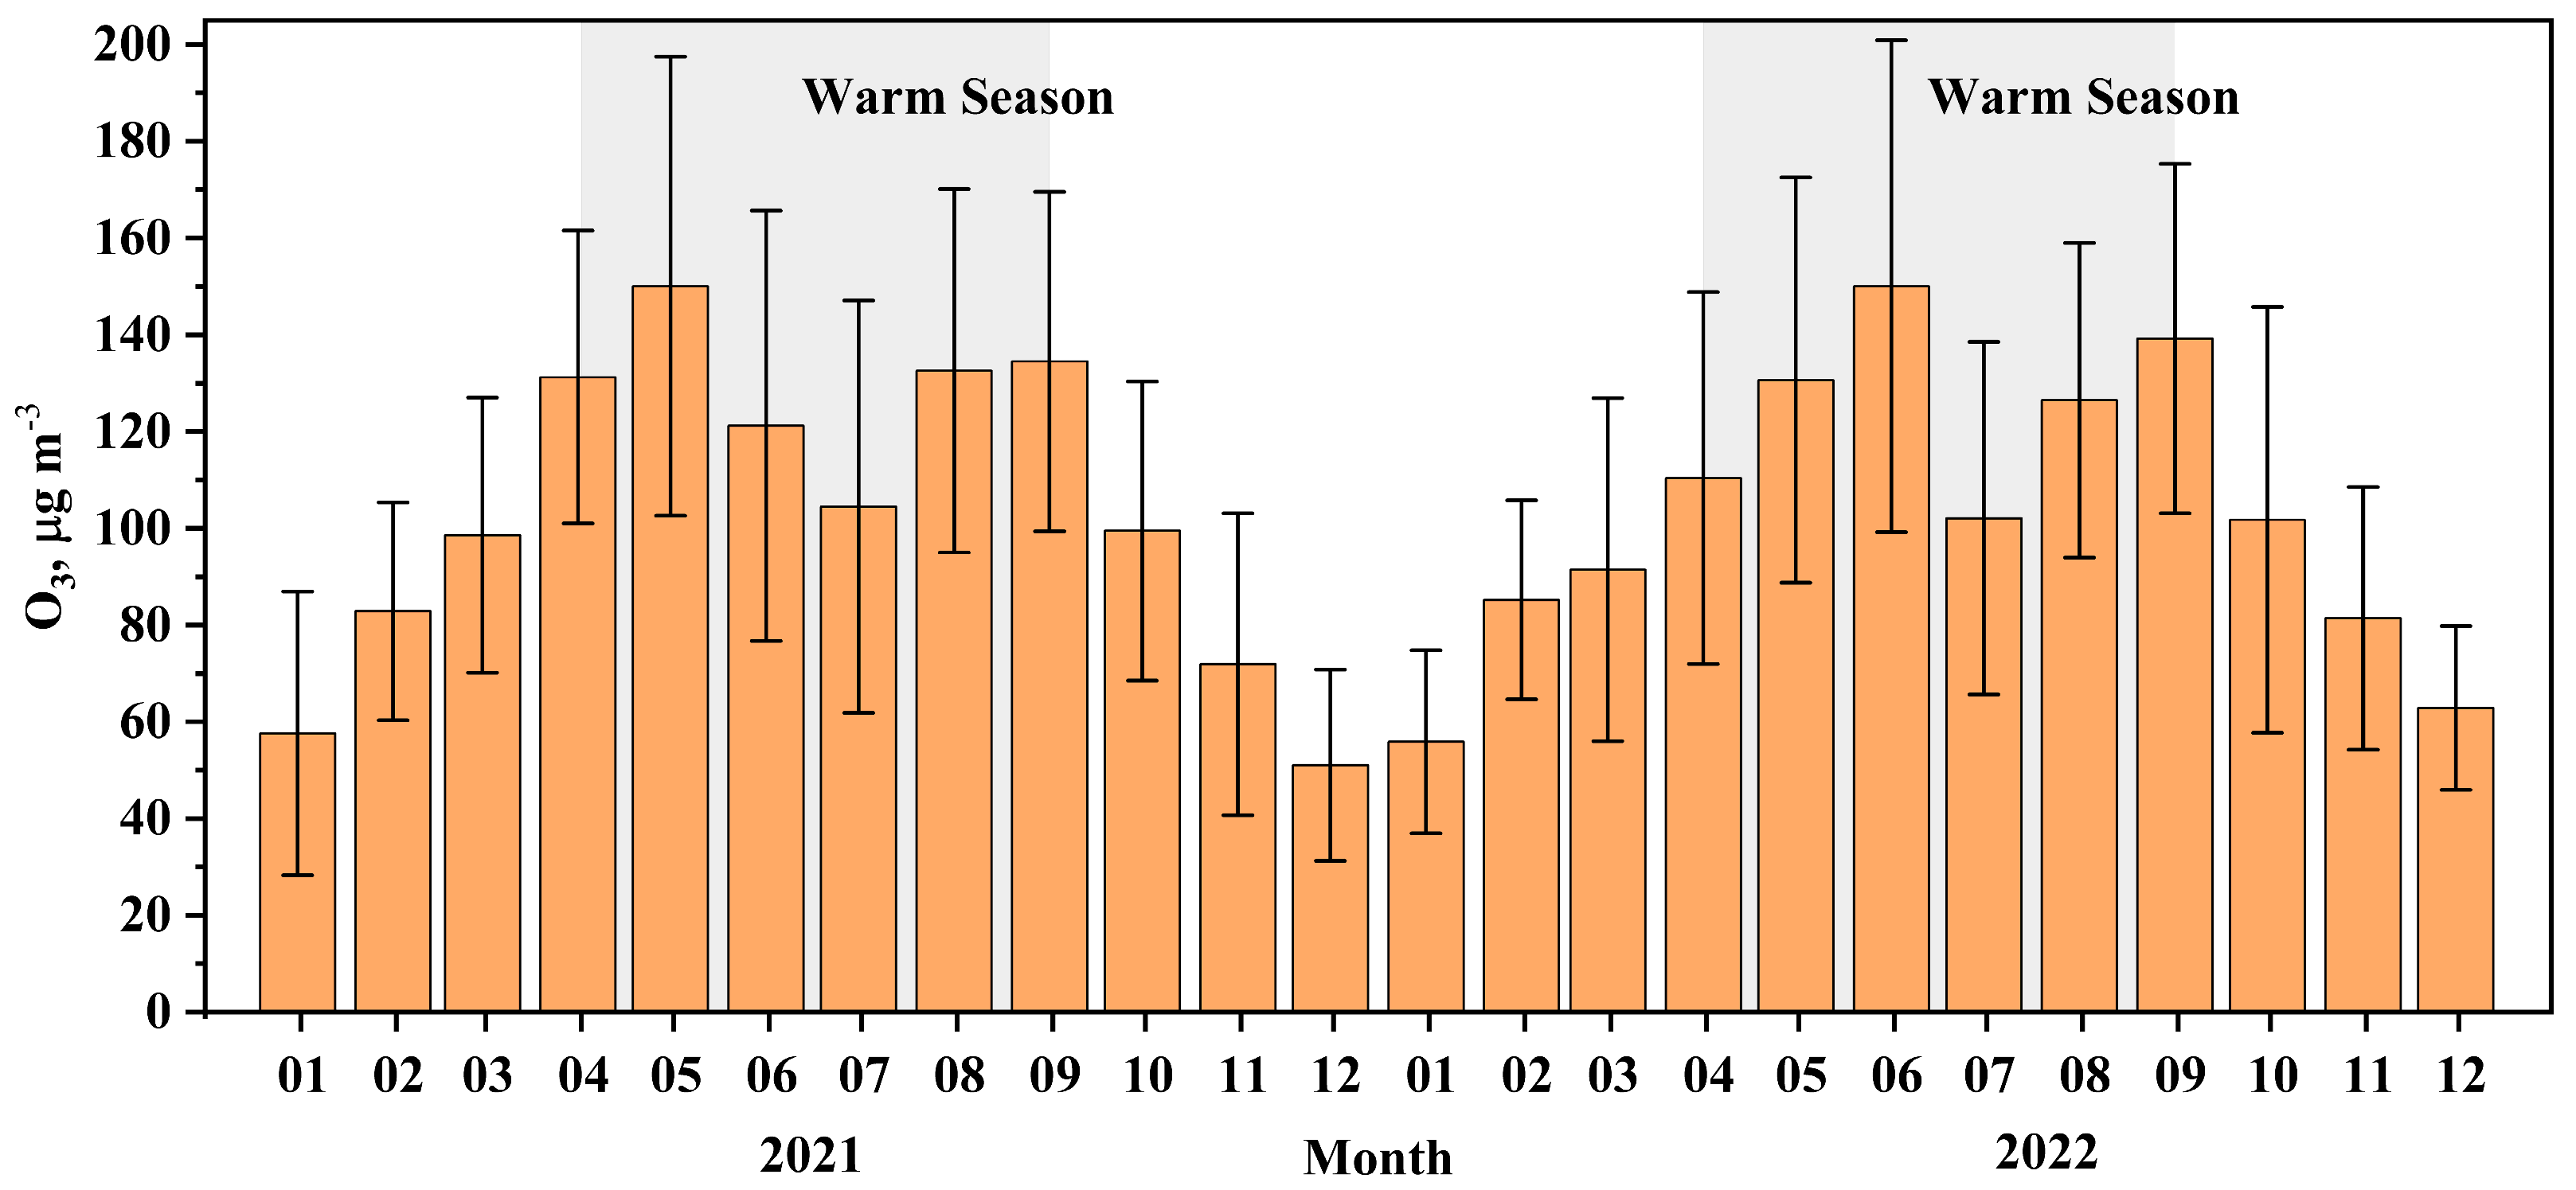
Figure 1. The monthly average ozone concentration in Nanjing during 2020 and 2021.
Toxics 13 00670 g001
Figure 2. Average diurnal profiles of (a) O3, (b) NOx, (c) NMHCs, and (d) isoprene; (e) the relationship between isoprene and acetylene; and (f) the contributions of biogenic and anthropogenic emissions to isoprene during April–September in 2020 and 2021.
Toxics 13 00670 g002
Figure 3. Temperature-dependent relationships of (a) O3, (b) NOx, (c) isoprene, and (d) anthropogenic non-methane hydrocarbons (NMHCs) observed from April to September in 2020 and 2021.
Toxics 13 00670 g003
Figure 4. Influence of wind direction and speed on O3, NOx, isoprene, anthropogenic non-methane hydrocarbons (NMHCs), and TEX (the sum of toluene, ethylbenzene, and xylenes), as determined by Non-Parametric Wind Regression (NWR) analysis in ZeFir toolkit [43].
Toxics 13 00670 g004
Figure 5. Six clusters of 12 h, 24 h, and 48 h air mass backward trajectories and their relative contributions. Trajectories were obtained from MeteoInfo for urban Nanjing during April–September of 2020 and 2021. The colored lines indicate clusters of air mass trajectories.
Toxics 13 00670 g005
Figure 6. Temporal variations of (a) wind, (b) temperature, and (c) O3, NMHCs, and NO2 concentrations during the four O3 pollution episodes.
Toxics 13 00670 g006
Figure 7. The 500 hPa and corresponding surface weather charts for (a,b) 17 August 2020, (c,d) 5 September 2020, (e,f) 21 June 2021, and (g,h) 22 September 2021. These charts were acquired from the China Meteorological Administration (https://www.wmc-bj.net (accessed on 29 June 2025)).
Toxics 13 00670 g007
Figure 8. Daily average relative incremental reactivity (RIR) values of NOx, anthropogenic NMHCs (AHC), and isoprene during the four O3 pollution episodes.
Toxics 13 00670 g008
Figure 9. Spatial distribution of WCWT values for O3 (ad) and NMHCs (eh) during four O3 pollution episodes. The star symbol indicates the location of the observation site NJ.
Toxics 13 00670 g009
Figure 10. (a) Average O3 concentrations and o-xylene/ethylbenzene (X/E) ratios for six trajectory clusters during 10:00–16:00; (b) correlation between O3 concentrations and X/E ratios.
Toxics 13 00670 g010
Figure 11. Average concentrations of NO2, NMHCs, and the NMHCs/NO2 ratio under six 12 h trajectory clusters during 10:00–16:00.
Toxics 13 00670 g011
Figure 12. Relative contribution of NOx-limited, NMHCs-limited, and transition O3 sensitivity regimes under six 12 h trajectory clusters.
Toxics 13 00670 g012
Figure 13. Relative contribution of six 12 h trajectory clusters during the O3 peak period (13:00–15:00) across the four episodes.
Toxics 13 00670 g013
Disclaimer/Publisher’s Note: The statements, opinions and data contained in all publications are solely those of the individual author(s) and contributor(s) and not of MDPI and/or the editor(s). MDPI and/or the editor(s) disclaim responsibility for any injury to people or property resulting from any ideas, methods, instructions or products referred to in the content.