Abstract
In contrast to mercury, an extremely toxic element, selenium is an essential micronutrient, which by complexing with mercury can mitigate its toxicity. In this regard, we quantified mercury and selenium concentrations in samples (n = 309) of fish tissues and analyzed the Se:Hg molar ratio and HBVSe as toxicological risk biomarkers. The data indicated that mercury levels in planktivorous fish (0.630 ± 0.202 mg kg−1) and carnivorous fish (1.196 ± 0.513 mg kg−1) were above the Brazilian limits considered safe for daily consumption. The highest selenium concentrations were observed in planktivores (0.272 ± 0.093 mg kg−1) and the lowest in herbivores (0.099 ± 0.092 mg kg−1). Molar ratios greater than one and positive HBVSe values were found in 42% of the fish samples (n = 131). As a result, we found that (i) the trophic level influences the risk of mercury exposure through the intake of fish in the diet; (ii) the approach presented in our study (model II) involves greater rigor concerning intake and exposure via fish consumption, since it considers the antagonistic Se:Hg ratio; and (iii) selenium can attenuate mercury toxicity, but safe thresholds vary depending on the species.
1. Introduction
Selenium (Se) is an essential element belonging to the chalcogen group of the periodic table [1]. Se is essential for the enzymatic activity of many proteins (selenoproteins) that act as antioxidants [2], with glutathione peroxidase (GSH-px) and selenoprotein P (SeIP) being the best known. Studies have identified 25 genes responsible for encoding selenoproteins in mammals [3,4]. Se levels can affect immunity as well as the expression of selenoproteins [5]. The limits of Se’s essentiality and toxicity are very tenuous. While the absence of Se in living organisms can cause physiological damage, chronic exposure leads to cases of intoxication [2,5,6].
In aquatic systems, Se chemical species are associated with three important processes: (i) exposure to selenate, selenite, elemental Se, and Se (-II) associated with deposition or resuspension; (ii) production of selenomethionine and selenocysteine, related to trophic transfer; and (iii) microbial activity, associated with the production of selenate, selenite elemental Se, and Se (-II) [7].
In the second half of last century, researchers observed that Se has the capacity to complex with metals such as mercury (Hg). This relationship results in insoluble HgSe complexes [8,9], as observed in studies of marine animals [10,11]. Some authors associated the presence of HgSe with a product of this relationship between the two elements, preventing the intoxicating action of Hg [8,10,12], since selenium can inhibit the accumulation of methylmercury (MeHg), induce Hg demethylation [13,14], and/or increase the elimination of methylmercury [14,15,16]. A Se:Hg molar ratio >1 is considered by many researchers to be an important factor of the potential protective action of Se [17,18,19,20]. However, Hg can manifest toxicity in the presence of Se deficiency [8], since Hg acts in the synthesis and incorporation of selenoproteins, impairing these processes [21]. It is essential to highlight that the protective effect of Se is a result of the antagonistic relationship between Se and Hg, which neutralizes and inhibits the toxic effects of Hg [22], as well as the detoxification process, which involves reducing toxicity and increasing the excretion of Hg [23].
The mitigation of Hg intoxication has been observed in studies with humans [23,24,25] and other mammals [20,26,27], seabirds [28,29], freshwater and marine fish [28,30,31,32,33], and seafood in general [34]. The possible protective effect of Se in relation to Hg may be an important factor for the health of people exposed to MeHg in the Amazon, since the average fish consumption in this region is 12 to 32 times greater than the Brazilian national average of 26 g day−1 [35,36,37]. Indeed, fish consumption is the main route of human exposure to Hg in the Amazon, where fish are important sources of protein and nutrients [38].
In geographically isolated communities, average consumption of up to 805 g day−1 was observed [37], while along the Madeira River, the main tributary on the right bank of the Amazon River, fish consumption varies from 320 to 406 g day−1 [36,39], although changes in eating habits have been observed in the lower Madeira River region [40,41,42]. Additionally, fish consumption increases with the geographic isolation of riverside communities from urban centers [38].
In the western Amazon, legal and illegal small-scale gold mining (ASGM) has been occurring for at least four decades. This gold is typically found in the form of small flakes in sediments, and metallic Hg (liquid phase) is used to amalgamate and separate the gold from these sediments [43]. Besides this activity, other anthropogenic sources are deforestation for agriculture and stock grazing, and construction of hydroelectric reservoirs, contributing to the remobilization and bioavailability of Hg and Se in aquatic ecosystems [44]. Especially in aquatic ecosystems, Hg undergoes chemical transformation to MeHg and bioaccumulates in the trophic chain until it reaches humans via fish consumption [45,46].
In the lower Madeira River, between the states of Rondônia and Amazonas, studies have highlighted the potential risks of fish consumption, especially of predatory fish species, in relation to Hg in riverine communities [36,40,41,47]. However, the classic toxicology of Minamata disease has not been reported in the region, even though the average Hg concentrations in more geographically isolated populations are higher than those recommended by Brazilian regulations [40,42]. On the other hand, recent studies have reinforced the protective role of selenium in relation to Hg toxicity [23,24,48,49,50]. Therefore, this study was guided by three main questions: (i) How do trophic levels influence selenium and total mercury concentrations in fish? (ii) Based on the Se:Hg molar ratio, health benefit value (HBVSe), and estimated daily intake (EDI), which fish species are safe for frequent human consumption? (iii) Can the traditional EDI model overestimate Hg intake when it disregards its interaction with Se? Based on these questions, our results provide a new and comprehensive framework for evaluating Hg exposure through fish consumption, considering the concurrent intake of Se.
2. Materials and Methods
2.1. Study Area
The study area was Puruzinho “Igarapé” (stream), which forms a lake with the same name, a tributary on the left bank of the Madeira River, located in the municipality of Humaitá, in the state of Amazonas (Figure 1). Lake Puruzinho is characterized by black water that seasonally is influenced by the clear water of the Madeira River (a phenomenon called “repiquete” in the region [51]. Its natural physicochemical characteristics are favorable to Hg methylation, present in high levels in biotic [51,52,53] and abiotic [51] environments. The land around the lake is the setting of a riverside community of the same name, whose residents live semi-isolated geographically and eat fish as their main source of animal protein. Around 123 individuals live there [42], potentially overexposed to Hg due to high fish consumption [36,41,53,54].
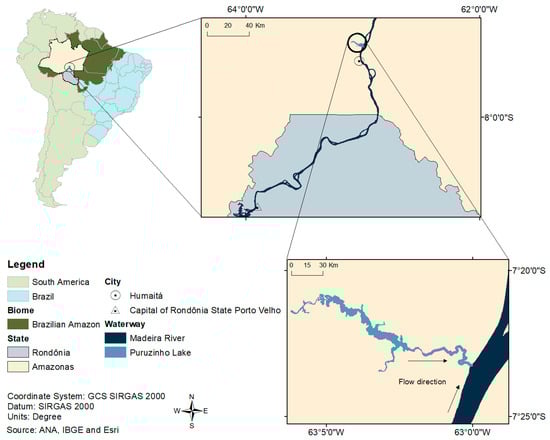
Figure 1.
Map showing the location of the study area.
2.2. Sampling
Fish collection was carried out between December 2019 and November 2020, covering the four seasonal periods of the hydrological cycle in the Amazon region: rising water (RW), high water (HW), falling water (FW), and low water (LW). The fish samples were collected using nets with mesh between 30 and 70 mm. The individuals were identified to the species level and measured for total weight and standard length. An aliquot of the dorsal muscle was collected and stored in a freezer (−20 °C) until Hg and Se quantification. Fish species were selected based on local consumption and economic value in the Amazon region [36]. A total of 309 individuals from 17 species and 5 trophic guilds were collected: herbivores (n = 60), detritivores (n = 77), planktivores (n = 61), carnivores (n = 47), and piscivores (n = 64) (Table S1). The trophic guilds of each species were obtained from the FishBase platform [55]. The data on sample size, trophic level, habitat, total weight, and standard length are shown in Table S2.
2.3. Mercury Determination
To quantify total Hg (THg), samples of dorsal muscle weighing 200 mg (wet weight) were obtained from predatory fish and 400 mg from non-predatory fish. The samples were subjected to acid solubilization [56]. We added 0.5 mL of hydrogen peroxide (H2O2, 30%, Merck®, Rahway, NJ, USA), and after reaction, 4.0 mL of an acidic mixture (1:1, HNO3:H2SO4, Merck®). These samples remained for 30 min in a digester block (TE-007MP, Tecnal, Piracicaba, Brazil) at 70 °C. After the samples had cooled to room temperature, we added 5.0 mL of potassium permanganate (KMnO4 at 5% w/v, Merck®), again at 70 °C, for another 20 min in the digester block. The cooled samples were reserved overnight, and the next day the excess oxidant was removed with drops of hydroxylamine hydrochloride (NH2OH.HCl 12% w/v, Merck®). The samples were adjusted to a final volume of 14 mL with ultrapure water (Milli-Q, Millipore, Bedford, MA, USA). To determine THg, we applied atomic absorption spectrophotometry with cold vapor generation (CV-AAS, FIMS-400, PerkinElmer, Waltham, MA, USA).
2.4. Selenium Determination
To measure the selenium content, around 400 mg of dorsal muscle (wet weight) was used and acid solubilization was performed, according to Neubauer and Magarini (2021) [57]. About 0.5 mL of hydrogen peroxide (H2O2 30%, Merck®) was added to each sample and then another 4.0 mL of 5.0 mol−1 nitric acid (HNO3 65%, Merck®). After 30 min in the digester block at 85 °C and cooling to room temperature, 4.0 mL of hydrochloric acid (HCl 37%, Merck®) was added. Then after 30 more minutes in the digester block, the samples were filtered and transferred to falcon tubes, to which ultrapure water (Milli-Q) was added to obtain a final volume of 10.0 mL. Selenium determination was performed using inductively coupled plasma-optical emission spectrometry (ICP-OES, Optima 8300 PerkinElmer with hydride generation—HG).
2.5. Analytical Quality Control
Certified reference material was used in all analytical runs, and different techniques were used to guarantee the reliability of the analytical data. Certified tuna fish material (BCR-463, Joint Research Center) was used, with recovery of 97.7 ± 0.5% for THg (n = 8, LOD = 0.001 mg kg−1, and LOQ = 0.005 mg kg−1). For Se determination, dogfish muscle (DORM-2, National Research Council Canada) was used, with recovery of 102.5 ± 0.6% (n = 3, LOD = 0.005 mg kg−1, and LOQ = 0.015 mg kg−1). The glassware was previously decontaminated with HNO3 (3%, Merck ®), and analytical blanks were used to guarantee the purity of the reagents. All samples presented Hg and Se concentrations above their respective limits of detection (LOD).
2.6. Se:Hg Molar Ratio and Selenium Health Benefit Value
The molar ratio (Se:Hg) and the health benefit value of selenium (HBVSe) are based on the stoichiometry of the interaction between Se and Hg in organisms. Both indicators are based on the formation of stable molecular complexes of Se with Hg, limiting its bioavailability and interfering with cellular processes. Therefore, these indicators were calculated with the molarity of each element, expressing the number of atoms or molecules. The Se:Hg molar ratio was calculated using Equation (1) as proposed by Burger et al. [58], where Se is the concentration of selenium in mg kg−1 and 78.96 is the atomic mass of selenium, while Hg is the concentration of mercury in mg kg−1 and 200.59 is the atomic mass of Hg. A molar ratio greater than 1 indicates that Se is present in excess of Hg, and a ratio less than 1 indicates the opposite, with toxicological potential to impair physiological functions [18,59].
The HBVSe is a risk assessment index in relation to fish consumption based on the protective effect of Se in relation to Hg [60]. HBVSe is an important indicator since it assesses the concentrations of Se and Hg in food and their impact on human health, since the concentration of Hg in food alone does not accurately indicate the risk of poisoning [60], so HBVSe is considered an appropriate and consolidated index in the literature. HBVSe was calculated using Equation (2), where Se is the molar concentration of selenium and Hg is the molar concentration of mercury in each sample [60]. Positive HBVSe values indicate that the individual has higher concentrations of selenium compared to mercury, suggesting the protective effect of selenium. In contrast, negative HBVSe values indicate higher concentrations of mercury compared to selenium, so there is no neutralization of the toxic effects of Hg by Se.
2.7. Estimates of Hg Intake Through Fish Consumption
The Hg concentrations in all samples (n = 309) were compared directly with the limits defined for carnivorous and non-carnivorous fish by Brazilian regulations [61], which is the same as that used by international organizations [62]. Next, we used two models to estimate daily Hg intake through fish consumption using distinct approaches for comparison purposes. We select a subset of samples representative of all trophic guilds, aiming to select only samples with Se:Hg molar ratios lower than zero (i.e., excess concentrations of Hg relative to Se) (n = 178, Table S3).
In the first model, we used the traditional estimated daily intake (EDI), calculated by multiplying the total Hg concentrations determined in each fish sample by the fish intake rate (from different trophic guilds) for the Amazon and then dividing by the average weight of the human population (model I). The Hg concentrations were obtained in our study, fish consumption data (406 g day−1) were extracted from a previous study in the Puruzinho Lake [36], and population weight data (65 kg) were obtained from the Brazilian Institute of Geography and Statistics (IBGE) [63].
In the new approach to calculate EDI presented in this study (model II), in addition to total Hg concentrations, fish intake, and population weight, the concomitant intake of Se was also considered. This is a novel approach that considers the protective effects of Se. Here, we assumed that all ingested Se would have a protective effect against Hg, by forming SeHg, rendering Hg unavailable to cause harm to the organism. In this sense, we calculated the risk of Hg ingestion considering only the excess concentrations of Hg relative to Se (HgFree). Molar concentrations of Se were subtracted from those of Hg (expressed in molar units), and the resulting Hg concentrations were then multiplied by its atomic weight (200.59) to convert values to mass-based units (mg kg−1, wet weight). After this calculation, all computations were performed as in model I. The limits were compared with those defined by the model of the Joint FAO/WHO Expert Committee on Food Additives (JECFA) [62], which establishes the provisional upper tolerable weekly intakes of Hg (PTWI limit) of 1.6 µg kg week−1 (or 0.57 µg kg day−1). Considering that PTWI values are based on MeHg concentration, we used THg as a proxy for MeHg [40].
2.8. Hg and Se Modeling via Fuzzy Logic
Fuzzy logic was employed to develop an integrated risk–benefit indicator for mercury exposure through fish consumption. Total Hg concentrations and the corresponding estimated daily intake (EDI, model II) were treated as risk indicators, with higher values indicating greater risk. In contrast, the molar ratio (Se:Hg) and the health benefit value of selenium (HBVSe) were considered benefit indicators, where higher values reflect greater protective effects. The integrated risk–benefit indicators were derived from the cost-efficiency framework proposed by Campos et al. [64].
The variables were classified into five risk levels (Table 1). Total Hg, Se:Hg, and HBVSe were stratified based on the 5th, 25th, 50th, 75th, and 95th percentiles, while estimated daily intake (EDI) values were categorized according to regulatory safety thresholds (Table 1). Harmony degrees (HDs) were then calculated for both risk and benefit indicators, standardizing the outputs on a 0–1 scale (see Luo et al. [65] for methodological details). Equal weights were assigned to each variable, and the integrated risk–benefit index was calculated using Equation (3), incorporating the protective role of selenium. The final results were normalized by data range, producing a risk scale for each fish sample: very low (0–0.20), low (0.21–0.40), moderate (0.41–0.60), high (0.61–0.80), and very high (0.81–1.00).

Table 1.
Classification of input variables for normalization by harmony degrees and calculation of the risk index. Risk indicators: the higher the value, the greater the risk. Benefit indicators: the higher the value, the greater the benefit.
2.9. Statistical Analysis
We applied the Shapiro–Wilk test (for n < 50) and the Kolmogorov–Smirnov test (for n > 50) to assess data distribution. Differences in THg, Se, Se:Hg, and HBVSe were evaluated using the Kruskal–Wallis test, followed by Dunn’s post hoc test (n = 309). The integrated risk–benefit index showed a normal distribution; therefore, inter-guild comparisons were performed using analysis of variance (ANOVA) followed by Tukey’s post hoc test (n = 178). Kendall’s non-parametric correlation was employed to assess the relationships between THg and Se concentrations and fish standard length and weight. Although some correlations were statistically significant within certain trophic guilds, the strength of these associations was weak to moderate (Table S4). Therefore, THg and Se concentrations were not adjusted for body size prior to the comparative analyses. Paired t-tests and Wilcoxon signed-rank tests were used to compare THg and Se concentrations within the same samples from each trophic guild, as well as to compare intake estimates from the two models (traditional and Se-inclusive) (n = 178). A significance level of p < 0.05 was adopted for all statistical analyses.
Principal component analysis (PCA) was used to evaluate the dissimilarity of THg and Se concentrations, standard length and weight of fish, considering the most abundant species of the five trophic guilds evaluated, namely Mylossoma aureum (herbivore, n = 29), Hemiodus unimaculatus (detritivore, n = 34), Hypophthalmus marginatus (planktivore, n = 37), Cichla pleiozona (carnivore, n = 36), and Serrasalmus rhombeus (piscivore, n = 38) (Table S5). All comparison tests were carried out using Prism® 10.4.1 (GraphPad Software, San Diego, CA, USA. License: Federal I.D. #33-0386987). Principal component analysis was performed in the R programming environment [66].
3. Results
3.1. Influence of Trophic Guild on Mercury and Selenium Concentrations
THg concentrations were significantly higher than Se concentrations in all trophic guilds (p < 0.05, Table S6). Hg concentrations were above those recommended by Brazilian regulations in 44% of the samples (n = 136). At the species level, average THg concentrations above the Brazilian safety limit were determined for the predatory species Calophysus macropterus, Cichla pleiozona, and Pellona castelnaeana (>1 mg kg−1), and the non-predatory species Anodus elongatus, Hemiodus unimaculatus, and Hypophtalmus marginatus (>0.5 mg kg−1) [67]. Carnivorous (1.196 ± 0.513 mg kg−1) and piscivorous (0.947 ± 0.382 mg kg−1) species had the highest THg concentrations, followed by planktivorous (0.630 ± 0.202 mg kg−1), detritivorous (0.517 ± 0.382 mg kg−1), and herbivorous (0.205 ± 0.425 mg kg−1) species (KW = 161.4; p < 0.0001) (Figure 2a, Table S7).
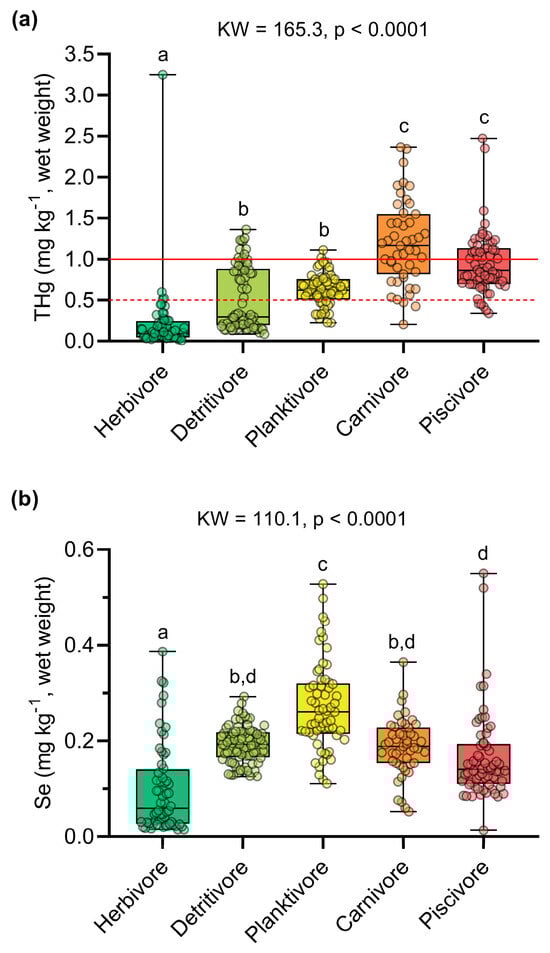
Figure 2.
Comparison of the concentrations of (a) total mercury (THg) and (b) selenium (Se) between the trophic guilds. The letters above the boxplots indicate significant differences determined by Dunn’s post hoc test (p < 0.05). In (a), the solid and dashed red lines indicate the Hg safety limits for predatory species (1 mg kg−1) and non-predatory species (0.5 mg kg−1), respectively [61].
Selenium concentrations also varied among trophic guilds (KW = 110.1; p < 0.0001), exhibiting different bioaccumulation patterns compared to mercury. The highest concentrations were found in planktivorous species (0.272 ± 0.093 mg kg−1) and detritivorous species (0.193 ± 0.038 mg kg−1). In contrast, the lowest Se concentrations were observed in herbivorous (0.099 ± 0.092 mg kg−1), piscivorous (0.166 ± 0.091 mg kg−1), and carnivorous (0.188 ± 0.060 mg kg−1) species (Figure 2b, Table S7). Principal component analysis explained 85.1% of the variation in the data. Axis 1 (61.1%) revealed a high dissimilarity of the herbivorous species Mylossoma aureum in relation to the other trophic guilds, which were inversely ordered according to THg and Se concentrations (Figure 3). Indeed, the herbivore guild exhibited the lowest THg and Se concentrations in our dataset (Figure 2). Axis 2 (24.0%) showed a clear separation between the predatory species C. pleiozona and S. rhombeus (carnivorous and piscivorous, respectively), associated mainly with THg concentrations and the weight of individuals. In turn, the planktivorous species H. marginatus was associated with high Se concentrations and the length of individuals. The detritivorous species H. unimaculatus had a large overlap with the piscivorous and planktivorous species (Figure 3).
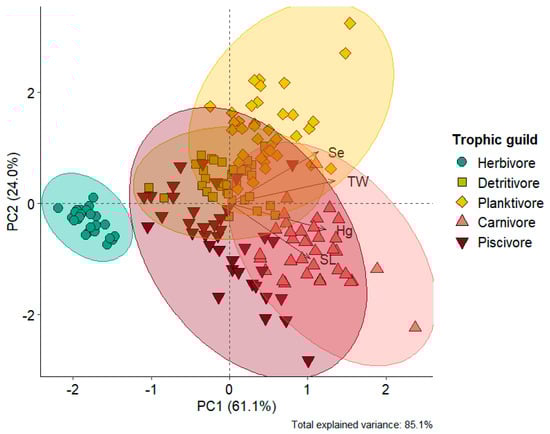
Figure 3.
Bivariate plot of the projection of eigenvectors and scores on the principal axes (eigenvalues) of the principal component analysis, including Hg (mg kg−1) and Se (mg kg−1) concentrations, standard length (SL), and total weight (TW) in representative species from the five guilds, namely Mylossoma aureum (herbivore), Hemiodus unimaculatus (detritivore), Hypophthalmus marginatus (planktivore), Cichla pleiozona (carnivore), and Serrasalmus rhombeus (piscivore).
3.2. Se:Hg Molar Ratios and Selenium Health Benefit Value (HBVSe)
Molar ratios greater than one and positive HBVSe values were found in 42% of the fish samples (n = 131), with a predominance of detritivorous (n = 45), herbivorous (n = 45) and planktivorous species (n = 34), along with a small number of carnivores (n = 3) and piscivores (n = 4). The herbivorous (2.085 ± 1.646), detritivorous (1.706 ± 1.304), and planktivorous (1.246 ± 0.735) species had Se:Hg molar ratios significantly higher than those determined for carnivorous (0.485 ± 0.337) and piscivorous (0.484 ± 0.258) species (KW = 146.5; p < 0.0001) (Figure 4a, Table S7). Similarly, HBVSe values were significantly higher in herbivorous species (0.0005 ± 0.0013), followed by planktivores (−0.00005 ± 0.0032) and detritivores (−0.0017 ± 0.0047), and finally, piscivores (−0.0126 ± 0.0193) and carnivores (−0.0157 ± 0.0142) (KW = 139; p < 0.0001) (Figure 4b, Table S7).
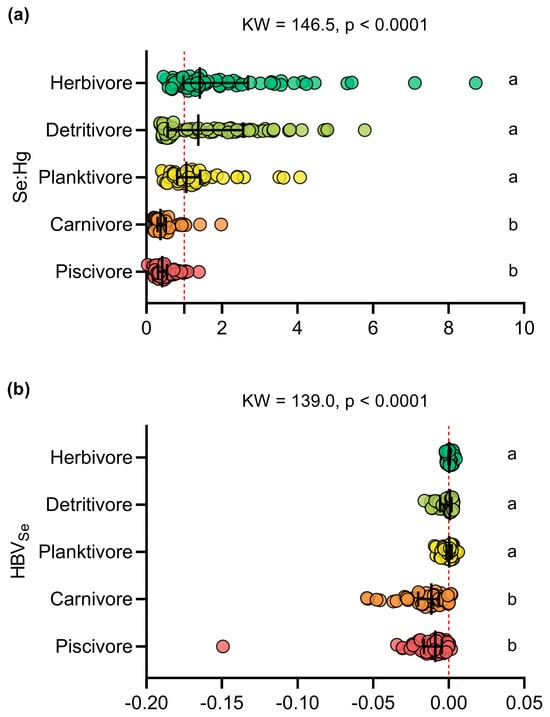
Figure 4.
Comparison of the (a) selenium–mercury molar ratio (Se:Hg) and (b) selenium health benefit value (HBVSe) between the trophic guilds. The letters indicate significant differences determined by Dunn’s post hoc test (p < 0.05).
3.3. Estimated Daily Intake of Hg Through Fish Consumption
The estimated daily intake (EDI) of Hg based on the traditional approach (model I) ranged from 1.71 ± 1.22 µg kg day−1 for herbivores to 7.78 ± 3.05 µg kg day−1 for carnivores (Table 2). All trophic guilds showed average Hg consumption above that recommended by the FAO (0.57 µg kg day−1) [67]. However, the estimates of Hg intake by detritivorous fish were significantly lower than those of the other guilds, with EDI below the limit for four individuals of the M. aureum species.
Table 2.
Descriptive statistics of the estimated daily intake (EDI) of Hg using the traditional approach (model I) and considering the concomitant intake of Se (model II) (µg kg day−1). The reduction in EDI between the models is indicated as a percentage (%). SD: standard deviation. IQR: interquartile range. Range: minimum to maximum. The EDI was calculated based on the consumption of fish by the local population (406 g day−1) and the average body weight of the adult population of the state of Amazonas (65 kg).
Based on the concomitant ingestion of Se (model II), all trophic guilds showed significant reductions in estimated Hg intake compared to the traditional approach (model I) (p < 0.05, Table S6). Mean Hg intake ranged from 0.43 ± 0.36 to 4.86 ± 2.93 µg kg−1 day−1 for herbivores and carnivores, respectively (Table 2). Despite the reduction in estimated intake, only the herbivore trophic guild showed a mean Hg intake below the regulatory threshold of 0.57 µg kg−1 day−1, representing a 73% reduction compared to model I. The smallest decreases in EDI between models were observed for carnivorous (41.8 ± 19.4%) and piscivorous (44.1 ± 19.8%) fish (Table 2). Under model II, approximately 15% of the samples (n = 26) exhibited EDI values below the safety threshold, mainly herbivorous (n = 10) and planktivorous (n = 10) species, with lower occurrences among carnivorous (n = 3) and piscivorous species (n = 3).
3.4. Integrated Risk–Benefit Index
The integration of THg, EDI (model II), Se:Hg, and HBVSe using harmony degrees and fuzzy logic revealed that most fish samples posed a low (33.7%) or moderate (24.7%) consumption risk, followed by high (21.9%) and very low (18.5%) risk levels. Only two individuals of the carnivorous species Cichla pleiozona exhibited a very high consumption risk (1.1%) (Figure 5, Table S8). In addition, over half of the individuals who presented a high risk were from the C. pleiozona species. Therefore, C. pleiozona presents the highest risk of consumption among the species evaluated in our study. The safest species for consumption was the detritivore Hemiodus unimaculatus, which showed the highest proportion of samples with low and very low risk. The planktivorous species Hypophthalmus marginatus and the piscivorous Serrasalmus rhombeus, in turn, were predominantly associated with low to moderate risk levels.
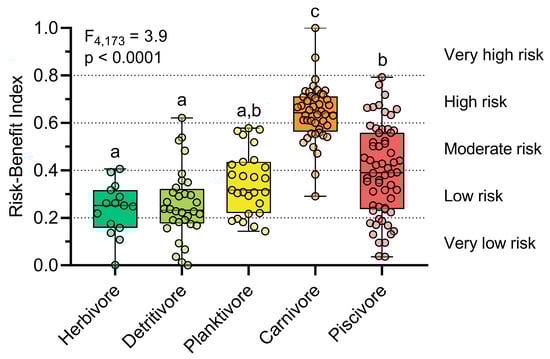
Figure 5.
Comparison of the risk–benefit index, based on fuzzy logic and harmony degrees, between the trophic guilds. The letters indicate significant differences determined by Dunn’s post hoc test (p < 0.05). Risk levels: very low (0–0.2), low (0.21–0.4), moderate (0.41–0.6), high (0.61–0.8), and very high (0.81–1).
In addition to the variation in risk between species, the distributions of risk levels varied substantially between trophic groups (F4,173 = 38.87, p < 0.0001) (Figure 5, Table S8). Herbivores and detritivores presented mostly low risk (60.0% and 53.1%, respectively), followed by very low risk (33.3% and 34.4%, respectively). Planktivores had a higher frequency of low risk (48.1%) and moderate risk (33.3%). In contrast, carnivores were predominant in the highest-risk categories: 65.9% of individuals were classified as high risk and 25.0% as moderate, with only 4.5% at low risk. Piscivores showed a wider distribution, with 33.3% at moderate, 31.7% at low, and 20.0% at very low risk, while 15.0% were classified as high and 4.5% as very high risk. These results indicate a gradient of increasing risk along the trophic chain, with carnivores and piscivores concentrating the highest proportions in the high-risk classes.
4. Discussion
4.1. Biomagnification of Total Mercury (THg) in the Food Chain
Lakes are depositional environments that receive Hg from natural and anthropogenic sources, where the hydrodynamic properties, such as the occurrence of anoxic zones and the high content of organic matter, favor the bioaccumulation and biomagnification of Hg in abiotic and biotic compartments [68]. This process is intensified in floodplains, where seasonal dynamics alter the physicochemical conditions (pH and dissolved oxygen), depth, and content of dissolved organic matter in lakes [68,69,70,71]. Hence, relatively high concentrations of Hg were observed in the bottom sediment (0.03 and 0.15 mg kg−1; [51]) and in the planktonic community (0.03 and 0.34 mg kg−1; [72]) of Lake Puruzinho, representing important sources of Hg for fish.
Our data show that planktivorous, carnivorous, and piscivorous fish had concentrations above the recommended limit for human consumption according to Brazilian legislation [61] (Figure 2a), in accordance with previous studies carried out in Lake Puruzinho [36,41,53,73,74]. Total Hg concentrations in Amazonian aquatic and terrestrial plants vary between 0.02 and 0.06 mg kg−1 [71,75], justifying the lower concentrations in herbivorous fish. In contrast, despite the high concentrations in the bottom sediments of Lake Puruzinho and the suspended particulate matter of the Madeira River basin (0.05–2.62 mg kg−1; [76]), the low availability of organic Hg in these matrices reduces dietary exposure in detritivorous fish [72,77].
Land use changes can also modify limnological conditions and intensify the transport of inorganic Hg bound to soil particles into aquatic ecosystems, altering the distribution at the base of trophic chains and in the ichthyofauna [78,79,80,81]. Lacerda et al. (2024) [44] found a temporal increase in Hg concentrations in the detritivorous species Prochilodus nigricans and the carnivorous species Cichla pleiozona, with higher concentrations in the lakes compared to the main channel of the Madeira River in the most recent years (2019–2021). This temporal trend was mainly attributed to intense deforestation in the Madeira River basin [44]. Indeed, Almeida et al. (2014) [51] showed that the spatial distribution of Hg in sediments is affected by the lateral transport of water from the Madeira River during the flood period. Additionally, despite the reduction in mining activity in recent years, artisanal and small-scale gold mining is an important factor for the high Hg concentrations in fish in the Amazon [82].
4.2. Patterns of Selenium (Se) Bioaccumulation Among Trophic Guilds
Selenium concentrations in fish from Lake Puruzinho were lower than those found by Dorea et al. (1998) [33] in the Madeira River basin (state of Rondônia, Brazil) and Lima et al. [32] in the state of Pará (Brazil) and are closer to those found by Albuquerque et al. [83] in Santarém (state of Pará, Brazil) and by Lino et al. [77] and Sampaio da Silva et al. [84] in the Lower Tapajós (state of Pará). The relatively small number of studies on Se in Amazonian fish makes it difficult to determine clear patterns of bioamplification. For example, Dorea et al. (1998) [33] demonstrated that Se concentrations increase according to trophic level, while Lino et al. [77] indicated higher Se concentrations in fish from low trophic levels. In our study, the highest concentrations of Se were found in planktivorous fish, which occupy intermediate trophic levels in fish communities.
Despite the low concentrations of Se in the herbivore trophic guild in our study, there was no clear pattern of bioamplification in the trophic chain. Detritivorous species, which occupy the base of the trophic chain, showed similar concentrations to carnivorous species. This behavior may be related to the low availability of Se in the environment [85], although the biomagnification of Se in trophic guilds does not have a pattern or behavior established in the literature [86]. It should be noted that freshwater fish tend to contain lower concentrations of Se than marine fish [86]; however, most of the Se present in freshwater fish is in organic form (selenomethionine), which can increase the excretion of Hg and hence reduce its possible toxicological effects [87]. In addition, fish may increase their absorption of Se in response to exposure to Hg, as a way of ensuring the production of selenoproteins and mitigating Hg toxicity [88], justifying the inverse pattern of THg and Se across trophic guilds shown by PCA.
The heterogeneity of the distribution and bioavailability of Se in the soil and aquatic environment is complex and associated with various factors such as physicochemical parameters, organic matter, and chemical speciation [89]. The soil in the study area has a mean Se concentration of 0.355 mg kg−1 (unpublished data), below the global average (0.400 mg kg−1) [90,91] and Se-deficient (<0.500 mg kg−1) [92]. Geographical location, anthropogenic sources, atmospheric deposition, and geological formations all influence Se levels in the environment [93]. In our study area, deep oxisols (>2 m) with low fertility and high acidity predominate [94], reducing the availability of Se.
Se concentrations in plants tend to reflect the concentrations of this element in the soil [91,95]. In addition, soil acidity is a crucial factor in the absorption of Se by plants, as it facilitates the formation of insoluble HgSe compounds under slightly acidic pH conditions, thereby limiting its absorption by plants [95,96,97]. Even soils rich in Se and organic matter can have the bioavailability of this micronutrient affected by pH [91]. The relationship between soil acidity and Se content was observed in the Amazon in Bertholletia excelsa (Brazil nut), showing that more acidic soils produced fruit with lower Se contents than slightly alkaline soils [89,98]. This is most likely because acidic soils tend to decrease the bioavailability of Se (IV), the most soluble and bioavailable form of Se in the soil [99]. Given that the diet is the main route of Se absorption for living organisms [6], the low levels of Se in herbivorous fish may reflect the low levels of Se in the soil and the low capacity of most plants to absorb Se.
4.3. Health Benefit Value of Se and Estimates of THg Intake by the Riverside Population
The selenium health benefit value (HBVSe) was mostly negative in our dataset (Figure 4b), different from the values found in freshwater fish from Brazil [78] and other regions of the world [93,100]. However, the higher HBVSe values in non-carnivorous species are consistent in the scientific literature. In the Brazilian Amazon, Lino et al. [77] obtained negative HBVSe values only for carnivorous species, including the voracious predators of the Cichla genus. In northern Colombia, negative HBVSe values were obtained for opportunistic omnivorous and carnivorous species, which have a wide variety of food sources and, consequently, greater exposure to Hg through the diet [93].
Along these lines, the Se:Hg molar ratio smaller than one in predators and the negative HBVSe values can be explained by the lack of physiological functions of Hg [46] and its relatively high concentrations in the biotic and abiotic compartments of our study area [41,51,52,72,74,101], intensifying the bioaccumulation and biomagnification of Hg in fish. It is necessary to note that the Hg concentrations in fish from the Madeira River are higher than those determined in the studies mentioned above [77,93,100], justified mainly by the ASGM and the intensification of deforestation in recent decades, as previously discussed [43,44,102].
In contrast, Se is an essential chemical element for metabolic reactions and has homeostatic control in organisms, thus controlling the concentrations of this element, regardless of the concentrations in the environment and according to physiological needs [103]. In addition, the low capacity for bioaccumulation and biotransfer in the trophic chain of Se compared to Hg (Figure 2b) directly implies the results of the molar ratio and benefit value. Recently, Pontes et al. (2025) [104] showed that higher concentrations of Se in the blood can mitigate the metabolic changes induced by Hg in humans. However, only the Se available in fish is not sufficient to mitigate the toxic effects of Hg in our study area. For example, Hg concentrations were higher than Se concentrations in all the species analyzed in our study, while Córdoba-Tovar et al. (2025) [93] determined Se concentrations twice as high as Hg concentrations in carnivorous and non-carnivorous species, resulting in molar ratios predominantly greater than one.
A large cohort study conducted in the Brazilian Amazon indicated that Hg concentrations in the population’s blood increased according to fish consumption; however, no relationship was observed between fish consumption and Se concentration [105]. Similarly, positive correlations between the consumption of carnivorous fish and Hg concentrations in hair were described in a riverside community along the Tapajós River (Amazon), but no significant relationship with the consumption of non-carnivorous fish was observed [106]. In addition to the comparatively low Hg concentrations, low-trophic-level species have high nutritional value, high abundance in Amazonian ecosystems, and low commercial value, thus representing an important food source for riverine populations [107]. Supplementing the diet with other sources of Se, including Brazil nuts and fruits, is also an important factor increasing Se levels in the body and mitigating the toxicological effects of Hg [107,108]. In addition to selenium’s protective effect on Hg toxicity, fruit consumption alters the kinetics of Hg in the human organism [106,109]. In an epidemiological study in the Tapajós River region, ref. [110] observed an inverse relationship between Hg concentrations and fruit consumption, attributed to the content of soluble dietary fiber and probiotic nutrients in fruits that could affect absorption in the gastrointestinal tract.
The concentrations of Hg in herbivorous and detritivorous species were considered safe for human consumption according to Brazilian regulations [61]. However, the safe limit does not consider the high fish consumption typical of riverine residents in the Amazon. Despite the dietary diversification promoted by the nutritional transition in recent decades, fish is still the main source of protein for these people [110,111,112], causing greater vulnerability to Hg exposure [113]. The herbivores Mylossoma ssp. are the main source of fish protein in the neighboring riverside community Demarcação, with estimated daily consumption within the limits established by the FAO [40]. However, the fish consumption estimated by Canela et al. [40], based on the average consumption of riverside communities on the Madeira River [39], was 20% lower (320 g day−1) than those reported in our study area (406 g day−1) [36]. In addition, people living near Lake Puruzinho consume fish on average four to five times a week [42], intensifying dietary exposure to Hg.
When considering only the fish consumption (model I), the estimates of daily Hg intake exceeded the provisional tolerable limit (0.57 µg kg day−1) set by the Joint FAO/WHO Expert Committee on Food Additives (JECFA) [62]. Using the new approach proposed here (model II), based on consumption rate and Se-free Hg concentration, only fish of the herbivore guild were considered safe for consumption. It is important to note that, according to model II, the average intake estimates were substantially reduced, showing a reduction of between 41.8 and 44.1% for predatory species and between 54.3 and 75.7% for non-predatory species (Table 2). Thus, by only considering Hg concentrations, the traditional model could potentially overestimate Hg intake estimates through fish consumption.
The integrated assessment of Hg and Se intake, considering both risk indicators (THg and EDI) and benefit indicators (Se:Hg and HBVSe), confirmed that herbivorous and detritivorous fish present a lower risk of Hg exposure. This finding is particularly relevant since the local population in our study area primarily consumes herbivorous and detritivorous fish [36]. Although the HBVSe values in these trophic guilds were relatively modest, they may help mitigate health risks. Positive HBVSe in food is important because it reflects the availability of Se for the synthesis of selenoproteins and the enhancement of enzymatic activities such as thioredoxin reductase (TrxR) [114]. Selenoproteins play a crucial role in counteracting Hg toxicity by reducing oxidative damage (via glutathione peroxidase, GPx), transporting Se from plasma to the brain (selenoprotein P, SelP) [115,116], and regulating the redox state (TrxR), thus maintaining selenoprotein activity. Essentially, selenoproteins detoxify Hg and mitigate Hg-induced oxidative stress. In this context, modeling exposure risk using fuzzy logic that incorporates the protective effects of Se enabled the identification of patterns that might be overlooked when evaluating Hg concentrations alone. For example, although Hg biomagnification along the trophic chain is evident, with higher concentrations in piscivorous and carnivorous fish (Figure 2), the integrated risk–benefit index indicated that the piscivorous species Serrasalmus rhombeus may pose a very low to moderate risk to human consumers (Table S8).
The five-level risk gradient enabled the identification of the safest species for consumption. In addition to Serrasalmus rhombeus, the detritivorous species Hemiodus unimaculatus is recommended, as it consistently exhibited low to very low risk levels. The planktivorous species Hypophthalmus marginatus showed low to moderate risk, suggesting it should be consumed with caution. Conversely, the carnivorous species Cichla pleiozona predominantly presented high to very high risk levels and should be avoided when possible. Thus, the proposed framework, which integrates fuzzy logic and harmony degrees within a risk–benefit approach, provides a realistic and practical tool to enhance the accuracy of risk assessments in fish-dependent populations. Beyond its ease of interpretation by both the population and decision-makers, a key strength of this approach lies in its flexibility to incorporate diverse numerical variables and assign weights proportional to their respective risk or benefit of Hg and Se intake.
5. Conclusions
Total Hg concentrations above those recommended by Brazilian regulations were determined for predatory species (>1 mg kg−1; n = 56) and non-predatory species (>0.5 mg kg−1; n = 81). Hg concentrations were significantly higher than Se concentrations and showed different bioaccumulation patterns among the trophic guilds. Hg concentrations had a clear pattern of biomagnification in the trophic chain, while Se concentrations did not differ between carnivorous and non-carnivorous species. The lowest concentrations of both elements were found in herbivorous fish, showing greater dissimilarity with the other trophic guilds.
We found molar ratios greater than one and positive HBVSe values in 42% of the fish samples (n = 131), with a predominance of detritivorous, herbivorous, and planktivorous species. However, our results showed that the Se concentrations were not sufficient to reduce Hg exposure. Despite the comparatively lower estimated intake of species with low trophic level, daily intake exceeded the safe limit, except for the herbivore guild in the model considering Se-Hg antagonism (new approach). According to the traditional approach to estimate intake, only four individuals of the herbivorous species Mylossoma aureum had intake below the safe limit. In contrast, according to the new approach proposed here, 26 individuals had estimated intake below the safe limit, including predatory species.
Brazilian regulations on safe levels of Hg for human consumption only consider the absolute concentration in fish, underestimating the risk of exposure of people for whom fish is the main source of protein. Furthermore, the traditional approach to estimating daily intake (model I) considers fish consumption and total Hg concentrations, including those complexed with Se, potentially overestimating the intake rate. The approach presented here (model II) proposes more stringent limits concerning actual intake and exposure via fish consumption, since it considers the Se-Hg relationship. It is important to note that this approach is only functional for samples whose Hg molarity exceeds that of Se. It can be widely applied in neotropical ecosystems (especially in the Amazon) and regions impacted by anthropogenic sources of Hg.
The application of fuzzy logic and harmony degrees to create an integrated risk–benefit index provides a novel framework for interpreting commonly used metrics in the scientific literature (e.g., Se:Hg and HBVSe). Fuzzy logic-based indices have been applied in the environmental management context, delivering results that are easily interpreted by both the scientific community and decision-makers [64,65,117]. Here, we classified fish under different gradients of Hg and Se concentrations into five risk categories, making it possible to identify the safest species (Hemiodus unimaculatus and Serrasalmus rhombeus) for consumption and those that should be avoided when possible (Cichla pleiozona). In this context, we emphasize that our study is strictly in accordance with Article 19 of the Minamata Convention, which highlights the importance of geographically representative modeling and monitoring of Hg concentrations in vulnerable populations and in the environment (including in fish) [118].
Supplementary Materials
The following supporting information can be downloaded at: https://www.mdpi.com/article/10.3390/toxics13080621/s1, Table S1: Raw data; Table S2: Sample characterization; Table S3: Estimated daily intakes—model I and model II; Table S4: Kendall correlation; Table S5: Principal component analysis; Table S6: Paired comparisons; Table S7: Multiple comparisons; Table S8: Risk–benefit index.
Author Contributions
Conceptualization, C.d.S.C., L.C.M., R.d.A. and I.A.P.; methodology, C.d.S.C., T.A.M.P., W.A.d.C.J., I.A.d.S.O., T.A.C. and I.A.P.; software, C.d.S.C., L.C.M. and I.A.P.; validation, C.d.S.C., T.A.M.P. and W.A.d.C.J.; formal analysis, C.d.S.C., L.C.M. and I.A.P.; investigation, C.d.S.C., L.C.M., W.A.d.C.J. and T.A.M.P.; resources, R.d.A.; data curation, C.d.S.C., L.C.M., T.A.M.P. and W.A.d.C.J.; writing—original draft preparation, C.d.S.C., L.C.M., T.A.M.P., J.V.E.B. and R.d.A.; writing—review and editing, C.d.S.C., L.C.M., T.A.M.P., I.A.P., J.V.E.B. and R.d.A.; visualization, C.d.S.C., L.C.M. and T.A.M.P.; supervision, C.d.S.C. and R.d.A.; project administration, C.d.S.C. and R.d.A.; funding acquisition, R.d.A. All authors have read and agreed to the published version of the manuscript.
Funding
This study was funded by the National Council for Scientific and Technological Development (CNPq, process numbers: 408160/2022-5 and 407888/2021-7).
Institutional Review Board Statement
Not applicable.
Informed Consent Statement
Not applicable.
Data Availability Statement
The data presented in this study are available from the corresponding author upon request.
Acknowledgments
We thank the Puruzinho Community and the team members of the WCP Environmental Biogeochemistry Laboratory at Federal University of Rondônia.
Conflicts of Interest
The authors declare no conflicts of interest.
References
- Young, T.; Finley, K.M.; Adams, W.M.; Besser, J.M.; Hopkins, W.D.; Jolley, D.F.; McNaughton, E.; Presser, T.S.; Shaw, D.T.; Unrine, J.M. What You Need to Know about Selenium. In Ecological Assessment of Selenium in the Aquatic Environment; CRC Press: Boca Raton, FL, USA, 2010; pp. 7–45. [Google Scholar] [CrossRef]
- Qi, Z.; Duan, A.; Ng, K. Selenoproteins in Health. Molecules 2023, 29, 136. [Google Scholar] [CrossRef] [PubMed]
- Hatfield, D.L.; Gladyshev, V.N. How Selenium Has Altered Our Understanding of the Genetic Code. Mol. Cell. Biol. 2002, 22, 3565–3576. [Google Scholar] [CrossRef] [PubMed]
- Kryukov, G.V. Characterization of Mammalian Selenoproteomes. Science 2003, 300, 1439–1443. [Google Scholar] [CrossRef] [PubMed]
- Avery, J.; Hoffmann, P. Selenium, Selenoproteins, and Immunity. Nutrients 2018, 10, 1203. [Google Scholar] [CrossRef] [PubMed]
- Stewart, R.; Grosell, M.; Buchwalter, D.; Fisher, N.; Luoma, S.; Mathews, T.; Orr, P.; Wang, W.-X. Bioaccumulation and Trophic Transfer of Selenium. In Ecological Assessment of Selenium in the Aquatic Environment; CRC Press: Boca Raton, FL, USA, 2010; pp. 93–139. [Google Scholar] [CrossRef]
- Maher, W.; Roach, A.; Doblin, M.; Fan, T.; Foster, S.; Garrett, R.; Moller, G.; Oram, L.; Wallschlager, D. Environmental Sources, Speciation and Partitioning of Selenium. In Ecological Assessment of Selenium in the Aquatic Environment; CRC Press: Boca Raton, FL, USA, 2010; pp. 47–92. [Google Scholar] [CrossRef]
- Adams, W.J.; Duguay, A. Selenium–Mercury Interactions and Relationship to Aquatic Toxicity: A Review. Integr. Environ. Assess. Manag. 2024, 21, 70–78. [Google Scholar] [CrossRef] [PubMed]
- Khan, M.A.K.; Wang, F. Chemical Demethylation of Methylmercury by Selenoamino Acids. Chem. Res. Toxicol. 2010, 23, 1202–1206. [Google Scholar] [CrossRef] [PubMed]
- Marumoto, M.; Sakamoto, M.; Marumoto, K.; Tsuruta, S.; Komohara, Y. Mercury and Selenium Localization in the Cerebrum, Cerebellum, Liver, and Kidney of a Minamata Disease Case. ACTA Histochem. Cytochem. 2020, 53, 147–155. [Google Scholar] [CrossRef] [PubMed]
- Lailson-Brito, J.; Cruz, R.; Dorneles, P.R.; Andrade, L.R.; Azevedo, A.d.F.; Fragoso, A.B.; Vidal, L.G.; Costa, M.B.; Bisi, T.L.; Almeida, R.; et al. Mercury-Selenium Relationships in Liver of Guiana Dolphin: The Possible Role of Kupffer Cells in the Detoxification Process by Tiemannite Formation. PLoS ONE 2012, 7, e42162. [Google Scholar] [CrossRef] [PubMed]
- Palmisano, F.; Cardellicchio, N.; Zambonin, P.G. Speciation of Mercury in Dolphin Liver: A Two-Stage Mechanism for the Demethylation Accumulation Process and Role of Selenium. Mar. Environ. Res. 1995, 40, 109–121. [Google Scholar] [CrossRef]
- Wang, X.; Wang, W.-X. Selenium Induces the Demethylation of Mercury in Marine Fish. Environ. Pollut. 2017, 231, 1543–1551. [Google Scholar] [CrossRef] [PubMed]
- Bjerregaard, P.; Andersen, B.W.; Rankin, J.; Rankin, J.C. Retention of Methyl Mercury and Inorganic Mercury in Rainbow Trout Oncorhynchus Mykiss (W): Effect of Dietary Selenium. Aquat. Toxicol. 1999, 45, 171–180. [Google Scholar] [CrossRef]
- Bjerregaard, P.; Christensen, A. Selenium Reduces the Retention of Methyl Mercury in the Brown Shrimp Crangon Crangon. Environ. Sci. Technol. 2012, 46, 6324–6329. [Google Scholar] [CrossRef] [PubMed]
- Bjerregaard, P.; Fjordside, S.; Hansen, M.G.; Petrova, M.B. Dietary Selenium Reduces Retention of Methyl Mercury in Freshwater Fish. Environ. Sci. Technol. 2011, 45, 9793–9798. [Google Scholar] [CrossRef] [PubMed]
- Sørmo, E.G.; Ciesielski, T.M.; Øverjordet, I.B.; Lierhagen, S.; Eggen, G.S.; Berg, T.; Jenssen, B.M. Selenium Moderates Mercury Toxicity in Free-Ranging Freshwater Fish. Environ. Sci. Technol. 2011, 45, 6561–6566. [Google Scholar] [CrossRef] [PubMed]
- Ralston, N.V.C.; Raymond, L.J. Dietary Selenium’s Protective Effects against Methylmercury Toxicity. Toxicology 2010, 278, 112–123. [Google Scholar] [CrossRef] [PubMed]
- Kaneko, J.J.; Ralston, N.V.C. Selenium and Mercury in Pelagic Fish in the Central North Pacific near Hawaii. Biol. Trace Elem. Res. 2007, 119, 242–254. [Google Scholar] [CrossRef] [PubMed]
- Koeman, J.H.; Peeters, M.; Koudstaal-Hol, C.H.M.; Tjioe, P.S.; De, M. Mercury-Selenium Correlations in Marine Mammals. Nature 1973, 245, 385–386. [Google Scholar] [CrossRef] [PubMed]
- Sumioka, A.; Usuki, F.U.; Fujimura, M. Development of a Sensor to Detect Methylmercury Toxicity. Sci. Rep. 2024, 14, 21832. [Google Scholar] [CrossRef] [PubMed]
- Chen, J.; Ma, M.; Wang, R.; Gao, M.; Hu, L.; Liu, S.; Xu, M. Roles of Glutathione Peroxidase 4 on the Mercury-Triggered Ferroptosis in Renal Cells: Implications for the Antagonism between Selenium and Mercury. Metallomics 2023, 15, mfad014. [Google Scholar] [CrossRef] [PubMed]
- Li, Y.-F.; Dong, Z.; Chen, C.; Li, B.; Gao, Y.; Qu, L.; Wang, T.; Fu, X.; Zhao, Y.; Chai, Z. Organic Selenium Supplementation Increases Mercury Excretion and Decreases Oxidative Damage in Long-Term Mercury-Exposed Residents from Wanshan, China. Environ. Sci. Technol. 2012, 46, 11313–11318. [Google Scholar] [CrossRef] [PubMed]
- Wang, G.; Hong, Q.; Mei, J.; Chen, J.; Wu, W.; Han, F.; Xing, J.; Yang, S. Influence of Selenium Supplementation on Mercury Levels in Hair of Metropolitan Residents in China: Spatial Distribution, Impact Factors, and Antagonism. Expo. Health 2024, 16, 1365–1380. [Google Scholar] [CrossRef]
- Drasch, G.; Wanghofer, E.; Roider, G.; Strobach, S. Correlation of Mercury and Selenium in the Human Kidney. J. Trace Elem. Med. Biol. 1996, 10, 251–254. [Google Scholar] [CrossRef] [PubMed]
- Durante, C.A.; Manhaes, B.; Azevedo, A.; Crespo, E.A.; Lailson-Brito, J. Trace Elements in Trophic Webs from South Atlantic: The Use of Cetaceans as Sentinels. Mar. Pollut. Bull. 2020, 150, 110674. [Google Scholar] [CrossRef] [PubMed]
- Seixas, T.G.; Kehrig, H.D.A.; Costa, M.F.; Fillmann, G.; Paula, A.; Secchi, E.R.; Maria, C.; Malm, O.; Moreira, I. Total Mercury, Organic Mercury and Selenium in Liver and Kidney of a South American Coastal Dolphin. Environ. Pollut. 2008, 154, 98–106. [Google Scholar] [CrossRef] [PubMed]
- Burger, J.; Gochfeld, M.; Jeitner, C.; Donio, M.; Pittfield, T. Interspecific and Intraspecific Variation in Selenium: Mercury Molar Ratios in Saltwater Fish from the Aleutians: Potential Protection on Mercury Toxicity by Selenium. Sci. Total Environ. 2012, 431, 46–56. [Google Scholar] [CrossRef] [PubMed]
- Ganther, H.E.; Sunde, M.L. Effect of tuna fish and selenium on the toxicity of methylmercury: A progress report. J. Food Sci. 1974, 39, 1–5. [Google Scholar] [CrossRef]
- Belmonte, A.; Muñoz, P.; Santos-Echeandía, J.; Romero, D. Tissue Distribution of Mercury and Its Relationship with Selenium in Atlantic Bluefin Tuna (Thunnus thynnus L.). Int. J. Environ. Res. Public Health 2021, 18, 13376. [Google Scholar] [CrossRef] [PubMed]
- Pantoja-Echevarría, L.M.; Marmolejo-Rodríguez, A.J.; Galván-Magaña, F.; Elorriaga-Verplancken, F.R.; Tripp Valdéz, A.; Tamburin, E.; Lara, A.; Jonathan, M.P.; Sujitha, S.B.; Arreola-Mendoza, L. Mercury and Selenium Concentrations in Different Tissues of Brown Smooth-Hound Shark (Mustelus henlei) from the Western Coast of Baja California Sur, Mexico. Mar. Pollut. Bull. 2021, 170, 112609. [Google Scholar] [CrossRef] [PubMed]
- Lima, A.P.S.; Sarkis, J.E.S.; Shihomatsu, H.M.; Müller, R.C.S. Mercury and Selenium Concentrations in Fish Samples from Cachoeira Do PiriáMunicipality, ParáState, Brazil. Environ. Res. 2005, 97, 236–244. [Google Scholar] [CrossRef] [PubMed]
- Dorea, J.G.; Moreira, M.B.; East, G.; Barbosa, A.C. Selenium and Mercury Concentrations in Some Fish Species of the Madeira River, Amazon Basin, Brazil. Biol. Trace Elem. Res. 1998, 65, 211–220. [Google Scholar] [CrossRef] [PubMed]
- Kehrig, H.A.; Seixas, T.G.; Paula, A.; Malm, O. Selenium and Mercury in Widely Consumed Seafood from South Atlantic Ocean. Ecotoxicol. Environ. Saf. 2013, 93, 156–162. [Google Scholar] [CrossRef] [PubMed]
- FAO Fisheries & Aquaculture. Available online: https://www.fao.org/fishery/es/facp/BRA?lang=en (accessed on 6 June 2025).
- Oliveira, R.C.; Dórea, J.G.; Bernardi, J.V.E.; Bastos, W.R.; Almeida, R.; Manzatto, Â.G. Fish Consumption by Traditional Subsistence Villagers of the Rio Madeira (Amazon): Impact on Hair Mercury. Ann. Hum. Biol. 2010, 37, 629–642. [Google Scholar] [CrossRef] [PubMed]
- Fabré, N.N.; Gonzales, J.C.A. Recursos íctios no Alto Amazonas e sua importância para as populações ribeirinhas. Bol. Mus. Para. Emílio Goeldi Belém 1998, 14, 19–55. [Google Scholar]
- Dórea, J.G. Fish Are Central in the Diet of Amazonian Riparians: Should We Worry about Their Mercury Concentrations? Environ. Res. 2003, 92, 232–244. [Google Scholar] [CrossRef] [PubMed]
- Rodrigues, C.; Machado, L.F.; Brasil, T. A Pesca Em Comunidades Ribeirinhas Na Região Do Médio Rio Madeira, Rondônia. Novos Cad. NAEA 2016, 19, 163–188. [Google Scholar] [CrossRef][Green Version]
- Canela, T.A.; Monteiro, L.C.; Cabral, C.d.S.; Ximenes, F.d.S.; Oliveira, I.A.d.S.; Bernardi, J.V.E.; de Almeida, R.; Bastos, W.R. Mercury in Fish and Human Hair and Estimated Dietary Intake in a Riverside Community of the Madeira River Basin in the Brazilian Amazon. Toxics 2024, 12, 208. [Google Scholar] [CrossRef] [PubMed]
- Mussy, M.H.; de Almeida, R.; de Carvalho, D.P.; Lauthartte, L.C.; de Holanda, I.B.B.; de Almeida, M.G.; de Sousa-Filho, I.F.; de Rezende, C.E.; Malm, O.; Bastos, W.R. Evaluating Total Mercury and Methylmercury Biomagnification Using Stable Isotopes of Carbon and Nitrogen in Fish from the Madeira River Basin, Brazilian Amazon. Environ. Sci. Pollut. Res. 2022, 30, 33543–33554. [Google Scholar] [CrossRef] [PubMed]
- Mendes, V.A.; de Carvalho, D.P.; de Almeida, R.; Recktenvald, M.C.N.D.N.; Pedrosa, O.P.; de Sousa-Filho, I.F.; Dórea, J.G.; Bastos, W.R. Mercury in Blood, Hair, and Feces from Subsistence Fish-Eating Riverines of the Madeira River Basin (Western Amazon). J. Trace Elem. Med. Biol. 2021, 67, 126773. [Google Scholar] [CrossRef] [PubMed]
- Pfeiffer, W.C.; de Lacerda, L.D. Mercury Inputs into the Amazon Region, Brazil. Environ. Technol. Lett. 1988, 9, 325–330. [Google Scholar] [CrossRef]
- Lacerda, L.D.; de Almeida, R.; Bastos, W.R. A 35-Year Record (1987–2022) of Hg Concentrations in Two of the Fish Species Most Consumed by People Living in the Upper Madeira River Basin, Brazilian Amazon Region. Toxics 2024, 12, 144. [Google Scholar] [CrossRef] [PubMed]
- Azevedo-Silva, C.E.; Almeida, R.; Carvalho, D.P.; Ometto, J.P.H.B.; de Camargo, P.B.; Dorneles, P.R.; Azeredo, A.; Bastos, W.R.; Malm, O.; Torres, J.P.M. Mercury Biomagnification and the Trophic Structure of the Ichthyofauna from a Remote Lake in the Brazilian Amazon. Environ. Res. 2016, 151, 286–296. [Google Scholar] [CrossRef] [PubMed]
- Rabitto, I.d.S.; Bastos, W.R.; Almeida, R.; Anjos, A.; de Holanda, Í.B.B.; Galvão, R.C.F.; Neto, F.F.; de Menezes, M.L.; dos Santos, C.A.M.; de Oliveira Ribeiro, C.A. Mercury and DDT Exposure Risk to Fish-Eating Human Populations in Amazon. Environ. Int. 2011, 37, 56–65. [Google Scholar] [CrossRef] [PubMed]
- Basta, P.C.; Claudia, A.; Hallwass, G.; Yokota, D.; Daniel; Saraiva, D.; Ciro; Oliveira-da-Costa, M. Risk Assessment of Mercury-Contaminated Fish Consumption in the Brazilian Amazon: An Ecological Study. Toxics 2023, 11, 800. [Google Scholar] [CrossRef] [PubMed]
- Arisekar, U.; Shalini, R.; Iburahim, S.A.; Deepika, S.; Reddy, C.P.K.; Anantharaja, K.; Albeshr, M.F.; Ramkumar, S.; Kalidass, B.; Tamilarasan, K.; et al. Biomonitoring of Mercury and Selenium in Commercially Important Shellfish: Distribution Pattern, Health Benefit Assessment and Consumption Advisories. Environ. Geochem. Health 2024, 46, 122. [Google Scholar] [CrossRef] [PubMed]
- Zhao, Y.; Ni, S.; Pei, C.; Sun, L.; Wu, L.; Xu, A.; Nie, Y.; Liu, Y. Parental Treatment with Selenium Protects Caenorhabditis Elegans and Their Offspring against the Reproductive Toxicity of Mercury. Sci. Total Environ. 2024, 912, 169461. [Google Scholar] [CrossRef] [PubMed]
- Oliveira, T.A.S.; Dias, R.K.S.; Souza, L.R.R.; da Veiga, M.A.M.S. The Effect of Selenium Co-Ingestion on Mercury Bioaccessibility in Contaminated Fish of the Amazon Region. Environ. Adv. 2023, 14, 100450. [Google Scholar] [CrossRef]
- de Almeida, R.; Bernardi, J.V.E.; Oliveira, R.C.; de Carvalho, D.P.; Manzatto, A.G.; de Lacerda, L.D.; Bastos, W.R. Flood Pulse and Spatial Dynamics of Mercury in Sediments in Puruzinho Lake, Brazilian Amazon. Acta Amaz. 2014, 44, 99–105. [Google Scholar] [CrossRef]
- Azevedo, L.S.; Pestana, I.A.; Nery, A.F.C.; Bastos, W.R.; Souza, C.M.M. Influence of the Flood Pulse on Mercury Accumulation in Detritivorous, Herbivorous and Omnivorous Fish in Brazilian Amazonia. Ecotoxicology 2019, 28, 478–485. [Google Scholar] [CrossRef] [PubMed]
- Bastos, W.R.; Gomes, J.P.O.; Oliveira, R.C.; Almeida, R.; Nascimento, E.L.; Bernardi, J.V.E.; de Lacerda, L.D.; da Silveira, E.G.; Pfeiffer, W.C. Mercury in the Environment and Riverside Population in the Madeira River Basin, Amazon, Brazil. Sci. Total Environ. 2006, 368, 344–351. [Google Scholar] [CrossRef] [PubMed]
- Azevedo-Silva, C.E.; Pizzochero, A.C.; Galvão, P.M.; Ometto, J.P.; de Camargo, P.B.; Azeredo, A.; Coelho-Souza, S.A.; Das, K.; Bastos, W.R.; Malm, O.; et al. Trophic Dynamics of Methylmercury and Trace Elements in a Remote Amazonian Lake. Environ. Res. 2023, 237, 116889. [Google Scholar] [CrossRef] [PubMed]
- Froese, R.; Pauly, D. (Eds.) FishBase 99: Concepts, Design and Data Sources; ICLARM: Manila, Philippines, 1999; p. 329. [Google Scholar]
- Bastos, W.R.; Malm, O.; Pfeiffer, W.C.; Cleary, D. Establishment and analytical quality control of laboratories for Hg determination in biological and geological samples in the Amazon, Brasil. Ciênc Cult. 1998, 50, 255–260. [Google Scholar]
- Neubauer, K.; Magarini, R. Determination of arsenic and selenium in drinking water by ICP-OES with continuous flow hydride generation using a single pre-reduction procedure. In Application Note ICP-Optical Emission Spectroscopy; PerkinElmer: Waltham, MA, USA, 2021; Available online: https://www.perkinelmer.com/library/app-arsenic-and-selenium-in-drinking-water-by-icp-oes.html (accessed on 15 May 2025).
- Burger, J.; Gochfeld, M. Selenium and Mercury Molar Ratios in Commercial Fish from New Jersey and Illinois: Variation within Species and Relevance to Risk Communication. Food Chem. Toxicol. 2013, 57, 235–245. [Google Scholar] [CrossRef] [PubMed]
- Zheng, J.; Minteer, S.D.; Tang, B.; Luo, W.; Ma, Y.; Ren, M.; Yu, Y.; Luo, X.-J.; Mai, B.-X. Níveis, distribuição espacial e fatores de impacto de metais pesados no cabelo de residentes metropolitanos na China e implicações para a saúde humana. Environ. Sci. Technol. 2021, 55, 10578–10588. [Google Scholar] [CrossRef] [PubMed]
- Ralston, N.V.C.; Ralston, C.R.; Raymond, L.J. Selenium Health Benefit Values: Updated Criteria for Mercury Risk Assessments. Biol. Trace Elem. Res. 2015, 171, 262–269. [Google Scholar] [CrossRef] [PubMed]
- Agência Nacional de Vigilância Sanitária. Ministério da Saúde. Resolução–RDC nº 42, de 29 de Agosto de 2013. Dispõe Sobre o Regulamento Técnico MERCOSUL Sobre Limites Máximos de Contaminantes Inorgânicos em Alimentos. Available online: https://bvsms.saude.gov.br/bvs/saudelegis/anvisa/2013/rdc0042_29_08_2013.html (accessed on 15 May 2025).
- FAO/WHO. Summary of Evaluations Performed by the Joint FAO/WHO Expert Committee on Food Additives; Food and Agriculture Organization of the United Nations/World Health Organization: Rome, Italy, 2003; Available online: https://inchem.org/documents/jecfa/jeceval/jec_1509.htm (accessed on 20 May 2025).
- Instituto Brasileiro de Geografia e Estatística. Tabela 2657: Estimativas Populacionais das Medianas de Altura e Peso de Crianças, Adolescentes e Adultos, por Sexo e Idade-Unidades da Federação. Available online: https://sidra.ibge.gov.br/Tabela/2657 (accessed on 20 May 2025).
- Campos, C.A.; Tonin, A.M.; Sena, G.; Gonçalves Júnior, J.F. Progressing a River Health Assessment Framework to Tropical Waters. Front. Water 2024, 6, 1423458. [Google Scholar] [CrossRef]
- Luo, Z.; Zuo, Q.; Shao, Q. A New Framework for Assessing River Ecosystem Health with Consideration of Human Service Demand. Sci. Total Environ. 2018, 640, 442–453. [Google Scholar] [CrossRef] [PubMed]
- R Core Team. R: A Language and Environment for Statistical Computing. 2024. Available online: https://www.R-project.org (accessed on 20 May 2025).
- World Health Organization; International Atomic Energy Agency & Food and Agriculture Organization of the United Nations. Trace Elements in Human Nutrition and Health; World Health Organization: Geneva, Switzerland; International Atomic Energy Agency & Food and Agriculture Organization of the United Nations: Vienna, Austria, 1996. [Google Scholar]
- Branfireun, B.A.; Cosio, C.; Poulain, A.J.; Riise, G.; Bravo, A.G. Mercury Cycling in Freshwater Systems—An Updated Conceptual Model. Sci. Total Environ. 2020, 745, 140906. [Google Scholar] [CrossRef] [PubMed]
- Pestana, I.A.; Azevedo, L.S.; Bastos, W.R.; Magalhães de Souza, C.M. The Impact of Hydroelectric Dams on Mercury Dynamics in South America: A Review. Chemosphere 2019, 219, 546–556. [Google Scholar] [CrossRef] [PubMed]
- Brito, B.C.; Forsberg, B.R.; Kasper, D.; Amaral, J.H.; de Vasconcelos, M.R.R.; Cunha, F.; Bastos, W.R. The Influence of Inundation and Lake Morphometry on the Dynamics of Mercury in the Water and Plankton in an Amazon Floodplain Lake. Hydrobiologia 2016, 790, 35–48. [Google Scholar] [CrossRef]
- Guimarães, J.R.D.; Meili, M.; Hylander, L.D.; Castro e Silva, E.; Roulet, M.; Mauro, J.B.N.; Lemos, R.A. Mercury Net Methylation in Five Tropical Flood Plain Regions of Brazil: High in the Root Zone of Floating Macrophyte Mats but Low in Surface Sediments and Flooded Soils. Sci. Total. Environ. 2000, 261, 99–107. [Google Scholar] [CrossRef] [PubMed]
- Nascimento, E.L.; Gomes, J.P.O.; Almeida, R.; Bastos, W.R.; Bernardi, J.V.E.; Miyai, R.K. Mercúrio No Plâncton de Um Lago Natural Amazônico, Lago Puruzinho (Brasil). J. Braz. Soc. Ecotoxicol. 2007, 2, 67–72. [Google Scholar] [CrossRef]
- Azevedo, L.S.; Pestana, I.A.; Nery, A.F.C.; Bastos, W.R.; Souza, C.M.M. Variation in Hg Accumulation between Demersal and Pelagic Fish from Puruzinho Lake, Brazilian Amazon. Ecotoxicology 2019, 28, 1143–1149. [Google Scholar] [CrossRef] [PubMed]
- Bastos, W.R.; Dórea, J.G.; Bernardi, J.V.E.; Lauthartte, L.C.; Mussy, M.H.; Lacerda, L.D.; Malm, O. Mercury in Fish of the Madeira River (Temporal and Spatial Assessment), Brazilian Amazon. Environ. Res. 2015, 140, 191–197. [Google Scholar] [CrossRef] [PubMed]
- Michelazzo, P.A.M.; Fostier, A.H.; Magarelli, G.; Santos, J.C.; de Carvalho, J.A. Emissões de mercúrio provenientes de queimadas na Amazônia Meridional. Geophys. Res. Lett. 2010, 37. [Google Scholar] [CrossRef]
- Bastos, W.R.; Dórea, J.G.; Lacerda, L.D.; Almeida, R.; Costa-Junior, W.A.; Baía, C.C.; Sousa-Filho, I.F.; Sousa, E.A.; Oliveira, I.A.S.; Cabral, C.S.; et al. Dynamics of Hg and MeHg in the Madeira River Basin (Western Amazon) before and after Impoundment of a Run-of-River Hydroelectric Dam. Environ. Res. 2020, 189, 109896. [Google Scholar] [CrossRef] [PubMed]
- Lino, A.S.; Kasper, D.; Guida, Y.S.; Thomaz, J.R.; Malm, O. Total and Methyl Mercury Distribution in Water, Sediment, Plankton and Fish along the Tapajós River Basin in the Brazilian Amazon. Chemosphere 2019, 235, 690–700. [Google Scholar] [CrossRef] [PubMed]
- Dai, L.; Zhang, B.; Liao, X.; Wang, L.; Zhang, Q.; Tian, S.; Liang, T.; O’Connor, D.; Rinklebe, J. Catchment Land Use Effect on Mercury Concentrations in Lake Sediments: A High-Resolution Study of Qinghai Lake. Sci. Total Environ. 2024, 916, 170260. [Google Scholar] [CrossRef] [PubMed]
- Dórea, J.G.; Monteiro, L.C.; Elias, V.; Fernandes, I.O.; Flora, S.; Rudrigues, P.; Oliveira, Y.; Cardoso, L.; Rodrigues, J. Land Use Impact on Mercury in Sediments and Macrophytes from a Natural Lake in the Brazilian Savanna. Environ. Pollut. 2023, 337, 122414. [Google Scholar] [CrossRef] [PubMed]
- Thomas, S.M.; Melles, S.J.; Mackereth, R.W.; Tunney, T.D.; Chu, C.; Oswald, C.J.; Bhavsar, S.P.; Johnston, T.A. Climate and Landscape Conditions Indirectly Affect Fish Mercury Levels by Altering Lake Water Chemistry and Fish Size. Environ. Res. 2020, 188, 109750. [Google Scholar] [CrossRef] [PubMed]
- da Silva, D.S.; Lucotte, M.; Paquet, S.; Davidson, R. Influence of Ecological Factors and of Land Use on Mercury Levels in Fish in the Tapajós River Basin, Amazon. Environ. Res. 2009, 109, 432–446. [Google Scholar] [CrossRef] [PubMed]
- Martoredjo, I.; Calvão Santos, L.B.; Vilhena, J.C.E.; Rodrigues, A.B.L.; de Almeida, A.; Sousa Passos, C.J.; Florentino, A.C. Trends in Mercury Contamination Distribution among Human and Animal Populations in the Amazon Region. Toxics 2024, 12, 204. [Google Scholar] [CrossRef] [PubMed]
- Albuquerque, F.E.A.; Minervino, A.H.H.; Herrero-Latorre, C.; Raimundo; Leonardo, F.; Claudia, M.; Ortolani, E.L.; López-Alonso, M. Toxic and Essential Trace Element Concentrations in Fish Species in the Lower Amazon, Brazil. Sci. Total Environ. 2020, 732, 138983. [Google Scholar] [CrossRef] [PubMed]
- da Silva, D.S.; Lucotte, M.; Paquet, S.; Brux, G.; Lemire, M. Inverse Mercury and Selenium Concentration Patterns between Herbivorous and Piscivorous Fish in the Tapajos River, Brazilian Amazon. Ecotoxicol. Environ. Saf. 2013, 97, 17–25. [Google Scholar] [CrossRef] [PubMed]
- Verstijnem, Y.J.M.; Lucassen, E.C.H.E.T.; Wagenvoort, A.J.; Ketelaars, H.A.M.; Vem Der Velde, G.; Smolders, A.J.P. Trophic Transfer of Cd, Cu, Pb, Zn, P and Se in Dutch Storage Water Reservoirs. Arch. Environ. Contam. Toxicol. 2024, 86, 217–233. [Google Scholar] [CrossRef] [PubMed]
- Ferraz, A.H.; Costa, L.P.; Mirlean, N.; Seus-Arrache, E.R.; Adebayo, S. Selenium Content in Freshwater and Marine Fish from Southern Brazil Coastal Plain: A Comparative Analysis on Environmental and Dietary Aspects. Biol. Trace Elem. Res. 2022, 201, 946–958. [Google Scholar] [CrossRef] [PubMed]
- Zampetti, C.J.; Brandt, J.E. Co-Considering Selenium Concentrations Alters Mercury-Based Fish and Seafood Consumption Advice: A Data Compilation and Critical Assessment. Environ. Sci. Technol. Lett. 2023, 10, 179–185. [Google Scholar] [CrossRef]
- Regnell, O.; Tesson, S.V.M.; Oskolkov, N.; Nerentorp, M. Mercury–Selenium Accumulation Patterns in Muscle Tissue of Two Freshwater Fish Species, Eurasian Perch (Perca eluviatilis) and Vendace (Coregonus albula). Water Air Soil Pollut. 2022, 233, 236. [Google Scholar] [CrossRef]
- Silva Junior, E.C.; Wadt, L.H.O.; Silva, K.E.; Lima, R.M.B.; Batista, K.D.; Guedes, M.C.; Carvalho, G.S.; Carvalho, T.S.; Reis, A.R.; Lopes, G.; et al. Natural Variation of Selenium in Brazil Nuts and Soils from the Amazon Region. Chemosphere 2017, 188, 650–658. [Google Scholar] [CrossRef] [PubMed]
- Ullah, H.; Liu, G.; Yousaf, B.; Ali, M.U.; Irshad, S.; Abbas, Q.; Ahmad, R. A Comprehensive Review on Environmental Transformation of Selenium: Recent Advances and Research Perspectives. Environ. Geochem. Health 2018, 41, 1003–1035. [Google Scholar] [CrossRef] [PubMed]
- Fordyce, F.M. Selenium Deficiency and Toxicity in the Environment. In Essentials of Medical Geology; Selinus, O., Ed.; Springer: Dordrecht, The Netherlands, 2012; pp. 375–416. [Google Scholar] [CrossRef]
- Mirlean, N.; Seus-Arrache, E.R.; Vlasova, O. Selenium Deficiency in Subtropical Littoral Pampas: Environmental and Dietary Aspects. Environ. Geochem. Health 2017, 40, 543–556. [Google Scholar] [CrossRef] [PubMed]
- Córdoba-Tovar, L.; Vargas-Licona, S.; Palacios-Torres, Y.; Marrugo-Negrete, J.; Díez, S. Selenium-To-Mercury Ratios in Popularly Consumed Colombian Fish: A Comprehensive Risk-Benefit Assessment. J. Hazard. Mater. 2025, 494, 138601. [Google Scholar] [CrossRef] [PubMed]
- Maia, M.A.M. Geodiversidade do Estado do Amazonas/Organização Maria Adelaide Mansini Maia [e] José Luiz Marmos; CPRM: Manaus, Brazil, 2010. Available online: https://rigeo.sgb.gov.br/handle/doc/16624 (accessed on 15 May 2025).
- Hong, L.K.; Diamond, A.M. Chapter 26–Selenium. In Presente Knowledge in Nutrition, 11th ed.; Marriott, B.P., Birt, D.F., Stallings, V.A., Yates, A.A., Eds.; Academic Press: Cambridge, MA, USA, 2020; pp. 443–456. [Google Scholar] [CrossRef]
- Xu, X.; Yan, M.; Liang, L.; Lu, Q.; Han, J.; Liu, L.; Feng, X.; Guo, J.; Wang, Y.; Qiu, G. Impacts of Selenium Supplementation on Soil Mercury Speciation, and Inorganic Mercury and Methylmercury Uptake in Rice (Oryza sativa L.). Environ. Pollut. 2019, 249, 647–654. [Google Scholar] [CrossRef] [PubMed]
- Zhang, H.; Feng, X.; Zhu, J.; Sapkota, A.; Meng, B.; Yao, H.; Qin, H.; Larssen, T. Selenium in Soil Inhibits Mercury Uptake and Translocation in Rice (Oryza sativa L.). Environ. Sci. Technol. 2012, 46, 10040–10046. [Google Scholar] [CrossRef] [PubMed]
- da Silva Junior, E.C.; de Oliveira Wadt, L.H.; da Silva, K.E.; de Lima, R.M.B.; Batista, K.D.; Guedes, M.C.; de Oliveira Junior, R.C.; dos Reis, A.R.; Lopes, G.; Broadley, M.R.; et al. Geochemistry of Selenium, Barium, and Iodine in Representative Soils of the Brazilian Amazon Rainforest. Sci. Total Environ. 2022, 828, 154426. [Google Scholar] [CrossRef] [PubMed]
- Natasha; Shahid, M.; Niazi, N.K.; Khalid, S.; Murtaza, B.; Bibi, I.; Rashid, M.I. A Critical Review of Selenium Biogeochemical Behavior in Soil-Plant System with an Inference to Human Health. Environ. Pollut. 2018, 234, 915–934. [Google Scholar] [CrossRef] [PubMed]
- Cusack, L.K.; Eagles-Smith, C.; Harding, A.K.; Kile, M.; Stone, D. Selenium: Mercury Molar Ratios in Freshwater Fish in the Columbia River Basin: Potential Applications for Specific Fish Consumption Advisories. Biol. Trace Elem. Res. 2016, 178, 136–146. [Google Scholar] [CrossRef] [PubMed]
- Bastos, W.R.; Rebelo, M.d.F.; Fonseca, M.d.F.; Almeida, R.d.; Malm, O. A Description of Mercury in Fishes from the Madeira River Basin, Amazon, Brazil. Acta Amaz. 2008, 38, 431–438. [Google Scholar] [CrossRef]
- Pestana, I.A.; de Rezende, C.E.; Almeida, R.; de Lacerda, L.D.; Bastos, W.R. Let’s Talk about Mercury Contamination in the Amazon (Again): The Case of the Floating Gold Miners’ Village on the Madeira River. Extr. Ind. Soc. 2022, 11, 101122. [Google Scholar] [CrossRef]
- Barone, G.; Storelli, A.; Mallamaci, R.; Storelli, M.M. Comparative Study on Trace Metal Accumulation in Liver of Mediterranean Deep-Sea Fish and Their Selenium/Mercury Molar Ratios. Water Air Soil Pollut. 2017, 228, 211. [Google Scholar] [CrossRef]
- Pontes, G.J.; Rocha, B.A.; Cruz, J.C.; Cezarette, G.N.; Omage, F.B.; Tasic, L.; Barbosa, F. Unraveling Mercury-Selenium Interactions through Metabolomics: Impacts on Riverside Communities in the Amazon. Environ. Pollut. 2025, 376, 126398. [Google Scholar] [CrossRef] [PubMed]
- Cezarette, G.N.; Esplugas, J.; Cruz, J.C.; Rocha, B.A.; Cassulatti, L.; Bueno, M.; Zayas, Z.P.; Barbosa, F. Exploring Mercury and Selenium Dynamics in Amazonian Human Populations: Insights from Urine, Blood, and Plasma Analyses. Chemosphere 2025, 375, 144258. [Google Scholar] [CrossRef] [PubMed]
- Passos, C.J.; Mergler, D.; Gaspar, E.; Morais, S.; Lucotte, M.; Larribe, F.; Davidson, R.; de Grosbois, S. Eating Tropical Fruit Reduces Mercury Exposure from Fish Consumption in the Brazilian Amazon. Environ. Res. 2003, 93, 123–130. [Google Scholar] [CrossRef] [PubMed]
- Strunz, C.C.; Oliveira, T.V.; Vinagre, J.C.M.; Lima, A.; Cozzolino, S.; Maranhão, R.C. Brazil Nut Ingestion Increased Plasma Selenium but Had Minimal Effects on Lipids, Apolipoproteins, and High-Density Lipoprotein Function in Human Subjects. Nutr. Res. 2008, 28, 151–155. [Google Scholar] [CrossRef] [PubMed]
- Heilpern, S.A.; Flecker, A.S.; López-Casas, S.; McIntyre, P.B.; Moya, L.; Sethi, S.; Fiorella, K.J. Accessible, Low-Mercury, and Nutritious Fishes Provide Win-Wins for Conservation and Public Health. One Earth 2025, 8, 101174. [Google Scholar] [CrossRef]
- Passos, C.J.S.; Mergler, D.; Fillion, M.; Lemire, M.; Mertens, F.; Guimarães, J.R.D.; Philibert, A. Epidemiologic Confirmation That Fruit Consumption Influences Mercury Exposure in Riparian Communities in the Brazilian Amazon. Environ. Res. 2007, 105, 183–193. [Google Scholar] [CrossRef] [PubMed]
- Begossi, A.; Salivonchyk, S.V.; Hallwass, G.; Hanazaki, N.; Lopes, P.F.M.; Silvano, R.A.M.; Dumaresq, D.; Pittock, J. Fish Consumption on the Amazon: A Review of Biodiversity, Hydropower and Food Security Issues. Braz. J. Biol. 2019, 79, 345–357. [Google Scholar] [CrossRef] [PubMed]
- Katherine, G.; Siqueira-Souza, F.K.; Aguiar, L.; Edwar, C. The Consumption of Fish by the Riverine Population of the Lower Solimões River, Amazonas, Brazil. Braz. J. Biol. 2023, 83, e271572. [Google Scholar] [CrossRef] [PubMed]
- Nardoto, G.B.; Murrieta, R.S.S.; Prates, L.E.G.; Adams, C.; Garavello, M.E.P.; Schor, T.; De Moraes, A.; Rinaldi, F.D.; Gragnani, J.G.; Moura, E.A.; et al. Frozen Chicken for Wild Fish: Nutritional Transition in the Brazilian Amazon Region Determined by Carbon and Nitrogen Stable Isotope Ratios in Fingernails. Am. J. Hum. Biol. 2011, 23, 642–650. [Google Scholar] [CrossRef] [PubMed]
- Basu, N.; Horvat, M.; Evers, D.C.; Zastenskaya, I.; Weihe, P.; Tempowski, J. A State-of-The-Science Review of Mercury Biomarkers in Human Populations Worldwide between 2000 and 2018. Environ. Health Perspect. 2018, 126, 106001. [Google Scholar] [CrossRef] [PubMed]
- Carvalho, C.M.L.; Lu, J.; Zhang, X.; Arnér, E.S.J.; Holmgren, A. Effects of Selenite and Chelating Agents on Mammalian Thioredoxin Reductase Inhibited by Mercury: Implications for Treatment of Mercury Poisoning. FASEB J. 2010, 25, 370–381. [Google Scholar] [CrossRef] [PubMed]
- Bjørklund, G.; Aaseth, J.; Ajsuvakova, O.P.; Nikonorov, A.A.; Skalny, A.V.; Skalnaya, M.G.; Tinkov, A.A. Molecular Interaction between Mercury and Selenium in Neurotoxicity. Coord. Chem. Rev. 2017, 332, 30–37. [Google Scholar] [CrossRef]
- Liu, Y.; Zhang, W.; Zhao, J.; Lin, X.; Liu, J.; Cui, L.; Zhang, T.-L.; Li, B.; Li, Y.-F. Selenoprotein P as the Major Transporter for Mercury in Serum from Methylmercury-Poisoned Rats. J. Trace Elem. Med. Biol. 2018, 50, 589–595. [Google Scholar] [CrossRef] [PubMed]
- Sadat, M.A.; Guan, Y.; Zhang, D.; Shao, G.; Cheng, X.; Yang, Y. The Associations between River Health and Water Resources Management Lead to the Assessment of River State. Ecol. Indic. 2020, 109, 105814. [Google Scholar] [CrossRef]
- Minamata Convention on Mercury Text and Annexes. Available online: https://minamataconvention.org/en/resources/minamata-convention-mercury-text-and-annexe.pdf (accessed on 20 May 2025).
Disclaimer/Publisher’s Note: The statements, opinions and data contained in all publications are solely those of the individual author(s) and contributor(s) and not of MDPI and/or the editor(s). MDPI and/or the editor(s) disclaim responsibility for any injury to people or property resulting from any ideas, methods, instructions or products referred to in the content. |
© 2025 by the authors. Licensee MDPI, Basel, Switzerland. This article is an open access article distributed under the terms and conditions of the Creative Commons Attribution (CC BY) license (https://creativecommons.org/licenses/by/4.0/).