Abstract
Ambient ozone (O3) pollution, which has become a global problem, is associated with damage to various biological systems, as determined by many studies. However, there is limited experimental evidence regarding the systemic damage induced by O3 exposure, and there are few associated studies on mice. In the present investigation, we constructed a subacute C57BL/6J female mouse model involving exposure to 0, 0.5, 1, or 2 ppm O3 for 28 days (3 h/day). Body weights, pulmonary function, hematology, serum biochemistry, inflammatory factors, and injuries to various organs were assessed for O3-exposed mice. After O3 exposure, especially to 2 ppm O3, mice showed a loss of body weight, abnormal glucose and lipid metabolism, respiratory and nervous system injuries, an inflammatory response, and pathological changes, which supported the data reported for epidemiology studies. In addition, the IL-6 levels in bronchoalveolar lavage fluid (BALF), the lungs, the livers, the kidneys, and the brains were increased, which indicated that IL-6 was associated with the damage to various organs induced by O3 exposure. The present report highlights the pathological injury to various organs and provides a basis for further studies of the molecular mechanisms associated with O3 exposure.
1. Introduction
With the rapid development of urbanization and industrialization, air pollution has become a serious problem that threatens the health of the global population, a challenge that cannot be ignored [1]. Air pollutants, including particulate matter (e.g., PM2.5, PM10), volatile organic compounds (VOCs), sulfur dioxide (SO2), nitrogen oxides (NOX), carbon monoxide (CO), ozone (O3), and heavy metals [2], mainly come from human production and human activities (such as industrial emissions, transportation, agricultural activities, energy consumption, and urban dust) and natural hazards (such as volcanic eruptions and wildfires) [3]. According to a report from the World Health Organization (WHO), 99% of people live in areas where the air quality is above the air quality guidelines of WHO, and outdoor pollution contributes to approximately 4.2 million premature deaths worldwide [4]. Thus, studying the health effects induced by air pollution can lead to the development of rules for the prevention of air pollution.
In China, O3 presents an air pollution problem greater than that for PM2.5 due to clean-air actions implemented since 2013 [5]. High concentrations of tropospheric O3 pollutants are harmful to human health [6]. With the action of high temperatures and strong light radiation, the NOX and VOCs produced by vehicle exhaust emissions, fossil fuel combustion, and industrial production processes generate O3 through photochemical reactions [7]. In a modeling study on 12,946 cities worldwide, O3-attributable mortality and the average population-weighted mean O3 concentration increased by 46% and 11%, respectively, from 2000 to 2019. The number of cities with O3 concentrations over 60 μg/m3 (the WHO peak season standard) increased from 89% in 2000 to 96% in 2019 [8]. Thus, O3 exposure is increasing worldwide, contributing to attributable mortality.
O3, a highly reactive oxidant gas, is associated with damage to various organs and body systems. A prospective cohort study of lung function among middle-aged European adults shows that long-term exposure to high O3 concentrations is associated with a faster decline in function [9]. O3 exposure is associated with airway inflammation, emphysema, chronic obstructive pulmonary disease (COPD), airway remodeling, pulmonary fibrosis, and other lung diseases [10,11,12]. Further, O3 exposure affects respiratory health through molecular and cellular perturbations in the respiratory tract [13]. Evidence from national cohort studies in China shows that long-term O3 exposure contributes to elevated mortality risks of cardiovascular diseases (CVDs), especially ischemic heart diseases in a middle-income setting [14,15,16]. After inhalation into the respiratory tract, O3 reduces the peripheral immune response and is connected with an increased risk of Alzheimer’s disease [17], and chronic ambient O3 exposure increases the Aβ plaque load and enhances autism-like symptoms [17,18]. In the current study, there is evidence of the damage to the respiratory system in vivo and in vitro [19,20], the cardiovascular system in vivo and in vitro [21,22], the liver in vivo [23], and the nervous system in vivo [24] induced by O3 exposure. However, there is no experimental evidence either in vivo or in vitro of any damage to the spleen caused by exposure to ambient O3.
Based on these reports, the present study intended to construct a 28-day O3 subacute exposure mouse model, to collect tissue samples, and to observe the pathological changes in various organs. The findings give us a better understanding of the health risks associated with ambient O3 exposure and lay the foundation for further research on the specific molecular mechanisms of O3-induced diseases.
2. Methods and Materials
2.1. Animal Models
For female mice, air pollution, including O3 exposure, has severe effects on lung tissue inflammation and damage [25]. C57BL/6J female mice (6–8 weeks old, SPF grade), provided by the Laboratory Animal Center of Nanjing Medical University, were randomly divided into groups subjected to 0, 0.5, 1, or 2 ppm O3 exposure (n = 12). The mice were exposed to these concentrations for 28 days (3 h/day). The device for monitoring O3 generation (CHUAVG, Guangzhou, China) connected to the whole-body exposure system for rodents (Beijing Huironghe Technology Co., Ltd., Beijing, China) constituted an O3 exposure chamber. The detector monitored the O3 concentrations in real time at the respiratory height of mice under O3 exposure. Parameters such as temperature, humidity, and the concentrations of O2 and CO2 were monitored and recorded in real time by the exposure system. After exposed to O3 for 28 days, the mice were anesthetized by an intraperitoneal injection of pentobarbital sodium, and then they were sacrificed, dissected, and sampled. All the mice were housed in an SPF environment and fed with a standard diet at 22 °C with 50–60% humidity and an equal light–dark cycle. If the mice showed poor health conditions such as emaciation during this experiment, they were euthanized immediately by carbon dioxide inhalation and reported on. The detailed experimental plans of each group of mice are shown in Table S1. And the animal experiments were approved by the Animal Care and Use Committee of Jiangsu Provincial Center for Disease Control and Prevention (JSJK/JL-161).
2.2. Basis for Doses of O3
Based on the global pollution situation and limit values of O3, we determined the O3 exposure dose for mice. The Ambient Air Quality Standard of China (GB 3095-2012) stipulates that the daily maximum 8 h average O3 (MDA-8h O3) was about 0.08 ppm after conversion according to the secondary standard of 160 μg/m3 (1 ppm = 2.14 mg/m3) [26]. In 2022, the 90th percentile of MDA-8h O3 in 339 cities in China was 90–194 μg/m3, which is about 0.1 ppm after conversion [27]. Further, considering the difference in volume and lung surface area between rodents and humans, to achieve the same deposition and inflammatory response as that of humans, 4–5 times the dose was required to derive the exposure dose of rodents [28,29,30]. Thus, we set the minimum dose of O3 at 0.5 ppm, and the doses of O3 exposure were set at 0, 0.5, 1, and 2 ppm with an equal proportional gradient.
2.3. Analysis of Mouse Pulmonary Function
At the end of the O3 exposure, the pulmonary function of mice was measured by a whole-body system (Buxco Electronics Ltd., Wilmington, NI, USA) (n = 12). The mice were placed in a tracing cavity and acclimated for 10 min. Then, 0, 12.5, 25, or 50 mg/mL acetylcholine (Ach) was added to the cavity and nebulized for 2 min with a period of responding for 3 min and recovering for 2 min. The relevant pulmonary function parameters, including respiratory frequency (F), mid-expiratory flow rate (EF50), and airway stenosis index (enhanced expiratory pause, Penh), were recorded by FinePoint software (software version, 2.3.1.14) (Buxco Electronics Ltd., USA).
2.4. Extraction of BALF
After anesthetizing the mice with pentobarbital sodium, the trachea and thoracic cavity of the mice were fully exposed, with one bronchial tube being ligated. A small portion of the tracheal wall was gently elevated, and a 1 mL syringe loaded with 0.5 mL of physiological saline was inserted into the trachea and secured. The syringe was gently depressed to observe the dilation of the other lung. After allowing it to dwell for 30 s, the BALF was slowly aspirated. The collected BALF (n = 6) was centrifuged at 1000 r/min for 10 min to remove cells and then stored at −80 °C for future use.
2.5. Hematology and Serum Biochemistry
At the end of the O3 exposure and pulmonary function assessments, the mice were anesthetized by the intraperitoneal administration of pentobarbital (Entoval®, Hallym Pharm. Co., Ltd., Seoul, Republic of Korea), and whole blood was collected. The hematology parameters in the blood (n = 6) were measured by an ADVIA 2120 hematology system (SIMENS, Munich, Germany). Other blood samples (n = 6), collected from the abdominal aorta, were used to collect serum in heparinized vacutainers for analysis by a biochemical blood analyzer (Olympus, Tokyo, Japan).
2.6. Histological Analysis
After exposure to 0, 0.5, 1, or 2 ppm O3, the mice were sacrificed, and tissues were harvested (n = 6). Half of the blood, brain, heart, trachea, lung, liver, kidney, pancreas, and spleen tissues were fixed in paraformaldehyde, embedded in paraffin, and then made into specimens. The specimens were exposed to hematoxylin–eosin (H&E) for histopathological evaluation. The staining images were observed by a CaseViewer 2.4 (3DHISTECH Ltd., Budapest, Hungary).
2.7. Enzyme-Linked Immunosorbent Assay (ELISA)
Frozen tissue samples were retrieved and thawed under controlled conditions (4 °C for 15 min). Surface moisture was removed by gentle blotting with sterile filter paper. A total of 0.1 g of tissue was precisely weighed before being flash-frozen in liquid nitrogen for cellular structure preservation. A total of 0.9 mL of ice-cold sterile saline was added and mechanically homogenized at 30 Hz for 2 min. The resultant homogenate was centrifuged at 3000 r/min for 20 min at 4 °C to obtain a clarified supernatant for subsequent analyses according to the instructions of the manufacturer. The levels of interleukin-6 (IL-6), interleukin-8 (IL-8), tumor necrosis factor-alpha (TNF-α), and high-mobility group protein (HMGB1) were measured with Mouse IL-6 ELISA Kits (CSB-E04639m, CUSABIO, Wuhan, China); Mouse IL-8 ELISA Kits (YFXEM00011, Yfxbio Biotech. Co., Ltd., Nanjing, China); Mouse TNF-α ELISA Kits (CSB-E04741m, CUSABIO, Wuhan, China); and Mouse HMGB1 ELISA Kits (CSB-E08225m, CUSABIO, Wuhan, China), respectively. Finally, the optical density of each well was determined using a SpectraMax Paradigm (Molecular Devices, Sunnyvale, CA, USA) set to 450 nm.
2.8. Statistical Analysis
All experiments were performed in triplicate, and the data of each sample are represented by the mean of three repeated experiments. The data are reported as means ± standard deviation (SD). For comparisons of means among multiple groups, statistical analysis was performed by using SPSS14.0 for a one-way analysis of variance (ANOVA). Inter-group comparisons were accomplished by calculating multiple-range least significant differences. Graphs were prepared with GraphPad Prism 9 software. p values < 0.05 were considered to be statistically significant.
3. Results
3.1. The Body Weights, Serum Biochemistry, and Hematology Parameters of Mice Are Affected by Subacute Exposure to O3
Based on the health effects of O3, a mouse model of O3 exposure was constructed. C57BL/6J mice were exposed to 0, 0.5, 1, or 2 ppm O3 for 28 days (3 h/d). On days 0, 7, 14, 21, and 28, the body weights of mice were measured. After their pulmonary function was assessed on day 28, the mice were sacrificed, and their tissues were harvested. Body weight-, pulmonary function-, antioxidant profile-, blood biochemistry-, hematology-, and pathology-related parameters were examined (Figure 1A). Compared with the 0 ppm O3 group, the body weights of mice in the 2 ppm O3 group were lower (Figure 1B). In blood biochemistry tests, we measured indicators of liver function (total protein (TP), albumin (ALB), alanine aminotransferase (ALT), and aspartate aminotransferase (AST)); kidney function (blood urea nitrogen (BUN) and creatinine (CREA)); and glycolipid metabolism (glucose (GLU), triglycerides (TGs), and cholesterol (CHOL)). Changes in TP (Figure 1C), ALB (Figure 1D), AST (Figure 1F), CREA (Figure 1H), and CHOL (Figure 1K) concentrations in mouse blood were not statistically significant. The concentrations of ALT were lower in the blood of mice exposed to 2 ppm O3 compared to the 0 ppm O3 group (Figure 1E), but there was no clinical significance. The BUN levels of mice exposed to 1 ppm O3 were lower than those for the 0 ppm O3 group (Figure 1G). The blood concentrations of GLU (Figure 1I) and TG (Figure 1J) were higher in mice exposed to O3 compared to controls. The values are shown in Table S2.
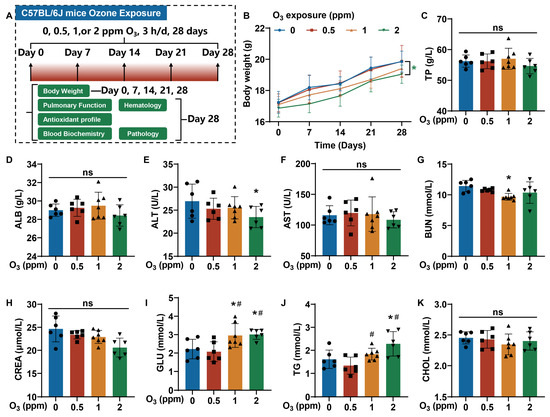
Figure 1.
Changes in the body weights and serum biochemistry parameters of mice exposed to O3 for 28 days. Female C57BL/6J mice, aged 6–8 weeks, were exposed to 0, 0.5, 1, or 2 ppm O3 for 28 days (3 h/d). On the 7th, 14th, 21st, and 28th days, the body weights of mice were measured. After 28 days of O3 exposure, the mice were sacrificed, and their blood and organs were harvested. (A) A schematic illustration of the construction of the C57BL/6J mouse model with O3 exposure. (B) Changes in the body weights of mice. * Green, p < 0.05, 2 ppm vs. 0 ppm O3 exposure groups. (C) The blood concentrations of TP, (D) ALB, (E) ALT, (F) AST, (G) BUN, (H) CREA, (I) GLU, (J) TG, and (K) CHOL. The data are presented as means ± SD, n = 6. *, p < 0.05, compared with the 0 ppm O3 exposure group. #, p < 0.05, compared with the 0.5 ppm O3 exposure group. ns, non-significant.
Further, blood biochemistry parameters were measured (Table S3). The values of white blood cells (WBCs), the mean corpuscular volume (MCV), red cell distribution width standard deviation (RDW-SD), platelet distribution width (PDW), neutrophils (NEUT), lymphocytes (LYMPH), monocytes (MONO), and eosinophils (EO) were changed after exposure to various levels of O3 (Table S3). The parameters for the 1 ppm group were lower than those for the 0.5 and 2 ppm O3 groups. The large differences between individual animals may have contributed to this observation. Therefore, the loss of body weight, abnormal glucose and lipid metabolism, and the abnormal hematology parameters in mice were related to subacute exposure to O3 for 28 days.
3.2. Respiratory Tract Damage Is Induced in Mice by Subacute Exposure to O3
Lungs are a direct target for atmospheric O3 exposure [31,32]. From the H&E staining images of trachea tissues, compared to the control groups, for O3-exposed mice, there were elevated numbers of bronchial mucosal epithelial goblet cells (black arrow) and a loss of cilia (green arrow) (Figure 2A). After subacute exposure to O3, the normal alveolar structure in mouse lung tissues was broken, the alveolar walls were slightly thickened, and inflammatory cells were present (Figure 2B). After stimulation with Ach, compared with the control group, the respiratory frequency (F), mid-expiratory flow rate (EF50), and airway stenosis index (enhanced expiratory pause, Penh) were elevated in the group exposed to 2 ppm O3 (Figure 2C–E). In addition, oxidative stress-related parameters, including superoxide dismutase (SOD), catalase (CAT), and glutathione (GSH), were detected in the bronchoalveolar lavage fluid (BALF) and lung tissues of mice exposed to different doses of O3. The SOD activity (Figure 3A) and CAT activity (Figure 3B) levels in BALF were higher in mice exposed to 2 ppm O3 compared to the 0 and 0.5 ppm O3 groups. Compared to controls, the GSH concentration in BALF was significantly increased in 2 ppm O3-exposed mice (Figure 3C). In lung tissues, with an increase in O3 doses, the SOD activity (Figure 3D) and CAT activity (Figure 3E) levels were increased in a dose–effect manner. And the GSH concentration in lung tissues was significantly increased in the 1 and 2 ppm O3-exposed mice compared to controls (Figure 3F). The results indicated that, for mice, O3 exposure caused damage to the trachea and lungs, pulmonary dysfunction, and oxidative stress in BALF and the lungs.
3.3. The Pathological Injury to Various Organs Is Involved in O3 Exposure
The organ injuries induced by O3 exposure were assessed by H&E staining. In the livers of mice exposed to O3, hepatocytes were disordered, and the intercellular space was enlarged (Figure 4A). Compared with the control groups, for O3-exposed mice, there was an infiltration of inflammatory cells into the kidney cortex (Figure 4B, yellow arrows) and heart (Figure 4C, yellow circles). In the spleens of mice in the 2 ppm O3 group, the trabeculae (yellow arrows) were increased (Figure 4D. WP, white pulp; RP, red pulp; white arrows, splenic arterioles). However, there was no significant difference in the pancreases of mice exposed to O3 (Figure 4E). Thus, these data indicate that the O3 exposure of mice for 28 days induces injuries to various organs.
3.4. The Degree of Inflammatory Response Is Associated with O3 Exposure
It is reported that the occurrence of oxidative stress can cause an immune cascade reaction, resulting in the release of IL-6, IL-8, TNF-α, and so on [33]. Therefore, we further examined the levels of inflammatory factors in the tissues of O3-exposed mice. For lung, liver, and kidney tissue, we measured the levels of inflammatory cytokines, including IL-6, IL-8, TNF-α, and HMGB1. Elevated levels of IL-6, IL-8, and TNF-α were present in lung tissues of mice after exposure to O3 for 28 days (Figure 5A–C). However, in the lung tissues of O3-exposed mice, the levels of HMGB1 were not changed significantly (Figure 5D). In liver tissues, the IL-6 levels in the 2 ppm O3 group and the HMGB1 levels in the 1 and 2 ppm O3 groups were elevated, but the levels of IL-8 and TNF-α were unchanged (Figure 5E–H). Moreover, compared with the 0 ppm O3 group, the IL-6 levels in the 1 ppm O3 group, the IL-8 levels in the 1 and 2 ppm O3 groups and the HMGB1 levels in the 2 ppm O3 group were upregulated, but this was not observed for the kidney levels of TNF-α in mice exposed to O3 (Figure 5I–L). Thus, the inflammatory responses that especially increased IL-6 levels in the lungs, liver, and kidneys are induced by O3 exposure for 28 days. In addition, the elevated levels of IL-6 in the liver and kidneys may be directly or indirectly (potentially secreted from pulmonary effects) induced by O3 exposure.
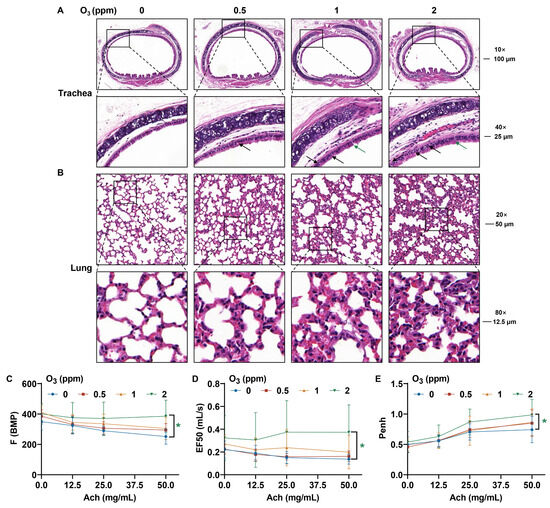
Figure 2.
Pathological changes in the trachea and lung tissues and changes in pulmonary function in O3-exposed mice. (A) Representative H&E staining images of trachea (Scale bar, 10×, 100 μm; 40×, 25 μm). The black arrows indicate bronchial mucosal epithelial goblet cells. The green arrow shows the loss of cilia. (B) Representative H&E staining images of lung tissues (Scale bar, 20×, 50 μm; 80×, 12.5 μm). (C) Changes in the respiratory function parameters, including the F, (D) EF50, and (E) Penh values of O3-exposed mice. The data are reported as means ± SD, n = 12. * Green, p < 0.05, 2 ppm vs. 0 ppm O3 exposure groups.
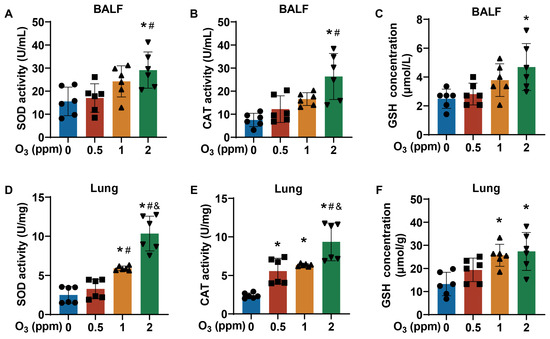
Figure 3.
Oxidative stress status of BALF and lungs of O3-exposed mice. (A) Levels of SOD activity, (B) CAT activity, and (C) GSH concentration in BALF of O3-exposed mice. (D) Levels of SOD activity, (E) CAT activity, and (F) GSH concentration in lung tissues of O3-exposed mice. Data are reported as means ± SD, n = 6. *, p < 0.05, compared with 0 ppm O3 exposure group. #, p < 0.05, compared with 0.5 ppm O3 exposure group. &, p < 0.05, compared with 0.5 ppm O3 exposure group.
3.5. Pathological Damage and Inflammatory Responses in Brain Are Related to O3 Exposure
Because diseases of the nervous system are related to O3 exposure [17], we next investigated injury to the cortex and hippocampus, including the cornu ammonis 1 (CA1), the cornu ammonis 2 (CA2), and the dentate gyrus (DG) of the brains of mice exposed to O3. For the brains of mice exposed to O3, H&E staining showed the atrophy of neuronal nuclei (white arrows) in CA1 and DG and the disorganized and sparse arrangement of neurons in the cortex, CA3, and DG (Figure 6A). Compared with those in the 0 ppm O3 group, IL-6 levels were elevated in the hippocampus in the 1 and 2 ppm O3 groups (Figure 6B) and in the cortex of the 1 ppm O3 group (Figure 6C); there were no significant changes in IL-6 levels in other brain areas after O3 exposure (Figure 6D). In the hippocampus, the IL-8 levels were elevated in the 2 ppm O3 group compared to those in the 0 ppm O3 exposure group (Figure 6E). However, after O3 exposure, there were no significant changes in the cortex (Figure 6F) or other areas (Figure 6G) of the brain. In addition, the levels of TNF-α were lower in the hippocampus of the brains of mice dosed with 2 ppm O3 (Figure 6H), but there were no differences in TNF-α levels in the cortex (Figure 6I) or in other areas (Figure 6J) of the brain between groups with different doses of O3. Thus, we conclude that the pathological damage and inflammatory responses (especially IL-6) in the brain are induced by O3 exposure for 28 days.
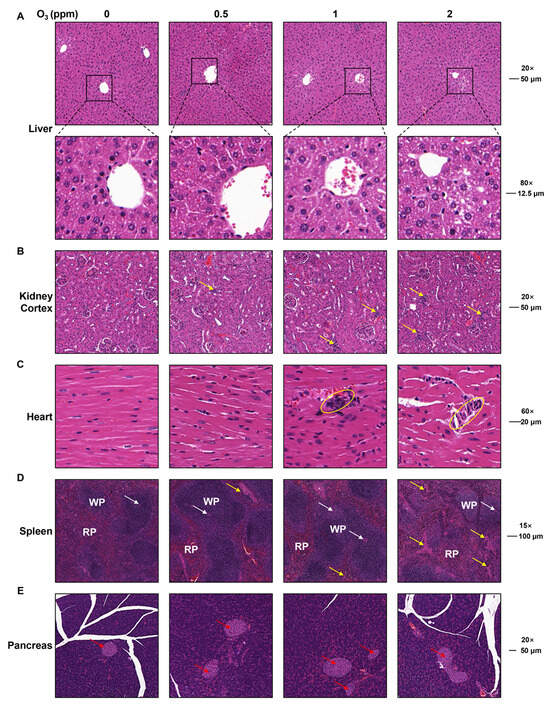
Figure 4.
Pathological changes in heart, spleen, pancreas, liver, and kidneys in O3-exposed mice. (A) Representative H&E staining images of liver (Scale bar, 20×, 50 μm; 80×, 12.5 μm). (B) Representative H&E staining images of kidney cortex (Scale bar, 20×, 50 μm). Yellow arrows show inflammatory infiltration. (C) Representative H&E staining images of heart (Scale bar, 60×, 20 μm). Yellow circles show inflammatory infiltration. (D) Representative H&E staining images of spleen (Scale bar, 15×, 100 μm). WP represents white pulp. RP represents red pulp. Yellow arrows indicate spleen trabecula. White arrows indicate splenic arterioles. (E) Representative H&E staining images of pancreas (Scale bar, 20×, 50 μm). Red arrows indicate pancreatic islets.
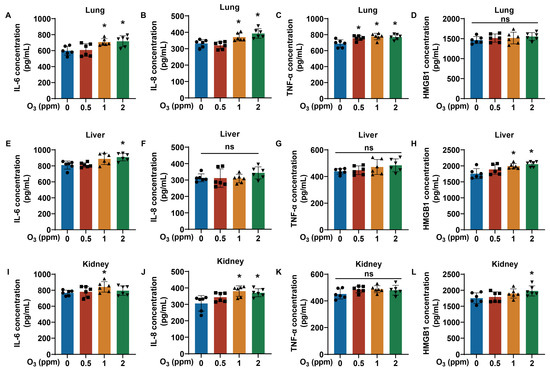
Figure 5.
Changes in inflammatory factor levels in lung, liver, and kidney tissues of O3-exposed mice. (A) Levels of IL-6, (B) IL-8, (C) TNF-α, and (D) HMGB1 in lung tissues of O3-exposed mice. (E) Levels of IL-6, (F) IL-8, (G) TNF-α, and (H) HMGB1 in liver tissues of O3-exposed mice. (I) Levels of IL-6, (J) IL-8, (K) TNF-α, and (L) HMGB1 in kidney tissues of O3-exposed mice. Data are reported as means ± SD, n = 6. *, p < 0.05, compared with 0 ppm O3 exposure group. ns, non-significant.
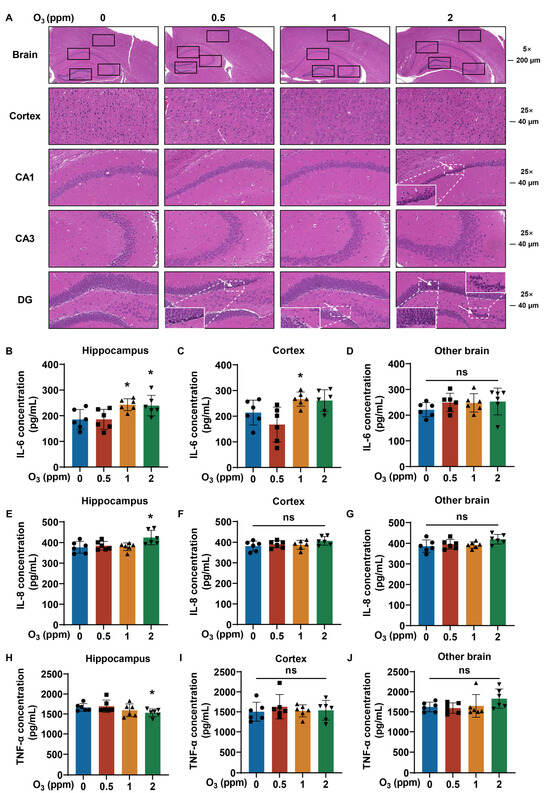
Figure 6.
Pathological inflammatory changes in brain tissues of O3-exposed mice. (A) Representative H&E staining images of brain (Scale bar, 5×, 200 μm; 25×, 40 μm). The hippocampus, cortex, CA1, CA3 and DG of brain were marked with black boxes. White arrows show shrunken nuclei of neurons, and corresponding area image is magnified. (B) Levels of IL-6, (E) IL-8, and (H) TNF-α in hippocampus of brain tissues of O3-exposed mice. (C) Levels of IL-6, (F) IL-8, and (I) TNF-α in brain cortex of O3-exposed mice. (D) Levels of IL-6, (G) IL-8, and (J) TNF-α in other brain of O3-exposed mice. Data are reported as means ± SD, n = 6. *, p < 0.05, compared with 0 ppm O3 exposure group. ns, non-significant.
4. Discussion
O3 is a common secondary pollutant in the atmospheric troposphere, and in recent years, O3 pollution in China and in the world has become increasingly severe [34,35]. According to the State of Global Air 2020 report, with global warming and the increasing emissions of O3 precursors, global ground surface O3 concentrations are 30% to 70% higher than they were 100 years ago [36]. In China, the ambient concentrations of PM2.5 have been reduced, while ground O3 concentrations near the ground surface have increased after the implementation of clean-air actions in 2013 [5]. Although the impacts, including health and economic ones, induced by O3 pollution are less severe than those induced by PM2.5, they are more difficult to mitigate [37]. Thus, we believe that promoting control policies for air pollution, especially O3 pollution, can reduce the harm that O3 has on health.
O3 is highly oxidizing and induces the accumulation of reactive oxygen species (ROS) after entering lung tissue, which activates several signaling cascades, including oxidative stress, autophagy, and pyroptosis [38,39]. The oxidative stress response activates its relative pathway and plays an important role in the respiratory system injuries induced by ambient O3 exposure [31,40,41,42]. For the lung tissues of O3-exposed mice, experiments show that there is oxidative stress and inflammation, which may reduce immunity and promote the development of asthma, emphysema, COPD, and pulmonary fibrosis [31,43,44,45]. In our study, we found that the levels of oxidative stress-related indicators, such as SOD, CAT, and GSH, were significantly increased due to the exposure of O3 in the lung tissues of mice, which was consistent with the reported studies.
Some evidence shows that O3 exposure can lead to liver damage and a blood glucose metabolism disorder in rats [46,47]. Consistently, the serum biochemistry results in our study showed that the GLU and TG concentrations in the blood of mice were elevated after O3 exposure, indicating that the blood glucose metabolism disorder was induced by O3 exposure. In our research, the values of BUN in serum biochemistry and MCV in hematology were decreased in the blood of mice exposed to O3. These changes are possibly associated with iron deficiency and an iron absorption disorder [48]. The present evidence provides ideas for further research on the abnormal iron metabolism and oxidative stress associated with O3 exposure and on the molecular mechanisms of how O3 exposure affects health.
The adverse effects of increasing O3 concentrations on human health have become a serious problem of air pollution in China and globally [49]. For example, a cohort study in the United States showed that ambient O3 concentrations were associated with greater increases in the incidence of emphysema and a decline in forced expiratory volume of 1 s per 10 years [50]. Further, by releasing IL-2 and TNF-α, O3 induces inflammation, which promotes hypertension, coronary ischemia, and the impairment of autonomic control in the lungs and in the circulation [51]. Epidemiological studies in China show the strong association between long-term exposure to high levels of O3 and cause-specific CVD mortality [16]. As shown in a randomized controlled trial, O3 causes an increase in the vascular markers of inflammation and decreases in the markers of fibrinolysis [52]. In addition, long-term O3 exposure is associated with higher risks of allergic rhinitis, conjunctivitis, eczema, and poor bone development in children [53,54]. Other damage includes liver fibrosis and a blood glucose metabolism disorder in rats [46,47]. We found that high-dose O3-exposed mice exhibited respiratory system injury, hepatic interstitial expansion, splenic trabecular hyperplasia, and notable inflammatory cell infiltration in heart and kidney tissues, compared to the control groups.
In the analysis of mouse pulmonary function, Ach was atomized and released slowly into the resting chamber to keep all the mice in a resting state. After the detection of pulmonary function, the mice regained consciousness in about half an hour. Studies have shown that Ach may have an impact on airway resistance and other factors [55,56]. In this investigation, several methodological considerations were implemented to mitigate potential confounding effects: (1) a relatively low inhalational dose was administered to expedite systemic clearance, given the compound’s rapid metabolic turnover; (2) sample collection was strategically deferred until the subsequent day following pulmonary function assessment to allow for the complete elimination of residual Ach; (3) a standardized exposure protocol was applied uniformly across all mice (n = 12), ensuring equivalent pharmacological stimulation; and (4) only the levels of lung function indicators under the stimulation of the same concentration of Ach were compared, which to a certain extent controlled the effects caused by Ach. This rigorous experimental design approach effectively controls for both temporal variability in drug metabolism and inter-group variability in Ach exposure, thereby enhancing the interpretative validity of the observed physiological responses. Although we administered Ach, the potential confounding effects attributable to Ach were successfully mitigated through meticulous experimental design and rigorous analytical methods. In our study, we found that O3 exposure induced the damage of pulmonary function.
Since O3 is a reactive air pollutant that cannot be transferred to the brain to affect the central nervous system [17,57], damage to the brain is possibly induced by O3-affected lungs via an organ–organ axis [58]. Some studies prove that O3 exposure is associated with autism-like symptoms, neurodegenerative diseases, neuroinflammation, cognitive impairment, a depressive-like response, and Alzheimer’s disease [18,42,59,60,61]. For mice, O3 exposure leads to increased Aβ plaque load and augmented dystrophic neurites through an elevated lung proinflammatory response and peripheral HMGB1 levels via a lung–brain axis [17]. Our results indicated that there was an atrophy of neuronal nuclei, a disorganized and sparse arrangement of neurons, and enhanced levels of IL-6 in the cortex and hippocampus of mice exposed to 2 ppm O3. Thus, we supposed that the damage to the brain is involved in the hyper-IL-6 levels seen via the lung–brain axis after O3 exposure.
In our study, we found increasing levels of IL-6 in the lungs, livers, kidneys, and brains of mice exposed to high doses of O3. In addition, for mice with 2 ppm O3 exposure, there were disorders in hematology and serum biochemistry, respiratory tract injury, and pathological changes in the livers, kidneys, hearts, spleens, pancreas, and brains, as well as changes in oxidative stress-related parameters in BALF and the lungs. Based on the evidences above, we speculate that O3 exposure causes oxidative stress in the lungs and the release of inflammatory factors, especially IL-6, and may lead to various types of organ damage via the lung–organ axis. However, regrettably, our study only focused on observing the phenotypic alterations induced by O3 exposure and did not validate the specific underlying mechanisms. Even so, the role of IL-6 in the lung–organ axis can be explored in the future. The results establish a base for studies on molecular mechanisms to elucidate the potential pathways underlying O3-mediated extra-pulmonary injuries.
5. Conclusions
Mice exposed to O3 for 28 days demonstrated oxidative stress, abnormal glucose and lipid metabolism, respiratory system injury, an inflammatory response, and injury to various organ and nervous systems. This study described the injuries to various organs caused in mice by subacute O3 exposure and provided a biological basis for the results of epidemiologic studies. It also indicated an urgent need to control O3 pollution and to determine the pathogenic molecular mechanisms induced by exposure to O3.
Supplementary Materials
The following supporting information can be downloaded at https://www.mdpi.com/article/10.3390/toxics13060468/s1, Table S1. The experimental plan in mice exposed to different doses of O3. Table S2. Changes of serum biochemistry parameters of mice exposed to O3 for 28 days. Table S3. Changes of hematology parameters for mice exposed to O3 for 28 days.
Author Contributions
Conceptualization, P.W. and Q.B.; Investigation, P.W., K.L. and M.L.; Methodology, P.W., K.L. and W.C.; Data curation, P.W. and W.C.; Writing—original draft, P.W.; Formal analysis, Y.L. and D.X.; Software, Y.L. and D.X.; Validation, Y.L., K.L. and L.L.; Visualization, Y.L., D.X. and L.L.; Resources, M.L.; Project administration, Y.W., Q.L., Q.B. and T.X.; Supervision, Y.W., Q.L., Q.B. and T.X.; Funding acquisition, P.W., Q.B. and T.X.; Writing—review and editing, Q.B. and T.X., P.W. and Y.L. contributed equally to this work. All authors have read and agreed to the published version of the manuscript.
Funding
This work was supported by the National Natural Science Foundations of China (82204096, 82273680); the Natural Science Foundation of Jiangsu Province (BK20242003); the Research Project of Jiangsu Provincial Health Commission (M2022097); the Preventive medicine research topic of Jiangsu Provincial Health Commission (Ym2023106); the Wuxi Science and Technology Development Fund Project (K20241005); and the Central University Basic Research Project (Youth Fund Project) (JUSRP202501062).
Institutional Review Board Statement
The research content of our paper was rigorously reviewed and approved by the Animal Care and Use Committee of Jiangsu Provincial Center for Disease Control and Prevention, with the approval number JSJK/JL-161.
Informed Consent Statement
Not applicable.
Data Availability Statement
The original data presented in this study are included in the article/Supplementary Materials. Further inquiries can be directed to the corresponding authors.
Acknowledgments
The authors thank Donald L. Hill (University of Alabama at Birmingham, USA), an experienced, English-speaking scientific editor, for editing.
Conflicts of Interest
The authors declare that they have no known competing financial interests or personal relationships that could have appeared to influence the work reported in this paper.
References
- Pinho-Gomes, A.C.; Roaf, E.; Fuller, G.; Fowler, D.; Lewis, A.; ApSimon, H.; Noakes, C.; Johnstone, P.; Holgate, S. Air pollution and climate change. Lancet Planet. Health 2023, 7, e727–e728. [Google Scholar] [CrossRef]
- Sullivan, J.; Sorensen, C. Protecting populations from the health harms of air pollution. BMJ 2023, 383, 2020. [Google Scholar] [CrossRef]
- Manisalidis, I.; Stavropoulou, E.; Stavropoulos, A.; Bezirtzoglou, E. Environmental and Health Impacts of Air Pollution: A Review. Front. Public Health 2020, 8, 14. [Google Scholar] [CrossRef]
- W.H.O. Air Quality, Energy, and Health. Available online: https://www.who.int/teams/environment-climate-change-and-health/air-quality-and-health/health-impacts/types-of-pollutants (accessed on 1 January 2024).
- Xue, T.; Zheng, Y.; Geng, G.; Xiao, Q.; Meng, X.; Wang, M.; Li, X.; Wu, N.; Zhang, Q.; Zhu, T. Estimating Spatiotemporal Variation in Ambient Ozone Exposure during 2013–2017 Using a Data-Fusion Model. Environ. Sci. Technol. 2020, 54, 14877–14888. [Google Scholar] [CrossRef]
- Chen, G.; Guo, Y.; Yue, X.; Xu, R.; Yu, W.; Ye, T.; Tong, S.; Gasparrini, A.; Bell, M.L.; Armstrong, B.; et al. All-cause, cardiovascular, and respiratory mortality and wildfire-related ozone: A multicountry two-stage time series analysis. Lancet Planet. Health 2024, 8, e452–e462. [Google Scholar] [CrossRef]
- Liu, Y.; Misztal, P.K.; Arata, C.; Weschler, C.J.; Nazaroff, W.W.; Goldstein, A.H. Observing ozone chemistry in an occupied residence. Proc. Natl. Acad. Sci. USA 2021, 118, e2018140118. [Google Scholar] [CrossRef]
- Malashock, D.A.; Delang, M.N.; Becker, J.S.; Serre, M.L.; West, J.J.; Chang, K.L.; Cooper, O.R.; Anenberg, S.C. Global trends in ozone concentration and attributable mortality for urban, peri-urban, and rural areas between 2000 and 2019: A modelling study. Lancet Planet. Health 2022, 6, e958–e967. [Google Scholar] [CrossRef]
- Zhao, T.; Markevych, I.; Fuertes, E.; de Hoogh, K.; Accordini, S.; Boudier, A.; Casas, L.; Forsberg, B.; Garcia Aymerich, J.; Gnesi, M.; et al. Impact of long-term exposure to ambient ozone on lung function over a course of 20 years (The ECRHS study): A prospective cohort study in adults. Lancet Reg. Health Eur. 2023, 34, 100729. [Google Scholar] [CrossRef]
- Wiegman, C.H.; Li, F.; Ryffel, B.; Togbe, D.; Chung, K.F. Oxidative Stress in Ozone-Induced Chronic Lung Inflammation and Emphysema: A Facet of Chronic Obstructive Pulmonary Disease. Front. Immunol. 2020, 11, 1957. [Google Scholar] [CrossRef]
- Sokolowska, M.; Quesniaux, V.F.J.; Akdis, C.A.; Chung, K.F.; Ryffel, B.; Togbe, D. Acute Respiratory Barrier Disruption by Ozone Exposure in Mice. Front. Immunol. 2019, 10, 2169. [Google Scholar] [CrossRef]
- Lang, D.S.; Jorres, R.A.; Mucke, M.; Siegfried, W.; Magnussen, H. Interactions between human bronchoepithelial cells and lung fibroblasts after ozone exposure in vitro. Toxicol. Lett. 1998, 96–97, 13–24. [Google Scholar] [CrossRef] [PubMed]
- Niu, Y.; Yang, T.; Gu, X.; Chen, R.; Meng, X.; Xu, J.; Yang, L.; Zhao, J.; Zhang, X.; Bai, C.; et al. Long-Term Ozone Exposure and Small Airway Dysfunction: The China Pulmonary Health (CPH) Study. Am. J. Respir. Crit. Care Med. 2022, 205, 450–458. [Google Scholar] [CrossRef]
- Niu, Y.; Zhou, Y.; Chen, R.; Yin, P.; Meng, X.; Wang, W.; Liu, C.; Ji, J.S.; Qiu, Y.; Kan, H.; et al. Long-term exposure to ozone and cardiovascular mortality in China: A nationwide cohort study. Lancet Planet. Health 2022, 6, e496–e503. [Google Scholar] [CrossRef] [PubMed]
- Liang, S.; Chen, Y.; Sun, X.; Dong, X.; He, G.; Pu, Y.; Fan, J.; Zhong, X.; Chen, Z.; Lin, Z.; et al. Long-term exposure to ambient ozone and cardiovascular diseases: Evidence from two national cohort studies in China. J. Adv. Res. 2024, 62, 165–173. [Google Scholar] [CrossRef]
- Liu, S.; Zhang, Y.; Ma, R.; Liu, X.; Liang, J.; Lin, H.; Shen, P.; Zhang, J.; Lu, P.; Tang, X.; et al. Long-term exposure to ozone and cardiovascular mortality in a large Chinese cohort. Environ. Int. 2022, 165, 107280. [Google Scholar] [CrossRef] [PubMed]
- Greve, H.J.; Dunbar, A.L.; Lombo, C.G.; Ahmed, C.; Thang, M.; Messenger, E.J.; Mumaw, C.L.; Johnson, J.A.; Kodavanti, U.P.; Oblak, A.L.; et al. The bidirectional lung brain-axis of amyloid-beta pathology: Ozone dysregulates the peri-plaque microenvironment. Brain 2023, 146, 991–1005. [Google Scholar] [CrossRef]
- Ling, W.; Ren, Z.; Wang, W.; Lu, D.; Zhou, Q.; Liu, Q.; Jiang, G. Chronic Ambient Ozone Exposure Aggravates Autism-Like Symptoms in a Susceptible Mouse Model. Environ. Sci. Technol. 2023, 57, 14248–14259. [Google Scholar] [CrossRef]
- Lee, J.M.; Meshanni, J.A.; Vayas, K.N.; Sunil, V.R.; Radbel, J.; Laskin, J.D.; Laskin, D.L.; Gow, A.J. Inhaled ozone induces distinct alterations in pulmonary function in models of acute and episodic exposure in female mice. Toxicol. Sci. 2025, 204, 70–78. [Google Scholar] [CrossRef]
- Weng, J.; Liu, Q.; Li, C.; Feng, Y.; Chang, Q.; Xie, M.; Wang, X.; Li, M.; Zhang, H.; Mao, R.; et al. TRPA1-PI3K/Akt-OPA1-ferroptosis axis in ozone-induced bronchial epithelial cell and lung injury. Sci. Total Environ. 2024, 918, 170668. [Google Scholar] [CrossRef]
- Wu, Q.; Xu, F.; Yang, Y.; Zhang, A.; Sun, H.; Yang, L.; Zhao, S.; Zeng, Y.; Wang, M.; Shi, S.; et al. High temperature and ozone co-exposure induces cardiovascular damage in mice: Insights from gut microbiome and plasma metabolomics. Ecotoxicol. Environ. Saf. 2025, 299, 118323. [Google Scholar] [CrossRef]
- Ding, S.; Duanmu, X.; Xu, L.; Zhu, L.; Wu, Z. Ozone pretreatment alleviates ischemiareperfusion injury-induced myocardial ferroptosis by activating the Nrf2/Slc7a11/Gpx4 axis. Biomed. Pharmacother. 2023, 165, 115185. [Google Scholar] [CrossRef]
- Jiang, X.; Li, M.; Li, W.; Guo, Y.; Zhang, J.; Ye, L.; Guo, Z.; Yang, Y.; Liu, W.; Chen, L.; et al. Effects of co-exposure to heat and ozone on lipid metabolism in the liver and adipose tissue of C57BL/6J male mice. J. Hazard. Mater. 2025, 489, 137577. [Google Scholar] [CrossRef] [PubMed]
- Dai, A.; Liu, X.; Chen, Y.; Wang, Y.; Qi, H.; Zeng, Y.; Li, J. Co-exposure to ozone and polystyrene nanoplastic exacerbates cognitive impairment and anxiety-like behavior by regulating neuronal pyroptosis in mice. Environ. Int. 2025, 199, 109501. [Google Scholar] [CrossRef] [PubMed]
- Cabello, N.; Mishra, V.; Sinha, U.; DiAngelo, S.L.; Chroneos, Z.C.; Ekpa, N.A.; Cooper, T.K.; Caruso, C.R.; Silveyra, P. Sex differences in the expression of lung inflammatory mediators in response to ozone. Am. J. Physiol. Lung Cell. Mol. Physiol. 2015, 309, L1150–L1163. [Google Scholar] [CrossRef] [PubMed]
- GB 3095-2012; Ambient Air Quality Standards. Ministry of Ecology and Environment: Beijing, China, 2016.
- Ministry of Ecology and Environment. Report on the State of the Ecology and Environment in China 2022; Ministry of Ecology and Environment: Beijing, China, 2023. [Google Scholar]
- Hatch, G.E.; Duncan, K.E.; Diaz-Sanchez, D.; Schmitt, M.T.; Ghio, A.J.; Carraway, M.S.; McKee, J.; Dailey, L.A.; Berntsen, J.; Devlin, R.B. Progress in assessing air pollutant risks from in vitro exposures: Matching ozone dose and effect in human airway cells. Toxicol. Sci. 2014, 141, 198–205. [Google Scholar] [CrossRef]
- Hatch, G.E.; Slade, R.; Harris, L.P.; McDonnell, W.F.; Devlin, R.B.; Koren, H.S.; Costa, D.L.; McKee, J. Ozone dose and effect in humans and rats. A comparison using oxygen-18 labeling and bronchoalveolar lavage. Am. J. Respir. Crit. Care Med. 1994, 150, 676–683. [Google Scholar] [CrossRef]
- Hatch, G.E.; McKee, J.; Brown, J.; McDonnell, W.; Seal, E.; Soukup, J.; Slade, R.; Crissman, K.; Devlin, R. Biomarkers of Dose and Effect of Inhaled Ozone in Resting versus Exercising Human Subjects: Comparison with Resting Rats. Biomark. Insights 2013, 8, 53–67. [Google Scholar] [CrossRef]
- Hsieh, M.H.; Chen, P.C.; Hsu, H.Y.; Liu, J.C.; Ho, Y.S.; Lin, Y.J.; Kuo, C.W.; Kuo, W.S.; Kao, H.F.; Wang, S.D.; et al. Surfactant protein D inhibits lipid-laden foamy macrophages and lung inflammation in chronic obstructive pulmonary disease. Cell Mol. Immunol. 2023, 20, 38–50. [Google Scholar] [CrossRef]
- Feng, S.; Yang, L.; Dou, S.; Li, X.; Wen, S.; Yan, L.; Huang, W.; Zhang, Y.; Ma, B.; Yuan, L.; et al. Associations between long-term ozone exposure and small airways function in Chinese young adults: A longitudinal cohort study. Respir. Res. 2024, 25, 105. [Google Scholar] [CrossRef]
- Chen, H.; Oliver, B.G.; Pant, A.; Olivera, A.; Poronnik, P.; Pollock, C.A.; Saad, S. Effects of air pollution on human health—Mechanistic evidence suggested by in vitro and in vivo modelling. Environ. Res. 2022, 212, 113378. [Google Scholar] [CrossRef]
- Du, X.; Chen, R.; Kan, H. Challenges of Air Pollution and Health in East Asia. Curr. Environ. Health Rep. 2024, 11, 89–101. [Google Scholar] [CrossRef] [PubMed]
- Lewis, A.C.; Lee, J.D.; Carpenter, L.J. Outdoor air pollution: The effects of ozone. Lancet 2004, 364, 663. [Google Scholar] [CrossRef] [PubMed]
- IHME. State of Global Air 2020. 2020. Available online: https://www.stateofglobalair.org/resources/archived/state-global-air-report-2020 (accessed on 1 January 2024).
- Xie, Y.; Dai, H.; Zhang, Y.; Wu, Y.; Hanaoka, T.; Masui, T. Comparison of health and economic impacts of PM(2.5) and ozone pollution in China. Environ. Int. 2019, 130, 104881. [Google Scholar] [CrossRef] [PubMed]
- Tian, L.; Li, N.; Li, K.; Tan, Y.; Han, J.; Lin, B.; Lai, W.; Liu, H.; Shi, Y.; Xi, Z.; et al. Ambient ozone exposure induces ROS related-mitophagy and pyroptosis via NLRP3 inflammasome activation in rat lung cells. Ecotoxicol. Environ. Saf. 2022, 240, 113663. [Google Scholar] [CrossRef]
- Xu, M.; Wang, L.; Wang, M.; Wang, H.; Zhang, H.; Chen, Y.; Wang, X.; Gong, J.; Zhang, J.J.; Adcock, I.M.; et al. Mitochondrial ROS and NLRP3 inflammasome in acute ozone-induced murine model of airway inflammation and bronchial hyperresponsiveness. Free Radic. Res. 2019, 53, 780–790. [Google Scholar] [CrossRef]
- Pelinsari, S.M.; Sarandy, M.M.; Vilela, E.F.; Novaes, R.D.; Schlamb, J.; Goncalves, R.V. Ozone Exposure Controls Oxidative Stress and the Inflammatory Process of Hepatocytes in Murine Models. Antioxidants 2024, 13, 212. [Google Scholar] [CrossRef]
- Rivas-Arancibia, S.; Hernandez-Orozco, E.; Rodriguez-Martinez, E.; Valdes-Fuentes, M.; Cornejo-Trejo, V.; Perez-Pacheco, N.; Dorado-Martinez, C.; Zequeida-Carmona, D.; Espinosa-Caleti, I. Ozone Pollution, Oxidative Stress, Regulatory T Cells and Antioxidants. Antioxidants 2022, 11, 1553. [Google Scholar] [CrossRef]
- Rivas-Arancibia, S.; Miranda-Martinez, A.; Rodriguez-Martinez, E.; Hernandez-Orozco, E.; Valdes-Fuentes, M.; De la Rosa-Sierra, R. Ozone Environmental Pollution: Relationship between the Intestine and Neurodegenerative Diseases. Antioxidants 2023, 12, 1323. [Google Scholar] [CrossRef]
- Li, F.; Xu, M.; Wang, M.; Wang, L.; Wang, H.; Zhang, H.; Chen, Y.; Gong, J.; Zhang, J.J.; Adcock, I.M.; et al. Roles of mitochondrial ROS and NLRP3 inflammasome in multiple ozone-induced lung inflammation and emphysema. Respir. Res. 2018, 19, 230. [Google Scholar] [CrossRef]
- Goodman, J.E.; Zu, K.; Loftus, C.T.; Lynch, H.N.; Prueitt, R.L.; Mohar, I.; Shubin, S.P.; Sax, S.N. Short-term ozone exposure and asthma severity: Weight-of-evidence analysis. Environ. Res. 2018, 160, 391–397. [Google Scholar] [CrossRef]
- Cross, C.E.; Hesterberg, T.W.; Reiser, K.M.; Last, J.A. Ozone toxicity as a model of lung fibrosis. Chest 1981, 80, 52–54. [Google Scholar] [CrossRef] [PubMed]
- Miller, D.B.; Karoly, E.D.; Jones, J.C.; Ward, W.O.; Vallanat, B.D.; Andrews, D.L.; Schladweiler, M.C.; Snow, S.J.; Bass, V.L.; Richards, J.E.; et al. Inhaled ozone (O3)-induces changes in serum metabolomic and liver transcriptomic profiles in rats. Toxicol. Appl. Pharmacol. 2015, 286, 65–79. [Google Scholar] [CrossRef] [PubMed]
- Zhao, J.; Yang, Q.; Liu, Z.; Xu, P.; Tian, L.; Yan, J.; Li, K.; Lin, B.; Bian, L.; Xi, Z.; et al. The impact of subchronic ozone exposure on serum metabolome and the mechanisms of abnormal bile acid and arachidonic acid metabolisms in the liver. Ecotoxicol. Environ. Saf. 2023, 252, 114573. [Google Scholar] [CrossRef] [PubMed]
- Townsend, K.; Maric, T.; Steer, P.J.; Savvidou, M.D. Maternal hemoglobin drop in multiple pregnancy is associated with higher gestational age at birth and birthweight. Acta Obstet. Gynecol. Scand. 2024, 103, 2002–2012. [Google Scholar] [CrossRef]
- Wang, Y.; Wild, O.; Chen, X.; Wu, Q.; Gao, M.; Chen, H.; Qi, Y.; Wang, Z. Health impacts of long-term ozone exposure in China over 2013–2017. Environ. Int. 2020, 144, 106030. [Google Scholar] [CrossRef]
- Wang, M.; Aaron, C.P.; Madrigano, J.; Hoffman, E.A.; Angelini, E.; Yang, J.; Laine, A.; Vetterli, T.M.; Kinney, P.L.; Sampson, P.D.; et al. Association Between Long-term Exposure to Ambient Air Pollution and Change in Quantitatively Assessed Emphysema and Lung Function. JAMA 2019, 322, 546–556. [Google Scholar] [CrossRef]
- Munzel, T.; Hahad, O.; Daiber, A. The emergence of the air pollutant ozone as a significant cardiovascular killer? Eur. Heart J. 2023, 44, 1633–1635. [Google Scholar] [CrossRef]
- Devlin, R.B.; Duncan, K.E.; Jardim, M.; Schmitt, M.T.; Rappold, A.G.; Diaz-Sanchez, D. Controlled exposure of healthy young volunteers to ozone causes cardiovascular effects. Circulation 2012, 126, 104–111. [Google Scholar] [CrossRef]
- Gui, Z.H.; Guo, Z.Y.; Zhou, Y.; Dharmage, S.; Morawska, L.; Heinrich, J.; Cheng, Z.K.; Gan, H.; Lin, Z.W.; Zhang, D.Y.; et al. Long-term ambient ozone exposure and childhood asthma, rhinitis, eczema, and conjunctivitis: A multi-city study in China. J. Hazard. Mater. 2024, 478, 135577. [Google Scholar] [CrossRef]
- Zhao, T.; Markevych, I.; Standl, M.; Lyu, Z.; Schikowski, T.; Berdel, D.; Koletzko, S.; von Berg, A.; Heinrich, J. Ambient ozone exposure and bone turnover markers in children: Results from the GINIplus and LISA birth cohorts. Environ. Res. 2022, 214, 113784. [Google Scholar] [CrossRef]
- Ren, K.; Niu, B.; Liang, H.; Xi, C.; Song, M.; Chen, J.; Zhao, F.; Cao, Z. Zhichuanling injection improves bronchial asthma by attenuation airway inflammation and epithelia-mesenchymal transition. J. Ethnopharmacol. 2025, 344, 119540. [Google Scholar] [CrossRef] [PubMed]
- Abdel Wadood, N.; Hollenhorst, M.I.; Elhawy, M.I.; Zhao, N.; Englisch, C.; Evers, S.B.; Sabachvili, M.; Maxeiner, S.; Wyatt, A.; Herr, C.; et al. Tracheal tuft cells release ATP and link innate to adaptive immunity in pneumonia. Nat. Commun. 2025, 16, 584. [Google Scholar] [CrossRef] [PubMed]
- Ahmed, C.; Greve, H.J.; Garza-Lombo, C.; Malley, J.A.; Johnson, J.A., Jr.; Oblak, A.L.; Block, M.L. Peripheral HMGB1 is linked to O(3) pathology of disease-associated astrocytes and amyloid. Alzheimers Dement. 2024, 20, 3551–3566. [Google Scholar] [CrossRef] [PubMed]
- Singh, S.A.; Suresh, S.; Vellapandian, C. Ozone-induced neurotoxicity: In vitro and in vivo evidence. Ageing Res. Rev. 2023, 91, 102045. [Google Scholar] [CrossRef]
- Cao, Q.; Zou, L.; Fan, Z.; Yan, Y.; Qi, C.; Wu, B.; Song, B. Ozone causes depressive-like response through PI3K/Akt/GSK3beta pathway modulating synaptic plasticity in young rats. Ecotoxicol. Environ. Saf. 2022, 246, 114171. [Google Scholar] [CrossRef]
- Croze, M.L.; Zimmer, L. Ozone Atmospheric Pollution and Alzheimer’s Disease: From Epidemiological Facts to Molecular Mechanisms. J. Alzheimers Dis. 2018, 62, 503–522. [Google Scholar] [CrossRef]
- Yan, Z.; Liu, Y.M.; Wu, W.D.; Jiang, Y.; Zhuo, L.B. Combined exposure of heat stress and ozone enhanced cognitive impairment via neuroinflammation and blood brain barrier disruption in male rats. Sci. Total Environ. 2023, 857, 159599. [Google Scholar] [CrossRef]
Disclaimer/Publisher’s Note: The statements, opinions and data contained in all publications are solely those of the individual author(s) and contributor(s) and not of MDPI and/or the editor(s). MDPI and/or the editor(s) disclaim responsibility for any injury to people or property resulting from any ideas, methods, instructions or products referred to in the content. |
© 2025 by the authors. Licensee MDPI, Basel, Switzerland. This article is an open access article distributed under the terms and conditions of the Creative Commons Attribution (CC BY) license (https://creativecommons.org/licenses/by/4.0/).