Article

Spatial Variation Characteristics of Polycyclic Aromatic Hydrocarbons and Their Derivatives in Surface Water of Suzhou City: Occurrence, Sources, and Risk Assessment

1
National Research Center for Geoanalysis, Key Laboratory of Eco-Geochemistry, Ministry of Natural Resources, Beijing 100037, China
2
Guizhou Academy of Testing and Analysis, Guiyang 550002, China
3
Suzhou Sub-Bureau of Jiangsu Provincial Hydrology, Water Resources Survey Bureau, Suzhou 215000, China
*
Author to whom correspondence should be addressed.
These authors contributed equally to this work.
Toxics 2025, 13(5), 403; https://doi.org/10.3390/toxics13050403
Submission received: 29 March 2025 / Revised: 8 May 2025 / Accepted: 9 May 2025 / Published: 16 May 2025

Abstract

Polycyclic aromatic hydrocarbons (PAHs) and their substituted derivatives (SPAHs) are persistent organic pollutants derived from incomplete combustion of fossil fuels and industrial processes. These compounds are of global concern due to their carcinogenicity and environmental persistence. This study provides the first comprehensive analysis of PAH and SPAH contamination in Suzhou’s rapidly urbanizing watersheds, integrating ultra-high-performance liquid chromatography and high-resolution mass spectrometry with multidimensional risk assessment to address critical gaps in understanding pollutant dynamics in urban aquatic systems. Key findings reveal that SPAHs were significantly more abundant than parent PAHs (mean ∑19 SPAHs = 107.43 ng/L vs. ∑8 PAHs = 48.05 ng/L), with hydroxylated derivatives accounting for 67.9% of the total SPAHs, indicating active environmental transformation processes. Source apportionment identified coal combustion and industrial emissions as the dominant contributors (58.2% of PAHs), directly linking contamination patterns to localized anthropogenic activities. Notably, industrial zones exhibited unexpected toxicity hotspots, where SPAH toxicity equivalents (e.g., 3-OH-BaP) surpassed parent PAHs 2–5-fold, demonstrating substituent-driven toxicity enhancement—a critical finding for regulatory prioritization. This study advances the field by uncovering SPAHs as emerging risks in urban waterways, challenging traditional PAH-centric monitoring frameworks, and providing a novel integration of analytical chemistry and spatial risk mapping to guide targeted pollution control (e.g., prioritizing industrial discharges and non-exhaust traffic emissions). Furthermore, it highlights the urgent need for updated toxicological databases to account for substituted PAH derivatives and advocates for the regulatory inclusion of SPAHs. These insights underscore the necessity of adapting environmental policies to address complex pollutant mixtures in rapidly developing regions, emphasizing the replicability of the proposed framework for urban watershed management.

1. Introduction

Polycyclic aromatic hydrocarbons (PAHs) and their substituted derivatives (SPAHs) are a class of organic compounds composed of two or more fused aromatic benzene rings, characterized by unique cyclic structures and stable chemical properties [1,2]. As persistent organic pollutants, they have garnered significant attention in environmental science due to their carcinogenic, teratogenic, and mutagenic effects [3]. PAHs primarily originate from incomplete combustion of fossil fuels and petroleum product leakage, including industrial emissions, vehicle exhaust, coal combustion, and waste incineration [4]. Owing to their low water solubility, high lipophilicity, and elevated octanol–water partition coefficients, PAHs tend to adsorb onto suspended particulate matter or sediments, widely distributing across atmospheric, soil, sediment, and aquatic environments [5]. Consequently, they enter human bodies via food chains and drinking water, posing potential risks to aquatic organisms and public health [6]. The environmental fate of PAHs involves complex migration and transformation processes, entering surface and groundwater systems through atmospheric transport, particulate deposition, and stormwater runoff [7]. Their distribution and mobility in surface water are further influenced by geological structures, hydrodynamic conditions, and soil adsorption, leading to pronounced spatiotemporal variability in contamination patterns [8]. Common SPAHs such as nitrated PAHs (NPAHs), hydroxylated PAHs (OHPAHs), and oxygenated PAHs (OPAHs) share sources with parent PAHs [8,9,10]. Compared to their parent compounds, certain SPAHs exhibit higher toxicity, enhanced polarity, greater environmental persistence, and bioavailability, rendering PAH/SPAH contamination an increasingly critical research focus [3,8,11,12].
In the source apportionment of PAHs and SPAHs, diverse methodologies have been developed for the precise identification and quantification of pollution origins [13]. Isomer ratio methods (e.g., Phe/Ant, Flu/Pyr) utilize concentration ratios of specific PAH congeners to preliminarily differentiate between natural versus anthropogenic sources [14]. However, these ratios are susceptible to environmental variables (e.g., temperature, pH) and contamination history, introducing interpretative uncertainties, while overlapping ratios across sources limit their accuracy [15]. Receptor models based on mass balance principles enable quantitative assessment of source contributions, providing scientific foundations for targeted control strategies [16]. Yet, model construction requires extensive emission and environmental concentration datasets, often challenging to acquire, and idealized assumptions may deviate from real-world conditions, compromising result reliability [17]. Compound-specific isotope analysis (CSIA) distinguishes PAH sources (e.g., petroleum spills vs. combustion products) by analyzing stable isotopic ratios (δ13C, δ2H), offering direct evidence for source identification, particularly in complex environments [18,19]. Nevertheless, CSIA faces limitations, including high analytical costs, stringent laboratory requirements, and potential isotopic fractionation effects, necessitating meticulous calibration [20]. Comparatively, multivariate statistical approaches such as principal component analysis (PCA) coupled with multiple linear regression demonstrate superior efficacy in source analysis of aquatic PAHs/SPAHs. As an unsupervised learning technique, PCA reduces data dimensionality to extract principal components, revealing intrinsic patterns and dominant trends in contamination datasets. Without requiring prior knowledge, PCA identifies source categories (e.g., industrial emissions, traffic exhausts, petroleum leakage) and quantifies their contributions via absolute principal component scores (APCS), establishing a robust basis for risk assessment and mitigation strategies [21].
Despite extensive research on PAH/SPAH occurrence, concentration levels, and spatial distribution in atmospheric and soil matrices, studies on surface water environments remain limited, particularly in rapidly urbanizing regions [22,23,24,25,26]. Suzhou, a pivotal city in eastern China’s Yangtze River Delta, is renowned for its historical heritage, economic vitality, and unique geographical setting [27]. As a core urban hub and ecological priority zone, Suzhou’s surface water resources are vital to municipal water supply systems, directly impacting residents’ livelihoods and sustainable development [28]. However, accelerated industrialization and urbanization have imposed unprecedented environmental pressures, with surface water security threatened by multi-source pollution from industrial discharges, domestic sewage, and agricultural runoff [29,30,31,32]. Current research on PAHs and emerging derivatives in Suzhou’s surface waters remains scarce at regional scales, lacking systematic characterization and risk assessment [33]. This study pioneered a regional-scale investigation into the occurrence and spatial distribution of PAHs/SPAHs in Suzhou’s surface waters, employing multi-source apportionment models to decipher contamination origins and integrating ecological health risk analysis to quantify multi-media exposure risks. The findings aim to safeguard drinking water security, support sustainable urban development, and inform evidence-based pollution control policies.

2. Materials and Methods

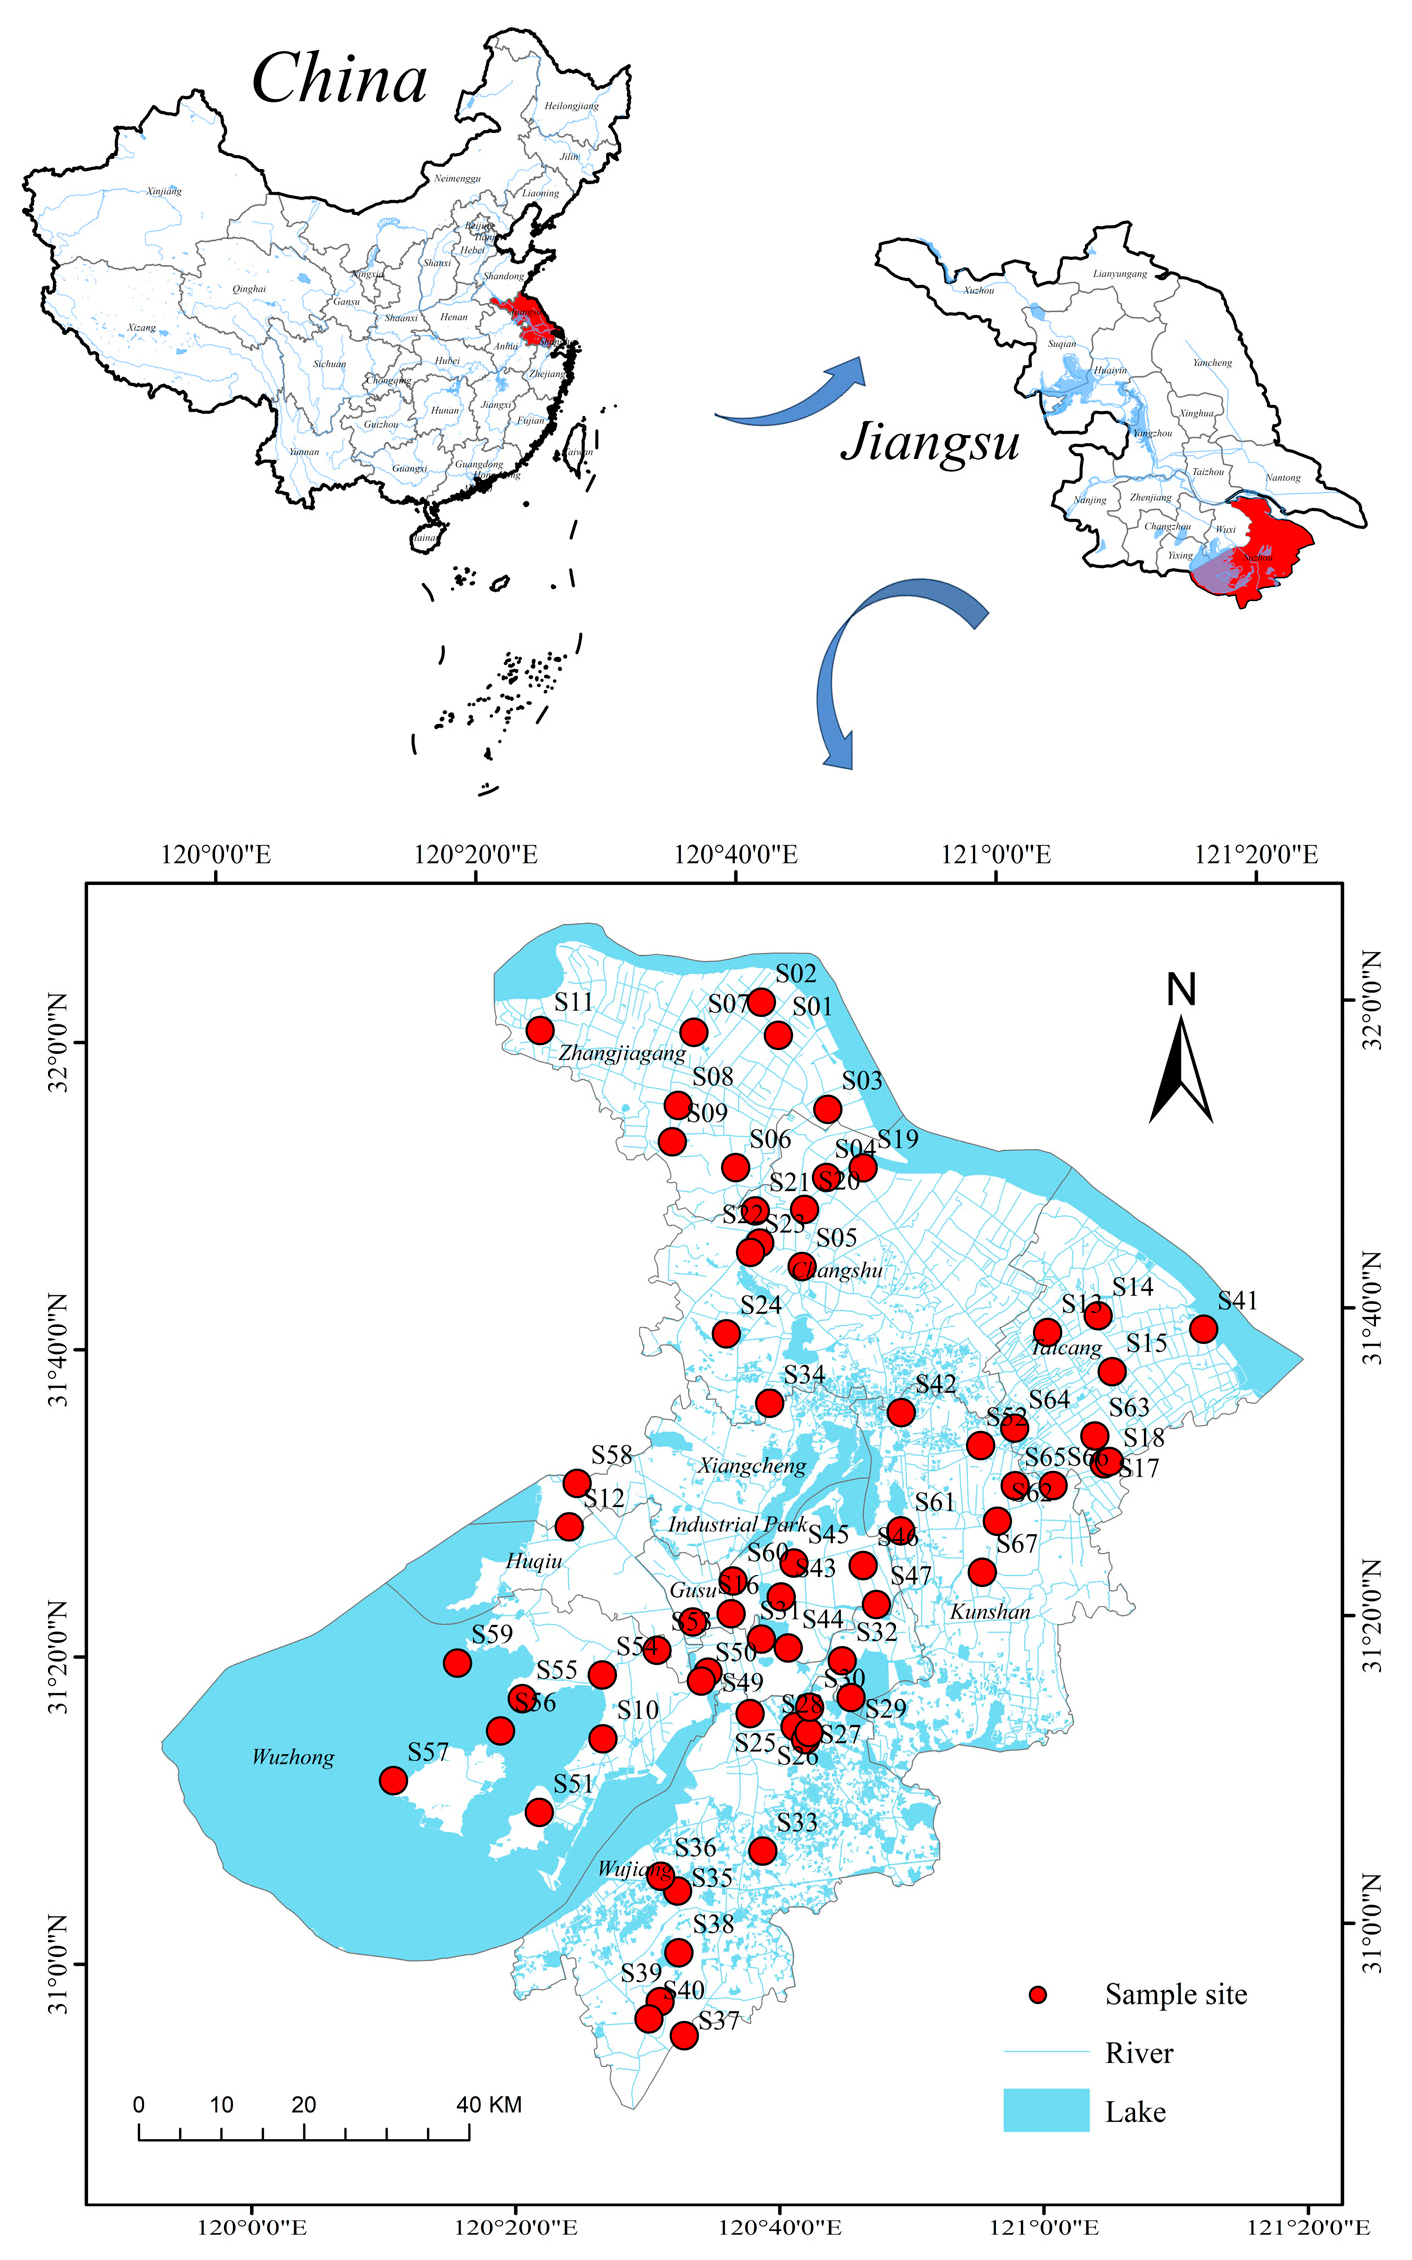
2.1. Study Area and Sample Collection

Suzhou City is situated in the eastern Taihu Plain of the Yangtze River Delta, characterized by a subtropical monsoon marine climate with distinct seasons, abundant rainfall (annual average: 1100 mm), and a mean annual temperature of 15.7 °C [34]. Based on field surveys, 67 representative surface water samples were collected from rivers and lakes across Suzhou (sampling sites shown in Figure 1). Fifty mL of each water sample was stored in a precleaned centrifuge tube (washed three times with methanol and ultrapure water to avoid background contamination), and information such as sampling time, location, pH, and environmental conditions was recorded. The samples were stored in the dark at 4 °C and quickly transported to the laboratory for analysis.

2.2. Reagents and Instruments

Fifteen PAHs and 19 SPAHs (names and abbreviations are provided in Table 1) were analyzed. PAH standards (100 mg/L) and SPAH standards (100 µg/mL) were purchased from AccuStandard Inc. (AccuStandard Inc., New Haven, CT, USA). HPLC-grade acetonitrile and methanol were supplied by Merck KGaA (Merck KGaA, Darmstadt, Germany). Ultrapure water was prepared using a Milli-Q Advantage-10/Elix system (MilliporeSigma, Burlington, MA, USA). The key instruments included: an ST16R high-speed centrifuge (Thermo Fisher Scientific, Waltham, MA, USA), a Vortex-Genie 2 oscillator (Scientific Industries, Bohemia, NY, USA), an UltiMate™ 3000 online SPE–UHPLC system (Thermo Fisher Scientific) with a DGP 3600M dual-gradient pump, a TCC-3200 column oven, and a WPS-3000TSL autosampler, and a Q Executive Plus quadrupole-orbitrap high-resolution mass spectrometer (Thermo Fisher Scientific).

2.3. Pretreatment and Instrumental Conditions

2.3.1. Water Sample Pretreatment

The samples were filtered through 0.22 μm membranes to remove suspended solids. Turbid samples were centrifuged at 5000 rpm for 10 min prior to filtration. For PAH analysis, 8 mL of filtered water was mixed with 2 mL of acetonitrile; for SPAHs, 10 mL of filtered water was directly transferred to vials.

2.3.2. Instrumental Parameters

PAH analysis was conducted as described below. Online SPE steps included loading, washing, column regeneration, elution, and separation (the elution procedure is shown in Table A1) [35]. A 7.5 mL aliquot was loaded onto a Turboflow C18-XL SPE column (50 × 0.5 mm) and eluted onto an Agilent RRHD Eclipse Plus PAH column (1.8 µm, 3 × 100 mm) at 25 °C. Fluorescence detection (FLD-3000 RS) was used for quantification. SPAH analysis: similar chromatographic conditions were applied, except for the mobile phase (0.1% formic acid) and column temperature (30 °C). HRMS parameters: capillary temperature, 300 °C; corona discharge, 4.0 µA (positive), 10.0 µA (negative); full MS/dd-MS2 scan, m/z 100–900. Resolutions: 70,000 FWHM (MS1), 17,500 FWHM (MS2).

2.4. Quality Assurance and Control

Calibration curves (1–200 ng/L, R2 ≥ 0.99) were established. Method validation included blanks, spiked samples (10, 100, 200 ng/L), and duplicates. Recoveries: PAHs: 102–117% (10 ng/L), 99–122% (100 ng/L), 101–115% (200 ng/L); SPAHs: 78–116%, 76–109%, 70–103%. Precision (intra-/inter-day): 0.4–4.0% (PAHs), 1.0–9.3% (SPAHs). Detection limits: 0.02–1.26 ng/L (PAHs), 0.13–1.98 ng/L (SPAHs).

2.5. Source Identification and Risk Assessment

2.5.1. PCA and Isomer Ratios

Log(x + 1)-transformed and Z-score-normalized PAH/SPAH concentrations were analyzed using PCA (IBM SPSS Statistics, version 27, IBM Corp., Armonk, NY, USA). Kaiser–Meyer–Olkin (KMO > 0.6) and Bartlett’s tests (p < 0.05) confirmed data suitability. Principal components (eigenvalues >1) were extracted via varimax rotation [36]. Diagnostic ratios and factor regression complemented PCA for source apportionment [37].

2.5.2. Risk Assessment

Risk assessment usually includes two aspects: ecological risk and health risk [38]. Ecological risks involve potential impacts on aquatic organisms, while health risks focus on potential hazards to humans after exposure through drinking water or other means [39].
Ecological risk quotient (RQ):
RQ(NCs) = CPAHs/CQV(NCs)
RQ(MPCs) = CPAHs/CQV(MPCs)
R Q P A H s ( N C s ) = i = 1 15 R Q ( N C s ) ,
R Q P A H s ( M P C s ) = i = 1 15 R Q ( M P C s ) ,
where CPAHs represents the measured concentration of PAHs in surface water (ng/L); RQ(NCs) and RQ(MPCs) denote the minimum and maximum risk quotients, respectively; CQV(NCs) and CQV(MPCs) are the criteria quality values for the lowest and maximum permissible concentrations in aquatic environments (ng/L), respectively; and RQ∑PAHs(NCs) and RQ∑PAHs(MPCs) are the minimum and maximum risk entropy values of ∑15PAHs, respectively. The CQV(NCs) and CQV(MPCs) values for the 15 PAHs are listed in Table A2, while the individual PAH congeners and their ecological risk classifications are detailed in Table A3 [39,40].
The lifetime carcinogenic risk (ILCRS) model recommended by the USEPA is used to evaluate the health risks of PAHs and SPAHs in water bodies [41]. Based on the similar mechanism of toxicity of PAHs, the concentration of carcinogenic characteristic substances (c) is converted into the toxic equivalent concentration of BaP (TEQBaP), and the potential carcinogenic risks to human health in water bodies are quantitatively characterized by TEQ [18]. Among them, ingestion and skin contact are two important ways in which PAHs in water pose a threat to humans. The calculation formula and the related parameters are as follows:
T E Q = i = 1 n C i × T E F i ,
O r a l   i n t a k e : I L C R o r a l = T E Q × S F × I R × E F × E D B W × A T ,
S k i n   c o n t a c t : I L C R d e r n a l = T E Q × S A × K p × E T × E F × E D B W × A T × C S F d e r n a l ,
I L C R = I L C R o r a l + I L C R d e r n a l ,
Parameters: C, concentration (ng/L); TEF, toxic equivalency factor (Table A4); SF = 7.3; IR = 2 L/day; EF = 350 days/year; ED = 70 years; BW = 70 kg; AT = 70 years × 365 days = 25,550 days, SA = 18,000 cm2, Kp = 0.001 cm/h, ET = 0.58 h/day, CSF = 1.46 (mg/kg/day)−1. Due to the missing TEF, Kp, and CSF values of some SPAHs, literature reports and model predictions were used for the calculation. Risk thresholds: ILCR < 10−6 (negligible), 10−6 ≤ ILCR < 10−4 (potential risk), ILCR ≥ 10−4 (high risk) [42].

3. Results and Discussion

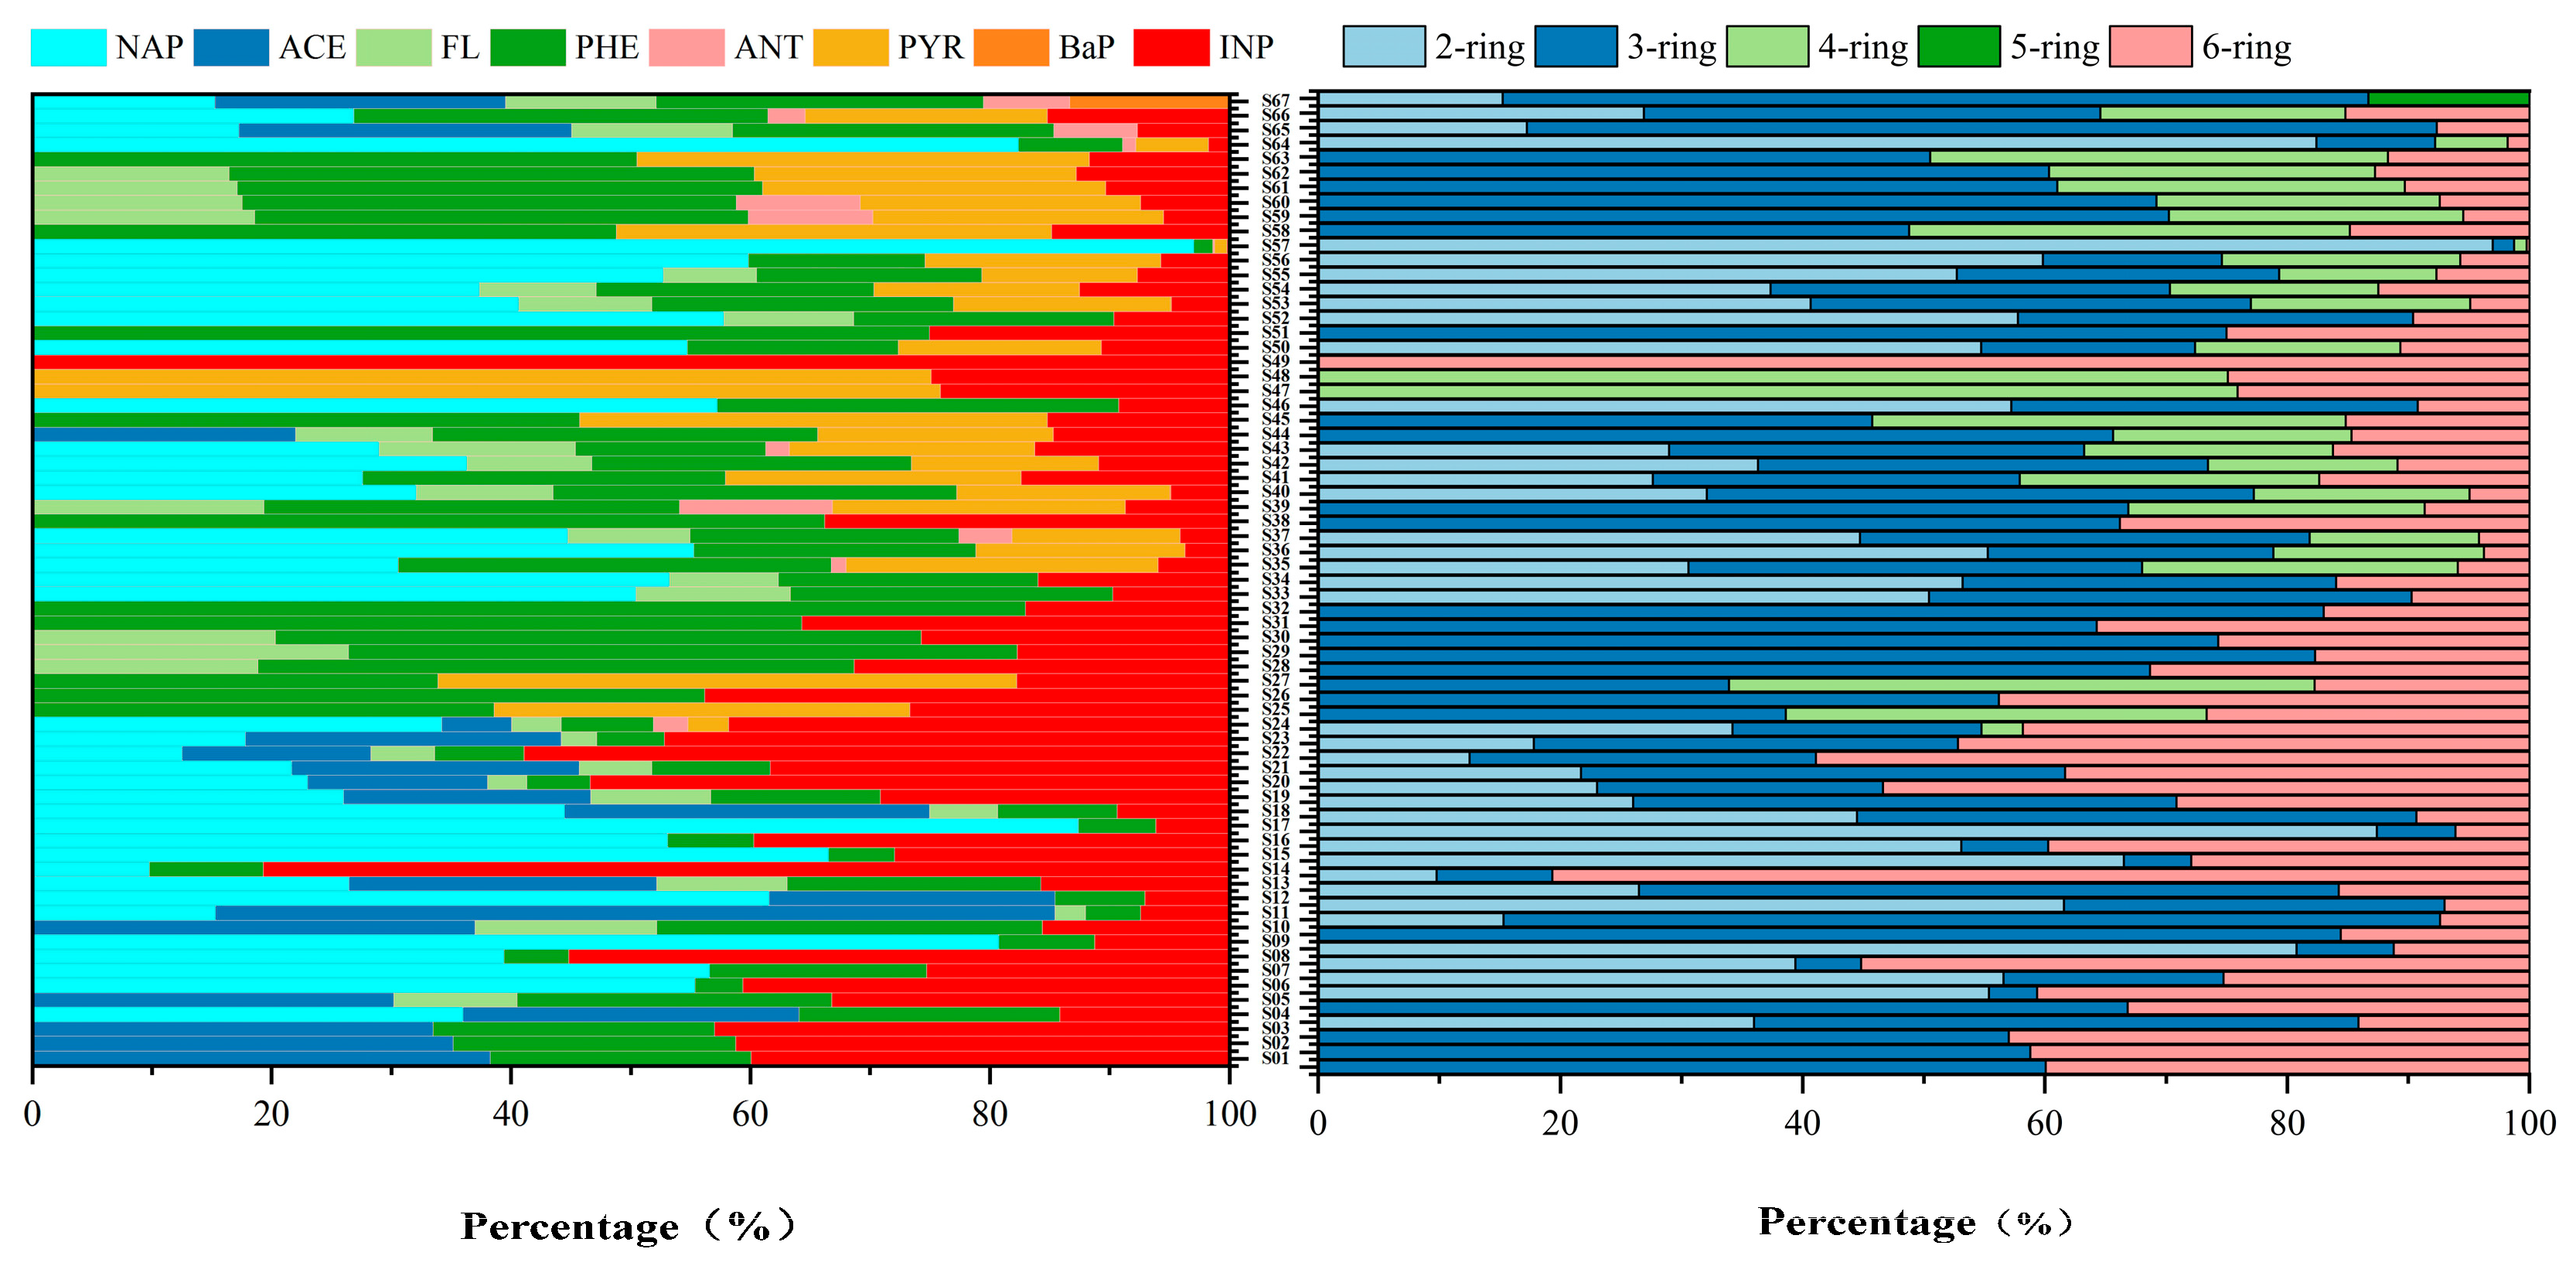
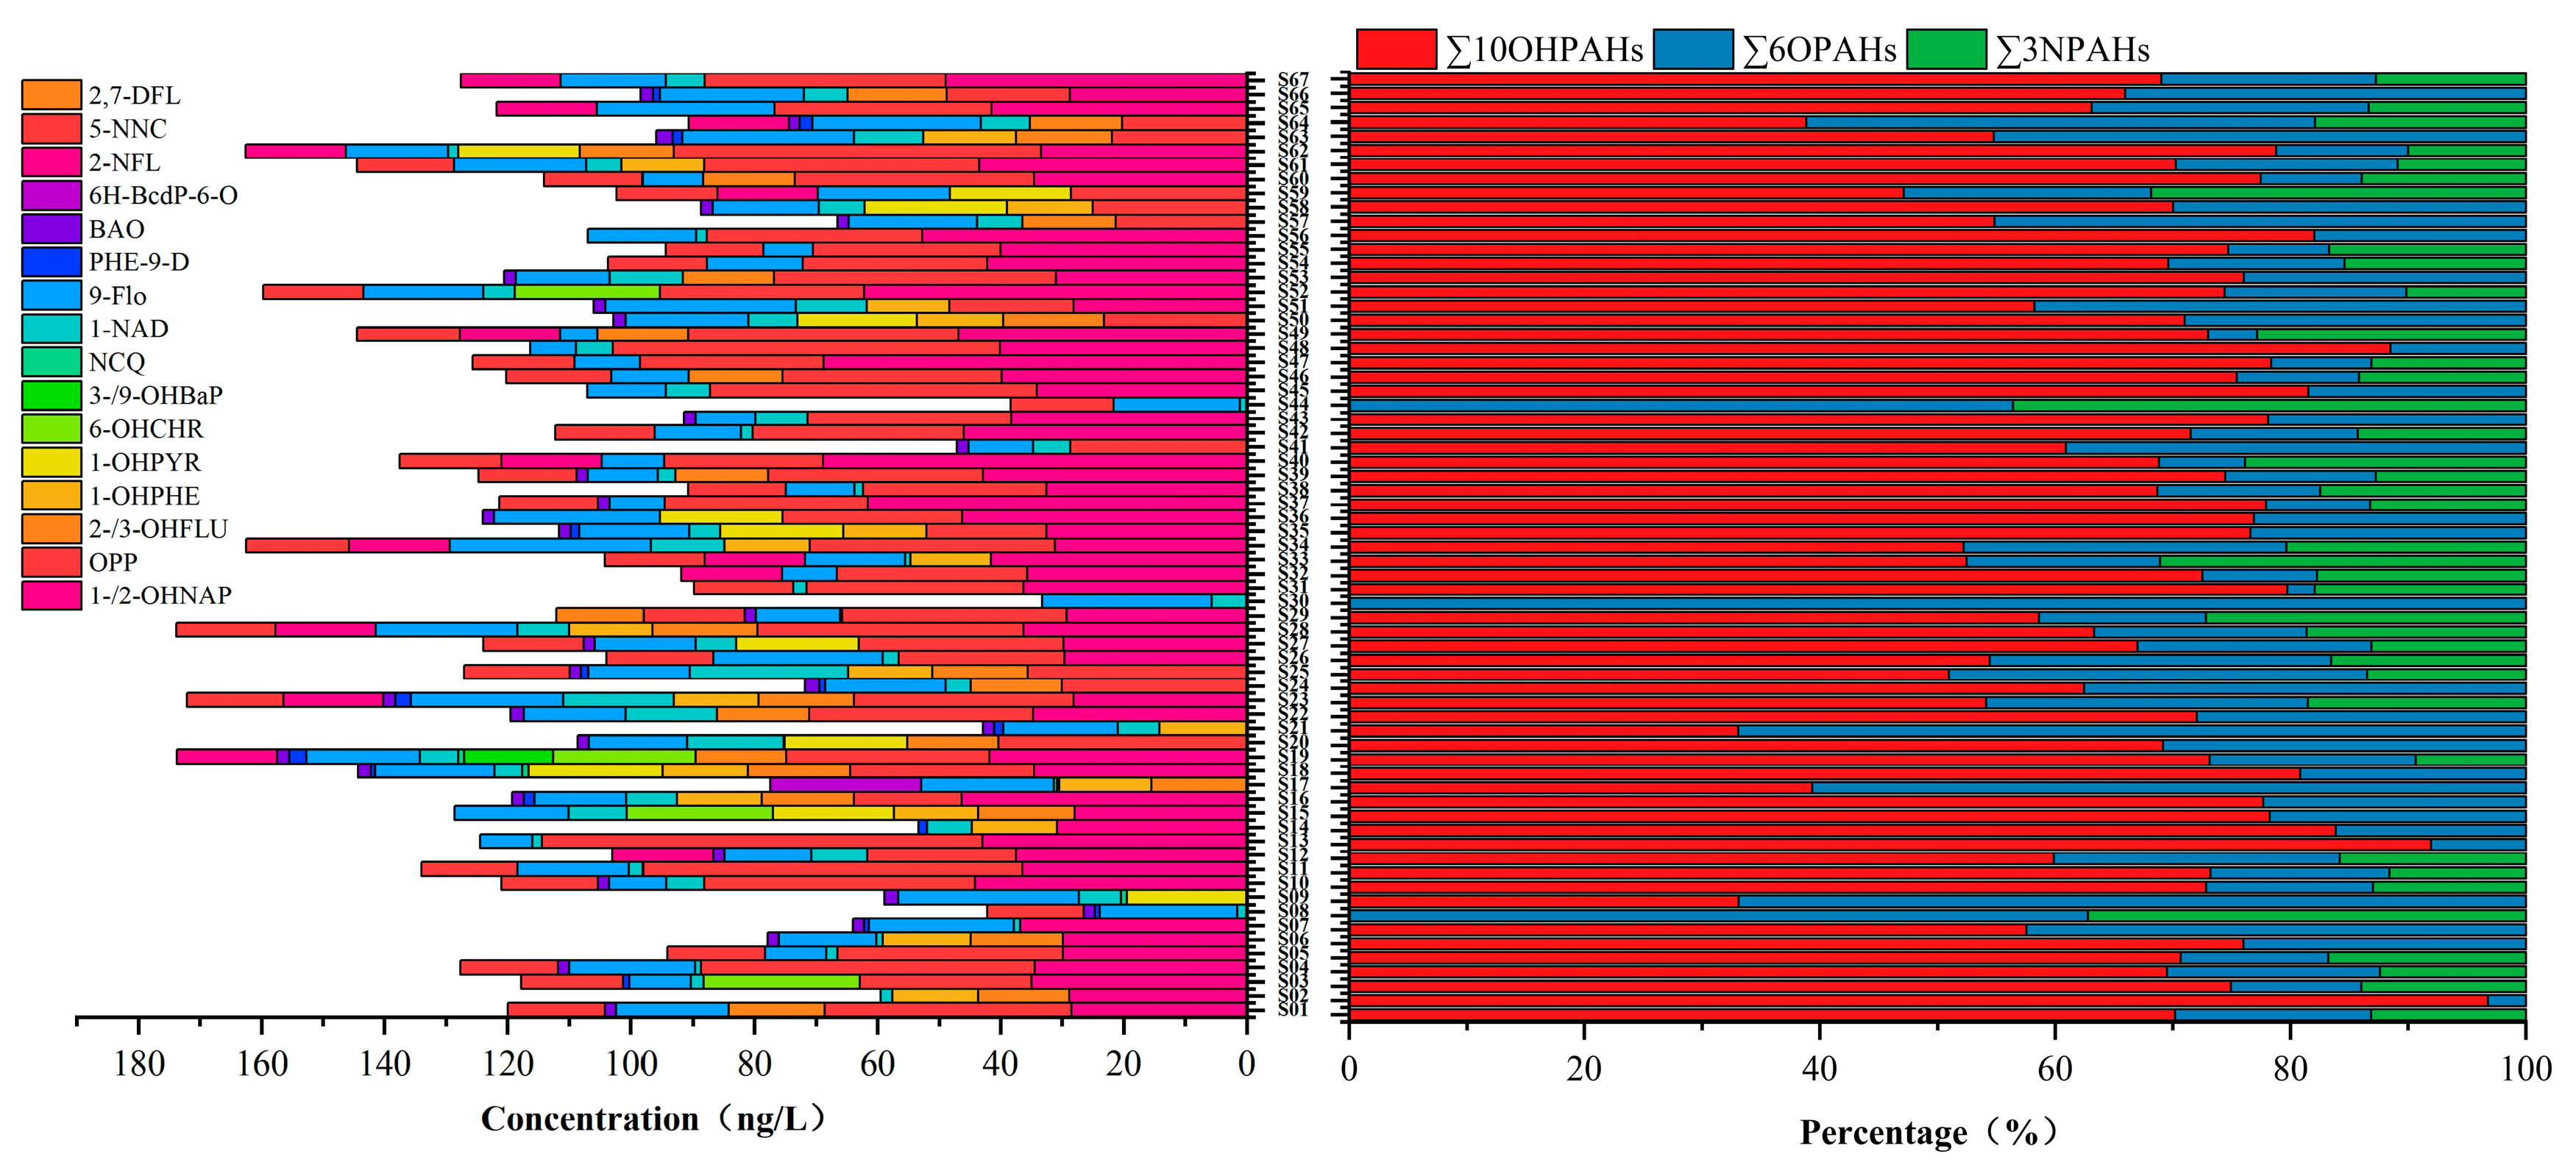
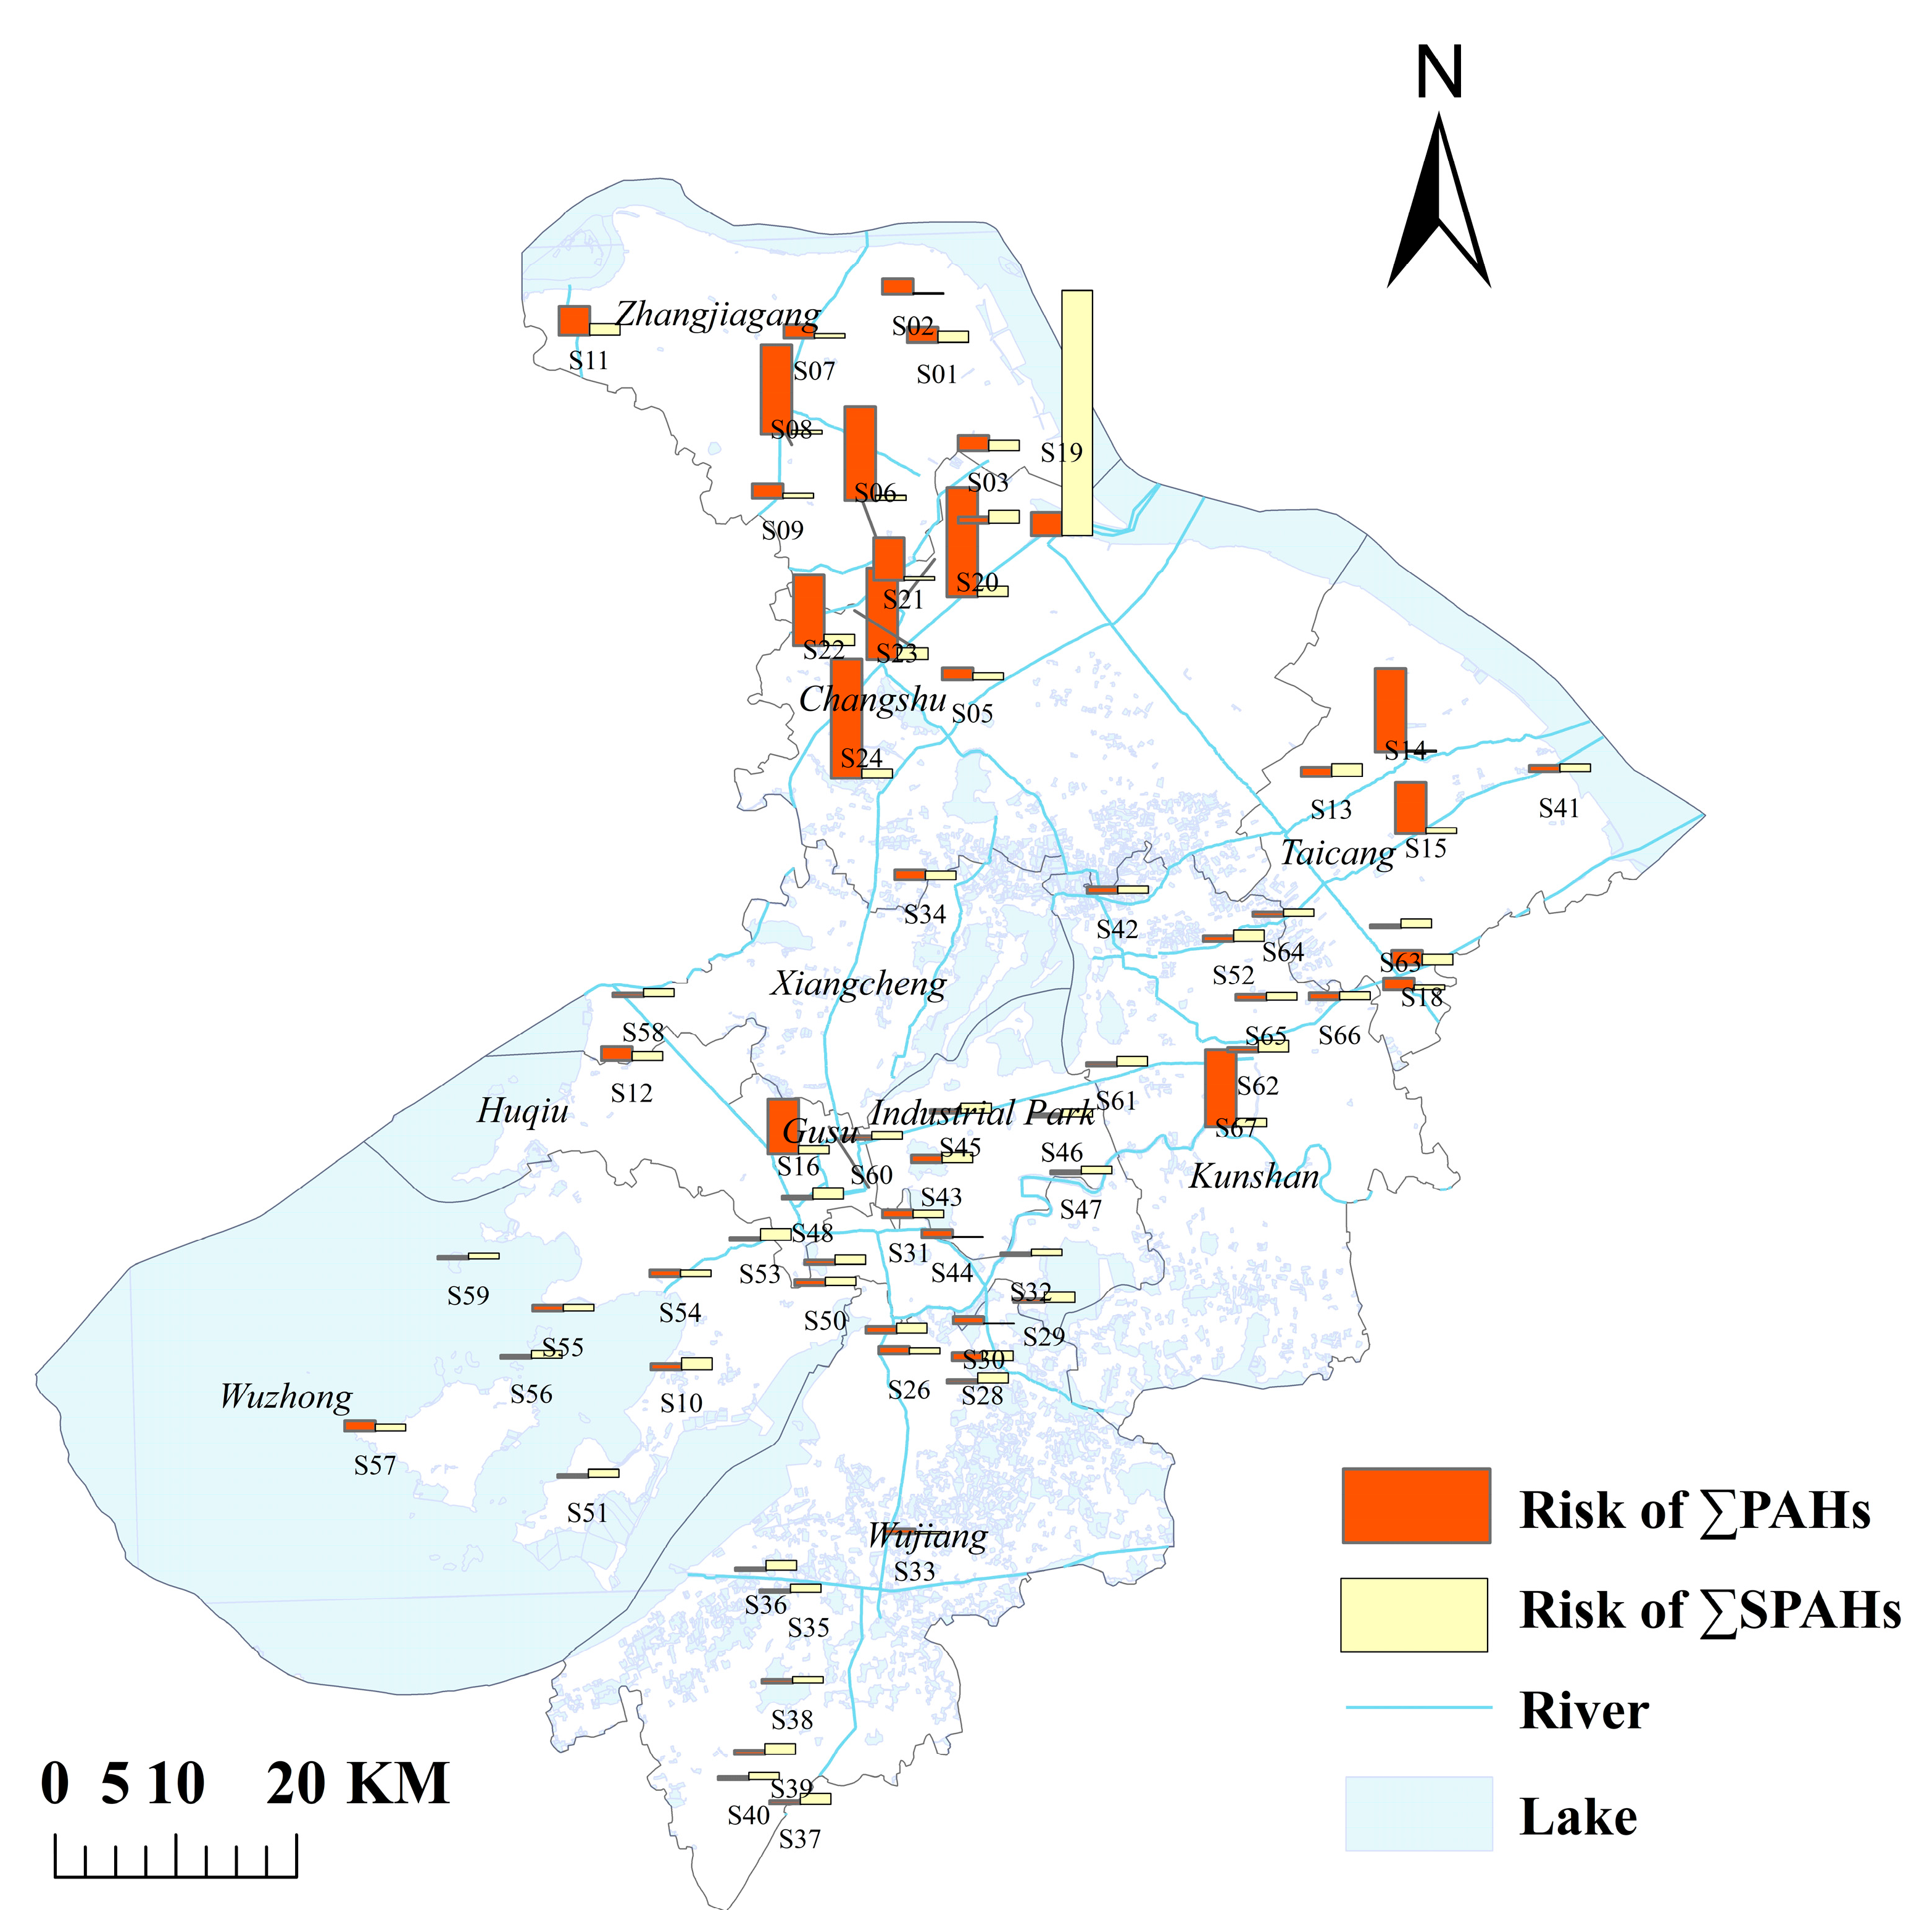
3.1. Occurrence and Spatial Distribution of PAHs and SPAHs in Surface Water

Among the collected surface water samples, 8 PAHs (NAP, ACE, ANT, PYR, BaP, PHE, FL, and INP) and 19 SPAHs were detected, while 7 PAHs (CHR, FLU, BkF, BbF, BaA, DBA, and BghiP) were below detection limits. This indicates that not all PAH congeners are present in the studied water bodies, with their distribution likely influenced by pollution sources, environmental conditions, and physicochemical properties of PAHs. The total concentration of ∑8PAHs ranged from 2.65 to 514.16 ng/L (mean: 48.05 ng/L), significantly higher than levels in the Pearl River Delta urban agglomeration (mean: 39.1 ng/L) [43] but lower than in the Bohai Bay (mean: 89.6 ng/L) [11]. The highest concentration was observed at Yali (S57, 514.16 ng/L), potentially linked to anthropogenic activities or historical pollution, while the lowest occurred at Moshe Bridge (S49, 2.65 ng/L) [33]. For ∑19SPAHs, concentrations ranged from 33.27 to 173.84 ng/L (mean: 107.43 ng/L). Elevated SPAH levels were clustered in industrial zones (e.g., Nansha Bridge, Gengjingtang Bridge), suggesting associations with traffic and combustion emissions [44] (detailed concentrations are provided in Table A5; spatial distributions are provided in Figure 2).
The geographical distribution of the sampling points (Figure 2) revealed elevated levels of NAP within ∑8PAHs in the Yali Scenic Area of Wuzhong District, Suzhou City. This may correlate with high human/vehicle traffic, water-based tourism activities, and dock operations in the area [4]. Industrial clusters (e.g., Zhangjiagang and Kunshan) exhibited significantly higher PAH and SPAH concentrations compared to other regions, with ∑19SPAHs averaging 142.6 ng/L in industrial zones, likely attributable to wastewater discharges and organic pollutant transformation [45]. Elevated NPAH levels were observed near transportation hubs (e.g., S23, Xisanhuan Lake Bridge: 31.87 ng/L; S49, Moshe Bridge: 32.98 ng/L), consistent with nitration byproducts from diesel vehicle emissions. Furthermore, it is not difficult to observe from Figure 2 that in most of the same sampling points, the phenomenon where the content of ∑SPAHs is higher than that of ∑PAHs is mainly due to the fact that PAHs can be generated and converted into SPAHs in the environment through mechanisms such as photochemical reactions and microbial interactions [46]. Their stability in the environment is usually higher than that of parent PAHs (such as NPAHs and OPAHs) [47]. In water and soil, microorganisms can degrade PAHs and generate a series of SPAHs. Some SPAHs have higher polarity and water solubility, making them easier to dissolve in water, while parent PAHs may adsorb more on suspended particles or sediments [48]. Aquatic organisms can absorb, enrich, and transform PAHs and SPAHs, and some SPAHs may have higher stability and bioaccumulation in organisms, resulting in higher concentrations of SPAHs in organisms than of parent PAHs [8]. With the increasingly strict exhaust emission control standards and the gradual popularization of new energy vehicles, the contribution of non-exhaust emissions (such as brake wear, tire wear, etc.) to traffic pollution is gradually increasing. These non-exhaust emission processes and certain industrial processes (such as coking, refining, coal combustion, etc.) may directly generate emissions of waste gas or wastewater containing SPAHs, which enter water bodies through surface runoff and other pathways [45]. These factors are intertwined and together determine the relative content of SPAHs and PAHs in water.

3.2. Compositional Characteristics of PAHs and SPAHs

Among the detected PAH congeners (Table A5), NAP exhibited the highest mean concentration (22.07 ng/L), followed by INP (10.48 ng/L). Notably, BaP—a potent carcinogen—showed a concentration range of ND (not detected) to 4.59 ng/L, with a detection frequency of 1.49%, indicating minimal contamination risk in the studied water bodies. Compared to global water systems, PAH concentrations in Suzhou’s surface waters were comparable to those in Shanghai rivers (46.53–221.54 ng/L) [49] and the Yellow River Delta (64.8–334.6 ng/L) [50], yet significantly lower than levels in China’s Daliao River (71.12–4255.43 ng/L) [51] and Colombia’s Cauca River (52.1–12,888.2 ng/L) [52] (Table 2). These findings suggest relatively low PAH contamination in Suzhou’s surface waters.
The ring distribution characteristics of PAHs in surface water were as follows: 2-ring (45.93%) > 3-ring (27.28%) > 6-ring (21.81%) > 4-ring (4.83%) > 5-ring (0.14%). Low-molecular-weight PAHs (2- and 3-ring) dominated, collectively accounting for over 70% of the total PAHs. The predominant congeners included NAP, ACE, FL, PHE, and ANT (Figure 3). Among these, NAP was the most abundant, representing 0–96.96% of the total PAHs. The prevalence of low-molecular-weight PAHs is thermodynamically governed by their higher Henry’s law constants (10−4–10−5 atm·m3/mol) and vapor pressures (10−2–10−4 mm Hg) [53], facilitating atmospheric deposition and water-phase partitioning. High-molecular-weight PAHs (4–6 rings) constituted 26.78% of the total PAHs. Their persistence was enhanced by hydrophobic adsorption (log Koc, 4.8–6.3) and photodegradation resistance (quantum yield Φ < 0.01 vs 0.1–0.3 for LMW PAHs) [54]. Notably, PYR (4-ring) and INP (6-ring) exhibited elevated concentrations at Xieqiao (Wang) (S20, 65.99 ng/L) and South Lake Bridge (S24, 72.43 ng/L), consistent with their particle-bound transport (98% association with PM2.5) and combustion-derived emission factors (EFPYR = 0.18–0.34 mg/kg coal) [55].
Among the 19 SPAHs monitored, the detection rates of 1-/2-OHNAP, OPP, 1-NAD, and 9-Flo were greater than 60%, demonstrating their widespread occurrence in the studied water bodies (Figure 4). The highest mean concentration was observed for 1-/2-OHNAP (29.59 ng/L), followed by OPP (28.82 ng/L) and 9-Flo (16.69 ng/L). For SPAH subclasses: ∑10OHPAHs ranged from ND (not detected) to 128.02 ng/L (mean: 73.04 ng/L); ∑6OPAHs ranged from 1.93 to 47.07 ng/L (mean: 23.29 ng/L); and ∑3NPAHs ranged from ND to 33.08 ng/L (mean: 11.10 ng/L), with detection frequencies below 50%. OHPAHs dominated the SPAH profile, constituting 67.99% of the total SPAHs, while OPAHs and NPAHs accounted for 21.68% and 10.33%, respectively. This dominance likely stemmed from OHPAHs’ strong polarity, elevated aqueous solubility, and facilitated transformation from parent PAHs. Compared to the prior studies, the NPAH concentrations in Suzhou were lower than those in the Taihu Lake basin, industrial effluents, and municipal wastewater [56]. The OPAH levels were below those reported for Tianjin’s Haihe River [57]. Geospatial analysis revealed marginally higher SPAH concentrations near residential zones, suggesting anthropogenic influences on their distribution. However, SPAH formation is inherently linked to chemical transformations of parent PAHs, complicating direct inferences from spatial or compositional data alone [48]. Integrated multi-source analyses are thus warranted to elucidate mechanistic pathways.

3.3. Source Apportionment of PAHs and SPAHs

3.3.1. PCA

Source apportionment of PAHs and SPAHs was conducted through PCA combined with APCS. PCA further validated the pollution characteristics of PAHs and SPAHs (Figure 5). For PAHs, the first two principal components (PC1: 28.3%, PC2: 19.6%) cumulatively explained 47.9% of the total variance. Similarly, for SPAHs, PC1 (22.8%) and PC2 (13.1%) accounted for 35.9% of the total variance.
The six principal components (PCs) extracted from the PAH source apportionment cumulatively explained 91.84% of the total variance (Table A6). The source profiles are detailed as described below. PC1 (28.87% variance contribution): dominated by high loadings of PHE, FL, and ANT, which are established tracers of coal/coke combustion [58]; this component reflects emissions from industrial boilers and residential coal burning. PC2 (19.58%) and PC5 (9.69%): associated with BaP, ANT, and INP, indicative of high-temperature industrial processes (e.g., smelting, coking) [59]; their combined contribution (29.27%) underscores industrial dominance. PC3 (14.54%): characterized by PYR and ANT, where PYR is a diagnostic marker for diesel engine emissions, aligning with traffic-intensive sampling sites. PC4 (11.94%): primarily loaded with ACE, linked to incomplete combustion of gasoline/kerosene in regional heating or power plants. PC6 (7.22%): driven by NAP, strongly correlated with coke oven emissions and petroleum volatilization [60].
Source contributions ranked as follows: coal/coke combustion (28.87%), high-temperature industries (29.27%), traffic (14.54%), fossil fuel combustion (11.94%), and petroleum volatilization (7.22%). These results are consistent with the Jiangsu Province Industrial Emission Inventory, which reports that coal combustion contributes 26–31% of PAHs in Suzhou’s surface water, closely matching regional coking activities (Available online: http://www.suzhou.gov.cn/szsrmzf/tjgb/202303/2c908288857d4f3d01858a7e6b7a1c23.shtml (accessed on 8 May 2025)). Petroleum-related emissions align with satellite-derived estimates of oil storage terminal emissions (3.6–4.0 t/yr) in the Suzhou Industrial Park [61]. Notably, NAP, INP, and PHE collectively accounted for 81.49% of the cumulative contributions, emphasizing synergistic impacts from petroleum volatilization, industrial/traffic combustion, and diffuse combustion sources in regional pollution.
The cumulative variance explained by the eleven PCs extracted from the SPAH dataset reached 89.94% (Table A7). Their source characteristics are detailed as described below. PC1 (22.84%): dominated by 1-/2-OHNAPs, which are hydroxylated derivatives of NAP resulting from anthropogenic activities (e.g., industrial wastewater discharge) [8]. PC2 (13.11%): characterized by 3-/9-OHBaPs and NCQ, where 3-/9-OHBaPs are carcinogenic metabolites of benzo[a]pyrene, while NCQ is associated with coal tar processing and environmental oxidation of acenaphthene; this component reflects mixed contributions from industrial byproducts and biotransformation pathways. PC3 (8.67%): marked by 2-OHFLU and 1-NAD, where 2-OHFLU originates from the oxidation of high-molecular-weight PAHs during high-temperature combustion, while 1-NAD is emitted from naphthalene-containing waste in chemical production, indicating a composite source of industrial emissions and combustion byproducts [62]. PC4–PC11 (7.73%–3.75%) are mainly composed of OPP, 6H-BcdP-6-O, 1-OHPYR, 2-NFL, 6-OHCHR, 9-FLo, 5-NNC, and 2,7-DFL, respectively. Among them, OPP (PC4) is mainly produced in industrial anti-corrosion, sterilization, and other production processes, 1-OHPYR (PC6) is closely related to fossil fuel combustion, 2-NFL (PC7) is related to the diesel exhaust nitrification reaction, and 2,7-DFL (PC11) may originate from the production of fluorinated industrial products, reflecting the risk of emerging pollutants [63].
The rotated component matrices revealed complex loading patterns requiring nuanced interpretation (Table A2 and Table A3). Specifically, cross-loadings (variables loading significantly on multiple components) and negative loadings provided critical insights into source interactions. For PAHs, ANT exhibited cross-loadings across PC1 (0.527), PC2 (0.563), and PC3 (0.427), suggesting mixed contributions from coal combustion, industrial processes, and traffic emissions. Negative loadings such as PHE (−0.126 in PC4) may indicate inverse relationships between combustion sources and petroleum volatilization. In SPAHs, NCQ showed dual loadings on PC2 (0.795) and PC6 (0.350), reflecting combined industrial and biotransformation pathways. The strong negative loading of OHPHE1 (−0.666 in PC4) likely represents antagonistic effects between PAH oxidation products from different source types.

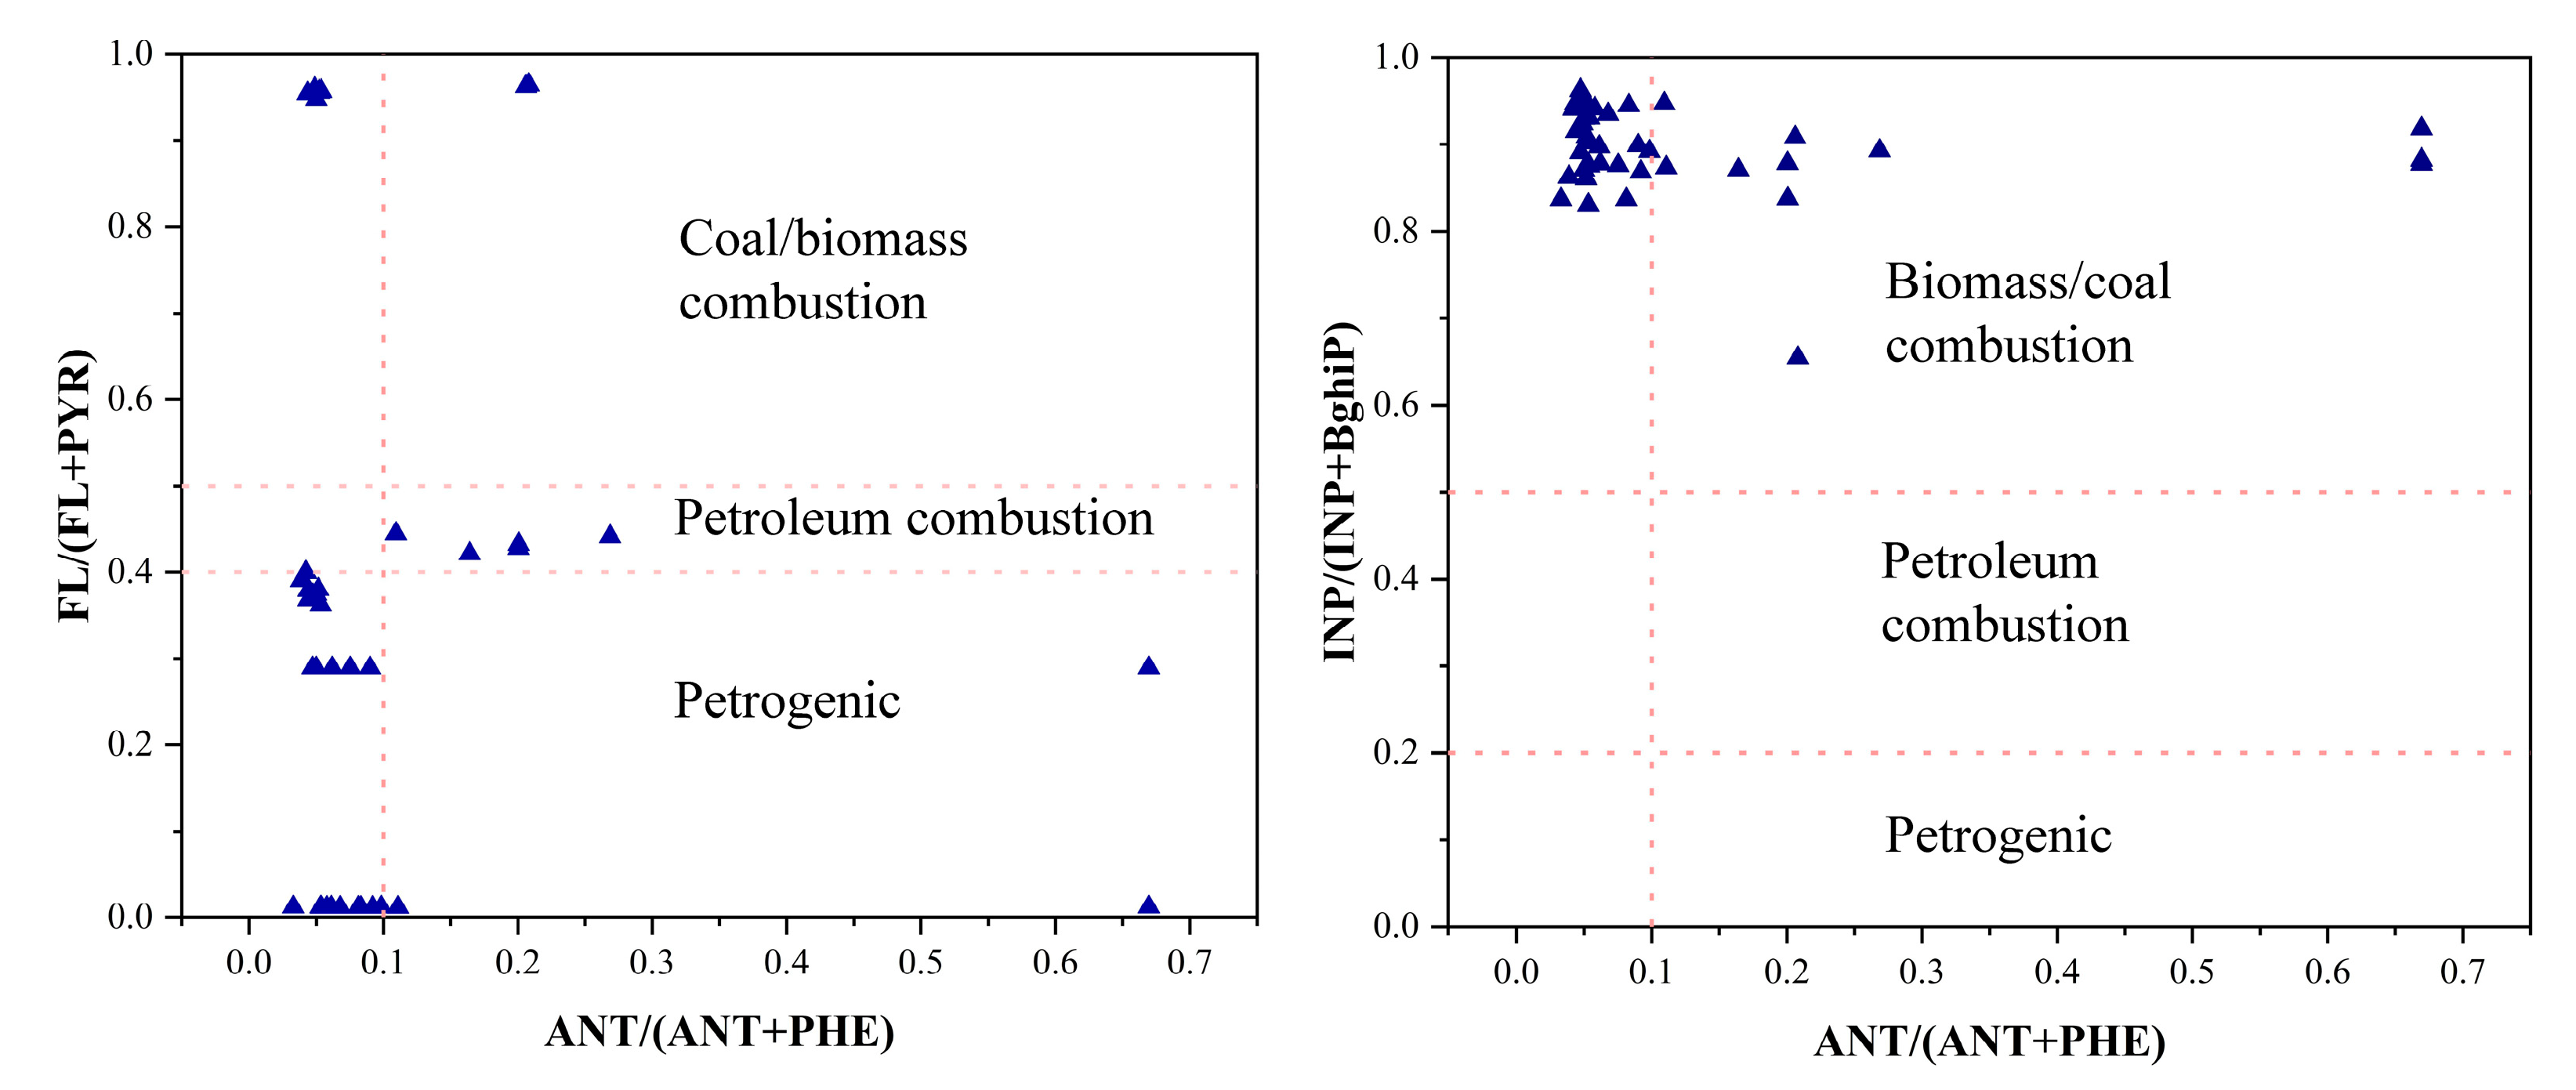
3.3.2. Diagnostic Ratio

Diagnostic ratios such as Fla/(Fla + Pyr), Ant/(Ant + Phe), and InP/(InP + BghiP) have been widely applied to identify and quantify the primary sources of polycyclic aromatic hydrocarbons (PAHs).
As shown in Figure 6, the Ant/(Ant + Phe) ratios for most samples (e.g., S01–S36, S50–S63) were below 0.1, supporting a dominant petroleum origin. Similarly, Fla/(Fla + Pyr) ratios in most samples were significantly lower than 0.4, further confirming petroleum sources. However, partial samples exhibited ratios exceeding 0.5, with the maximum value reaching 0.964 (S67), unequivocally indicating high-temperature combustion of petroleum, coal, or biomass. Notably, all InP/(InP + BghiP) ratios exceeded 0.5, with over 80% of the samples surpassing 0.8, strongly implicating diesel combustion or industrial high-temperature emissions. Elevated ratios at sites near waterways—such as the Port Overpass (S06) and Chenghang Bridge (S08)—suggest ship diesel engine emissions as a key contributor. These findings align with anthropogenic activities in the Beiluo River basin, where biomass combustion for agricultural and urban-industrial energy needs releases PAHs into rivers via terrestrial runoff, atmospheric deposition, and industrial effluents [64]. Additionally, petrogenic PAHs may originate from oil spills, incomplete combustion, or extraction activities in the petroleum industry [65]. Consistent with prior studies, the primary PAH sources are linked to energy production processes (e.g., oil refining, biomass combustion) essential for industrial and agricultural development, with subsequent transport into aquatic systems through runoff, atmospheric pathways, and wastewater discharge [65,66].

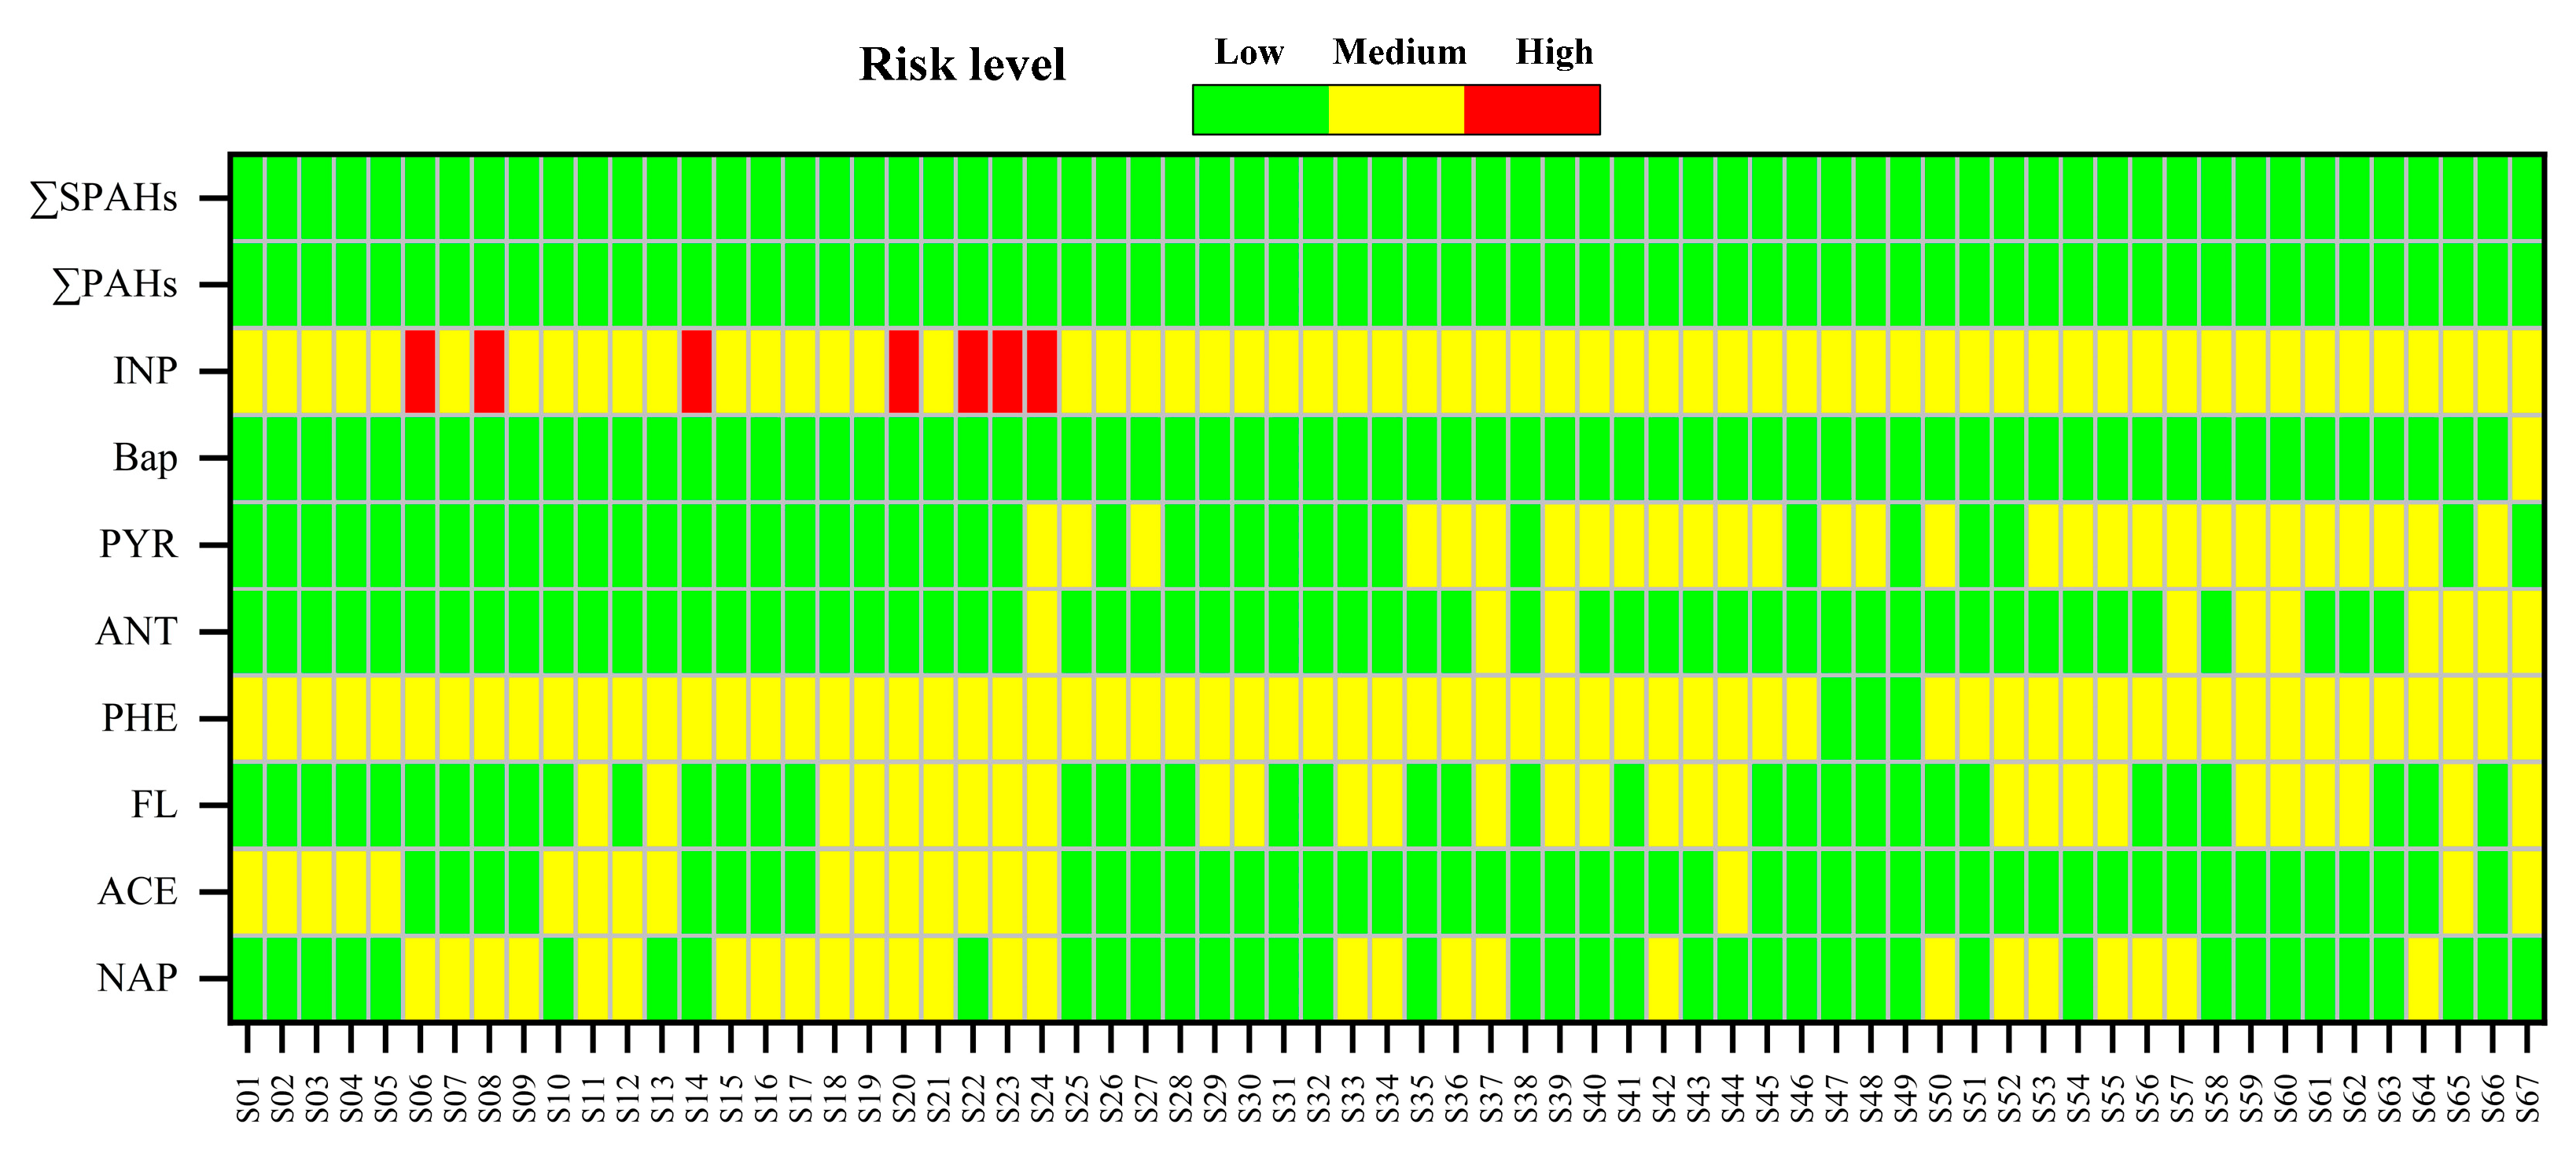
3.4. Ecological and Health Risk Assessment

Ecological RQs were calculated for PAHs and SPAHs at various sampling points in Suzhou’s surface water. Risk levels were classified based on established PAH ecological risk thresholds. Due to the absence of CQV(NCs) and CQV(MPCs) for SPAHs, RQs for SPAHs were estimated using a derived formula: R Q = C S P A H s P E N C [47], which extrapolates toxicity thresholds from parent PAHs through structural-activity relationships, introducing potential uncertainties in cross-congener extrapolation accuracy.
The total risk quotients (∑PAHs: 5.814–213.399; ∑SPAHs: ND–1.98) indicated low cumulative ecological risks for PAHs and SPAHs in Suzhou’s surface water (Figure 7). However, moderate-to-high risks were identified for individual PAH congeners, including INP, PYR, PHE, FL, CHR, and NAP. Among these, INP exhibited the highest risk (RQ: 2.475–181.078), with seven sampling sites exceeding the high-risk threshold (RQ > 1). Although ∑SPAHs posed low cumulative risks, moderate risks were observed for specific SPAH congeners (e.g., OPP, 3-OHBaP). These hydroxylated and sulfonated derivatives demonstrated amplified bioavailability compared to parent compounds, potentially explaining their elevated per-unit risk despite lower environmental concentrations. Importantly, this study only assessed 19 SPAHs, while numerous undetected and unknown derivatives likely exist. These unmonitored compounds may amplify ecological risks, suggesting that SPAHs could pose more severe threats than parent PAHs [47,67]. Prioritized monitoring and toxicity assessments for SPAHs are thus urgently warranted in the future, particularly focusing on derivatives with reactive functional groups that may increase biological membrane permeability and metabolic activation potential.
Figure 8 shows the health risk analysis of PAHs and SPAHs in surface water, as can be seen from the figure we found that the PAHs risk at 67 sampling points ranged from 4.11 × 10⁻⁸ to 2.17 × 10⁻⁶, with an average of 3.47 × 10⁻⁷. The overall risk was not high (88.06% of low-risk areas), but there were 8 medium risk areas, possibly related to intensive industrial activities [68] or affected by shipping or surrounding emissions; When calculating the health risks of SPAHs, due to the lack of toxicological data (such as TEF and CSF) of SPAHs, this study temporarily estimated the risks based on the toxicity parameters of parent PAHs, which may lead to biased results [69]. Future experimental determination of SPAHs’ toxic effects should include microbiological toxicity tests to assess their ecological interactions and potential bioaccumulation pathways, as microbial degradation processes may alter their bioavailability and persistence in aquatic systems [67]. In the future, experimental determination of the toxic effects of SPAHs is needed to improve the evaluation. From this, it can be concluded that the risk value of SPAHs ranges from 9.63 × 10⁻⁹ to 4.45 × 10⁻⁶, with an average value of 2.09 × 10⁻⁷, and there is a medium risk point S19 (Gengjingtang Bridge). Due to the wide variety of SPAHs and the lack of toxicological data, as well as the fact that they are not only exposed or ingested, this study only conducted a simple risk assessment on 19 of them, which has certain limitations [9]. However, the specific risk of SPAHs showed abnormally high values at individual sites (such as S19), and their toxicity equivalent far exceeded that of the parent PAHs, indicating that substituent modification may significantly enhance the biological activity of pollutants [67]. This raises concerns about potential non-carcinogenic effects on humans, including oxidative stress, endocrine disruption, and developmental toxicity, particularly for vulnerable populations such as children and pregnant women exposed through drinking water or food chains [68,70]. This phenomenon is consistent with the toxicological enhancement trend of alkylated PAHs in recent studies [8]. The total risk value of PAHs in some high-risk areas and regions is significantly higher than the threshold, indicating that there may be hidden pollution sources around industrial intensive areas or transportation hubs, and they need to be prioritized for inclusion in the environmental supervision network. Therefore, PAHs and SPAHs have a certain potential carcinogenic risk to the human body and need to be taken seriously.

4. Conclusions

This study systematically investigated the occurrence, sources, and risks of PAHs and substituted PAHs (SPAHs) in surface waters of Suzhou, a rapidly urbanizing city in the Yangtze River Delta. The key findings are as follows: SPAHs surpassed parent PAHs in environmental abundance (∑19 SPAHs = 107.43 ng/L vs. ∑8 PAHs = 48.05 ng/L), with hydroxylated derivatives accounting for 67.99% of the total, indicating active environmental transformation processes. Industrial zones and transportation hubs emerged as high-risk hotspots, where 6-ring PAHs (e.g., indeno[1,2,3-cd]pyrene) and specific SPAHs (e.g., 3-OH-BaP) exhibited toxicity equivalents 2–5-fold higher than parent PAHs. Source apportionment linked 58.2% of PAHs to coal combustion and industrial emissions, demonstrating a direct correlation between contamination intensity and localized anthropogenic activities.
To address these risks, we propose implementing priority controls on industrial discharges (e.g., wastewater from chemical parks and coke production) and non-exhaust traffic emissions (e.g., tire and brake wear particles), which are critical contributors to SPAH loads. Regulatory frameworks should incorporate SPAHs, supported by expanded toxicological databases for derivatives such as hydroxylated and nitrated PAHs.
Future research directions should include multi-season sampling to assess the impact of rainfall and temperature on PAH/SPAH distribution, particularly in urban runoff systems. While this study provides a regional assessment of SPAH risks in the Yangtze River Delta, its single-season sampling design limits extrapolation to annual trends. Nevertheless, the integration of high-resolution mass spectrometry with spatial risk mapping offers a replicable framework for urban watershed management, highlighting the necessity of adapting regulatory frameworks to address substituted PAH derivatives.

Author Contributions

Conceptualization, F.G. and Z.J.; methodology, S.W.; software, J.F.; validation, J.F. and H.Z.; formal analysis, H.Z. and J.F.; investigation, J.J. and X.C.; resources, Y.J. and X.S.; data curation, X.S.; writing—original draft preparation, J.F.; writing—review and editing, J.F. and F.G.; visualization, X.S.; supervision, J.J.; project administration, F.G.; funding acquisition, F.G. All authors have read and agreed to the published version of the manuscript.

Funding

This research was funded by the Chinese Academy of Geological Sciences Basal Research Fund, grant number JKYZD202418, and the Geological Survey Projects of the China Geological Survey, grant number DD20250501406.

Institutional Review Board Statement

Ethical approval was not required.

Informed Consent Statement

Not applicable.

Data Availability Statement

Data are contained within the article. The original contributions presented in this study are included in the article. Further inquiries can be directed to the first author (corresponding author).

Conflicts of Interest

The authors declare no conflict of interest.

Appendix A

Table A1. Online solid-phase extraction–liquid chromatography gradient elution program.
Time (min)Left PumpRight PumpPosition
A1 (%)B1 (%)Flow Rate (mL/min)A2 (%)B2 (%)Flow Rate (mL/min)
−6.010004.060400.41
0.010004.060400.41
0.19820.560400.41
5.09820.560400.42
12.09550.5---1
12.55952.0---1
18.05952.001000.41
25.05952.001000.41
25.110004.060400.41
29.010004.060400.41
Note: −6 denotes the time required for enriching 7.5 mL of a water sample prior to data acquisition. Mobile phase: A1, ultrapure water; B1, acetonitrile; A2, ultrapure water; B2, acetonitrile.
Table A2. CQV values of PAHs in aquatic environmental matrices.
PAHsWater (ng/L)
CQV(NCS)CQV(MPCS)
Nap121200
Ace0.770
Fl0.770
Phe3300
Ant0.770
Flu3300
Pyr0.770
BaA0.110
ChR3.4340
BbF0.110
BkF0.440
BaP0.550
Inp0.440
DBA0.550
Bghip0.330
Table A3. Ecological risk classification of individual PAHs and ΣPAHs.
Individual PAHs∑PAHs
Risk LevelRQ(NCS)RQ(MPCs)Risk LevelRQ(NCS)RQ(MPCs)
Low risk0<1No risk0<1
Low risk1–800<1
Medium risk≥1<1Medium risk 1≥800<1
Medium risk 2<800≥1
High risk ≥1High risk≥800≥1
Table A4. TEF and PNEC values of PAHs and SPAHs.
PAHTEFPNEC (ng/L)SFSPAHPNEC (ng/L)
BaP1.00.77.31-/2-OHNAP100.0
OPP50
INP0.13.00.732-/3-OHFLU200.0
1-OHPHE150.0
ACE0.0150.00.0736-OHCHR80.0
1-OHPYR50.0
PHE0.001100.00.00733-/9-OHBaP1.0
9-FLo80.0
ANT0.0180.00.073PHE-9-D200.0
6H-BcdP-6-O10.0
PYR0.001150.00.00735-NNC20.0
2-NFL25.0
FL0.001600.00.000732,7-DFL15.0
1-NAD300.0
NAP0.0011000.00.00073NCQ500.0
BAO50.0
Table A5. Concentrations and detection rates of PAHs and SPAHs in surface water.
CompoundMinimum (ng/L)Maximum (ng/L)Mean (ng/L)Detection Rate (%)
NAP ND498.5322.0759.70
ACEND86.954.4128.36
FLND7.191.7647.76
PHEND13.356.6195.52
ANTND4.980.3317.91
PYRND5.922.3242.28
BaPND4.590.071.49
INPND72.4310.4898.51
1-/2-OHNAPND68.8129.5976.12
OPPND71.4528.8282.09
2-/3-OHFLU ND17.075.7337.31
1-OHPHEND15.063.9328.36
1-OHPYR ND23.153.3216.42
6-OHCHRND25.331.42 5.97
3-/9-OHBaPND14.490.221.49
NCQND1.000.057.46
1-NADND25.724.9180.60
9-FloND32.6416.6995.52
PHE-9-DND2.820.3222.39
BAOND2.640.9549.25
6H-BcdP-6-OND24.520.371.49
2-NFLND16.343.4020.90
5-NNCND17.197.4946.27
2,7-DFLND14.120.211.49
Table A6. Total variance explained for PAHs.
ComponentInitial EigenvaluesExtraction Sums of Squared LoadingsRotation Sums of Squared Loadings
TotalVariance %Cumulative %TotalVariance %Cumulative %TotalVariance % Cumulative %
12.30928.86828.8682.30928.86828.8681.79822.47322.473
21.56719.58148.4491.56719.58148.4491.24315.53238.006
31.16314.53762.9861.16314.53762.9861.12013.99452.000
40.95511.94274.9280.95511.94274.9281.06813.35565.355
50.7759.68584.6130.7759.68584.6131.06213.27078.625
60.5787.22491.8370.5787.22491.8371.05713.21291.837
70.3494.35896.195
80.3043.805100.000
Rotated component matrix a
Component
123456
NAP0.007−0.0100.0490.0040.0560.984
ACE0.0570.016−0.1410.9710.0880.006
FL0.8210.1300.0520.2790.100−0.220
PHE0.9020.1000.059−0.126−0.0150.177
ANT0.5270.5630.427−0.0040.2660.039
PYR0.090−0.1030.930−0.152−0.1810.051
BaP0.1250.940−0.1470.023−0.122−0.022
INP0.074−0.067−0.1490.0920.9600.058
Rotation method: Caesar normalization maximum variance method. a The rotation converged after 6 iterations.
Table A7. Total variance explained for SPAHs.
ComponentInitial EigenvaluesExtraction Sums of Squared LoadingsRotation Sums of Squared Loadings
TotalVariance %Cumulative %TotalVariance %Cumulative %TotalVariance %Cumulative %
13.88322.83922.8393.88322.83922.8392.18212.83312.833
22.22813.10935.9472.22813.10935.9471.89811.16724.000
31.4748.67244.6201.4748.67244.6201.87611.03535.034
41.3157.73452.3541.3157.73452.3541.3718.06643.100
51.1746.90559.2601.1746.90559.2601.2477.33350.433
61.1136.54565.8041.1136.54565.8041.1977.04157.475
71.0095.93671.7401.0095.93671.7401.1556.79464.269
80.9085.33977.0790.9085.33977.0791.1366.68570.954
90.8434.95882.0370.8434.95882.0371.1326.66077.614
100.7064.15586.1920.7064.15586.1921.0656.26683.880
110.6373.74689.9380.6373.74689.9381.0306.05889.938
120.5663.32993.266
130.3822.24795.513
140.3331.96097.473
150.2681.57499.047
160.1620.953100.000
172.993 × 10−50.000100.000
Rotated component matrix a
Component
1234567891011
OHNAP10.945−0.002−0.1520.138−0.061−0.0930.0690.066−0.1420.096−0.013
OHNAP20.945−0.002−0.1510.138−0.061−0.0930.0690.066−0.142.0096−0.012
OPP0.321−0.0920.1560.847−0.0750.0200.096−0.028−0.0340.0970.049
OHFLU−0.1960.2690.7480.0490.1990.0650.061−0.097−0.2110.011−0.080
OHPHE10.032−0.1530.578−0.6660.1810.1820.0510.0170.123−0.0470.004
OHPYR1−0.1640.0740.047−0.044−0.0970.929−0.0190.0250.079−0.118−0.018
OHCHR60.0990.2660.029−0.045−0.0250.034−0.0290.917−0.0180.037−0.011
OHBap0.0490.7970.0440.065−0.056−0.1400.1890.363−0.023−0.0780.011
NCQ−0.0120.7950.019−0.0450.2260.350−0.0490.0370.126−0.076−0.025
NAD1−0.203−0.1020.7390.055−0.208−0.034−0.0590.1460.333−0.212−0.049
FLO9−0.2440.1010.055−0.0830.0560.0890.115−0.0320.894−0.013−0.034
PHE9D−0.1210.5060.435−0.342−0.281−0.3210.1140.1330.100−0.089−0.007
BAO−0.2250.3720.383−0.061−0.3290.041−0.385−0.3160.268−0.2480.175
HBCDP−0.1170.0720.034−0.1220.926−0.079−0.045−0.0240.048−0.0590.008
NFL20.0950.1140.0360.044−0.055−0.0220.954−0.0260.1110.006−0.020
NNC50.156−0.127−0.1230.103−0.059−0.1210.0160.037−0.0200.9410.074
DFL27−0.018−0.005−0.0650.0360.003−0.018−0.029−0.014−0.0280.0630.990
Rotation method: Caesar normalization maximum variance method. a The rotation converged after 6 iterations.

References

  1. Alegbeleye, O.O.; Opeolu, B.O.; Jackson, V.A. Polycyclic Aromatic Hydrocarbons: A Critical Review of Environmental Occurrence and Bioremediation. Environ. Manag. 2017, 60, 758–783. [Google Scholar] [CrossRef] [PubMed]
  2. Reizer, E.; Viskolcz, B.; Fiser, B. Formation and growth mechanisms of polycyclic aromatic hydrocarbons: A mini-review. Chemosphere 2022, 291, 132793. [Google Scholar] [CrossRef] [PubMed]
  3. Barbosa, F.; Rocha, B.A.; Souza, M.C.O.; Bocato, M.Z.; Azevedo, L.F.; Adeyemi, J.A.; Santana, A.; Campiglia, A.D. Polycyclic aromatic hydrocarbons (PAHs): Updated aspects of their determination, kinetics in the human body, and toxicity. J. Toxicol. Environ. Health-Part B-Crit. Rev. 2023, 26, 28–65. [Google Scholar] [CrossRef]
  4. Ali, M.; Xu, D.; Yang, X.; Hu, J. Microplastics and PAHs mixed contamination: An in-depth review on the sources, co-occurrence, and fate in marine ecosystems. Water Res. 2024, 257, 121622. [Google Scholar] [CrossRef]
  5. Idowu, O.; Semple, K.T.; Ramadass, K.; O’Connor, W.; Hansbro, P.; Thavamani, P. Beyond the obvious: Environmental health implications of polar polycyclic aromatic hydrocarbons. Environ. Int. 2019, 123, 543–557. [Google Scholar] [CrossRef]
  6. Singh, L.; Varshney, J.G.; Agarwal, T. Polycyclic aromatic hydrocarbons’ formation and occurrence in processed food. Food Chem. 2016, 199, 768–781. [Google Scholar] [CrossRef] [PubMed]
  7. Wnorowski, A.; Harnish, D.; Jiang, Y.; Celo, V.; Dabek-Zlotorzynska, E.; Charland, J.-P. Assessment and Characterization of Alkylated PAHs in Selected Sites across Canada. Atmosphere 2022, 13, 1320. [Google Scholar] [CrossRef]
  8. Peng, B.; Dong, Q.; Li, F.; Wang, T.; Qiu, X.; Zhu, T. A Systematic Review of Polycyclic Aromatic Hydrocarbon Derivatives: Occurrences, Levels, Biotransformation, Exposure Biomarkers, and Toxicity. Environ. Sci. Technol. 2023, 57, 15314–15335. [Google Scholar] [CrossRef]
  9. Kovacic, P.; Somanathan, R. Nitroaromatic compounds: Environmental toxicity, carcinogenicity, mutagenicity, therapy and mechanism. J. Appl. Toxicol. 2014, 34, 810–824. [Google Scholar] [CrossRef]
  10. Zhang, Y.; Yang, B.; Gan, J.; Liu, C.; Shu, X.; Shu, J. Nitration of particle-associated PAHs and their derivatives (nitro-, oxy-, and hydroxy-PAHs) with NO3 radicals. Atmos. Environ. 2011, 45, 2515–2521. [Google Scholar] [CrossRef]
  11. Wu, G.; Qin, R.; Luo, W. Polycyclic aromatic hydrocarbons (PAHs) in the Bohai Sea: A review of their distribution, sources, and risks. Integr. Environ. Assess. Manag. 2022, 18, 1705–1721. [Google Scholar] [CrossRef] [PubMed]
  12. Samburova, V.; Zielinska, B.; Khlystov, A. Do 16 Polycyclic Aromatic Hydrocarbons Represent PAH Air Toxicity? Toxics 2017, 5, 17. [Google Scholar] [CrossRef]
  13. Wang, X.; Guo, S.; Huang, Q.; Zhu, Y.; Zhang, Y. A novel biomass pyrogenic index and its application coupled with black carbon for improving polycyclic aromatic hydrocarbon source identification. Environ. Monit. Assess. 2023, 195, 882. [Google Scholar] [CrossRef]
  14. Davis, E.; Walker, T.R.; Adams, M.; Willis, R.; Norris, G.A.; Henry, R.C. Source apportionment of polycyclic aromatic hydrocarbons (PAHs) in small craft harbor (SCH) surficial sediments in Nova Scotia, Canada. Sci. Total Environ. 2019, 691, 528–537. [Google Scholar] [CrossRef] [PubMed]
  15. Li, S.; Gao, X.; Zhu, S.; Liang, H. Polycyclic aromatic hydrocarbons (PAHs) in coal preparation plant products: A contributor to environmental pollution. Sci. Total Environ. 2024, 906, 167887. [Google Scholar] [CrossRef]
  16. O’Reilly, K.; Athanasiou, D.; Edwards, M. Evaluation of Generic PAH Profiles Commonly Used in Receptor Models: Implications for Source Control Policy. Environ. Forensics 2024, 25, 115–128. [Google Scholar] [CrossRef]
  17. Ya, M.; Wu, Y.; Wang, X.; Li, Y.; Su, G. The importance of compound-specific radiocarbon analysis in source identification of polycyclic aromatic hydrocarbons: A critical review. Crit. Rev. Environ. Sci. Technol. 2022, 52, 937–978. [Google Scholar] [CrossRef]
  18. Famiyeh, L.; Chen, K.; Xu, J.; Sun, Y.; Guo, Q.; Wang, C.; Lv, J.; Tang, Y.-T.; Yu, H.; Snape, C.; et al. A review on analysis methods, source identification, and cancer risk evaluation of atmospheric polycyclic aromatic hydrocarbons. Sci. Total Environ. 2021, 789, 147741. [Google Scholar] [CrossRef]
  19. Zhang, R.; Li, T.; Russell, J.; Zhang, F.; Xiao, X.; Cheng, Y.; Liu, Z.; Guan, M.; Han, Q. Source apportionment of polycyclic aromatic hydrocarbons in continental shelf of the East China Sea with dual compound-specific isotopes (δ13C and δ2H). Sci. Total Environ. 2020, 704, 135459. [Google Scholar] [CrossRef]
  20. Alam, M.S.; Ahad, J.M.E.; Cooke, C.A. Optimized sample cleanup for compound-specific isotope analysis of polycyclic aromatic hydrocarbons in complex environmental samples. Org. Geochem. 2025, 203, 104966. [Google Scholar] [CrossRef]
  21. Mali, M.; Ragone, R.; Dell’Anna, M.M.; Romanazzi, G.; Damiani, L.; Mastrorilli, P. Improved identification of pollution source attribution by using PAH ratios combined with multivariate statistics. Sci. Rep. 2022, 12, 19298. [Google Scholar] [CrossRef] [PubMed]
  22. Dai, C.; Han, Y.; Duan, Y.; Lai, X.; Fu, R.; Liu, S.; Leong, K.H.; Tu, Y.; Zhou, L. Review on the contamination and remediation of polycyclic aromatic hydrocarbons (PAHs) in coastal soil and sediments. Environ. Res. 2022, 205, 112423. [Google Scholar] [CrossRef] [PubMed]
  23. Semenov, M.; Marinaite, I.; Golobokova, L.; Khodzher, T. Factors affecting the source identification and distribution of polycyclic aromatic compounds in environmental compartments of the Lake Baikal area. Chem. Ecol. 2025, 41, 469–489. [Google Scholar] [CrossRef]
  24. Shen, Q.; Yu, H.; Cao, Y.; Guo, Z.; Hu, L.; Duan, L.; Sun, X.; Lin, T. Distribution and sources of polycyclic aromatic hydrocarbons in surface sediments of the East China marginal seas: Significance of the terrestrial input and shelf mud deposition. Mar. Pollut. Bull. 2024, 199, 115920. [Google Scholar] [CrossRef]
  25. Koudryashova, Y.; Chizhova, T.; Zadorozhny, P.; Ponomareva, A.; Eskova, A. Occurrence and Sources of Polycyclic Aromatic Hydrocarbons and Factors Influencing Their Accumulation in Surface Sediment of a Deep-Sea Depression, Namely, the Tatar Trough (Tatar Strait, the Sea of Japan). Water 2023, 15, 4151. [Google Scholar] [CrossRef]
  26. Gao, X.; Wang, J.; Luo, Z.; Li, S.; Liang, H. Profiles and source apportionment of PAHs in particulate matter from resuspended dust in coal mining areas: Implications for atmospheric pollution. Atmos. Pollut. Res. 2025, 16, 102434. [Google Scholar] [CrossRef]
  27. Wang, T.; Chen, S.; Liu, R.; Liu, D.; Fang, Y. Spatial distribution and source apportionment of surface soil’s polycyclic aromatic hydrocarbons in the Yangtze River Delta. Environ. Geochem. Health 2024, 46, 3. [Google Scholar] [CrossRef]
  28. Lin, J.; Tian, Y.; Yao, Q.; Shi, Y. Structural Characteristics of Intergovernmental Water Pollution Control Cooperation Networks Using Social Network Analysis and GIS in Yangtze River Delta Urban Agglomeration, China. Sustainability 2023, 15, 13655. [Google Scholar] [CrossRef]
  29. Zhou, H.; Wu, T.; Wang, Z.; Xu, X.; Ye, M.; Zhao, Z. Environmental characteristics of antibiotics and antibiotic-resistance genes in the Suzhou River of Shanghai, China. J. Environ. Chem. Eng. 2024, 12, 112049. [Google Scholar] [CrossRef]
  30. Wang, P.; Lu, X.; Jin, W.; Chen, M.; Ma, Y.; Xiong, P. Quantifying pollution contributions across a reticular river network: Insights from water quantity composition analysis. Ecol. Indic. 2024, 166, 112269. [Google Scholar] [CrossRef]
  31. Shuaibu, N.S.; Qin, C.; Chu, F.; Ismail, B.B.; Ibrahim, A.M.; Indabawa, M.G.; Abdalmohammed, S.A.A.; Zhao, G.; Wang, X. Traceability tagging of volatile organic compound sources and their contributions to ozone formation in Suzhou using vehicle-based portable single-photon ionization mass spectrometry. Environ. Sci. Eur. 2024, 36, 46. [Google Scholar] [CrossRef]
  32. Yuan, Z.; Wang, Q.; Wu, X.; He, B.; Liu, H.; Wang, S.; Jiang, Z. Polychlorinated Biphenyls (PCBs) in Urban Stream Sediments from Suzhou Industrial Park in China: Occurrence and Potential Risk. Pol. J. Environ. Stud. 2022, 31, 1485–1491. [Google Scholar] [CrossRef] [PubMed]
  33. Hou, L.; Qi, Q.; Zhou, Q.; Lv, J.; Zong, L.; Chen, Z.; Jiang, Y.; Yang, H.; Jia, Z.; Mei, S.; et al. Shallow Groundwater Quality Assessment and Pollution Source Apportionment: Case Study in Wujiang District, Suzhou City. Water 2024, 16, 3139. [Google Scholar] [CrossRef]
  34. Sun, W.; Zhao, Y.; Li, Z.; Yin, Y.; Cao, C. Carbon Emission Peak Paths Under Different Scenarios Based on the LEAP Model-A Case Study of Suzhou, China. Front. Environ. Sci. 2022, 10, 905471. [Google Scholar] [CrossRef]
  35. Guo, F.; Rao, Z.; Zhan, N.; Li, G.-h.; Guo, X.-c.; Liu, C.; Yang, Z.-p.; Song, S.-j.; Zuo, X.-l. An automatic and sensitive method for simultaneous determination of sixteen polycyclic aromatic hydrocarbons and four derivatives by online solid-phase extraction coupled with ultra-high performance liquid chromatography with online solvent filtration. Anal. Methods 2016, 8, 7721–7730. [Google Scholar] [CrossRef]
  36. Liao, J.; Wang, X.; Wang, H.; Hou, M.; Zhou, S.; Shi, Z.; Zhan, Y.; Ni, S.; Wang, R. Geographical impact on the distribution of polycyclic aromatic hydrocarbons (PAHs) in hilly terrain topsoil: A case study at Chongqing, SW, China. J. Hazard. Mater. 2025, 487, 137085. [Google Scholar] [CrossRef] [PubMed]
  37. Tuyet Nam Thi, N.; Jung, K.-S.; Son, J.M.; Kwon, H.-O.; Choi, S.-D. Seasonal variation, phase distribution, and source identification of atmospheric polycyclic aromatic hydrocarbons at a semi-rural site in Ulsan, South Korea. Environ. Pollut. 2018, 236, 529–539. [Google Scholar] [CrossRef]
  38. Wang, H.; Liu, D.; Lv, Y.; Wang, W.; Wu, Q.; Huang, L.; Zhu, L. Ecological and health risk assessments of polycyclic aromatic hydrocarbons (PAHs) in soils around a petroleum refining plant in China: A quantitative method based on the improved hybrid model. J. Hazard. Mater. 2024, 461, 132476. [Google Scholar] [CrossRef]
  39. Santos, E.; Souza, M.R.R.; Vilela Junior, A.R.; Soares, L.S.; Frena, M.; Alexandre, M.R. Polycyclic aromatic hydrocarbons (PAH) in superficial water from a tropical estuarine system: Distribution, seasonal variations, sources and ecological risk assessment. Mar. Pollut. Bull. 2018, 127, 352–358. [Google Scholar] [CrossRef]
  40. Shi, D.; Wu, F.; He, J.; Sun, Y.; Qin, N.; Sun, F.; Su, H.; Wang, B. Spatiotemporal distributions and ecological risk of polycyclic aromatic hydrocarbons in the surface seawater of Laizhou Bay, China. Environ. Sci. Pollut. Res. 2024, 31, 12131–12143. [Google Scholar] [CrossRef]
  41. Sankar, T.K.; Kumar, A.; Mahto, D.K.; Das, K.C.; Narayan, P.; Fukate, M.; Awachat, P.; Padghan, D.; Mohammad, F.; Al-Lohedan, H.A.A.; et al. The Health Risk and Source Assessment of Polycyclic Aromatic Hydrocarbons (PAHs) in the Soil of Industrial Cities in India. Toxics 2023, 11, 515. [Google Scholar] [CrossRef] [PubMed]
  42. Sun, K.; Song, Y.; He, F.; Jing, M.; Tang, J.; Liu, R. A review of human and animals exposure to polycyclic aromatic hydrocarbons: Health risk and adverse effects, photo-induced toxicity and regulating effect of microplastics. Sci. Total Environ. 2021, 773, 145403. [Google Scholar] [CrossRef] [PubMed]
  43. Luo, X.-j.; Chen, S.-j.; Yu, M.; Mai, B.-x.; Sheng, G.-y.; Fu, J.-m. Distribution and Partition of Polycyclic Aromatic Hydrocarbons in Surface Water from the Pearl River Estuary. Huanjing Kexue 2008, 29, 2385–2391. [Google Scholar] [CrossRef]
  44. Rong, Q.; Zhang, H.; Li, Y.; Yan, L.; Luo, J.; Jones, K.C. Occurrence and distribution of PAHs in the Yangtze River and urban river waters of Nanjing, China: Insights from in situ DGT measurements. Environ. Pollut. 2025, 371, 125921. [Google Scholar] [CrossRef] [PubMed]
  45. Liu, J.; Zhang, A.; Yang, Z.; Wei, C.; Yang, L.; Liu, Y. Distribution characteristics, source analysis and risk assessment of polycyclic aromatic hydrocarbons in sediments of Kuye River: A river in a typical energy and chemical industry zone. Environ. Geochem. Health 2024, 46, 89. [Google Scholar] [CrossRef]
  46. Ma, Y.; Chen, C.; Yang, C.; Yao, Q.; Zhou, X.; Huang, Q.; Chen, L. Unveiling polycyclic aromatic hydrocarbon pollution dynamics in river-lake sediments: Insights for energy transition. J. Environ. Manag. 2025, 378, 124737. [Google Scholar] [CrossRef] [PubMed]
  47. Kong, J.; Han, M.; Cao, X.; Cheng, X.; Yang, S.; Li, S.; Sun, C.; He, H. Sedimentary spatial variation, source identification and ecological risk assessment of parent, nitrated and oxygenated polycyclic aromatic hydrocarbons in a large shallow lake in China. Sci. Total Environ. 2023, 863, 160926. [Google Scholar] [CrossRef]
  48. Kong, J.; Yan, S.; Cao, X.; Zhang, Y.; Ran, C.; Chen, X.; Yang, S.; Li, S.; Zhang, L.; He, H. Quantitative source apportionment and health risk assessment for polycyclic aromatic hydrocarbon and their derivatives in indoor dust from housing and public buildings of a mega-city in China. J. Hazard. Mater. 2025, 486, 137057. [Google Scholar] [CrossRef]
  49. Liu, S.; Liu, X.; Liu, M.; Yang, B.; Cheng, L.; Li, Y.; Qadeer, A. Levels, sources and risk assessment of PAHs in multi-phases from urbanized river network system in Shanghai. Environ. Pollut. 2016, 219, 555–567. [Google Scholar] [CrossRef]
  50. Wang, L.; Yang, Z.; Niu, J.; Wang, J. Characterization, ecological risk assessment and source diagnostics of polycyclic aromatic hydrocarbons in water column of the Yellow River Delta, one of the most plenty biodiversity zones in the world. J. Hazard. Mater. 2009, 169, 460–465. [Google Scholar] [CrossRef]
  51. Zheng, B.; Wang, L.; Lei, K.; Nan, B. Distribution and ecological risk assessment of polycyclic aromatic hydrocarbons in water, suspended particulate matter and sediment from Daliao River estuary and the adjacent area, China. Chemosphere 2016, 149, 91–100. [Google Scholar] [CrossRef] [PubMed]
  52. Sarria-Villa, R.; Ocampo-Duque, W.; Paez, M.; Schuhmacher, M. Presence of PAHs in water and sediments of the Colombian Cauca River during heavy rain episodes, and implications for risk assessment. Sci. Total Environ. 2016, 540, 455–465. [Google Scholar] [CrossRef] [PubMed]
  53. Srogi, K. Monitoring of environmental exposure to polycyclic aromatic hydrocarbons: A review. Environ. Chem. Lett. 2007, 5, 169–195. [Google Scholar] [CrossRef] [PubMed]
  54. Keyte, I.J.; Harrison, R.M.; Lammel, G. Chemical reactivity and long-range transport potential of polycyclic aromatic hydrocarbons—A review. Chem. Soc. Rev. 2013, 42, 9333–9391. [Google Scholar] [CrossRef]
  55. Shen, H.; Huang, Y.; Wang, R.; Zhu, D.; Li, W.; Shen, G.; Wang, B.; Zhang, Y.; Chen, Y.; Lu, Y.; et al. Global Atmospheric Emissions of Polycyclic Aromatic Hydrocarbons from 1960 to 2008 and Future Predictions. Environ. Sci. Technol. 2013, 47, 6415–6424. [Google Scholar] [CrossRef]
  56. Kong, J.; Han, M.; Liu, Y.; He, H.; Gao, Z.; Xian, Q.; Yang, S.; Sun, C.; Lie, S.; Zhang, L. Analysis of trace-level nitrated polycyclic aromatic hydrocarbons in water samples by solid-phase microextraction with gas chromatography and mass spectrometry. J. Sep. Sci. 2018, 41, 2681–2687. [Google Scholar] [CrossRef]
  57. Qiao, M.; Qi, W.; Liu, H.; Qu, J. Oxygenated, nitrated, methyl and parent polycyclic aromatic hydrocarbons in rivers of Haihe River System, China: Occurrence, possible formation, and source and fate in a water-shortage area. Sci. Total Environ. 2014, 481, 178–185. [Google Scholar] [CrossRef]
  58. Li, S.; Xu, Z.; Wu, P.; Zhu, S.; Liang, H. Native polycyclic aromatic hydrocarbons (PAHs) in coal and its preparation products-A mixed source of environmental contamination. Environ. Pollut. 2024, 361, 124894. [Google Scholar] [CrossRef] [PubMed]
  59. Jia, T.; Guo, W.; Liu, W.; Xing, Y.; Lei, R.; Wu, X.; Sun, S. Spatial distribution of polycyclic aromatic hydrocarbons in the water-sediment system near chemical industry parks in the Yangtze River Delta, China. Sci. Total Environ. 2021, 754, 142176. [Google Scholar] [CrossRef]
  60. Wang, D.; Zhu, S.; Wang, L.; Zhen, Q.; Han, F.; Zhang, X. Distribution, Origins and Hazardous Effects of Polycyclic Aromatic Hydrocarbons in Topsoil Surrounding Oil Fields: A Case Study on the Loess Plateau, China. Int. J. Environ. Res. Public Health 2020, 17, 1390. [Google Scholar] [CrossRef]
  61. Drummond, J.D.; Bernal, S.; Meredith, W.; Schumer, R.; Marti, E. Stream Hydrology Controls the Longitudinal Bioreactive Footprint of Urban-Sourced Fine Particles. Environ. Sci. Technol. 2022, 56, 9083–9091. [Google Scholar] [CrossRef] [PubMed]
  62. Cao, W.; Yuan, J.; Geng, S.; Zou, J.; Dou, J.; Fan, F. Oxygenated and Nitrated Polycyclic Aromatic Hydrocarbons: Sources, Quantification, Incidence, Toxicity, and Fate in Soil-A Review Study. Processes 2023, 11, 52. [Google Scholar] [CrossRef]
  63. Zhuo, S.; Du, W.; Shen, G.; Li, B.; Liu, J.; Cheng, H.; Xing, B.; Tao, S. Estimating relative contributions of primary and secondary sources of ambient nitrated and oxygenated polycyclic aromatic hydrocarbons. Atmos. Environ. 2017, 159, 126–134. [Google Scholar] [CrossRef]
  64. Andrade, M.V.F.; Santos, F.R.; Oliveira, A.H.B.; Nascimento, R.F.; Cavalcante, R.M. Influence of sediment parameters on the distribution and fate of PAHs in an estuarine tropical region located in the Brazilian semi-arid (Jaguaribe River, Ceara coast). Mar. Pollut. Bull. 2019, 146, 703–710. [Google Scholar] [CrossRef]
  65. Pang, L.; Zhang, S.; Wang, L.; Yang, T.; Wang, S. Pollution characteristics and risk assessment of polycyclic aromatic hydrocarbons in the sediment of Wei River. Environ. Earth Sci. 2021, 80, 203. [Google Scholar] [CrossRef]
  66. Wu, Y.; Wang, X.; Ya, M.; Li, Y.; Hong, H. Seasonal variation and spatial transport of polycyclic aromatic hydrocarbons in water of the subtropical Jiulong River watershed and estuary, Southeast China. Chemosphere 2019, 234, 215–223. [Google Scholar] [CrossRef]
  67. Strotmann, U.; Durand, M.-J.; Thouand, G.; Eberlein, C.; Heipieper, H.J.; Gartiser, S.; Pagga, U. Microbiological toxicity tests using standardized ISO/OECD methods-current state and outlook. Appl. Microbiol. Biotechnol. 2024, 108, 454. [Google Scholar] [CrossRef]
  68. Lorenzi, D.; Entwistle, J.A.; Cave, M.; Dean, J.R. Determination of polycyclic aromatic hydrocarbons in urban street dust: Implications for human health. Chemosphere 2011, 83, 970–977. [Google Scholar] [CrossRef]
  69. Wang, Y.; Qi, A.; Wang, P.; Tuo, X.; Huang, Q.; Zhang, Y.; Xu, P.; Zhang, T.; Zhang, X.; Zhao, T.; et al. Temporal profiles, source analysis, and health risk assessments of parent polycyclic aromatic hydrocarbons (PPAHs) and their derivatives (NPAHs, OPAHs, ClPAHs, and BrPAHs) in PM2.5 and PM1.0 from the eastern coastal region of China: Urban coastal area versus coastal background area. Chemosphere 2022, 292, 133341. [Google Scholar] [CrossRef]
  70. Jedrychowski, W.A.; Perera, F.P.; Camann, D.; Spengler, J.; Butscher, M.; Mroz, E.; Majewska, R.; Flak, E.; Jacek, R.; Sowa, A. Prenatal exposure to polycyclic aromatic hydrocarbons and cognitive dysfunction in children. Environ. Sci. Pollut. Res. 2015, 22, 3631–3639. [Google Scholar] [CrossRef]
Figure 1. 67 sampling points located in Suzhou, China.
Toxics 13 00403 g001
Figure 2. Spatial distribution of ΣPAH and ΣSPAH concentrations.
Toxics 13 00403 g002
Figure 3. Compositions of the PAHs.
Toxics 13 00403 g003
Figure 4. Compositions of the SPAHs.
Toxics 13 00403 g004
Figure 5. PCA of PAHs (a) and SPAHs (b) in surface water. Solid arrows represent individual PAHs (SPAHs in panel (b)), and dots denote sampling sites.
Toxics 13 00403 g005
Figure 6. Diagnostic ratios for source identification of PAHs in the surface waters of the Suzhou.
Toxics 13 00403 g006
Figure 7. Ecological Risks of 8 PAHs, ΣPAHs, and ΣSPAHs.
Toxics 13 00403 g007
Figure 8. Health Risks of ΣPAHs and ΣSPAHs at 67 Sampling Sites.
Toxics 13 00403 g008
Table 1. Abbreviations for 15 PAHs and 19 SPAHs.
15 abbreviations for PAHs
NaphthaleneNAPChryseneCHRBenz[a]anthraceneBaA
AcenaphtheneACEFluorantheneFLUDibenz[a,h]anthraceneDBA
AnthraceneANTPyrenePYRBenzo[a]pyreneBaP
PhenanthrenePHEBenzo[k]fluorantheneBkFBenzo[g,h,i]peryleneBghiP
FluoreneFLBenzo[b]fluorantheneBbFIndeno[1,2,3-cd]pyreneINP
19 abbreviations for SPAHs
1-Naphthol1-OHNAP1-Hydroxypyrene1-OHPYR9-Fluorenone9-FLo
2-Naphthol2-OHNAP3-Hydroxybenzo(a)pyrene3-OHBaP9-PhenanthraldehydePHE-9-D
2-PhenylphenolOPP9-Hydroxybenzo(a)pyrene9-OHBaP6H-Benzo[c,d]pyren-6-one6H-BcdP-6-O
2-Hydroxyfluorene2-OHFLU1-Naphthaldehyde1-NAD5-Nitroacenaphthene5-NNC
3-Hydroxyfluorene3-OHFLUAcenaphthenequinoneNCQ2-Nitrofluorene2-NFL
1-Hydroxyphenanthrene1-OHPHEBenzanthroneBAO2,7-Dinitrofluorene2,7-DFL
6-Hydroxychrysene6-OHCHR
Table 2. Comparison of the concentrations of ΣPAHs in water with other areas.
Water (ng/L)LocationCountryNumber of PAHsSampling SitesRange, ΣPAHsMean, ∑PAHsReference
SuzhouChina15672.65–514.1648.05This study
Bohai SeaChina1620071.1–4260-[11]
Pearl River EstuaryChina51115.9–182.4-[43]
Rivers in ShanghaiChina164746.53–221.54112.92[49]
Yellow River DeltaChina154264.8–334.6121.3[50]
Daliao RiverChina162771.12–4255.43748.76[51]
CaucaColombia12852.1–12,888.22344.5[52]
Disclaimer/Publisher’s Note: The statements, opinions and data contained in all publications are solely those of the individual author(s) and contributor(s) and not of MDPI and/or the editor(s). MDPI and/or the editor(s) disclaim responsibility for any injury to people or property resulting from any ideas, methods, instructions or products referred to in the content.

