Article

Biogeochemical Mechanisms of HCO3–Ca Water and NO3 Pollution in a Typical Piedmont Agricultural Area: Insights from Nitrification and Carbonate Weathering

1
School of Energy and Environmental Engineering, Hebei University of Engineering, Handan 056038, China
2
Hebei Key Laboratory of Water Quality Engineering and Comprehensive Utilization of Water Resources, Hebei University of Architecture, Zhangjiakou 075000, China
3
Zhangcheng Ecological Environmental Protection and Restoration Technology Innovation Center, No. 3 Geological Brigade of Hebei Geology and Mineral Exploration Bureau, Zhangjiakou 075000, China
*
Author to whom correspondence should be addressed.
These authors contributed equally to this work.
Toxics 2025, 13(5), 394; https://doi.org/10.3390/toxics13050394
Submission received: 21 March 2025 / Revised: 8 May 2025 / Accepted: 9 May 2025 / Published: 15 May 2025

Abstract

Water hardening and NO3 pollution have affected water quality globally. These environmental problems threaten social sustainability and human health, especially in piedmont agricultural areas. The aim of this study is to determine the biogeochemical mechanisms of HCO3–Ca water and NO3 pollution in a typical piedmont agricultural area (Qingshui River, Zhangjiakou, China). Here, an extensive biogeochemical investigation was conducted in a typical piedmont agricultural area (Qingshui River, China) using multiple hydrochemical, isotopic (δ2H-H2O, δ18O-H2O and δ13C-DIC) and molecular-biological proxies in combination with a forward model. In the region upstream of the Qingshui River, riverine hydrochemistry was dominated by HCO3–Ca water, with only NO3 concentrations (3.08–52.8 mg/L) exceeding the acceptable limit (10 mg/L as N) for drinking water quality. The riverine hydrochemistry responsible for the formation of HCO3–Ca water was mainly driven by carbonate dissolution, with a contribution rate of 49.8 ± 3.96%. Riverine NO3 was mainly derived from agricultural NH4+ emissions rather than NO3 emissions, originating from sources such as manure, domestic sewage, soil nitrogen and NH4+-synthetic fertilizer. Under the rapid hydrodynamic conditions and aerobic water environment of the piedmont area, NH4+-containing pollutants were converted to HNO3 by nitrifying bacteria (e.g., Flavobacterium and Fluviimonas). Carbonate (especially calcite) was preferentially and rapidly dissolved by the produced HNO3, which was attributed to the strong acidity of HNO3. Therefore, higher levels of Ca2+, Mg2+, HCO3 and NO3 were simultaneously released into river water, causing riverine HCO3–Ca water and NO3 pollution in the A-RW. In contrast, these biogeochemical mechanisms did not occur significantly in the downstream region of the river due to the cement-hardened river channels and strict discharge management. These findings highlight the influence of agricultural HNO3 on HCO3–Ca water and NO3 pollution in the Qingshui River and further improve the understanding of riverine hydrochemical evolution and water pollution in piedmont agricultural areas.

Graphical Abstract

1. Introduction

River water is an essential fresh-water resource for agricultural irrigation, industrial production, potable water and social development, particularly in piedmont areas, where groundwater resources cannot easily be exploited due to the depth of the groundwater table. Water resource shortages and water pollution are increasingly affecting both urban and rural areas worldwide due to climate stress [1,2], population growth [3], pollution risks [4,5,6] and water conflicts [7,8]. Therefore, water quality problems, such as water hardening and NO3 pollution, continue to be a major focus in environmental toxicology research [9,10,11].
A high concentration of NO3 in water can result in eutrophication and toxic algal blooms that are harmful to aquatic organisms [12,13], and toxic hazards that are associated with birth defects, cancer and methemoglobinemia via drinking water with high NO3 levels have been documented [14,15,16]. Although excessively high concentrations of HCO3, Ca2+ and Mg2+ do not pose a direct toxic effect on humans, lithiasis induced by the crystallization of these ions not only causes great harm to the human body but may even lead to related tissue lesions.
High concentrations of HCO3, Ca2+ and Mg2+ contribute to water hardening, with these ions generally originating from carbonate weathering [17,18]. Mineral weathering involves a series of important and complex hydrogeochemical evolution processes due to the diversity of natural minerals and the mixed states of minerals weathering in natural aquatic systems [19,20]. In theory, carbonate dissolution releases HCO3, Ca2+ and Mg2+ into river water under unsaturated conditions [11,21]. Furthermore, carbon isotope (δ13C) of dissolved inorganic carbon (DIC) is a useful tool to carbonate weathering processes. More DIC from carbonate weathering (old carbon) induced by strong acid (e.g., HNO3) leads to a higher δ13C-DIC level, and more DIC from atmosphere/soil CO2 (new carbon) in natural carbonate weathering processes causes a lower δ13C-DIC level [22]. Therefore, the involvement of different acids (e.g., H2CO3 and HNO3) in carbonate dissolution can release specific δ13C-DIC signals into the water environment [19,23], providing a comprehensive understanding of carbonate weathering. However, previous studies on the formation mechanisms of HCO3–Ca water have mainly focused on karst areas, with few investigations conducted in piedmont agricultural areas.
River water suffers from NO3 pollution in intensive agriculture regions, and piedmont agricultural areas are no exception. Given the large amount of NH4+ contained in agricultural emissions [24,25], agricultural NH4+ generally undergoes complex biogeochemical processes before being converted to riverine NO3. Nitrification induced by nitrifying bacteria is an important process driving the nitrogen biogeochemical cycle, which can convert NH4+ in nature into NO3, especially in oxygen-rich water environments with better hydrodynamic conditions. Riverine NO3 produced from NH4+ requires 2/3O-H2O and 1/3O-O2 via microbial nitrification processes [26,27], which can result in a high level of δ18O-H2O enrichment in river water due to the isotopic kinetic fractionation effect. Furthermore, high NH4+ contents contribute to the metabolism of nitrifying bacteria, resulting in a negative correlation with NH4+ and a positive correlation with NO3 [27,28]. Hence, the combined use of hydrochemical, isotopic and molecular biological indicators can provide a reliable and comprehensive understanding of microbial nitrification processes. However, previous reports have focused mainly on assessing the fates and sources of NO3 [27,29,30]. It is of note that HNO3 can be rapidly produced from agricultural NH4+ by nitrifying bacteria in aerobic water environments [13], especially in piedmont agricultural areas [28]. The involvement of agricultural HNO3 in carbonate dissolution has been verified in karst areas in recent years [13,25,31,32], which has overturned the traditional understanding of karst hydrochemical evolution and provided novel insights into the characteristics of HCO3–Ca water and NO3 pollution in karst agricultural regions. However, further studies are required to comprehensively understand the effect of anthropogenic acids on mineral dissolution and riverine pollution in piedmont agricultural areas.
The Qingshui River is located in the transitional zone between the Inner Mongolia Plateau and the North China Plain. The river water composition is dominated by HCO3–Ca type controlled by the hydrogeochemical evolution in the piedmont area [24,33]. Due to long-term agricultural emissions, widespread diffuse NO3 pollution has been found in both the river water and groundwater of the Qingshui River basin [28,34]. Hence, the Qingshui River is a suitable field for determining the biogeochemical mechanisms of HCO3–Ca water and NO3 pollution. Previous reports have considered carbonate dissolution and agricultural nitrogen emissions as separate hydrochemical processes, which may reduce the accuracy of conclusions on the co-enrichment processes of riverine Ca2+, Mg2+, HCO3 and NO3. Furthermore, the influence of agricultural HNO3 on the co-formation mechanisms of riverine HCO3–Ca water and NO3 pollution remains largely unknown in piedmont agricultural areas. To better understand the biogeochemical mechanisms of riverine HCO3–Ca water and NO3 pollution, it is necessary to carry out an extensive biogeochemical investigation in the Qingshui River. Multiple hydrochemical, isotopic (δ2H-H2O, δ18O-H2O and δ13C-DIC) and molecular-biological proxies are used to determine the biogeochemical co-formation processes of HCO3–Ca water and NO3 pollution in piedmont agricultural areas.

2. Materials and Methods

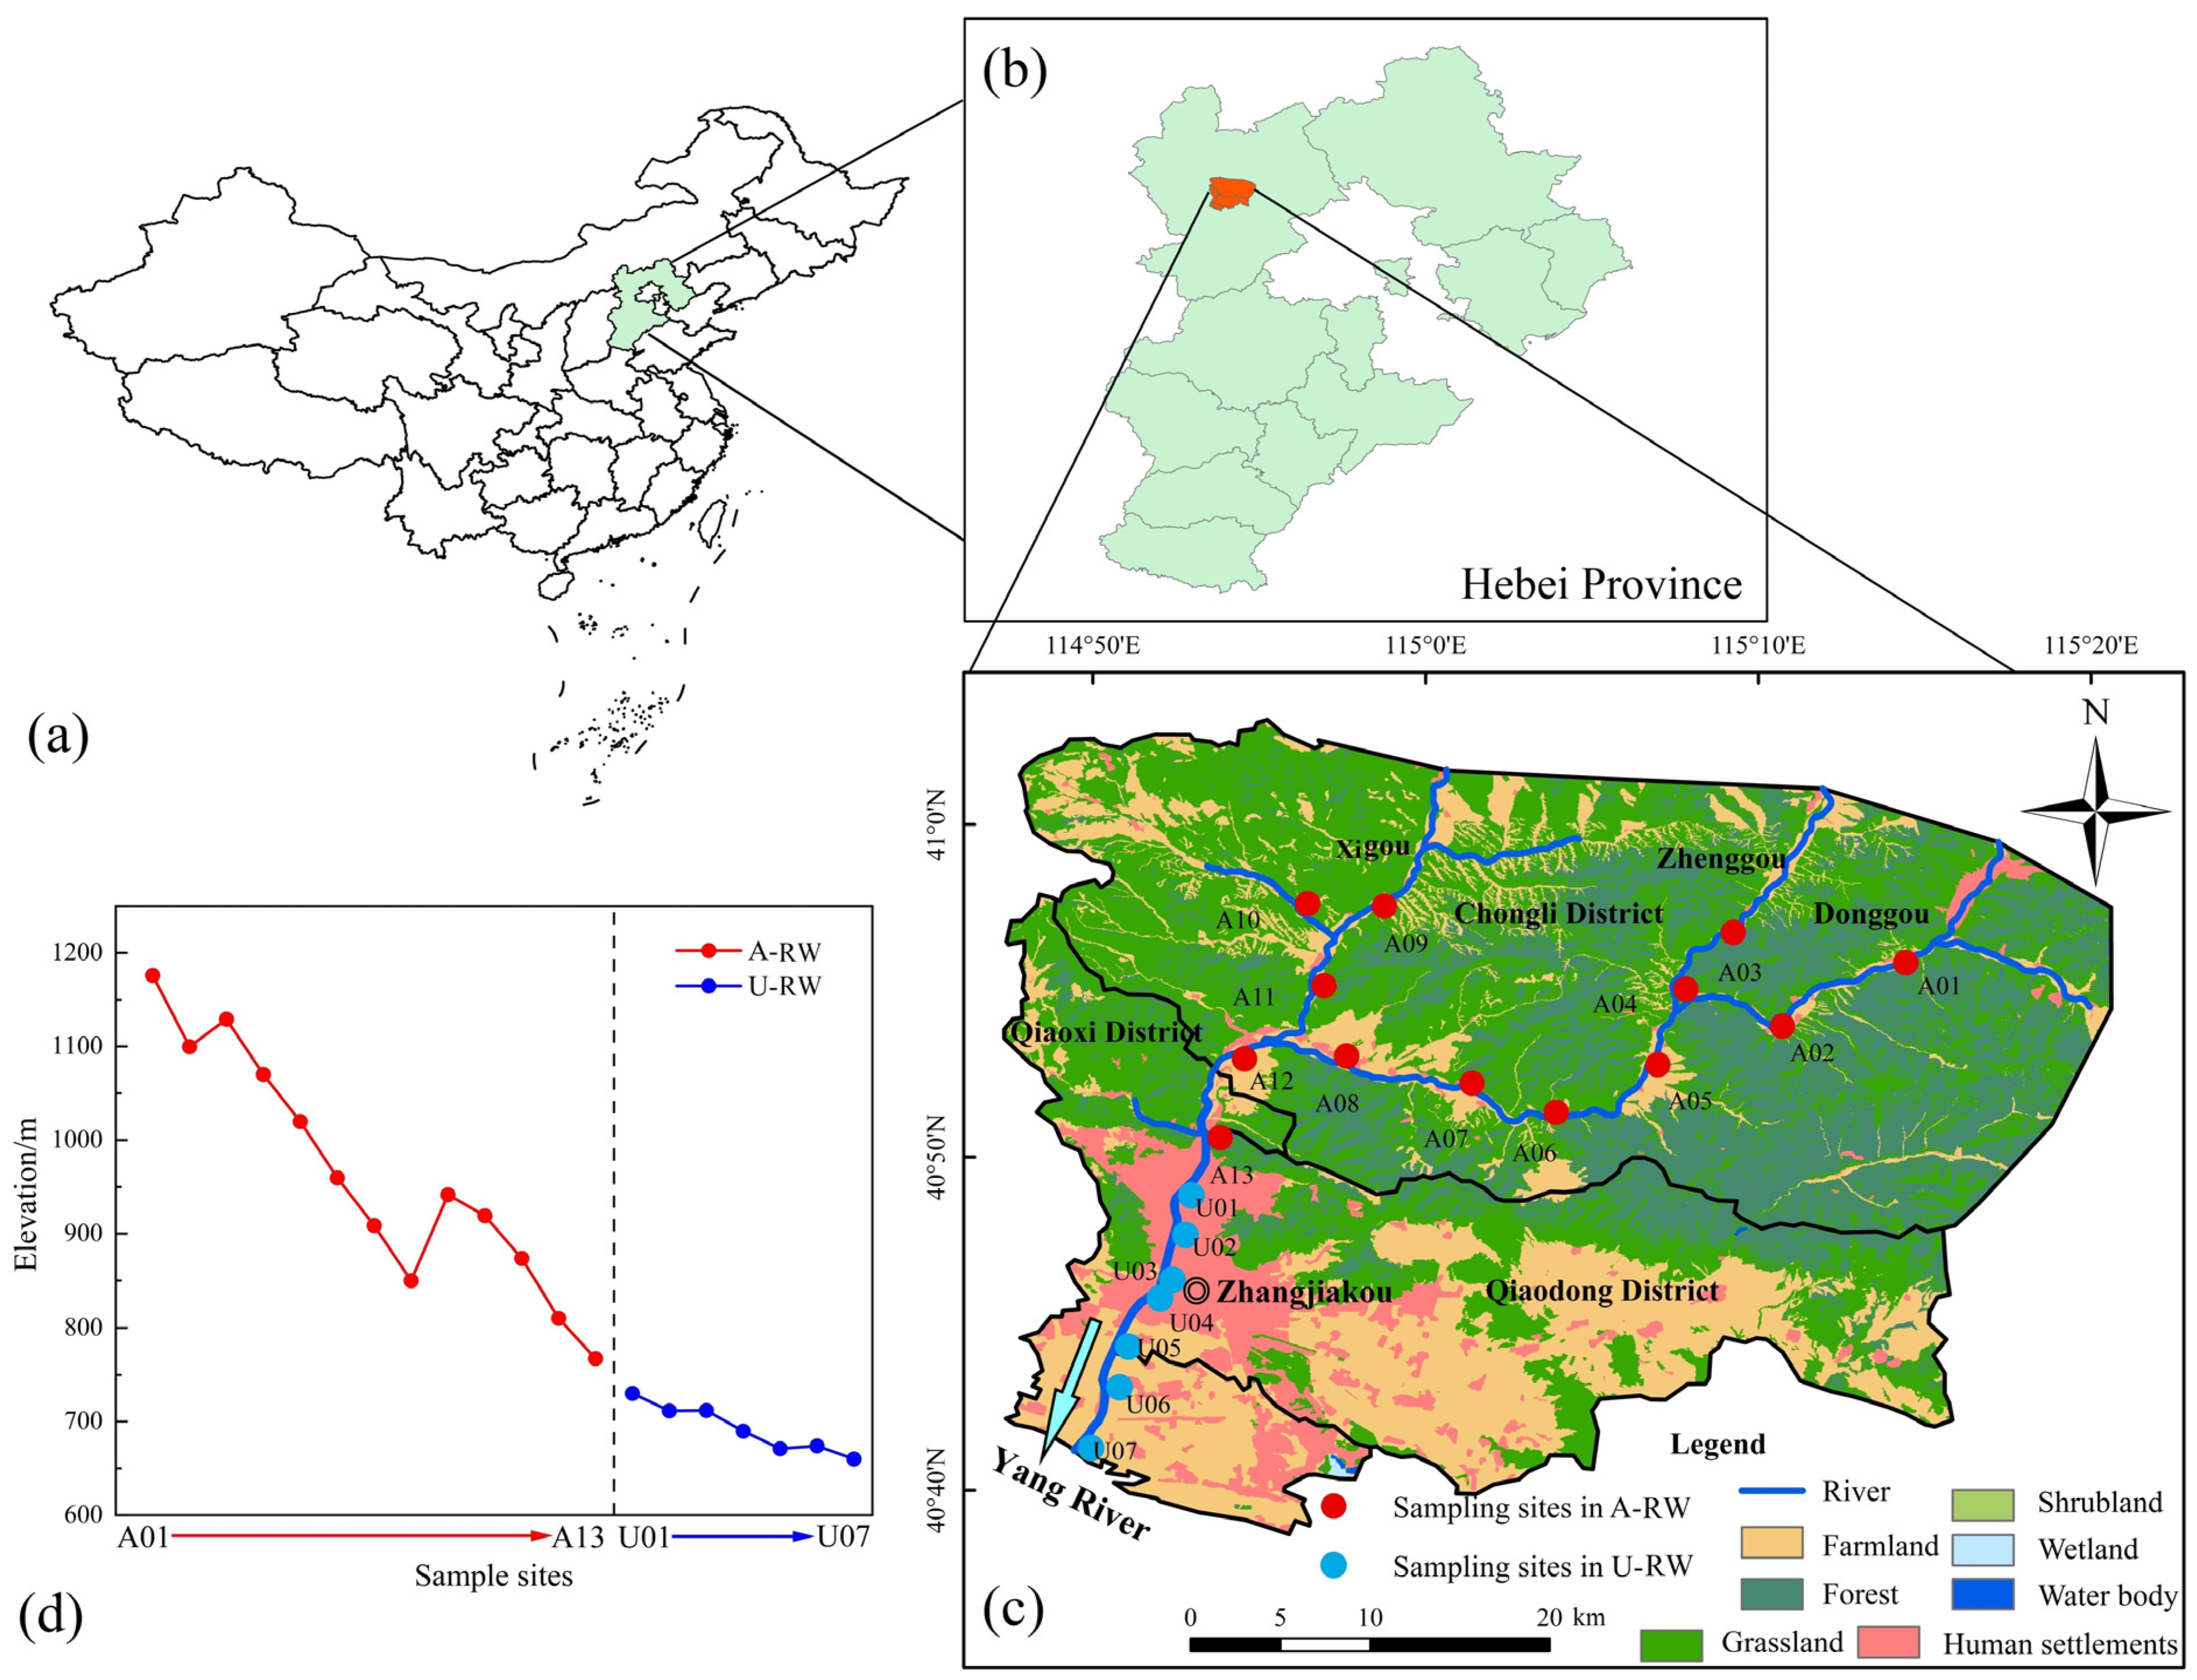
2.1. Site Information and Sampling Campaign

The investigated area (40°39′ N–41°03′ N and 114°47′ E–115°20′ E) is located in the northwestern region of Hebei Province, China (Figure 1a–c). The area is characterized by a temperate continental monsoon and an arid/semi-arid climate, with average annual temperatures of 19 °C in summer and −12 °C in winter. The average annual evaporation is higher than the level of average annual precipitation. The elevation of sampling sites in the piedmont area in the northern region of the Qingshui River ranged from 786 to 1181 m, while in the basin area in the southern region, they ranged from 660 to 757 m (Figure 1d). The thin layer of quaternary sediment has been shown to be widely distributed, with carbonate rocks mainly distributed in the Lower Paleozoic system of the Qingshui River basin [34]. Water–rock interactions are facilitated by the large hydraulic slope and thin soil layer in the piedmont agricultural area.
The Qingshui River starts with the south part of Huapiling and consists of three tributaries (i.e., Donggou, Zhenggou and Xigou) in the mountain area, and rainwater is the main source of replenishment for the Qingshui River. After flowing through the A13 site, constrained by the mountains on both the east and west sides, and with the hardening of the riverbed, the river forms a concentrated flow from north to south in the urban area; then, it flows through Zhangjiakou City and eventually into the Yang River [28]. Field investigations showed that farmlands were mainly distributed near the banks of the upstream region (i.e., piedmont agricultural area), accounting for ~25% of the total study area. Due to a lack of supervision and regulatory measures coupled with the weak anti-seepage capacity of the natural riverbed, the upstream river water is vulnerable to agricultural inputs (e.g., synthetic fertilizers, domestic sewage and manure). In the downstream region (i.e., basin urban area), despite intensive urban activities in the surrounding areas, the construction of anti-seepage channels combined with strict environmental supervision provide effective protection for the river water ecosystem from urban pollution inputs.
To ensure that all of the main land-use types and altitudes were considered, river water samples were collected during a single field campaign conducted from 20 to 22 September 2023. The 20 sampling sites were selected within the Qingshui River, covering the main agricultural reaches of the piedmont area (A-RW; A01–A13) and the main urban reaches of the basin area (U-RW; U01–U07) (Figure 1c). Although the temporal variability of water quality hardening and NO3 pollution in the Qingshui River was not determined by a single field campaign, this study selected a typical period, which was characterized by the intensive human activities and rapid hydrogeochemical evolution processes; the accumulated pollution and hydrogeochemical evolution outcomes from earlier periods can still be revealed by the obtained data in this manuscript. To avoid vertical effects and collect representative river water samples, samples were collected from the lower, middle and upper layers and then combined in equal proportions, with all samples collected in pre-cleaned, high-density polyethylene bottles. During field sampling, the pH, DO content, water temperature (T), ORP and TDS content were analyzed in situ using a portable multiparameter instrument (HQ40d, Hach, Loveland, CO, USA). Before processing, samples for the analysis of anions, cations and stable isotopes (δ2H-H2O, δ18O-H2O and δ13C-DIC) were stored at 4, 4 and −20 °C, respectively. After pretreatment, molecular-biological samples were immediately stored on dry ice and transported to Shanghai City (China).

2.2. Hydrochemical, Isotopic and Microbial Analysis

The analytical methods and testing institutions used for the analysis of Mg2+, Ca2+, Na+, K+, SO42−, Cl, HCO3, F, NO3, NO2, NH4+, δ2H-H2O, δ18O-H2O and δ13C-DIC in the samples are shown in Table S1. The analytical precision of hydrochemical parameters was guaranteed using the comparative analysis of standard materials, repeat sample analysis and reagent blanks. The charge balance error (CBE, %; Equation (1)) was employed to determine the reliability of the hydrochemical data, showing that the CBE values of all samples (0.64–3.16%) were below 5% and acceptable. International calibration standards and laboratory calibration standards were used to control the precision of δ2H, δ18O and δ13C analyses. The absolute errors of δ2H, δ18O and δ13C were better than ±1‰, ±0.2‰ and ±0.1‰, respectively. The obtained isotopic results were displayed as delta (δ, ‰; Equation (2)) and referred to the V-SMOW (δ2H-H2O and δ18O-H2O) and V-PDB (δ13C-DIC). The value of deuterium excess (d-excess) was calculated according to Equation (3) [35].
CBE = |   A n i o n s C a t i o n s   A n i o n s +   C a t i o n s | × 100 %
Δ = (Rsample/Rstandard – 1) × 1000‰
d-excess = δ2H – 8δ18O
The microbial composition of all samples was determined by, first, collecting material using a 0.22 μm sterile polycarbonate membrane and then using the FastDNA SPIN™ kit for soil (MP, Santa Ana, CA, USA) to extract DNA from the water samples. The obtained DNA concentrations were over 10 ng/μL, and the values of OD260/OD230 and OD260/OD280 were <2.0 and 1.8 ± 0.3, respectively, suggesting that the purification and concentrations of DNA were acceptable. Microbial communities were analyzed using high-throughput sequencing by Shanghai Majorbio Bio-pharm Technology Co., Ltd. (Shanghai, China). The 515F-907R primer pair was selected to amplify the V4–V5 hypervariable regions of bacterial 16S rRNA [36] using the GeneAmp 9700 thermocycler PCR system (ABI, Carlsbad, CA, USA). After collection and purification, the amplicons were pooled in equimolar and paired-end sequences (2 × 300) using the Illumina MiSeq platform (Illumina, San Diego, CA, USA).

2.3. Data Analysis

The FM (Figure 2) and SI were used together to evaluate the driving mechanisms of the riverine hydrochemistry. Bioinformatics assessment was used to elucidate nitrification function and its correlation with concentrations of Ca2+, Mg2+ and NO3. The details of the above analyses are shown in Text S1. The statistical analysis of the hydrochemical and isotopic data was performed using SPSS software (v. 22.0, IBM, Armonk, NY, USA). Considering that some parameters were not normally distributed, Spearman coefficient and one-way ANOVA were used to determine the significant correlations and differences, respectively, among the hydrogeochemical compositions of A-RW and U-RW, with correlations and differences considered significant at a threshold of p < 0.05. The visualizations of physico-chemical and isotopic parameters were performed using Origin software (v. 2022).

3. Results

3.1. Overall Riverine Hydrochemistry

The measured physico-chemical and isotopic parameters are summarized in Table 1. The river water was neutral to slightly alkaline, with average Ph values of 8.48 ± 0.28 and 8.86 ± 0.25 for the A-RW and U-RW, respectively, suggesting alkaline mineral weathering. TDS values of all samples (415 ± 58.9 mg/L for A-RW and 267 ± 22.8 mg/L for U-RW) were within the WHO acceptable limit for drinking water (ALDW, 1000 mg/L) [38]. Due to the construction of anti-seepage channels and the growth of aquatic plants in the U-RW, the slight anaerobic condition promotes the rapid reduction in NO3 in river water, and carbonate rocks no longer continue to dissolve. Hence, significantly higher concentrations of Ca2+ (90.9 ± 8.63 mg/L; p < 0.01), HCO3 (285 ± 63.6 mg/L; p < 0.01) and NO3 (35.6 ± 12.5 mg/L; p < 0.01) were detected in the A-RW compared to the U-RW, indicating that high TDS concentrations in the A-RW may be associated with carbonate dissolution and agricultural nitrogen emissions [30,31].
Piper diagrams are commonly used to evaluate the dominant ions in aquatic systems and hydrochemical facies [39]. HCO3 and Ca2+ were the dominant anions and cations, respectively, with the main hydrochemical facies of HCO3–Ca in the A-RW (Figure S1) indicating that calcite dissolution was the main contributor to dissolved loads in the piedmont agricultural area. This result is similar to the findings of previous investigations conducted in other piedmont areas (e.g., the Hohhot Basin [40] and Po Plain [41]). However, the U-RW samples were closer to the mixed-type zone, with significantly higher concentrations of Cl (43.2 ± 3.32 mg/L; p < 0.05). Riverine Cl concentrations in the U-RW were significantly correlated with Mg2+ (R = 0.86; p < 0.05) and showed a low level of correlation with Na+ (R = 0.68), HCO3 (R = 0.61) and NH4+ (R = 0.65; Figure S2), reflecting the combined effects of Cl-containing mineral dissolution and anthropogenic emissions.

3.2. Isotopic Parameters

The isotopic values of δ2H-H2O, δ18O-H2O and δ13C-DIC ranged from −80.0 to −43.0‰, −10.8 to −4.50‰ and −12.0 to −3.88‰, respectively (Table 1). The isotopic values of the A-RW samples (−73.2 ± 5.18‰ for δ2H-H2O, −9.09 ± 0.84‰ for δ18O-H2O and −10.6 ± 1.14‰ for δ13C-DIC) exhibited significantly lower levels (p < 0.05) compared to those of the U-RW samples (−53.3 ± 7.89‰ for δ2H-H2O, −6.66 ± 1.41‰ for δ18O-H2O and −5.01 ± 1.08‰ for δ13C-DIC).

3.3. Microbial Communities

As shown in Figure 3a, the dominant genera in the study area were unclassified f Comamonadaceae, Flavobacterium and norank f norank o Chloroplast, with high relative abundances of 13.6%, 13.4% and 5.71%, followed by Rhodobacter (3.62%) and Pseudarcicella (3.42%). Differences were observed in the microbial community structures along the river flow pathway, with 568 unique genera detected in the A-RW and 99 unique genera detected in the U-RW (Figure 3b), indicating that the A-RW contained a higher abundance of functional microbes and a more diverse microbial community. Furthermore, the microbes within the community were classified into two groups by hierarchical clustering based on Bray Curtis analysis (i.e., A-RW: A01-A13 and U-RW: U01-U07; Figure 3c), which were consistent with the different types of land-use and topography.

4. Discussion

4.1. Environmental Factors

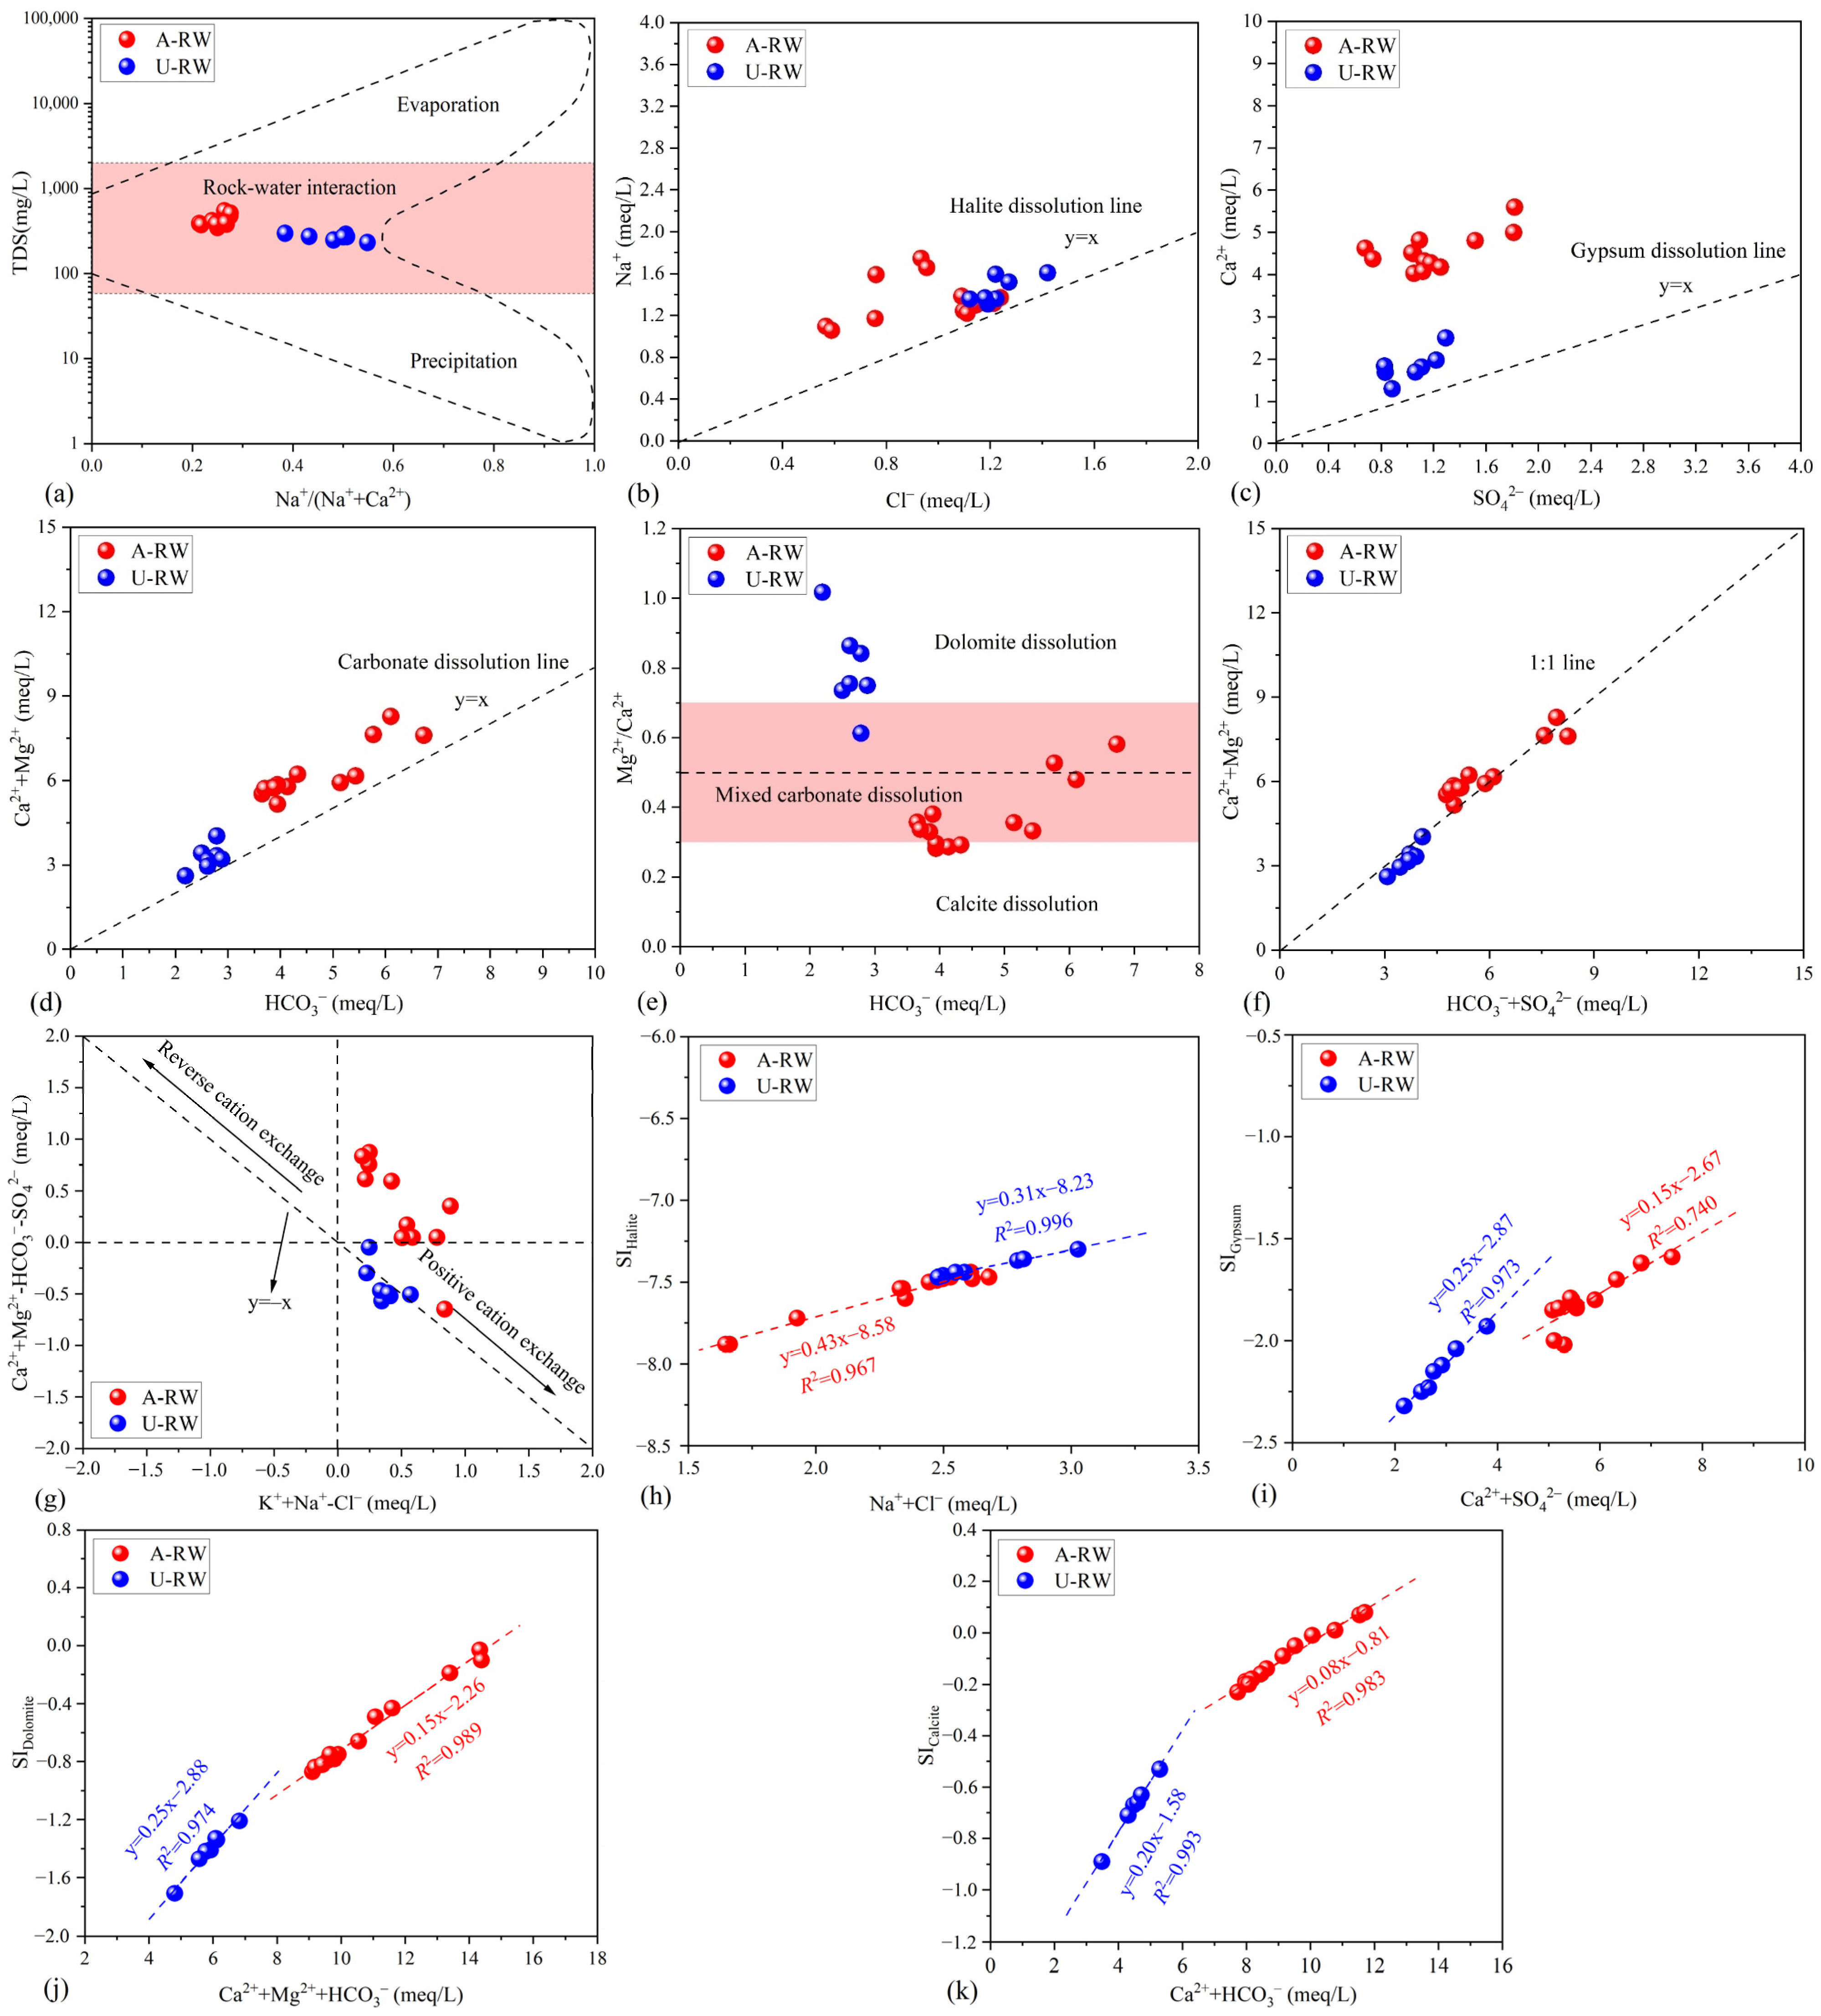
4.1.1. Evaporation and Recharge Processes

The contribution of evaporation to water hardening and hydrochemical evolution cannot be ignored in arid/semi-arid areas [19,42]. As shown in Figure S3a, the δ18O-H2O/δ2H-H2O values of all samples fell below the global meteoric water line (GMWL, δ2H-H2O = 8δ18O-H2O + 10) [43], indicating an overall trend of evaporation. The post-condensation evaporative effect is likely to occur in the A-RW due to the values of d-excess varying from 0 to 10‰ (Figure S3b) [44,45]. The arid/semi-arid climate coupled with the evaporation process facilitates the formation of alkaline water conditions [46], which may be associated with the dissolution of alkaline minerals (e.g., calcite and dolomite minerals). Based on the obtained observations, it may be proposed that the Qingshui River is recharged via at least three main processes: (1) run-off from mountainous areas, (2) atmospheric precipitation and (3) irrigation water and domestic sewage (Figure S3c), as determined by the wide range of Cl concentrations (corresponding to irrigation return flow and domestic sewage). Agricultural emissions contain large amounts of nitrogen-containing pollutants, especially NH4+ [9,32,45], which may be a crucial factor contributing to riverine NO3 pollution in the A-RW.

4.1.2. Topography and Channel Structure

The spatial variability of water facies is controlled, to some extent, by the topography and channel structure of the study area. The topographical features of the piedmont area have characteristics of a high topographic slope and fast water flow (Figure 1d), accelerating water–rock interaction processes and enhancing the solubility of minerals (e.g., halite and gypsum), causing them to preferentially dissolve into river water. Over a long-term period, water–rock interactions result in a gradual decrease in the availability of easily soluble minerals. The dissolution of the remaining less-soluble minerals (e.g., dolomite and calcite) is a primary factor controlling hydrochemical evolution, ultimately resulting in HCO3–Ca water in the A-RW (Figure S1) [33]. In contrast, the U-RW is characterized as a smaller hydraulic slope (Figure S1) that, coupled with the construction of rubber dams and anti-seepage channels, significantly slows down the river water flow and hinders natural carbonate dissolution. Hence, the water facies in the U-RW tends to be mixed-type (Figure S1). In addition, natural river beds have been shown to have a limited capacity to block agricultural pollutants due to the widespread and abundant occurrence of spaces among the loose deposits. Thus, river water ecosystems are particularly sensitive to agricultural nitrogen emissions [47]. In contrast, although the number of pollutants originating from urban activities are higher than those originating from agricultural activities, the construction of anti-seepage channels prevents urban sewage from flowing into the river to some extent, and with the inclusion of strict environmental supervision measures, river water quality is somewhat less affected by urban pollutants.

4.2. Mineral Dissolution Dominated by Carbonate Rocks

4.2.1. Hydrochemical Indicators

The Gibbs model is an effective tool for evaluating the main mechanism controlling world surface water chemistry (i.e., evaporation, rock–water interaction and precipitation) [48]. In this study, water hardening was found to be mainly controlled by rock–water interactions, while precipitation and evaporation were not the primary natural mechanisms driving riverine hydrochemistry (Figure 4a). The TDS values in the A-RW (415 ± 58.9 mg/L) were 1.55-fold higher than in the U-RW (267 ± 22.8 mg/L; Table 1), suggesting a stronger role of water–rock interactions in the A-RW. Furthermore, the neutral to slightly alkaline water environment coupled with HCO3–Ca water being the dominant hydrochemical type may be related to carbonate dissolution (Table 1 and Figure S1) [31]. The TDS content was positively correlated with Mg2+, Ca2+ and HCO3 in both the A-RW and U-RW (Figure S2), providing further support for carbonate dissolution being the main factor controlling hydrochemical evolution.
In theory, if riverine Cl and Na+ originate only from halite dissolution, the milliequivalents of Na+ and Cl in water should be equivalent (Equation (4)). When the ratio of Na+ and Cl is >1 or <1, the hydrochemistry may be influenced by silicate dissolution or cation exchange, respectively [49]. The results showed that the Na+:Cl ratios of all samples were along the upper left portion of the halite dissolution line (i.e., Na+:Cl = 1:1; Figure 4b), which may be attributed to the dissolution of silicate. Similarly, gypsum dissolution theoretically releases equal milliequivalents of Ca2+ and SO42− into river water (Equation (5)). The milliequivalent of Ca2+ exceeded that of SO42−, with all samples falling into the excess zone of Ca2+ (Figure 4c), indicating additional Ca-containing minerals were responsible for the Ca2+ excess (such as carbonate) [24,25]. Carbonate dissolution by H2CO3 results in a 1:1 ratio of Ca2+ + Mg2+ and HCO3 [18]. All samples were slightly above the carbonate dissolution line (Figure 4d) and were closer to the y = x line relative to gypsum dissolution (Figure 4c), implying that carbonate dissolution had an intensive influence on hydrochemical formation. Furthermore, the dissolution of dolomite and calcite releases Ca2+ and Mg2+ into river water with ratios of 1:1 and 1:0, respectively (Equations (6) and (7)) [50]. Most of the A-RW samples fell within the mixed-carbonate dissolution zone and tended towards the calcite dissolution zone (Figure 4e), indicating that water hardening was mainly controlled by calcite dissolution, with a small contribution from dolomite dissolution.
Positive cation exchange is beneficial, as it alleviates water hardening but increases water salinity [46]. When positive cation exchange occurs (i.e., the desorption of Na+ and K+ coupled with the adsorption of Mg2+ and Ca2+, Equation (8)) [19], the milliequivalent of HCO3 + SO42− is higher than that of Ca2+ + Mg2+ with an excess of anions [51]. In this study, cation exchange may provide a low contribution to riverine hydrochemistry, as almost all samples were close to the 1:1 line (Figure 4f). To further determine the importance and role of cation exchange, the plot of (Na+ + K+ − Cl) versus (Mg2+ + Ca2+ − HCO3 − SO42−) is shown in Figure 4g [52]. Most U-RW samples were located along the y = −x line, reflecting a trend of positive cation exchange. However, the A-RW samples were located far from the 0 end-member and did not fit on the y = −x line, suggesting that positive cation exchange had a weak capacity to alleviate water hardening. Similar results have been reported for other piedmont areas in the Tarim Basin, China [46], and the Himalayan foothills river basin, India [53].
NaCl→Cl + Na+
CaSO4⋅2H2O→SO42– + Ca2+ + 2H2O
2H2O + 2CO2 + CaMg(CO3)2→Mg2+ + Ca2+ + 4HCO3
H2O + CO2 + CaCO3→Ca2+ + 2HCO3
(Na+ + K+)mineral + (Mg2+ + Ca2+)water→(Mg2+ + Ca2+)mineral + (Na+ + K+)water

4.2.2. Saturation Index

Determination of the dissolution equilibrium of minerals is imperative to understanding water hardening and hydrogeochemical processes [20,54]. Positive linear regression relationships were determined between ion concentrations and the corresponding SI (Figure 4h–k). The values of SIHalite, SIGypsum, SIDolomite and SICalcite exhibited good linear relationships with the corresponding hydrochemical compositions (R2 = 0.740–0.996), indicating the main contribution of mineral dissolution to riverine hydrochemistry. The dissolution of halite (SIHalite = −7.58 ± 0.15 < 0), gypsum (SIGypsum = −1.81 ± 0.12 < 0) and dolomite (SIDolomite = −0.58 ± 0.30 < 0) in the A-RW was in an undersaturated state, while the SICalcite value (23.1%) in the A-RW samples exceeded 0 slightly, indicating an equilibrium/supersaturated state. In contrast, the SI values of all U-RW samples were <0, confirming the undersaturated state. The SIHalite values in the U-RW samples were higher than in the A-RW samples, and the higher contribution of halite dissolution may be associated with the positive cation exchange trend in the basin area [52]. The SICalcite, SIDolomite and SIGypsum values in the A-RW were higher than those in the U-RW, inferring that the combination of rapid hydrodynamic conditions with natural river beds can accelerate rock–water interaction processes. Furthermore, the equilibrium/supersaturated state of calcite dissolution may be responsible for HCO3–Ca water in the A-RW. In addition to natural carbonate dissolution, the contribution of agricultural acid (i.e., HNO3) to the equilibrium/supersaturated state of calcite dissolution may be significant due to the large agricultural NH4+ inputs in the study area [28], which can accelerate the rate of dissolution from carbonate rocks, thereby improving the equilibrium/supersaturated state of calcite dissolution.

4.2.3. Forward Model

According to the FM outputs (Figure 5a), the percentage contributions of natural hydrochemical sources were ranked as Car (49.8 ± 3.96%) > Hal (20.9 ± 5.94%) > Sil (13.9 ± 7.40%) > Gyp (11.9 ± 2.39%) > Pre (3.49 ± 0.43%) for the A-RW and Hal (37.3 ± 2.51%) > Car (28.5 ± 3.64%) > Gyp (14.7 ± 2.52%) > Sil (14.6 ± 4.94%) > Pre (4.89 ± 0.39%) for the A-RW. Thus, carbonate dissolution was determined to be the primary contributor to riverine hydrochemistry in the piedmont agricultural study area. Furthermore, HCO3–Ca water was mainly driven by calcite dissolution according to the stoichiometric relationship (Equations (6) and (7)) and equilibrium/supersaturated state of calcite dissolution (Figure 4e,k). The relative contribution of Pre was the lowest in all samples at 3.98 ± 0.80%, which is similar to the reported findings from other arid/semi-arid areas (e.g., Eastern Tibet; Yellow River Basin) [20,55]. The relative contribution of Sil and Gyp were similar in the samples from both the A-RW and U-RW, whereas those of Car and Hal exhibited significant differences (p < 0.05) in spatial distribution between the A-RW and U-RW (Figure 5b,c). For the basin area (U-RW), riverine hydrochemistry may be directly affected by the upstream residual river sediments and artificial channel materials. Furthermore, positive cation exchange promoted the adsorption of divalent ions (Ca2+ and Mg2+) and the desorption of monovalent ions (Na+ and K+) under alkaline conditions (Figure 4g) [46]. However, the absence of positive cation exchange coupled with carbonate dissolution providing the largest contribution resulted in the prevalence of HCO3–Ca water in the A-RW. Overall, the HCO3–Ca water was significantly controlled by carbonate (especially calcite) dissolution in the A-RW.

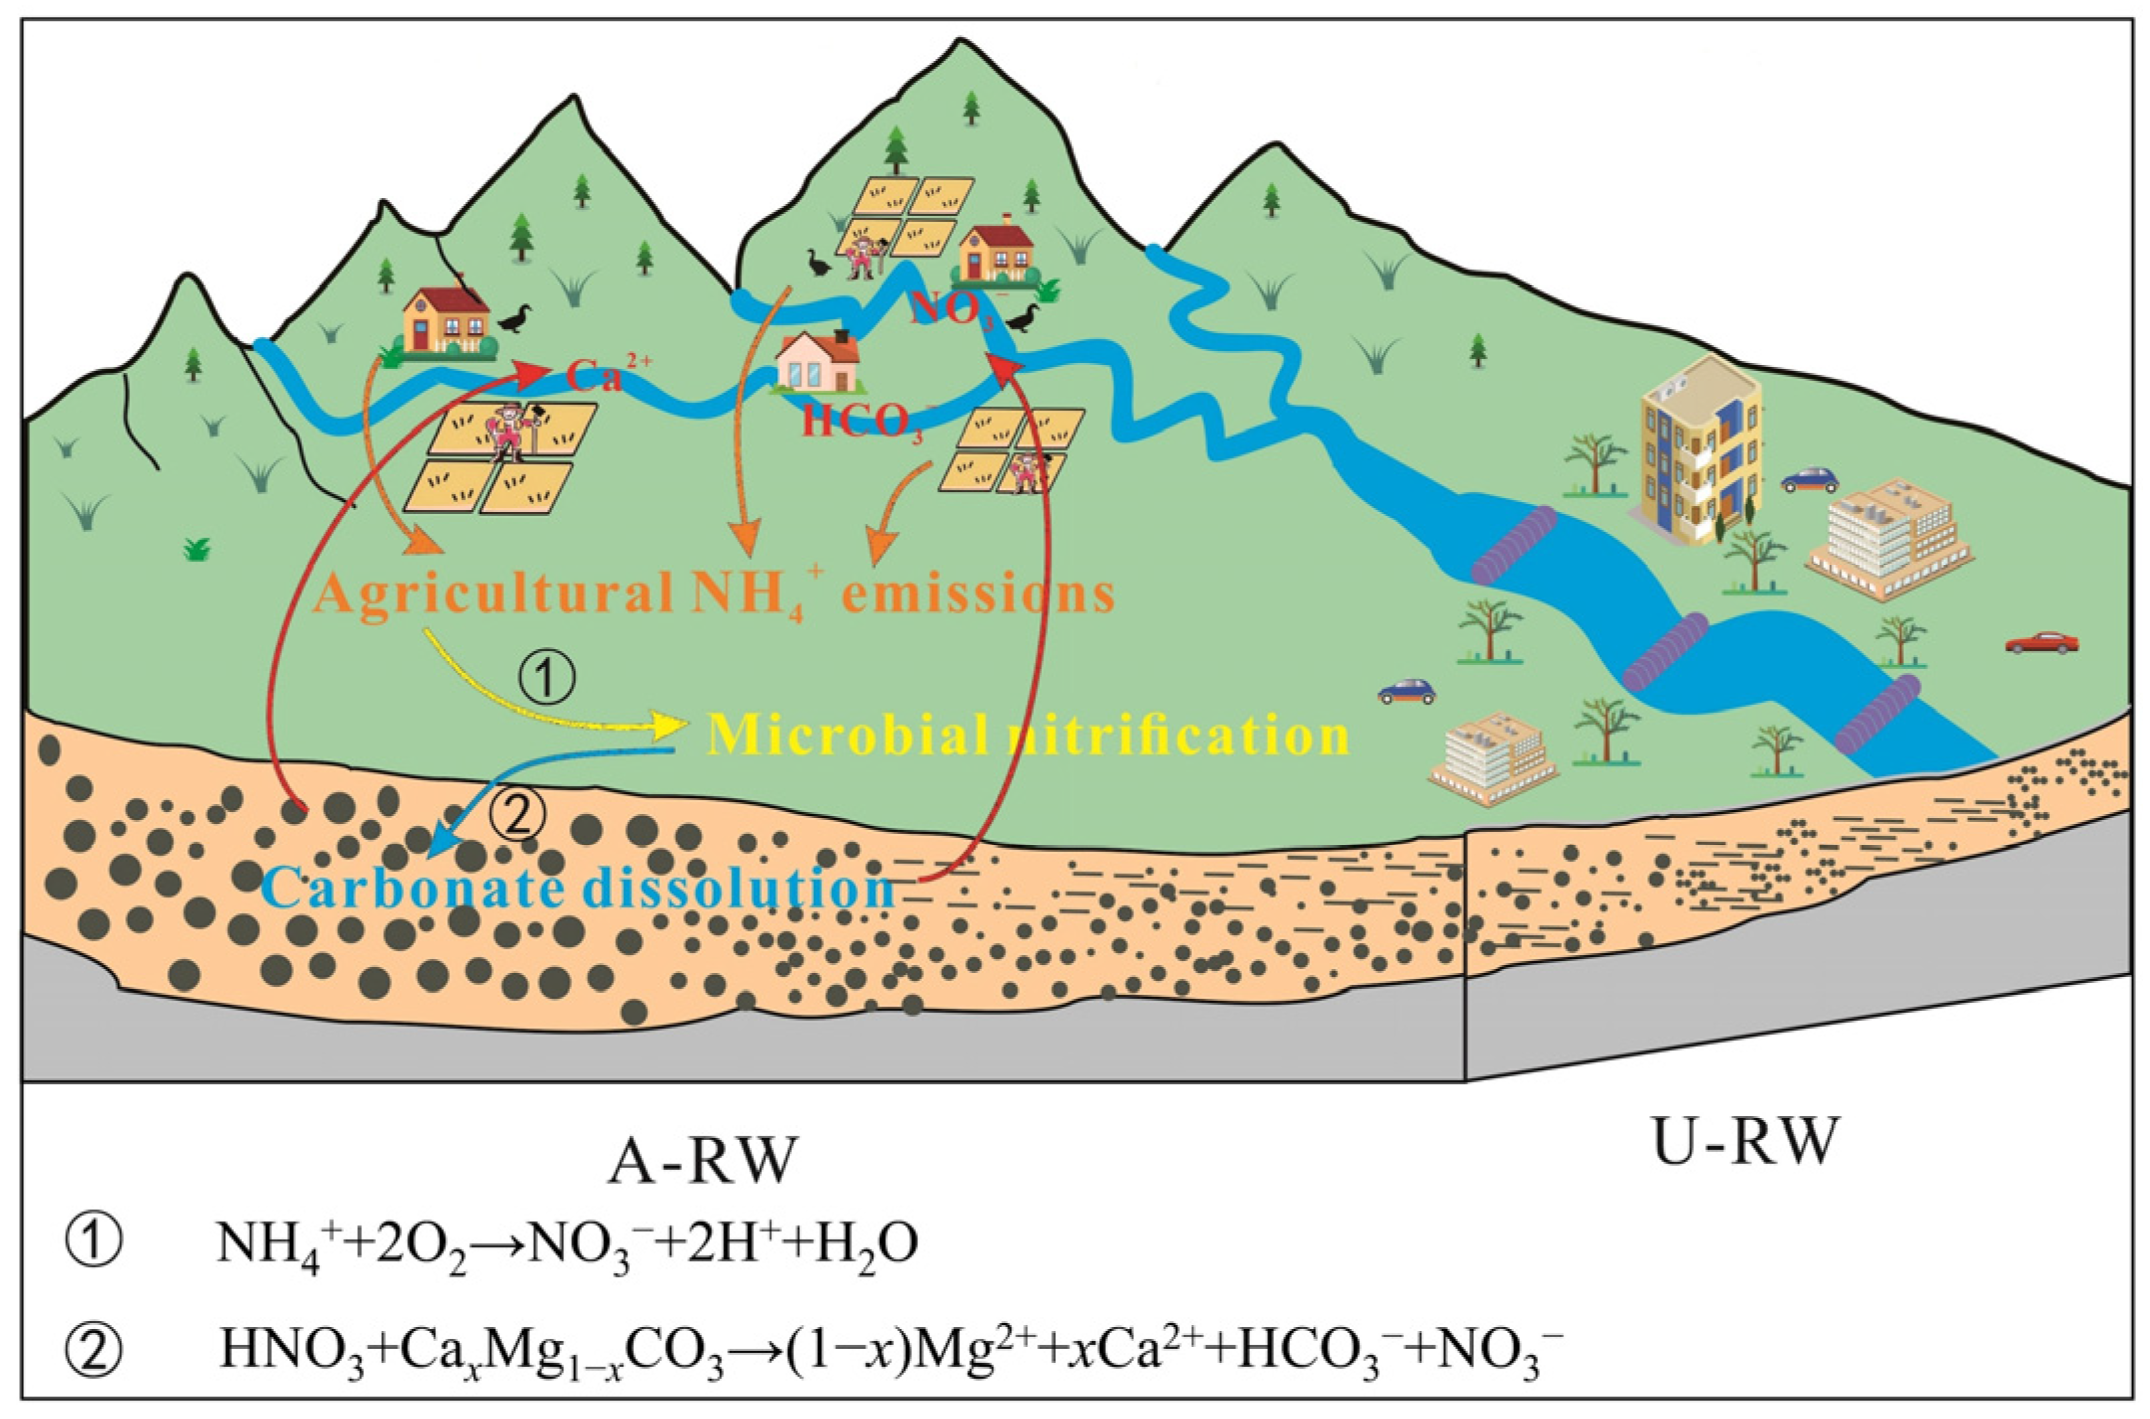
4.3. Agricultural NH4+ Emissions

Agricultural NH4+-containing pollutants (e.g., NH4HCO3, NH4Cl, manure, sewage and soil organic nitrogen) are the main sources of NO3 in both river water and groundwater around the world (Table 2). The results showed that NO3 concentrations in the A-RW, where agricultural activities were relatively intensive, were ~31.8-fold higher than those in the U-RW, reflecting the effects of agricultural NH4+ emissions on nitrogen pollution in the A-RW (Figure 6a). To further determine the influence of agricultural NH4+ emissions on riverine pollution, a scatter plot was prepared for Cl/Na+ versus NO3/Na+, as shown in Figure 6b. Most of the A-RW samples were located close to the y = x line in the end-member region for agricultural inputs, indicating that riverine hydrochemistry was controlled, to some extent, by agricultural inputs. However, the A-RW samples did not fall into any specific NO3 source zones (Figure 6c), indicating that this region was affected by a mixture of NH4+ inputs, including manure, sewage and soil nitrogen sources [45]. Based on a previously reported investigation in the A-RW in 2022, the total contribution rates of agricultural NH4+ emissions (i.e., manure, domestic sewage, soil nitrogen and NH4+-synthetic fertilizer) to the riverine NO3 content reached up to 99.4% [28], and no significant changes were observed in the agricultural production practices or local community characteristics between the two study periods in the A-RW. Indeed, although agricultural land (rural settlements and farmland) accounted for only ~16% of the upstream river area, farmlands and villages were located mainly on both sides of the riverbank. NH4+-synthetic fertilizers, such as NH4HCO3 and CO(NH2)2, are commonly applied excessively in order to promote the growth of greenhouse crops (such as strawberries, mushrooms, tomatoes and cucumbers). Manure is added widely to farmland crops to provide nutrients, with the domestic sewage and livestock waste used as manure not generally well treated due to the limitations of local sewage treatment systems. All of these aspects increase the volume of agricultural NH4+ emissions, causing further deterioration of river water quality. Therefore, it can be inferred that these agricultural NH4+ emissions are crucial contributors to riverine NO3 pollution within the study area.

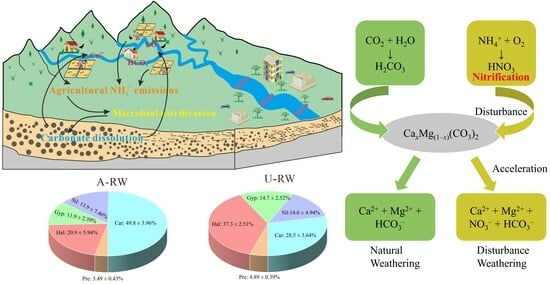
4.4. Biogeochemical Mechanisms

Microbial nitrification is a common pathway in natural oxygen-rich aquatic ecosystems [45,59], oxidizing NH4+ to NO3. The combination of rapid hydrodynamic conditions and aerobic water environments in piedmont areas facilitates microbial nitrification [22,60]. Notably, HNO3 (i.e., H++NO3; Equation (9)) can be produced by nitrifying bacteria from the oxidized form of agricultural NH4+ [32]. In the A-RW, high NO3 concentrations (3.08–52.8 mg/L) accompanied by low concentrations of NO2 (below the detection limit; BDL) and NH4+ (BDL-0.16 mg/L; Table 1) may be attributed to the occurrence of microbial nitrification [13]. Furthermore, a combination of high DO levels (10.1 ± 1.45 mg/L) with neutral to slightly alkaline pH conditions (8.48 ± 0.28) is suitable for the metabolism of nitrifying bacteria [45]. When NH4+ is oxidized to HNO3 through nitrification processes, 2/3 O-NO3 is theoretically derived from ambient water, with the remaining O-NO3 derived from atmospheric oxygen (Equation (10)) [26,27]. Based on the results of isotopic kinetic fractionation, the nitrification processes preferentially utilize lighter isotopes (δ16O-H2O), making δ18O-H2O more likely to accumulate in the river water. The obtained δ18O-H2O values (−9.09 ± 0.84‰; Table 1) in the A-RW were close to the reference values reported for the effect of nitrification processes (−10.0 ± 0.83‰) [28], indicating that microbial nitrification plays a major role in the A-RW, while the U-RW values (−6.66 ± 1.41‰) differed from the reference values, indicating that microbial nitrification played a smaller role.
According to the RDA outputs (Figure S4), riverine NO3 was a key hydrochemical factor driving microbial community evolution in the A-RW, although it was not a main factor in the U-RW (Figure 7a,b). In the A-RW, riverine NO3 was positively correlated with Fluviimonas (p < 0.05), norank f Saprospiraceae (p < 0.05), Flavobacterium, Rhodobacter and Arenimonas (Figure 7a), which may be associated with nitrification processes. The relative abundance of the dominant genus Flavobacterium (Figure 3a) was 3.96-fold higher in the A-RW (18.1 ± 8.09%) than in the U-RW (4.57 ± 1.93%), while the total relative abundance of all genera associated with riverine NO3 was close to 21% in the A-RW. This indicates that microbial nitrification had a major advantage during ammonia oxidation processes in the piedmont agricultural area. The observed frequencies of functional microbial communities provided further support for HNO3 being dominantly derived from ammonia oxidation via nitrification (Figure 7c). The frequencies of chemoheterotrophs and aerobic chemoheterotrophs in the A-RW (12,149 ± 3044 and 13,283 ± 3242, respectively) were significantly higher than those in the U-RW (8582 ± 1820 and 6998 ± 770, respectively; p < 0.01). Although the chemoautotrophic nitrifying bacteria have faster NH4+ oxidation rates, chemoheterotrophic nitrifying bacteria are more tolerant to complex aquatic ecosystems, which may contribute more to HNO3 in the A-RW (Figure 7c). Additionally, microbial communities may be co-controlled by Ca2+, Mg2+, HCO3 and SO42− in the A-RW, to a certain extent (Figure S4). Only unclassified k norank d Bacteria (<0.05%) and Rhodoluna (1.32 ± 1.71%) were positively correlated with Ca2+, Mg2+, HCO3 and SO42− (Figure 7a), possibly due to the production of H2SO4 by sulfur oxidation, which is subsequently involved in carbonate dissolution. However, Rhodoluna had a relatively high abundance in sites A11 and A12 (4.05 and 5.41%, respectively), corresponding to higher SO42− concentrations (87.2 and 86.9 mg/L, respectively), while it contributed less to SO42− concentrations in other sampling sites. Overall, microbial nitrification processes occurred widely in the A-RW of the Qingshui River, further increasing the amounts of H+ and NO3 ions originating from the oxidization of agricultural NH4+-containing pollutants.
In natural environments, carbonate is mainly dissolved by H2CO3 (Equations (6) and (7)). In this process, half of the dissolved inorganic carbon (DIC) originates from carbonate rocks, while the remaining DIC originates from atmospheric CO2 [22,24]. However, the involvement of HNO3 in carbonate dissolution does not require atmospheric CO2 (Equation (11)), causing some significant differences in the carbon isotopic fingerprints and hydrochemical signatures of samples [61]. The δ13C-DIC values from CO2 in karst regions have been reported to range from −20.4 to −9.3‰ after isotopic fractionation, while carbonate exhibits enriched levels of δ13C-DIC (~0‰) [31,62]. In the present study, the lowest δ13C-DIC value was −12‰, and the corresponding equivalent (Ca2+ + Mg2+)/HCO3 ratio was 1.13, which is close to the theoretical natural carbonate dissolution value ((Ca2+ + Mg2+)/HCO3 = 1; Figure S5a). If carbonate is only dissolved by strong acids, the δ13C-DIC value would theoretically be equal to 0‰, and the equivalent ratio of (Ca2+ + Mg2+)/HCO3 would be 2 [31]. In the present study, all samples were distributed between the end-members of carbonate dissolution by H2CO3, HNO3 and H2SO4, indicating the involvement of anthropogenic acids in natural carbonate dissolution. The diagram of SO42−/HCO3 vs. (Ca2+ + Mg2+)/HCO3 provides further understanding of the mechanism of carbonate rock dissolution (Figure S5b). All samples tended to be located towards the end-members of carbonate dissolution by H2CO3 and HNO3, whereas most of the samples deviated from the end-member of carbonate dissolution by H2SO4, indicating that carbonate was mainly dissolved by H2CO3, followed by HNO3, while H2SO4 contributed less to carbonate dissolution (especially calcite). These results are consistent with the results of microbial analysis (Figure 7). Overall, in the study area, a large amount of agricultural NH4+ emissions were converted into HNO3 via microbial nitrification, which accelerated carbonate dissolution and promoted the rapid release of Ca2+, Mg2+, HCO3 and NO3 into river water in the A-RW area (Figure 8). These biogeochemical processes altered the natural mechanisms of riverine hydrochemistry, aggravating water hardening and NO3 pollution in river water in the piedmont agricultural area. Therefore, the biogeochemical mechanisms should be considered in future hydrochemical investigations and water environment management in other piedmont agricultural areas around the world.
2O2 + NH4+→H2O + NO3 + 2H+
δ18O-NO3 = 2/3δ18O-H2O + 1/3δ18O-O2
HNO3 + CaxMg1−xCO3→(1 − x)Mg2+ + xCa2+ + HCO3 + NO3

5. Conclusions

This study reports the combined use of multiple hydrochemical, isotopic and molecular-biological proxies along with the FM and SI to establish the co-driving mechanisms of riverine HCO3–Ca water and NO3 pollution in a typical piedmont agricultural area. Riverine HCO3–Ca water and NO3 pollution (up to 52.8 mg/L) were widely detected in the A-RW. The primary contributor of mineral dissolution to riverine hydrochemistry was Car (49.8 ± 3.96%), followed by Hal (20.9 ± 5.94%), Sil (13.9 ± 7.40%) and Gyp (11.9 ± 2.39%), whereas Pre contributed less to riverine hydrochemistry in the A-RW (3.49 ± 0.43%). Water hardening was mainly driven by carbonate dissolution, particularly calcite. Riverine NO3 was derived from agricultural NH4+ emissions (e.g., manure, domestic sewage, soil nitrogen and NH4+-synthetic fertilizers). The rapid hydrodynamic conditions and aerobic water environment in the piedmont area were conducive to the metabolism of nitrifying bacteria, which promoted the production of HNO3 from agricultural NH4+ via microbial nitrification (e.g., Flavobacterium and Fluviimonas). The produced HNO3 was preferentially involved in carbonate dissolution, which was attributed to the strong acidity of HNO3, resulting in the release of Ca2+, Mg2+, HCO3 and NO3 into river water. These biogeochemical mechanisms could be responsible for riverine HCO3–Ca and NO3 pollution in the piedmont agricultural area. However, the co-enrichment mechanisms of Ca2+, Mg2+, HCO3 and NO3 were not prevalent in the U-RW due to the limited role of agricultural NH4+ emissions and insufficient carbonate dissolution in this region. Therefore, the implementation of strict control measures for agricultural NH4+ emissions is a fundamental aspect of the alleviation of water hardening and NO3 pollution, such as the use of slow-release NH4+-synthetic fertilizers, the application of nitrogen fertilizer synergists, the precise fertilization of root soils and the establishment of scientific fertilization plans based on the growth characteristics of plants. This study highlights the significant influences of carbonate dissolution and agricultural NH4+ emissions on riverine water quality and provides an example of the biogeochemical mechanisms driving riverine HCO3–Ca water and NO3 pollution, which may be relevant for other piedmont agricultural areas.

Supplementary Materials

The following supporting information can be downloaded at: https://www.mdpi.com/article/10.3390/toxics13050394/s1, Table S1: Analytical methods of chemical parameters and stable isotopes in river water samples in the study area; Table S2: Statistical summary of descriptive statistics for hydrochemical and isotopic data in the upstream (A-RW) and downstream (U-RW) regions of the Qingshui River. Note: d-excess = δ2H–8δ18O [35]; Max.: maximum; Min.: minimum; SD: standard deviation; CV: coefficient of variation; BDL: below detection limit;/: no calculated value; Figure S1: Piper diagram showing the hydrochemical facies, dominant cations and dominant anions of river water in the upstream (A-RW) and downstream (U-RW) regions of the Qingshui River; Figure S2: Correlation analysis of physico-chemical data in the upstream (A-RW; upper triangle) and the downstream (U-RW; lower triangle) regions of the Qingshui River; Figure S3: Diagrams of (a) δ18O-H2O versus δ2H-H2O, (b) TDS versus d-excess and (c) δ18O-H2O versus Cl in the upstream (A-RW) and the downstream (U-RW) of the Qingshui River. Note: the global meteoric water line (GMWL) referred to [43]; Figure S4: RDA analysis illustrating the effects of physico-chemical factors on microbial community structure; Figure S5: Involvement of strong acids in carbonate dissolution interpreted by scatter plot of (a) (Ca2+ + Mg2+)/HCO3 versus δ13C-DIC (adapted from [31]) and (b) SO42−/HCO3 versus (Ca2+ + Mg2+)/HCO3 (adapted from [23]) in the upstream (A-RW) and downstream (U-RW) regions of the Qingshui River; Text S1: Analysis on the joint use of FM and SI to evaluate the driving mechanism of river hydrochemistry [63,64].

Author Contributions

Methodology, B.X. and G.H.; Software, W.L.; Formal analysis, L.X.; Investigation, L.X., W.L., H.L. and G.Y.; Data curation, L.X. and B.X.; Writing—original draft, L.X.; Writing—review and editing, G.Y. and G.H.; Supervision, G.Y.; Project administration, L.X. and G.Y. All authors have read and agreed to the published version of the manuscript.

Funding

This study was supported by the Central Guidance Fund for Local Science and Technology Development (246Z3612G), Natural Science Foundation of Hebei Province (D2022503001), National Key Research and Development Project of China (2021YFC1910600) and Funded by Science and Technology Project of Hebei Education Department (QN2025246).

Institutional Review Board Statement

Not applicable.

Informed Consent Statement

Not applicable.

Data Availability Statement

The data that support the findings of this study are available from the corresponding author upon reasonable request.

Conflicts of Interest

The authors declare no conflict of interest.

References

  1. Stringer, L.C.; Mirzabaev, A.; Benjaminsen, T.A.; Harris, R.M.B.; Jafari, M.; Lissner, T.K.; Stevens, N.; Tirado-von Der Pahlen, C. Climate change impacts on water security in global drylands. One Earth 2021, 4, 851–864. [Google Scholar] [CrossRef]
  2. Scanlon, B.R.; Fakhreddine, S.; Rateb, A.; de Graaf, I.; Famiglietti, J.; Gleeson, T.; Grafton, R.Q.; Jobbagy, E.; Kebede, S.; Kolusu, S.R.; et al. Global water resources and the role of groundwater in a resilient water future. Nat. Rev. Earth Environ. 2023, 4, 87–101. [Google Scholar] [CrossRef]
  3. Ren, X.; Li, P.; He, X.; Zhang, Q. Tracing the sources and evaporation fate of surface water and groundwater using stable isotopes of hydrogen and oxygen. Sci. Total Environ. 2024, 931, 172708. [Google Scholar] [CrossRef] [PubMed]
  4. Xiao, J.; Wang, L.; Deng, L.; Jin, Z. Characteristics, sources, water quality and health risk assessment of trace elements in river water and well water in the Chinese Loess Plateau. Sci. Total Environ. 2019, 650, 2004–2012. [Google Scholar] [CrossRef]
  5. Li, X.; Xiao, J.; Chai, N.; Jin, Z. Controlling mechanism and water quality assessment of arsenic in China’s Yellow River Basin. J. Clean. Prod. 2023, 418, 137953. [Google Scholar] [CrossRef]
  6. Gençer, E.; Başaran, C. Water quality assessment and pollution of Akarçay River, Türkiye. Kuwait J. Sci. 2024, 51, 100077. [Google Scholar] [CrossRef]
  7. Yuan, L.; Liu, C.; Wu, X.; He, W.; Kong, Y.; Degefu, D.M.; Ramsey, T.S. A set pair analysis method for assessing and forecasting water conflict risk in transboundary river basins. Water Resour. Manag. 2024, 38, 775–791. [Google Scholar] [CrossRef]
  8. Borysenko, K.; Hutchinson, S.M.; Sinchuk, D. Manifestations and consequences of water conflicts: Case study of the Pechenihy reservoir, Kharkiv region, Ukraine. Visnyk V. N. Karazin Kharkiv Natl. Univ. Ser. Geology. Geography. Ecol. Quot 2024, 60, 173–187. [Google Scholar] [CrossRef]
  9. Xiao, J.; Lv, G.; Chai, N.; Hu, J.; Jin, Z. Hydrochemistry and source apportionment of boron, sulfate, and nitrate in the Fen River, a typical loess covered area in the eastern Chinese Loess Plateau. Environ. Res. 2022, 206, 112570. [Google Scholar] [CrossRef]
  10. Hua, K.; Xiao, J.; Li, S.; Li, Z. Analysis of hydrochemical characteristics and their controlling factors in the Fen River of China. Sustain. Cities Soc. 2020, 52, 101827. [Google Scholar] [CrossRef]
  11. Li, J.; Yang, G.; Zhu, D.; Xie, H.; Zhao, Y.; Fan, L.; Zou, S. Hydrogeochemistry of karst groundwater for the environmental and health risk assessment: The case of the suburban area of Chongqing (Southwest China). Geochemistry 2022, 82, 125866. [Google Scholar] [CrossRef]
  12. Li, S.L.; Liu, C.Q.; Li, J.; Xue, Z.; Guan, J.; Lang, Y.; Ding, H.; Li, L. Evaluation of nitrate source in surface water of southwestern China based on stable isotopes. Environ. Earth Sci. 2013, 68, 219–228. [Google Scholar] [CrossRef]
  13. Zhang, Q.; Wang, H. Assessment of sources and transformation of nitrate in the alluvial-pluvial fan region of north China using a multi-isotope approach. J. Environ. Sci. 2020, 89, 9–22. [Google Scholar] [CrossRef]
  14. Past´en-Zapata, E.; Ledesma-Ruiz, R.; Harter, T.; Ramírez, A.I.; Mahlknecht, J. Assessment of sources and fate of nitrate in shallow groundwater of an agricultural area by using a multi-tracer approach. Sci. Total Environ. 2014, 470–471, 855–864. [Google Scholar] [CrossRef]
  15. Chen, J.; Wu, H.; Qian, H.; Gao, Y. Assessing nitrate and ffuoride contaminants in drinking water and their health risk of rural residents living in a semiarid region of Northwest China. Expo. Health 2017, 9, 183–195. [Google Scholar] [CrossRef]
  16. Cao, S.; Fei, Y.; Tian, X.; Cui, X.; Zhang, X.; Yuan, R.; Li, Y. Determining the origin and fate of nitrate in the Nanyang Basin, Central China, using environmental isotopes and the Bayesian mixing model. Environ. Sci. Pollut. Res. 2021, 28, 48343–48361. [Google Scholar] [CrossRef]
  17. Liu, H.; Liu, W.; Yang, G.; Wang, J.; Zhang, H.; Zhang, H.; Liu, D.; Li, J. Distribution characteristics and formation mechanism of main hydrochemical ions in Qingshui River. Environ. Sci. 2024, 45, 337–348. [Google Scholar]
  18. Xie, Y.; Qian, P.; Li, J.; Yu, S.; Miao, X.; Guo, Y.; Huang, F.; Xiao, Q.; Zhang, L. Response of weathering carbon sink effect to anthropogenic sulfuric acid in different lithological catchments: A case study from Southwest China. J. Asian Earth Sci. 2024, 270, 106195. [Google Scholar] [CrossRef]
  19. Li, J.; Zhou, Y.; Zhou, J.; Sun, Y.; Zeng, Y.; Ding, Q. Hydrogeochemical evidence for fluoride sources and enrichment in desert groundwater: A case study of Cherchen River Basin, northwestern China. J. Contam. Hydrol. 2023, 259, 104270. [Google Scholar] [CrossRef]
  20. Chen, J.; Gao, Y.; Qian, H.; Ren, W.; Qu, W. Hydrogeochemical evidence for fluoride behavior in groundwater and the associated risk to human health for a large irrigation plain in the Yellow River Basin. Sci. Total Environ. 2021, 800, 149428. [Google Scholar] [CrossRef]
  21. Shan, Q.; Tian, X.; Xie, H.; Gong, Z.; Lin, Y.; Dang, Z.; Li, J.; Zou, S.; Zhu, T. Hydrogeochemical characteristics, driving factors, and health risk assessment of karst groundwater in Southwest Hubei Province, China. Water Environ. Res. 2024, 96, e11069. [Google Scholar] [CrossRef]
  22. Ren, K.; Pan, X.; Yuan, D.; Zeng, J.; Liang, J.; Peng, C. Nitrate sources and nitrogen dynamics in a karst aquifer with mixed nitrogen inputs (Southwest China): Revealed by multiple stable isotopic and hydro-chemical proxies. Water Res. 2022, 210, 118000. [Google Scholar] [CrossRef]
  23. Liu, J.; Han, G. Effects of chemical weathering and CO2 outgassing on δ13CDIC signals in a karst watershed. J. Hydrol. 2020, 589, 125192. [Google Scholar] [CrossRef]
  24. Zhang, Y.; Jiang, Y.; Yuan, D.; Cui, J.; Li, Y.; Yang, J.; Cao, M. Source and flux of anthropogenically enhanced dissolved inorganic carbon: A comparative study of urban and forest karst catchments in Southwest China. Sci. Total Environ. 2020, 725, 138255. [Google Scholar] [CrossRef]
  25. Li, J.; Xie, H.; Li, J.; Yang, G.; Xie, Y.; Wang, J.; Zhou, C.; Zou, S. Influences of anthropogenic acids on carbonate weathering and CO2 sink in an agricultural karst wetland (South China). Ecol. Indic. 2023, 150, 110192. [Google Scholar] [CrossRef]
  26. Böttcher, J.; Strebel, O.; Voerkelius, S.; Schmidt, H.L. Using isotope fractionation of nitrate-nitrogen and nitrate-oxygen for evaluation of microbial denitrification in a sandy aquifer. J. Hydrol. 1990, 114, 413–424. [Google Scholar] [CrossRef]
  27. Xu, C.; Shi, B.; Jia, Z.; Liu, D.; Hu, W.; Feng, C.; Li, R. Tracing the impacts of ecological water replenishment on the sources and transformation of groundwater nitrate through isotope and microbial analysis. Sci. Total Environ. 2024, 928, 172248. [Google Scholar] [CrossRef]
  28. Li, J.; Liu, H.; Pei, H.; Liu, W.; Yang, G.; Xie, Y.; Cao, S.; Wang, J.; Ma, L.; Zhang, H. Coupled processes involving ammonium inputs, microbial nitrification, and calcite dissolution control riverine nitrate pollution in the piedmont zone (Qingshui River, China). Sci. Total Environ. 2024, 931, 172970. [Google Scholar] [CrossRef]
  29. Yue, F.J.; Li, S.L.; Liu, C.Q.; Zhao, Z.Q.; Ding, H. Tracing nitrate sources with dual isotopes and long term monitoring of nitrogen species in the Yellow River. China. Sci. Rep. 2017, 7, 8537. [Google Scholar] [CrossRef] [PubMed]
  30. Kim, S.H.; Lee, D.H.; Kim, M.S.; Rhee, H.P.; Hur, J.; Shin, K.H. Systematic tracing of nitrate sources in a complex river catchment: An integrated approach using stable isotopes and hydrological models. Water Res. 2023, 235, 119755. [Google Scholar] [CrossRef] [PubMed]
  31. Xie, Y.; Huang, F.; Yang, H.; Yu, S. Role of anthropogenic sulfuric and nitric acids in carbonate weathering and associated carbon sink budget in a karst catchment (Guohua), southwestern China. J. Hydrol. 2021, 599, 126287. [Google Scholar] [CrossRef]
  32. Huang, F.; Fan, M.; Wei, X.; Cao, J. Overestimating the involvement of nitric acid derived from nitrification in carbonate dissolution under a calcareous soil system. Environ. Technol. Innov. 2024, 35, 103692. [Google Scholar]
  33. Zhang, R.; Liang, X.; Jin, M.; Wang, L.; Yu, Q. Fundamentals of Hydrogeology, 7th ed.; Geology Press: Beijing, China, 2018. [Google Scholar]
  34. Wang, H.; Lu, K.; Shen, C.; Song, X.; Hu, B.; Liu, G. Human health risk assessment of groundwater nitrate at a two geomorphic units transition zone in northern China. J. Environ. Sci. 2021, 110, 38–47. [Google Scholar] [CrossRef]
  35. Dansgaard, W. Stable isotopes in precipitation. Tellus 1964, 16, 436–468. [Google Scholar] [CrossRef]
  36. Yusoff, M.Z.M.; Hu, A.; Feng, C.; Maeda, T.; Shirai, Y.; Hassan, M.A.; Yu, C.P. Influence of pretreated activated sludge for electricity generation in microbial fuel cell application. Bioresour. Technol. 2013, 145, 90–96. [Google Scholar] [CrossRef]
  37. Gaillardet, J.; Dupré, B.; Louvat, P.; Allègre, C.J. Global silicate weathering and CO2 consumption rates deduced from the chemistry of large rivers. Chem. Geol. 1999, 159, 3–30. [Google Scholar] [CrossRef]
  38. WHO. Guidelines for Drinking-Water Quality, 4th ed.; Incorporating the First Addendum; World Health Organization: Geneva, Switzerland, 2017. [Google Scholar]
  39. Piper, A.M. A graphic procedure in the geochemical interpretation of water analyses. EOS Trans. Am. Geophys. Union 1944, 25, 914–928. [Google Scholar]
  40. Ding, K.; Zhang, Y.; Zhang, H.; Yu, C.; Li, X.; Zhang, M.; Zhang, Z.; Yang, Y. Tracing nitrate origins and transformation processes in groundwater of the Hohhot Basin’s Piedmont strong runoff zone through dual isotopes and hydro-chemical analysis. Sci. Total Environ. 2024, 919, 170799. [Google Scholar] [CrossRef]
  41. Cocca, D.; Lasagna, M.; Debernardi, L.; Destefanis, E.; De Luca, D.A. Hydrogeochemistry of the shallow aquifer in the western Po Plain (Piedmont, Italy): Spatial and temporal variability. J. Maps 2024, 20, 2329164. [Google Scholar] [CrossRef]
  42. Wang, W.; Li, Z.; Su, H.; Xiao, J.; Han, F.; Li, Z. Spatial and seasonal variability, control factors and health risk of fluoride in natural water in the Loess Plateau of China. J. Hazard. Mater. 2022, 434, 128897. [Google Scholar] [CrossRef] [PubMed]
  43. Craig, H. Isotopic variations in meteoric waters. Science 1961, 133, 1702–1703. [Google Scholar] [CrossRef] [PubMed]
  44. Mahlknecht, J.; Daessle, L.; Esteller, M.; Torres-Martinez, J.; Mora, A. Groundwater flow processes and human impact along the arid US-Mexican border, evidenced by environmental tracers: The case of Tecate, Baja California. Int. J. Environ. Res. Public Health 2018, 15, 887. [Google Scholar] [CrossRef] [PubMed]
  45. Torres-Martínez, J.A.; Mora, A.; Mahlknecht, J.; Daesslé, L.W.; Cervantes-Avilés, P.A.; Ledesma-Ruiz, R. Estimation of nitrate pollution sources and transformations in groundwater of an intensive livestock-agricultural area (Comarca Lagunera), combining major ions, stable isotopes and MixSIAR. Environ. Pollut. 2021, 269, 115445. [Google Scholar] [CrossRef] [PubMed]
  46. Zeng, Y.; Lu, H.; Zhou, J.; Zhou, Y.; Sun, Y.; Ma, C. Enrichment mechanism and health risk assessment of fluoride in groundwater in the oasis zone of the Tarim Basin in Xinjiang, China. Expo. Health 2024, 16, 263–278. [Google Scholar] [CrossRef]
  47. Li, S.; Liu, C.; Li, J.; Liu, X.; Chetelat, B.; Wang, B.; Wang, F. Assessment of the sources of nitrate in the Changjiang river, China using a nitrogen and oxygen isotopic approach. Environ. Sci. Technol. 2010, 44, 1573–1578. [Google Scholar] [CrossRef] [PubMed]
  48. Gibbs, R.J. Mechanisms controlling world water chemistry. Science 1970, 170, 1088–1090. [Google Scholar] [CrossRef]
  49. Luo, Y.; Xiao, Y.; Hao, Q.; Zhang, Y.; Zhao, Z.; Wang, S.; Dong, G. Groundwater geochemical signatures and implication for sustainable development in a typical endorheic watershed on Tibetan plateau. Environ. Sci. Pollut. Res. 2021, 28, 48312–48329. [Google Scholar] [CrossRef]
  50. Zhu, X.; Liu, L.; Lan, F.; Li, J.; Hou, S. Hydrogeochemistry characteristics of groundwater in the Nandong karst water system, China. Atmosphere 2022, 13, 604. [Google Scholar] [CrossRef]
  51. Wang, S.; Chen, J.; Zhang, S.; Zhang, X.; Chen, D.; Zhou, J. Hydrochemical evolution characteristics, controlling factors, and high nitrate hazards of shallow groundwater in a typical agricultural area of Nansi Lake Basin, North China. Environ. Res. 2023, 223, 115430. [Google Scholar] [CrossRef]
  52. Zhang, J.; Zhou, J.; Chen, Y.; Wei, X.; Zeng, Y.; Sun, Y. Identifying the factors controlling surface water and groundwater chemical characteristics and irrigation suitability in the Yarkant River Basin, northwest China. Environ. Res. 2023, 223, 115452. [Google Scholar] [CrossRef]
  53. Kshetrimayum, K.S. Hydrochemical evaluation of shallow groundwater aquifers: A case study from a semiarid Himalayan foothill river basin, northwest India. Environ. Earth Sci. 2015, 74, 7187–7200. [Google Scholar] [CrossRef]
  54. Martin, J.B. Carbonate minerals in the global carbon cycle. Chem. Geol. 2017, 449, 58–72. [Google Scholar] [CrossRef]
  55. Noh, H.; Huh, Y.; Qin, J.; Ellis, A. Chemical weathering in the Three Rivers region of Eastern Tibet. Geochim. Cosmochim. Acta 2009, 73, 1857–1877. [Google Scholar] [CrossRef]
  56. Nyilitya, B.; Mureithi, S.; Bauters, M.; Boeckx, P. Nitrate source apportionment in the complex Nyando tropical river basin in Kenya. J. Hydrol. 2021, 594, 125926. [Google Scholar] [CrossRef]
  57. Fadhullah, W.; Yaccob, N.S.; Syakir, M.I.; Muhammad, S.A.; Yue, F.J.; Li, S.L. Nitrate sources and processes in the surface water of a tropical reservoir by stable isotopes and mixing model. Sci. Total Environ. 2019, 700, 134517. [Google Scholar] [CrossRef]
  58. Biddau, R.; Dore, E.; Pelo, S.D.; Lorrai, M.; Botti, P.; Testa, M.; Cidu, R. Geochemistry, stable isotopes and statistic tools to estimate threshold and source of nitrate in groundwater (Sardinia, Italy). Water Res. 2023, 232, 119663. [Google Scholar] [CrossRef]
  59. Semhi, K.; Suchet, P.A.; Clauer, N.; Probst, J. Impact of nitrogen fertilizers on the natural weathering-erosion processes and fluvial transport in the Garonne basin. Appl. Geochem. 2000, 15, 865–878. [Google Scholar] [CrossRef]
  60. Husic, A.; Fox, J.; Al Aamery, N.; Ford, W.; Pollock, E.; Backus, J. Seasonality of recharge drives spatial and temporal nitrate removal in a karst conduit as evidenced by nitrogen isotope modeling. J. Geophys. Res. Biogeosciences 2021, 126, e2021JG006454. [Google Scholar] [CrossRef]
  61. Zhao, R.; Liu, Z.; Dong, L.; Zhang, Q.; Liu, C. The fates of CO2 generated by H2SO4 and/or HNO3 during the dissolution of carbonate and their influences on the karst-related carbon cycle. J. Hydrol. 2021, 597, 125746. [Google Scholar] [CrossRef]
  62. Clark, I.D.; Fritz, P. Environmental Isotopes in Hydrogeology; Lewis Press: Boca Raton, NY, USA, 1997. [Google Scholar]
  63. Zhu, G.; Wu, X.; Ge, J.; Liu, F.; Zhao, W.; Wu, C. Influence of mining activities on groundwater hydrochemistry and heavy metal migration using a self-organizing map (SOM). J. Clean. Prod. 2020, 257, 120664. [Google Scholar] [CrossRef]
  64. He, H.; Wang, Y.; Liu, Z.; Bao, Q.; Wei, Y.; Chen, C.; Sun, H. Lake metabolic processes and their effects on the carbonate weathering CO2 sink: Insights from diel variations in the hydrochemistry of a typical karst lake in SW China. Water Res. 2022, 222, 118907. [Google Scholar] [CrossRef] [PubMed]
Figure 1. (a,b) Location of the Qingshui River in northwestern Hebei Province, China; (c) Land-use types and sampling sites in the upstream (A-RW) and downstream (U-RW) regions of the Qingshui River; (d) Elevation levels of the sampling sites.
Toxics 13 00394 g001
Figure 2. Flowchart of the forward model used to assess the proportional contributions of the five main sources to hydrochemical ions. Note: the values of (Ca/Na)Sil and (Mg/Na)Sil referred to Gaillardet et al. [37].
Toxics 13 00394 g002
Figure 3. Microbial communities at the genus level in river water in the upstream (A-RW) and downstream (U-RW) regions of the Qingshui River (China). (a) Taxonomic composition and relative abundance; (b) Core and unique genera between A-RW and U-RW regions; (c) Spatial distribution patterns with hierarchical clustering across sampling sites.
Toxics 13 00394 g003
Figure 4. (ag) Hydrochemical indicators and (hk) saturation index illustrating the mineral dissolution dominated by carbonate rocks.
Toxics 13 00394 g004
Figure 5. Proportional contributions of precipitation input (Pre), halite dissolution (Hal), gypsum dissolution (Gyp), silicate dissolution (Sil) and carbonate dissolution (Car) to the hydrochemical composition of the Qingshui River. (a) FM-estimated fractions; (b) site-specific contributions; (c) spatial distribution.
Toxics 13 00394 g005
Figure 6. Spatial variability of NO3 concentrations in the upstream (A-RW) and the downstream (U-RW) regions of the Qingshui River; (a) Spatial distribution map of NO3 concentration; (b) Diagram showing the molar ratios of Cl/Na+ versus NO3/Na+ in A-RW and U-RW river water samples; (c) Variations in Cl concentration (μmol/L) vs. NO3/Cl (molar ratio) (adapted from Torres-Martínez et al.) [45].
Toxics 13 00394 g006
Figure 7. (a,b) Correlations between microbial compositions (at the genus level) and key physico-chemical factors and (c) frequencies of functional microbial communities in the upstream (A-RW) and downstream (U-RW) regions of the Qingshui River (China). Note: * for p < 0.05, ** for p < 0.01, and *** for p < 0.001.
Toxics 13 00394 g007aToxics 13 00394 g007b
Figure 8. Conceptual model of the co-controlling effects of carbonate dissolution and agricultural NH4+ emissions on HCO3–Ca and NO3 pollution in river water in the piedmont agricultural area.
Toxics 13 00394 g008
Table 1. Statistical summary of descriptive statistics for hydrochemical and isotopic data in the upstream (A-RW) and downstream (U-RW) regions of the Qingshui River.
ParametersUnitA-RW (n = 13)U-RW (n = 7)
Mean Min.Max.SDCVMean Min.Max.SDCV
pH/8.487.758.750.280.038.868.469.180.250.03
DOmg/L10.18.4013.71.450.1410.63.7915.04.260.40
T°C15.012.118.42.200.1520.018.022.21.370.07
ORPmV−76.4−92.7−33.716.00.21−100−123−75.217.40.17
TDSmg/L41534654658.90.1426723029622.80.09
K+mg/L3.330.375.071.380.415.864.307.721.220.21
Na+mg/L30.924.340.14.810.1633.230.137.02.870.09
Ca2+mg/L90.980.61128.630.0936.525.950.07.300.20
Mg2+mg/L20.613.633.56.930.3417.015.318.41.210.07
Clmg/L34.019.943.48.180.2443.239.349.73.320.08
SO42−mg/L57.132.787.316.60.2949.639.762.19.060.18
HCO3mg/L28522341163.60.2216013417614.20.09
NO3mg/L35.63.0852.812.50.351.120.522.861.161.03
NO2mg/L/BDLBDL//1.381.031.690.350.26
NH4+mg/L/BDL0.16//0.350.240.480.070.21
Fmg/L/BDL0.03///BDLBDL//
δ2H-H2O−73.2−80.0−63.05.180.07−53.3−66.0−43.07.890.15
δ18O-H2O−9.90−10.8−8.200.840.08−6.66−8.70−4.501.410.21
d-excess6.052.607.801.740.29−0.03−7.003.603.62/
δ13C-DIC−10.6−12.0−8.601.140.11−5.01−7.12−3.881.080.22
Table 2. Statistical results on the contribution of NH4+-containing pollutants to NO3 in water bodies.
RegionsNH4+-Containing PollutantsReferences
Comarca Lagunera, MexicoManure from concentrated animal-feeding operations (~48%), urban sewage (~43%), soil organic nitrogen (~4%), NH4+-synthetic fertilizers (~3%) and atmospheric deposition (~1%).[45]
Huixian karst wetland, ChinaAtmospheric nitrogen deposition (3.44%), synthetic NH4+ fertilizer (36.6%), soil organic nitrogen (28.0%), domestic sewage and manure (15.1%).[25]
Hohhot Basin’s Piedmont, ChinaManure (20.5%), soil nitrogen (63.8%) and ammonia fertilizer (28.8%).[40]
Nyando tropical river basin, KenyaAmmonium in fertilizer/rain (10%), soil nitrogen (18–41%), manure and sewage (46–70%).[56]
Bukit Merah Reservoir, MalaysiaAtmospheric deposition (23–29%), soil nitrogen (25–26%), manure and sewage (25–33%), [57]
Sardinia, ItalyNH4+ fertilizers (2.13%), soil organic nitrogen (0.55%), sewage and manure (58.5%).[58]
Disclaimer/Publisher’s Note: The statements, opinions and data contained in all publications are solely those of the individual author(s) and contributor(s) and not of MDPI and/or the editor(s). MDPI and/or the editor(s) disclaim responsibility for any injury to people or property resulting from any ideas, methods, instructions or products referred to in the content.

