You are currently on the new version of our website. Access the old version .
ToxicsToxics
  • Article
  • Open Access

10 March 2025

Environmental Risk Assessment of Metals in Groundwater in an Area of Jiujiang City, Jiangxi Province, China

,
,
,
and
1
Guangxi Key Laboratory of Theory and Technology for Environmental Pollution Control, Guilin University of Technology, Guilin 541006, China
2
Engineering Research Center of Watershed Protection and Green Development, Guilin University of Technology, Guilin 541006, China
3
Guangxi Engineering Research Center of Comprehensive Treatment for Agricultural Non-Point Source Pollution, Guilin University of Technology, Guilin 541006, China
4
Modern Industry College of Ecology and Environmental Protection, Guilin University of Technology, Guilin 541006, China
This article belongs to the Topic The Challenges and Future Trends in Anthropogenic and Natural Pollution Control Engineering

Abstract

To conduct an environmental risk assessment for metals in the groundwater of a site in Jiujiang City, Jiangxi Province, we analyzed seven metals (Cr, Zn, Pb, Ni, Sb, Cu, and Tl) that exhibited higher detection rates among the elements we measured. For example, in our measurement data, the average concentration of the element cobalt (Co) is less than 2 × 10⁻³ μg/L, and the average concentration of the element cadmium (Cd) is less than 5 × 10⁻³ μg/L. The purpose of this environmental risk assessment was to provide a scientific basis for site remediation and subsequent construction. The risk assessment was carried out using the single-factor pollution index, the Nemerow comprehensive pollution index (Pn), and potential ecological hazard index methods. Principal component analysis and correlation analyses were used to investigate the sources of metal pollution in the groundwater. The results indicated the following: (1) The average concentrations of the seven metals in the groundwater of the study area did not exceed the Class IV groundwater quality standard limits. The highest average concentration was for Zn (38.08 μg/L), indicating that metal concentrations in the groundwater were relatively low. (2) The Pn for the seven metals was below 0.7, indicating that the study area was at a non-polluted level. (3) The correlation and principal component analyses of the metals indicate that the sources of these metals may be residues from material stored in the raw material warehouse of the former iron smelting plant at the site. The results show that the level of groundwater contamination at the site falls within an extremely low range; thus, the focus on groundwater pollution can be reduced in subsequent site remediation and construction activities.

1. Introduction

Groundwater resources account for a third of China’s total water resources and approximately 20% of the country’s total water supply, providing high-quality freshwater resources for human production activities [1,2,3]. However, with the rapid development of China’s social economy and accelerated industrialization and urbanization, metal pollution in groundwater has become increasingly problematic [4,5,6]. Metal pollutants mainly enter water bodies through industrial discharge or domestic sewage, the release of metals accumulated in river sediments back into the water column, and atmospheric deposition. Because of their toxicity, high concealment, strong persistence, and low degradation, once groundwater is polluted by metals, they pose a threat to human health and environmental safety. High concentrations of Cr3+ can still have adverse effects on aquatic life and human health, such as causing skin irritation and allergic reactions. High concentrations of Zn2+ may lead to gastrointestinal discomfort, nausea, and other effects on the human body. Pb2+ is a highly toxic ion that can cause severe damage to the nervous system, kidneys, and cardiovascular system even at low concentrations. Ni2+ at high concentrations is harmful to aquatic life and human health, potentially causing skin allergies (such as nickel dermatitis), respiratory issues, and the development of certain cancers. Sb3+ is a toxic metal ion that can damage the liver, kidneys, and lungs. Prolonged exposure may lead to chronic poisoning, including gastrointestinal discomfort and neurological effects. High concentrations of Cu2+ can cause liver and kidney damage, gastrointestinal discomfort, etc. High concentrations of Ti4+ may have adverse effects on certain sensitive organisms.
This study focused on the groundwater at a site in Jiujiang City, Jiangxi Province, China; we conducted a systematic environmental risk assessment for seven metals (Cr, Zn, Pb, Ni, Sb, Cu, and Tl) detected at concentrations significantly higher than background levels [7]. Utilizing multiple methods, including the single-factor pollution assessment method, the Nemerow comprehensive pollution index (Pn), principal component analysis (PCA), and correlation analysis, this study provides a detailed evaluation of the pollution characteristics and health risks of these metals in groundwater.
The innovation of this study is reflected in three main aspects: First, addressing the relative lack of research on typical groundwater metal pollution characteristics and environmental risk assessment in China, this study is the first to systematically assess the pollution levels and environmental risks of these seven metals in the groundwater of Jiujiang. Second, by integrating a single-factor pollution assessment method into the comprehensive pollution index method, the study overcomes the limitations of single evaluation methods, providing a more accurate and comprehensive reflection of overall groundwater metal pollution status. Finally, through principal component analysis and correlation analysis, this study explored the source relationships and pollution characteristics among different metals, offering a scientific basis for targeted pollution control strategies [8,9,10].
The practical significance of the research findings lies in providing a scientific basis for site remediation and subsequent construction, as follows: (1) The single-factor pollution index, Nemerow comprehensive pollution index (Pn), and potential ecological hazard index methods, this study identified pollutants that require priority control and their spatial distribution characteristics, providing clear targets for subsequent remediation projects. (2) The pollutant source analysis results offer critical references for developing pollution prevention measures, helping to control pollutant inputs at the source.
From a broader perspective, the outcomes of this study not only provide a scientific basis for addressing specific pollution issues in Jiujiang but also serve as a methodological reference for groundwater metal pollution risk assessment in other similar regions across China [11]. The research results have significant theoretical and practical value for improving China’s groundwater environmental risk assessment system and promoting regional environmental governance. Future research could further incorporate hydrogeological characteristics to explore the migration and transformation patterns of pollutants in aquifers, supporting the development of more scientific pollution remediation plans. Additionally, we recommend establishing long-term monitoring mechanisms to dynamically evaluate pollution control effectiveness, ensuring sustained improvement in groundwater environmental quality [12,13].

2. Materials and Methods

2.1. Overview of the Study Area

The study area was located in Lianxi District, Jiujiang City, Jiangxi Province (116.0448° E and 29.6924° N). Jiujiang City has a diverse range of groundwater types, including porous water in loose rocks, fracture–karst water in carbonate rocks, and fracture water in the bedrock. Groundwater resources are relatively abundant but unevenly distributed.

2.2. Sample Collection and Processing

Five groundwater survey wells are located at the site. The sampling points were named GW1, GW2, GW3, GW4, and GW5, as shown in Figure 1. The concentrations of seven metals were measured at these points. The sampling was conducted in 2022 on 12 January, 24 February, 15 March, 8 May, 28 May, 30 June, 21 July, 27 October, 17 November, and 17 December. For the ten samplings, the data for each sampling point were evaluated [14]. Sample collection was performed according to standard processes for monitoring logging photography and background material collection, sampling equipment and container preparation, water level and well depth measurement, well washing, on-site monitoring and recording, water sample collection, sample preservative addition for sample preservation, sample inventory, refrigeration, and sample recording.
Figure 1. General description of the study area.
The groundwater sampling depth was 0.5 m below the well water level. Before sampling, the sampler and sample container were rinsed 2–3 times with the collected water samples. Then, the water sample was filtered into a polyvinyl chloride (PVC) bag using a 0.45 µm filter membrane. The filtered sample was acidified with nitric acid (1 mL of nitric acid per 100 mL of sample) to lower the pH to below 2, thus preventing the precipitation or adsorption of metals. Samples were stored at 4 °C. After being returned to the laboratory, metal concentrations were measured using an inductively coupled plasma mass spectrometer (ICP-MS).

2.3. Measurement Methods and Instruments

The seven groundwater metals concentrations of Cr, Zn, Pb, Ni, Sb, Cu, and Tl in this field study were all measured by inductively coupled plasmon mass spectrometry HJ 700-2014, and the instrument used was an inductively coupled plasmon mass spectrometer NexION350D (ICP-MS) (PerkinElmer, Waltham, MA, USA). And the model of the pH meter used was PHB-5.
Instrument Operating Conditions: Instrument Model, NexION 350D ICP-MS (PerkinElmer, USA); RF Power, 1300 W; Nebulizer Gas Flow, 0.98 L/min; Auxiliary Gas Flow, 1.2 L/min; Plasma Gas Flow, 15 L/min; Sampling Cone and Skimmer Cone, Ni; Detection Mode, Standard Mode; Dwell Time, 100 ms; Replicates, 3. The detection limits and quantitation limits for each element analyzed by ICP-MS are shown in Table 1.
Table 1. The detection/quantitation limits of the ICP-MS.
We chose the collision mode to set the concentration level of each element’s standard solution and selected the online automatic addition of the internal standard; the concentration of the internal standard working solution was 50 μg/L, and the injection mode was automatic injection. The standard solution was introduced into the ICP-MS injection system in sequence, the ratio of the response values of each element in the standard solution to the response value of the internal standard was taken as the vertical axis, and each concentration was taken as the horizontal axis. A standard curve was drawn for quality control. The working curves and correlation coefficients of the elements are shown in Table 2.
Table 2. Element working curves and correlation coefficients.

2.4. Evaluation Method

In this study, the single-factor pollution index, Pn, and latent ecological risk index methods were used to evaluate the pollution status of metal contamination in groundwater at the site. Simultaneously, the correlation analysis of metals elements and PCA methods were used to analyze the sources of these metals, which can provide accurate and effective reference information for future site remediation and construction activities [15].

2.4.1. Single-Factor Pollution Index Method

The single-factor pollution index method calculates the worst single index among all indexes to be evaluated. Using the test results of each evaluation factor and the environmental quality classification standard selected for the project, its category was determined, and its attribution category was determined by comparing the test results for the evaluation factor with the classification standard adopted by the project. The single-factor pollution index method can strengthen the objectivity in determining the index weight [16,17]. The single-factor index method was used for evaluation. The pollution indices of the pollutants were calculated by comparing measured values with the evaluation standards. The standard limits of this study were subject to Class IV in Table 1 and Table 3 of the Groundwater Quality Standard GB/T14848-2017 [18].
Table 3. Classification of the single-factor pollution index and Nemerow comprehensive pollution index.
Formula (1):
P i = C i S i
In the formula:
P i : pollution index of the ith metals.
C i : concentration of the element ith.
S i : evaluation criteria for the ith metals.

2.4.2. Nemerow Comprehensive Pollution Index Method

As a pollution evaluation index, the Pn can highlight serious pollution evaluation factors while accounting for the contribution of different factors in the evaluation system while simultaneously reducing the influence of subjective factors in the weighting process. This is a comprehensive evaluation method [19]. Table 3 shows the classification of single-factor and comprehensive pollution indices.
Formula (2):
P n = P ¯ 2 + P m a x 2 2
In the formula:
P n : comprehensive pollution index of metals at a sampling point.
P m a x : maximum value of the single-factor pollution index of each metal pollutant at the sampling point.
p ¯ : average value of the single-factor pollution index.

2.4.3. Potential Ecological Hazard Index Method

The potential ecological hazard index was proposed by Hankanson [20]. This method is widely used to evaluate the ecological hazards of metals in environmental media based on the biological toxicity of metals [21]. The calculation method is shown in Formulas (3) and (4).
C f   i = C s i C n i
E r i =   T r i × C f i
R I = i = 1 n E r i ,
In the formulas:
C f i : the pollution coefficient of the ith metal.
C s i : the actual determined concentration of the element [22].
C n i : the reference value of the ith metal (μg/L). In this study, the standard metal values in groundwater at the site were used as reference ratios, and these values are listed in Table 4.
Table 4. Background and toxicity response coefficient values for each element.
E r i : the potential hazard coefficient of the ith metal.
T r i : the toxicity response coefficient of the ith metal (the value is shown in Table 3).
RI: the potential ecological hazard index of the ith metal.
The grading standards of evaluation indicators are E r i < 40, 40 ≤ E r i < 80, 80 ≤ E r i < 160, 160 ≤ E r i < 320, and 320 ≤ E r i , which correspond with slight, moderate, strong, very strong, and extremely strong ecological risk degrees of single-factor pollution, respectively, and RI < 150, 150 ≤ RI < 300, 300 ≤ RI < 600, and 600 ≤ RI, which correspond with low, moderate, severe, and very severe potential ecological risk degrees, respectively.

2.4.4. Correlation Analysis

Correlation analysis is a statistical method used to quantify the strength and direction of a relationship between two or more variables. It measures this relationship by calculating a correlation coefficient, which typically ranges from −1 to 1. The primary purpose of correlation analysis is to understand the interrelationships between variables and provide a basis for data analysis and decision-making. Here, the Pearson correlation coefficient method is used to quantify the linear relationships between the variables, and its correlation coefficient numerically quantifies the linear relationship between two variables, with a range of −1 to +1. Moreover, +1 indicates a perfect positive correlation (as one variable increases, the other increases proportionally), −1 indicates a perfect negative correlation (as one variable increases, the other decreases proportionally), and 0 indicates no linear relationship between the two variables [23].
By calculating the Pearson correlation coefficient, we can intuitively understand whether there is a linear relationship between the variables and their degrees of strength.

2.4.5. Principal Component Analysis

PCA is a statistical method that simplifies multiple correlated variables into a few uncorrelated composite variables (principal components) using dimensionality reduction techniques while retaining as much of the variance of the original data as possible. The core idea of PCA is to project the data onto new coordinate axes (principal components) through linear transformation, such that these new axes can explain the variance of the data to the greatest extent [24].
The KMO (Kaiser–Meyer–Olkin) test is used to assess the correlation and partial correlation between variables to determine whether the data are suitable for factor analysis or principal component analysis. Generally, a KMO value greater than 0.5 is considered acceptable for principal component analysis. Bartlett’s test of sphericity is used to examine whether there is significant correlation among variables to determine whether the data are suitable for factor analysis. Typically, a p-value less than 0.05 indicates that the data are suitable for factor analysis [25].
To further analyze the pollution sources of metals, PCA was carried out on six metals (Tl was excluded from the analysis because its concentrations were low). However, before adopting this method, it was necessary to determine the appropriateness of using the metals data with KMO (Kaiser–Meyer–Olkin) and Bartlett tests. The KMO test value was 0.577, and the Bartlett sphericity test was <0.001, which proved that this method could be appropriately applied to the data [24].

2.5. Data Statistics and Processing

In this study, SPSS (version 27.0) was used for the correlation analysis, and Origin 2021 was used to generate the heat map for the correlation analysis of metals in groundwater and the radar map of metal content.

3. Results and Discussion

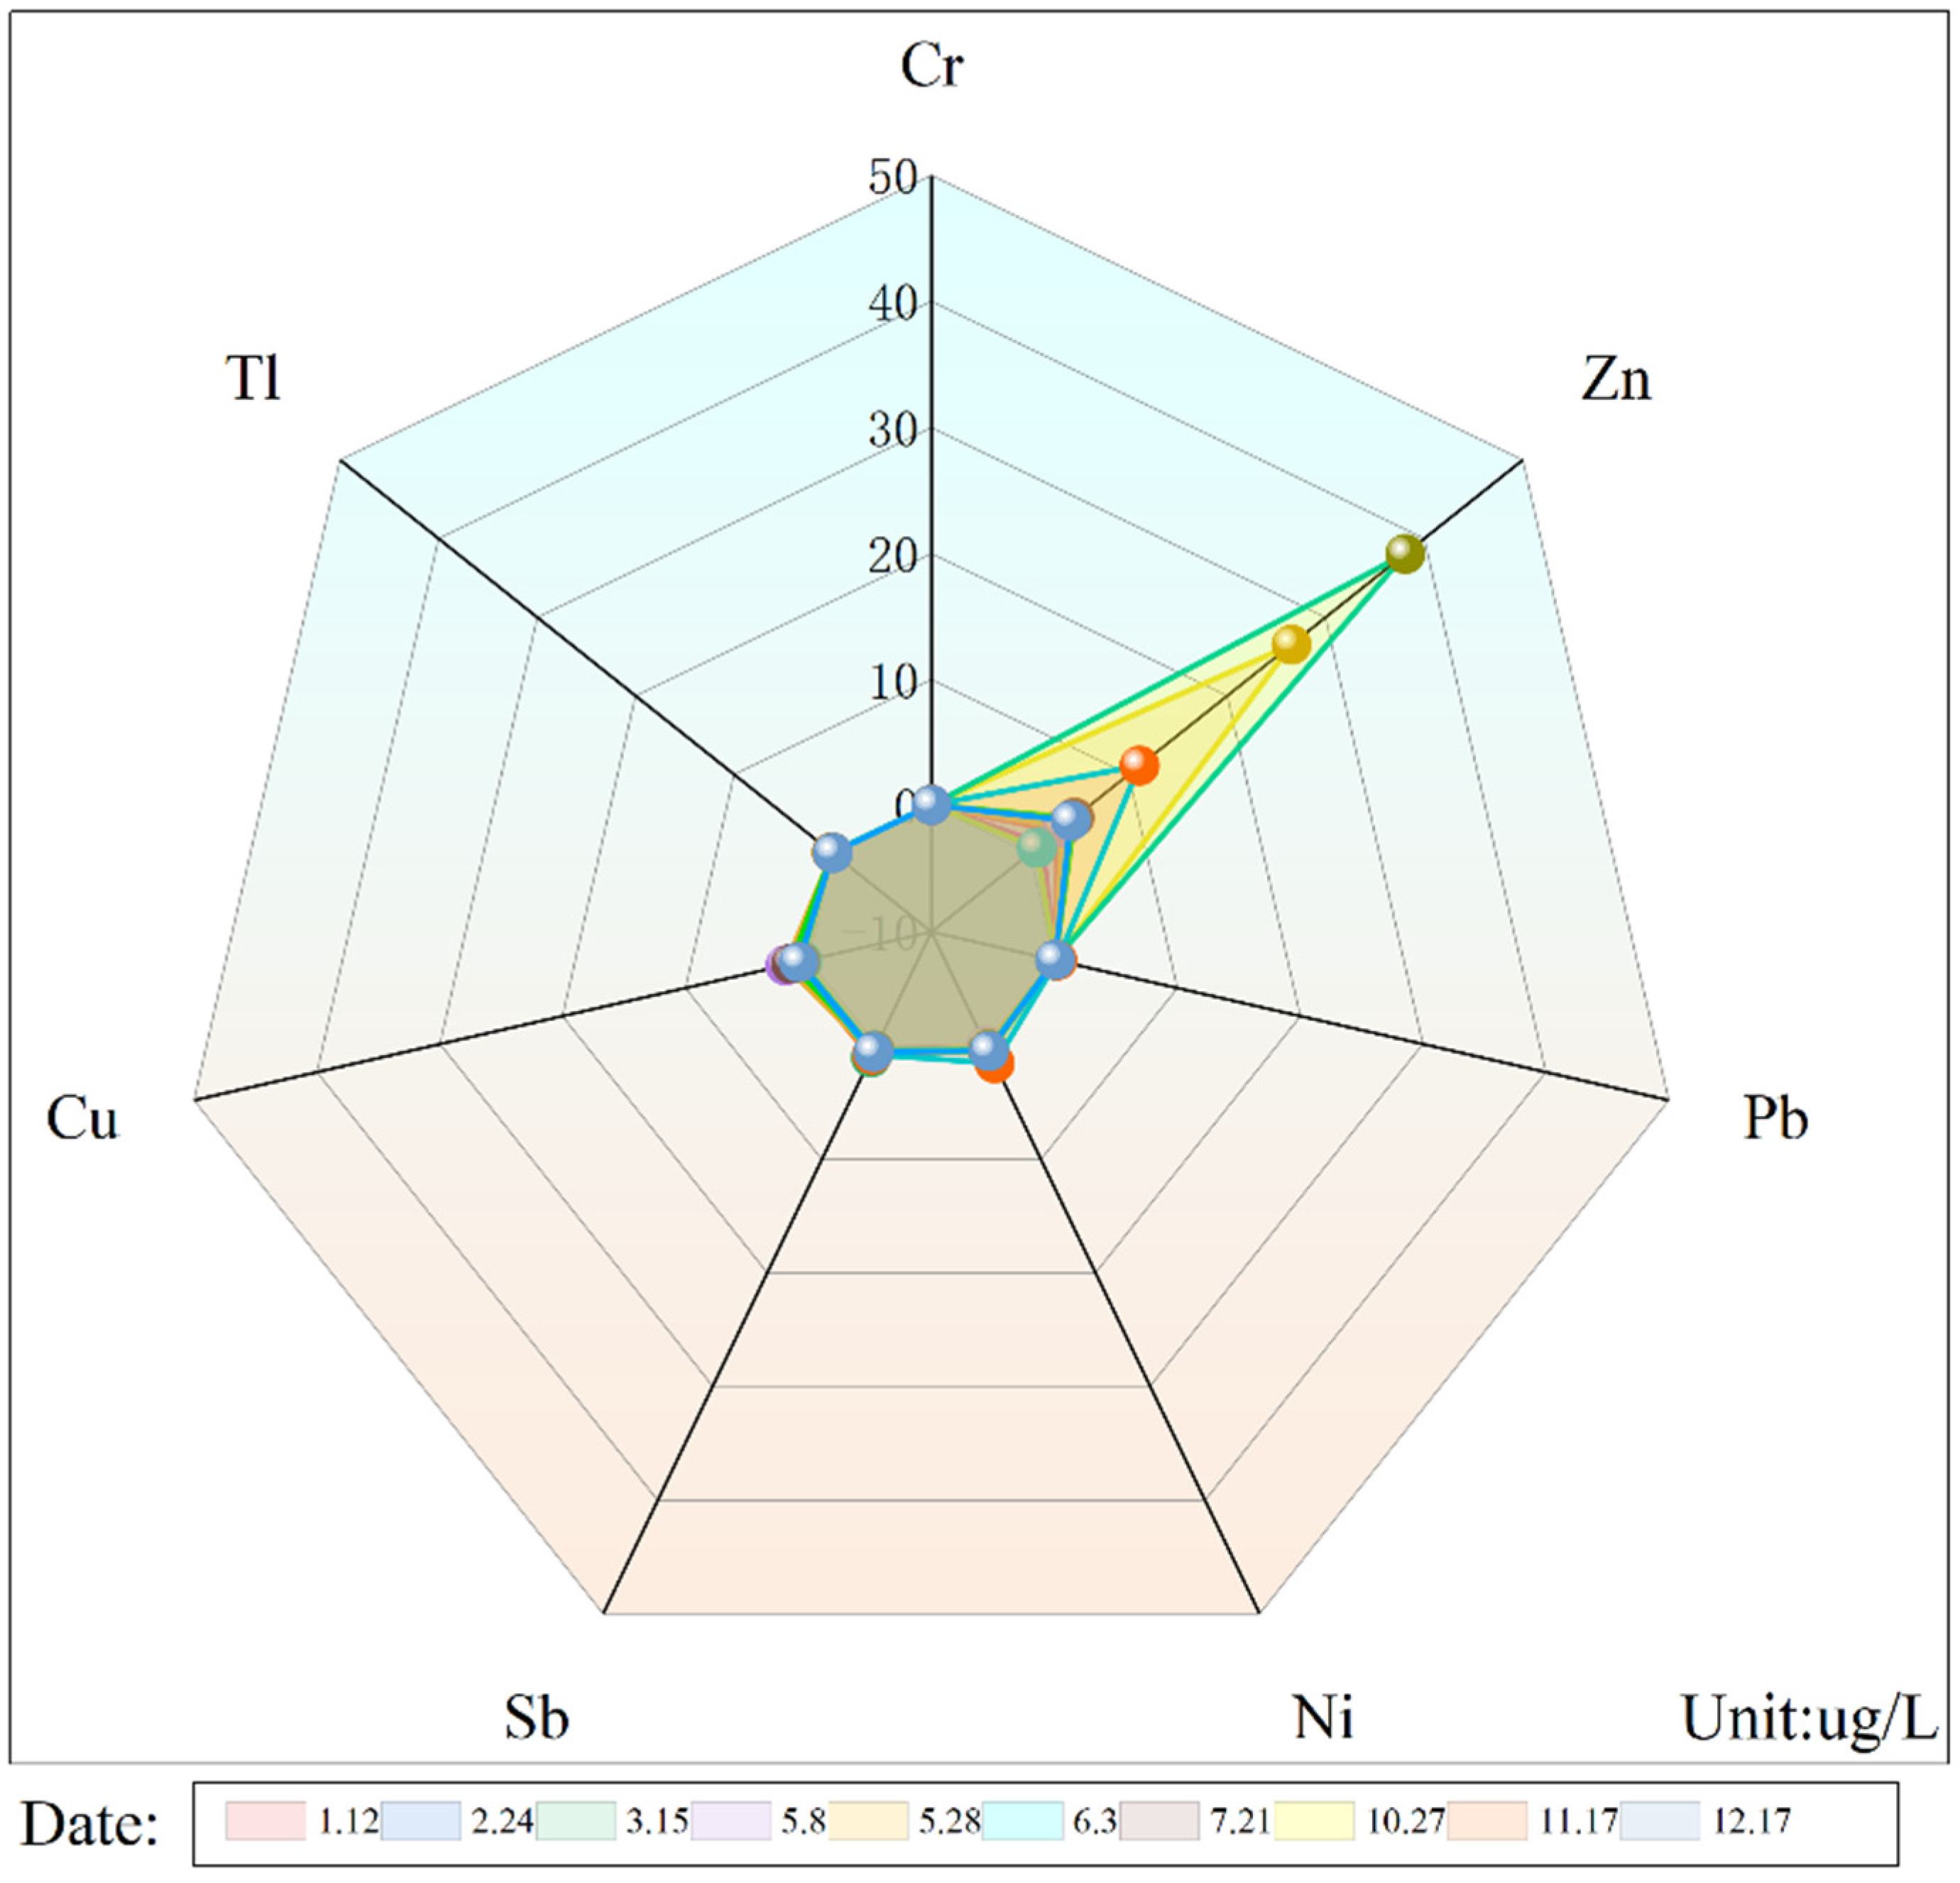
3.1. Characteristics of Metal Content in Site Groundwater

The basic physicochemical properties of seven metals in the groundwater at five sampling points of the site were determined. The pH range at the sampling points was between 7.86 and 8.1. As shown in Table 5, the maximum values of the seven metals (Cr, Zn, Pb, Ni, Sb, Cu, and Tl) were lower than the Class IV limit of the groundwater quality standard. The radar chart (Figure 2) shows that the highest measured concentration of any metal at this site was Zn (38.08 µg/L). This environmental concentration was extremely low, making subsequent site remediation relatively easy. The average concentration of heavy metals at each of the five sampling points (n = 10) is shown in Table 6.
Table 5. Characteristics of metals concentrations in groundwater from a contaminated site in Jiujiang City, China.
Figure 2. Concentration radar chart of metals in groundwater from a contaminated site in Jiujiang City, China.
Table 6. The average concentration of heavy metals at each of the five sampling points (n = 10).

3.2. Evaluation of Metal Pollution in Groundwater

3.2.1. Single-Factor and Nemerow Comprehensive Pollution Index Methods

As shown in Table 7, the intensity of metal pollution decreased in the order of Sb (0.0565) > Tl (0.0406) > Cr (0.00554) > Ni (0.004896) > Zn (0.001862) > Pb (0.001056) > Cu (0.000707). Based on the Pi ≤ 1, all seven metals could be classified at the non-pollution level, indicating that the degree of groundwater by metals at this site was low. Pn was 0.01588 (<0.7) and could be classified as Class I non-pollution. From the box plots of the single-factor pollution index in the study area (Figure 3), it was evident that the Pi values of the seven metals were all lower than 1. Therefore, it can be concluded that the groundwater at this site is negligibly contaminated by these metals.
Table 7. Single-factor and comprehensive pollution index of metals in groundwater from a polluted site in Jiujiang City, China.
Figure 3. Box plot of the single-factor pollution index (Pi) of metals in groundwater from a polluted site in Jiujiang City, China.

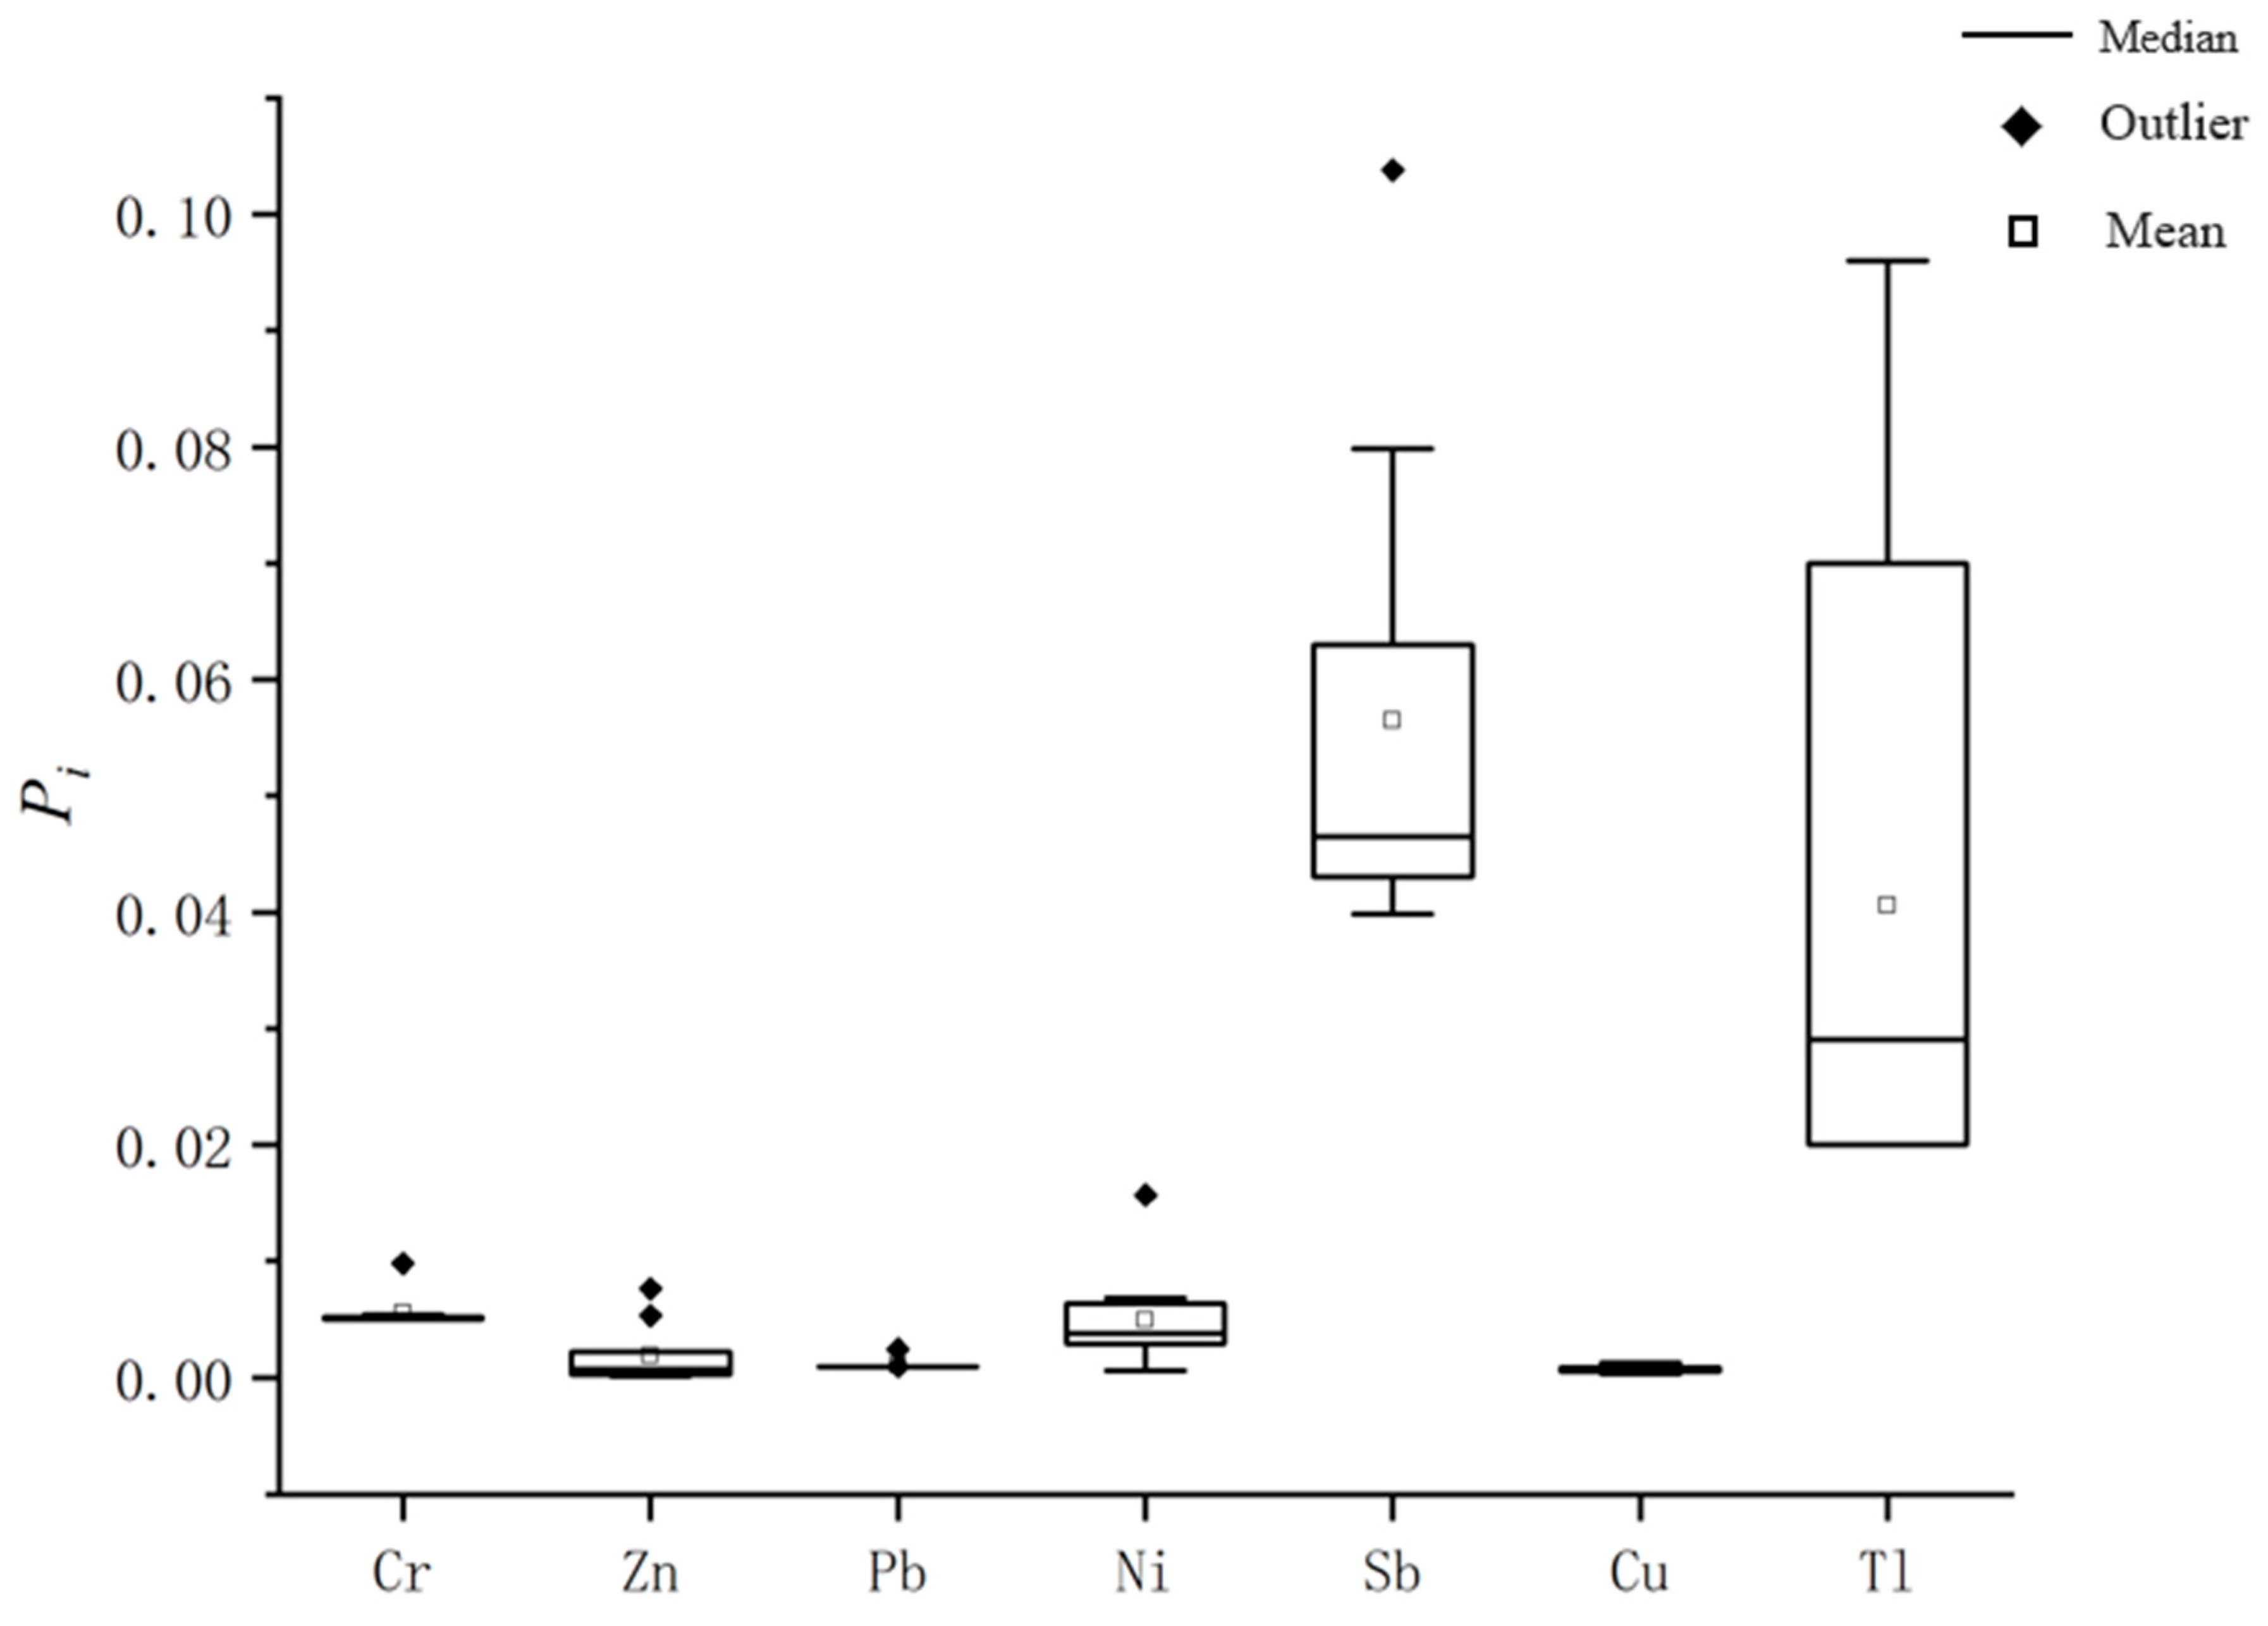
3.2.2. Potential Ecological Hazard Index Method in Groundwater

Based on the evaluation of the potential ecological risk posed by individual metals, the potential ecological risk from metals in groundwater at this site was analyzed. The results showed that the potential ecological risk values of single elements were Tl (0.96) > Sb (0.519) > Pb (0.121) > Ni (0.0783) > Cr (0.01108) > Cu (0.00634) > Zn (0.00186). The average E r i value was <40, and the potential risk level was slight. The potential ecological risk degree (RI) was 1.59, which is classified as low (<150). In summary, the degree of ecological risk from metal pollution in groundwater at this site was very low, with the predicted impacts on the surrounding environment and organisms likely to be small.

3.3. Correlation Analysis of Metal Elements in Groundwater

The Pearson correlation analysis between metals is shown in the heat map of metal correlations shown in Figure 4. The metals Pb and Ni show a significant positive correlation, indicating that Pb and Ni may have the same source or migration and transformation processes, while the correlation between the metal elements Cr and Cu is positive; however, there is a less significant correlation with Pb and Ni, indicating that Cr and Cu may have the same source or migration and transformation processes [4]. At the site, the potential sources of metals were sewage or wastewater, which came from (1) domestic sewage generated in the site office area, (2) wastewater from soil remediation, (3) vehicle-washing wastewater.
Figure 4. Correlation heatmap of metals in groundwater at a contaminated site in Jiujiang City, China.

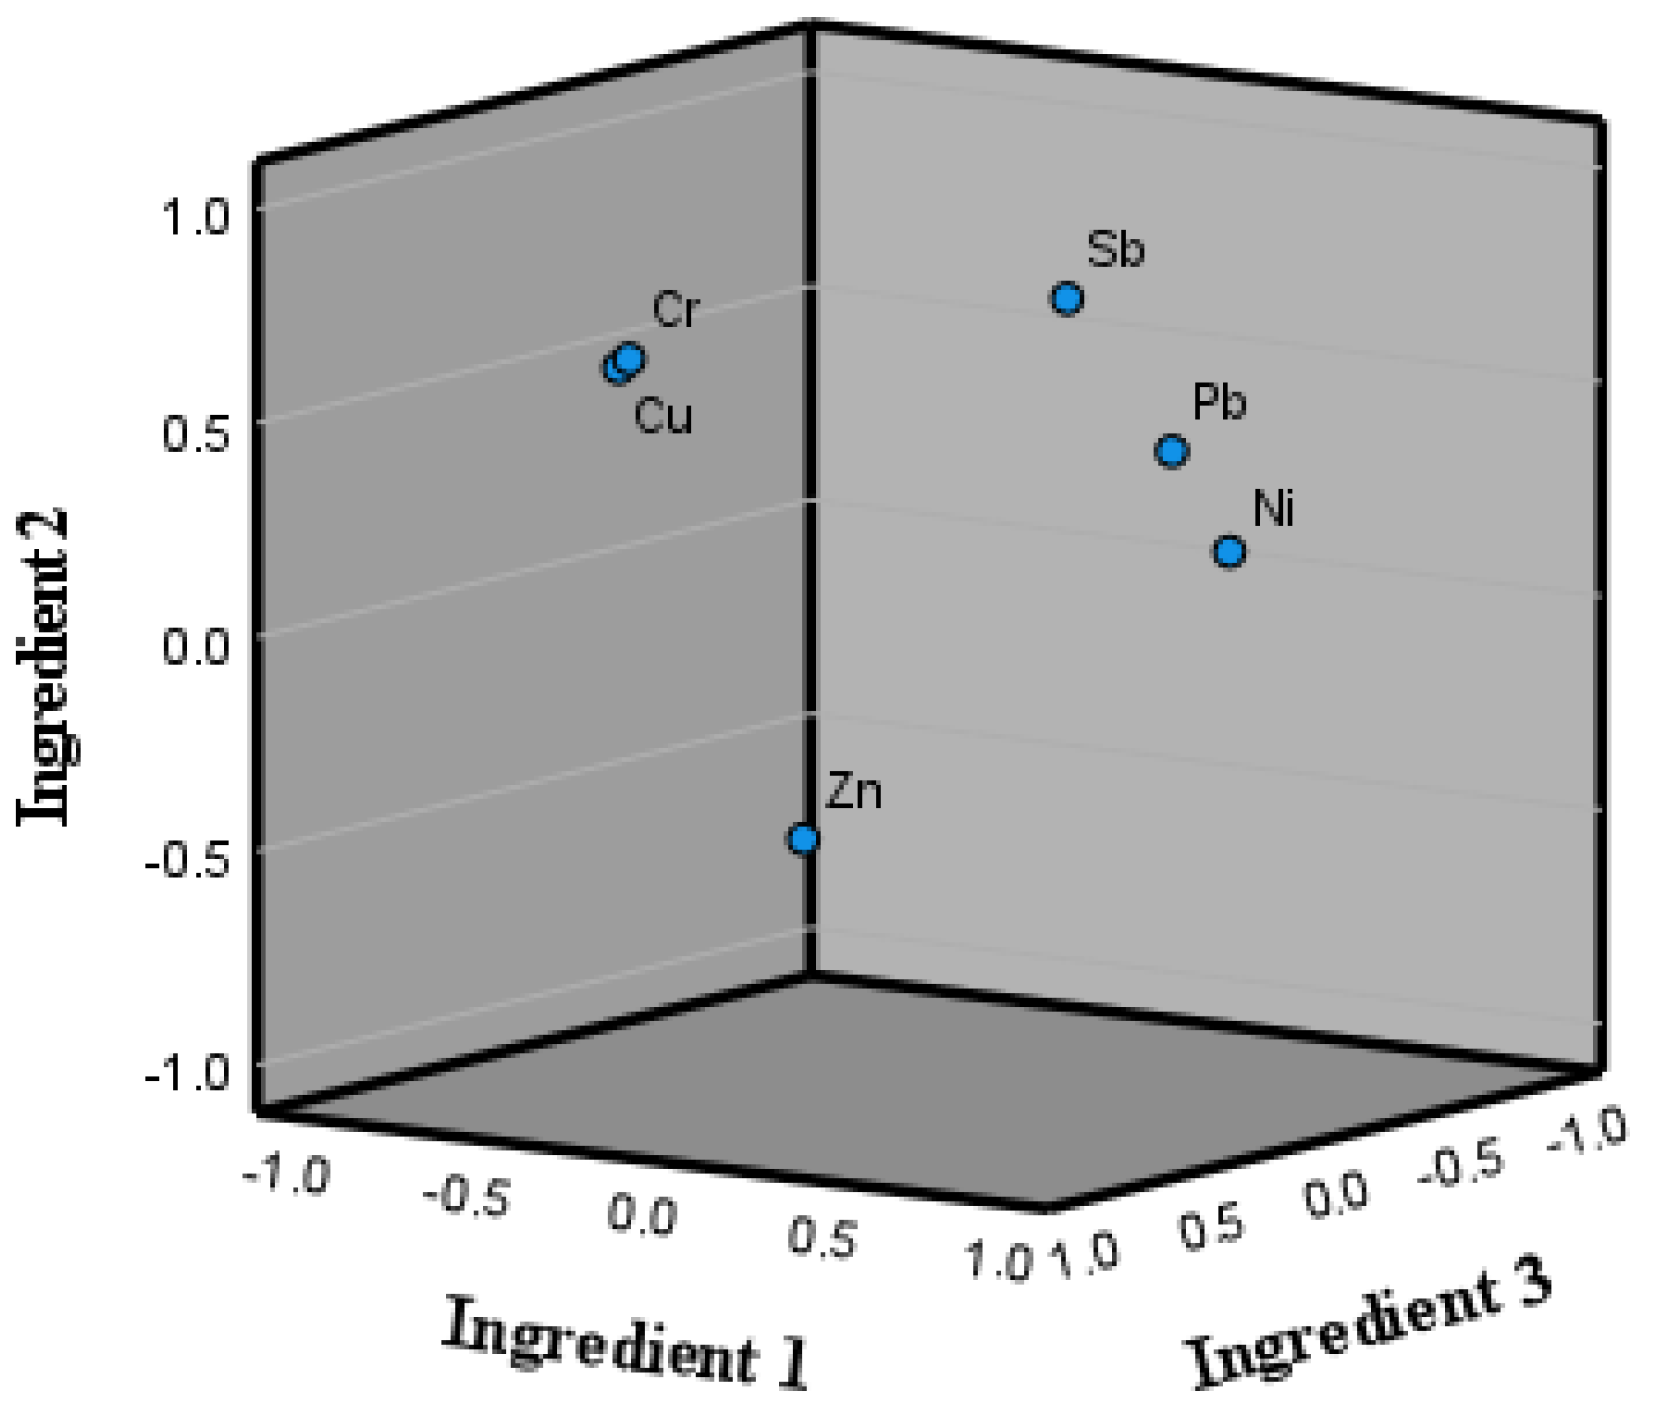
3.4. Principal Component Analysis

Three principal components were extracted, the eigenvalue was greater than 0.967, the contribution rates of principal components 1, 2, and 3 were 40.826%, 27.523%, and 16.130%, respectively, and the cumulative contribution rate was 84.479%, which was greater than 80% (Table 8); thus, most of the variance in the data was explained by the three components. The loading of each metal on the three principal components is shown in Table 9. Both Table 9 and Figure 5 show that Pb, Ni, and Sb were highly associated with component 1. The strong association and distribution of these three metals may be due to the presence of solid waste at the site, such as abandoned structures, construction waste, and waste residue in the plot [26,27,28], as well as human activities such as wastewater from soil remediation and vehicle-washing wastewater. While Cr and Cu were strongly associated with principal component 2, their concentrations were very low.
Table 8. Total variance explained by principal component analysis.
Table 9. Loading of metals with principal components.
Figure 5. Principal component analysis (PCA) plot of the main principal components of metals in groundwater from a contaminated site in Jiujiang City, China.
In summary, the sources of several metals at this site can be derived from the residues of materials accumulated in the raw material warehouse of the former ironmaking plant. Others have little impact on the concentration of metals in the groundwater at this site, and all subsequent restorations at this site will be relatively simple.

3.5. Comparison with Heavy Metals in Groundwater from Other Places

Comparisons with heavy metals in groundwater from other places (µg/L) are shown in Table 10. We found that the pollution level in the area that we surveyed was relatively low, and the detected concentrations of Cr, Zn, Pb, Ni, and Cu in groundwater were significantly lower than those in Mathura, India. The reason may be that Mathura’s industrial emissions and the application of fertilizers and sludge to farmland are more severe, which may lead to soil pollution and increase the absorption of heavy metals. Similarly, in areas of Italy with high groundwater levels, agricultural activities may be the main reason for high nickel concentrations. The use of nickel-rich insecticides or fertilizers may be the main reason for the increase in nickel concentration in groundwater samples. It was found that the average concentration of zinc in this study was 12.8 µg/L; this may be caused by urban landfill and agricultural fertilization or by the use of zinc as a fossil fuel additive in car engines, which also pollutes the environment due to exhaust emissions.
Table 10. Comparison with heavy metals in groundwater from other places (µg/L).

4. Conclusions

(1) The average concentrations of seven metals (Cr, Zn, Pb, Ni, Sb, Cu, and Tl) detected at this site were all lower than the standard limits in the groundwater quality standard Class IV water standard (GB/T14848-2017).
(2) The Pi calculated using the single-factor pollution index method was <1 for all seven metals (thus, they were classified as causing no pollution), while the comprehensive Pn was 0.01588 (<0.7, which was classified as level I: no pollution).
(3) Using the potential ecological hazard index method, the potential risk values of the seven metals were calculated according to the evaluation of the potential ecological risk grade of the individual metals. The potential risk values of the seven metals ( E r i ) were <40, which is a slight latent load risk level. RI < 150 indicated a low potential risk.
(4) Lead and Ni showed a significant positive correlation, indicating that they may have the same source or migration and transformation processes, while there were positive correlations and negative correlations between other metals, though these were not as significant. Three principal components were extracted through PCA with a cumulative contribution rate of 84.479% when the characteristic root value was greater than 0.967. Lead, Ni, and Sb were strongly loaded on principal component 1. According to their distribution characteristics, the presence of these three metals may likely be due to the presence of solid wastes at the site (such as abandoned structures, construction waste, and waste residue) and wastewater from activities such as soil remediation and vehicle washing.
In summary, the contamination levels of the seven metals in groundwater at the site were very low. Our analysis provides a scientific basis for assessing the degree of groundwater contamination at the site. The results indicate that future site remediation and construction activities at the site do not require a strong focus on metal contamination in groundwater, thereby reducing the workload. Moreover, by combining correlation analysis and PCA to infer the sources of the main pollutants, it is possible to prevent increased metal contamination in groundwater at the site from the source.

5. Perspectives

This study only conducted an environmental risk assessment on the concentrations of the seven metals with the highest content among the measured elements in the groundwater of the site; we did not investigate the migration and transformation of these metal elements. It remains uncertain whether the toxicity of the site will increase in the future. Therefore, future research should further develop the monitoring and analysis of the migration and transformation processes of metal elements to more comprehensively assess the potential environmental risks at the site. This will not only help predict the trends in toxicity changes but also provide a scientific basis for the development of more effective pollution control measures [29].
Groundwater metal pollution poses a potential threat to aquatic ecosystems. Conducting risk assessments based on toxicity data from fish, algae, Daphnia, and microorganisms can comprehensively reveal the ecological effects of contaminants [30]. Future research should integrate multi-species toxicity data to construct species sensitivity distribution (SSD) curves, assessing the sensitivity of different biological groups to metallic pollutants. Additionally, the study of metal migration and speciation changes in groundwater–surface water interactions, combined with microbial toxic responses and remediation potential, can shed light on the long-term impacts of pollutants on ecosystems [31]. By quantifying uncertainties and establishing scientific water quality standards, theoretical foundations and practical guidance for the risk management and ecological remediation of groundwater metal pollution can be provided. The integration of interdisciplinary approaches and advanced technologies will drive innovative developments in this field.

Author Contributions

Conceptualization, M.T. and P.Z.; methodology, W.C.; software, W.C.; validation, S.X., W.C. and P.Z.; formal analysis, M.T.; investigation, S.X.; resources, W.C.; data curation, F.H.; writing—original draft preparation, M.T.; writing—review and editing, P.Z.; visualization, S.X.; supervision, S.X.; project administration, S.X.; funding acquisition, P.Z. All authors have read and agreed to the published version of the manuscript.

Funding

This research was funded by the research funds of The Guangxi Key Laboratory of Theory and Technology for Environmental Pollution Control (guikeneng 2301Z003).

Institutional Review Board Statement

Not applicable.

Data Availability Statement

The data that support the findings of this study are available from the corresponding author upon reasonable request.

Conflicts of Interest

The authors declare no conflicts of interest.

References

  1. Fu, R.; Xin, C.; Yu, S.; Li, X. Analysis of Metals Sources in Groundwater and Assessment of Health Risks: An Example from the Southwest Sub-basin of the Shiqi River. Environ. Sci. 2023, 44, 796–806. [Google Scholar] [CrossRef]
  2. Ren, J.; Li, J.; Xi, B.; Yang, Y.; Lu, H.; Shi, J. Groundwater Pollution Prevention and Control in China: Current Status and Countermeasures. Strateg. Study CAE Sci. 2022, 24, 161–168. [Google Scholar] [CrossRef]
  3. Zhang, L.; Kennedy, C. Determination of sustainable yield in urban groundwater systems: Beijing, china. J. Hydrol. Eng. 2006, 11, 21–28. [Google Scholar] [CrossRef]
  4. Shi, H.; Pan, Y.; Zeng, M.; Huang, C.; Hou, Q.; Pi, P.; Peng, H. Source Analysis and Health Risk Assessment of Metals in Groundwater of Leizhou Peninsula. Environ. Sci. 2021, 42, 4246–4256. [Google Scholar] [CrossRef]
  5. Shen, H.; An, R.; Shi, H.; Liu, X.; Zhang, A. Metals Pollution and Influencing Factors of Agricultural Land in a Typical Watershed in Hunan Province. Res. Environ. Sci. 2021, 34, 715–724. [Google Scholar] [CrossRef]
  6. You, D.; Zhou, J.; Wang, J.; Ma, Z.; Pan, L. Analysis of relations of metals accumulation with land utilization using the positive and negative association rule method. Math. Comput. Model. 2011, 54, 1005–1009. [Google Scholar] [CrossRef]
  7. Cao, J.; Zhang, Y.; Zhang, J. Research progress of water ecological health assessment at home and abroad. J. Environ. Eng. Technol. 2022, 12, 1402–1410. [Google Scholar] [CrossRef]
  8. Xue, S.; Wang, Y.; Jiang, J.; Tang, L.; Xie, Y.; Gao, W.; Tan, X.; Zeng, J. Groundwater heavy metal(loid)s risk prediction based on topsoil contamination and aquifer vulnerability at a zinc smelting site. Environ. Pollut. 2024, 341, 122939. [Google Scholar] [CrossRef]
  9. Ferreira, S.L.C.; da Silva, J.B.; dos Santos, I.F.; de Oliveira, O.M.C.; Cerda, V.; Queiroz, A.F.S. Use of pollution indices and ecological risk in the assessment of contamination from chemical elements in soils and sediments—Practical aspects. Trends Environ. Anal. Chem. 2022, 35, e00169. [Google Scholar] [CrossRef]
  10. Eziz, M.; Sidikjan, N.; Zhong, Q.; Rixit, A.; Li, X. Distribution, pollution levels, and health risk assessment of heavy metals in groundwater in the main pepper production area of china. Open Geosci. 2023, 15, 20220491. [Google Scholar] [CrossRef]
  11. Ogwu, M.; Izah, S.; Sawyer, W.; Amabie, T. Environmental Risk Assessment of Trace Metal Pollution: A Statistical Perspective. Env. Geochem. Health 2025, 47, 94. [Google Scholar] [CrossRef]
  12. Xu, B.; Wang, C.; Zhou, G.; Zhou, P. State of the art and future directions in groundwater contamination risk assessment. Coal Geol. Explor. 2024, 52, 55–71. [Google Scholar] [CrossRef]
  13. Fei, Y.; Liu, Y.; Li, Y.; Bao, X.; Zhang, P. Prospect of groundwater pollution remediation methods and technologies in China. Geol. China 2022, 49, 420–434. [Google Scholar] [CrossRef]
  14. Fu, P.; Li, X.; Zhang, J.; Ma, C.; Wang, Y.; Meng, F. Remote sensing inversion on heavy metal content in salinized soil of Yellow River Delta based on Random Forest Regression—A case study of Gudao Town. Sci. Rep. 2024, 14, 11216. [Google Scholar] [CrossRef]
  15. Hao, W.; Wang, Y.; Wang, X.; Lin, M.; Mao, K.; Hao, S. Analysis of TDS and Heavy Metal Pollution Characteristics in Groundwater of Typical Antimony Mining Areas in Hunan. Water 2024, 16, 3453. [Google Scholar] [CrossRef]
  16. Shen, H.; Niu, B.; Li, F.; Wang, Y.; Li, X. Water Quality Assessment and Pollution Source Analysis of the Dawen River. Saf. Environ. Eng. 2021, 28, 176–185, 195. (In Chinese) [Google Scholar] [CrossRef]
  17. Li, S.; Yan, Z.; Xu, D.; Wang, S. Application of Improved Nemerow Index Method in Reservoir Water Quality Evaluation. Sci. Technol. Eng. 2020, 20, 13079–13084. (In Chinese) [Google Scholar] [CrossRef]
  18. GB/T 14848-2017; Groundwater Quality Standards. China Standards Press: Beijing, China, 2017.
  19. Yu, J.; Li, B.; Zhou, Y.; Li, Y.; Lei, M. Pollution and risk assessment of metals in agricultural soil around an abandon mine site in Hunan Province. Environ. Chem. 2020, 4, 1024–1030. [Google Scholar] [CrossRef]
  20. Hakanson, L. An ecological risk index for aquatic pollution control. A sedimentological approach. Water Res. 1980, 14, 975–1001. [Google Scholar] [CrossRef]
  21. Teng, D.; Cui, Z.; Yuan, X.; Zhang, L. Distribution patterns and potential ecological risk evaluation of metals in the surface sediments of Beibu Gulf. Geol. Surv. China 2020, 7, 79–85. [Google Scholar] [CrossRef]
  22. Zhu, L.; Liu, Z.; Chen, B. Geochemical Background and Element Distribution in Soil in Chengdu, Sichuan. J. Sichuan Geol. 2004, 24, 159–164. (In Chinese) [Google Scholar]
  23. Ji, D.; Ma, J.; Xue, J.; Wu, X.; Wang, Z.; Wei, S. Identifying groundwater characteristics and controlling factors in Jiaozhou Bay’s northern coastal region, China: A combined approach of multivariate statistics, isotope analysis, and field empirical investigations. Sci. Rep. 2024, 14, 23856. [Google Scholar] [CrossRef]
  24. Alshahrani, M.; Ahmad, M.; Laiq, M.; Nabi, M. Geostatistical analysis and multivariate assessment of groundwater quality. Sci. Rep. 2025, 15, 7435. [Google Scholar] [CrossRef]
  25. Chen, Z.; He, J.; He, B.; Chu, Y.; Xia, Q. A new approach combining principal component factor analysis and k-means for identifying natural background levels of NO3-N in shallow groundwater of the huaihe river basin. Sci. Total Environ. 2024, 957, 177120. [Google Scholar] [CrossRef] [PubMed]
  26. Xu, M.; Bao, B.; Chen, C.; Wang, Y.; Gao, F.; Yu, X. Assessment of Metals Pollution and Human Health Risk of Surface Waters in the City of Ningbo, China. Environ. Sci. 2018, 39, 729–737. [Google Scholar] [CrossRef]
  27. Sheng, D.; Meng, X.; Wen, X.; Wu, J.; Yu, H.; Wu, M. Contamination characteristics, source identification, and source-specific health risks of metals(loid)s in groundwater of an arid oasis region in northwest china. Sci. Total Environ. 2022, 841, 156733. [Google Scholar] [CrossRef] [PubMed]
  28. Yang, Y.; Lu, X.; Fan, P.; Yu, B.; Wang, L.; Lei, K.; Zuo, L. Multi-element features and trace metal sources of road sediment from a mega heavy industrial city in north china. Chemosphere 2023, 311, 137093. [Google Scholar] [CrossRef]
  29. Ahmed, S.; Khurshid, S.; Qureshi, F.; Hussain, A.; Bhattacharya, A. Heavy metals and geo-accumulation index development for groundwater of Mathura city, Uttar Pradesh. Desalination Water Treat. 2019, 138, 291–300. [Google Scholar] [CrossRef]
  30. Jiang, X.; Peng, H.; Pan, Y.; Zeng, M.; Xue, Z.; Zhang, R. Source Determination and Health Risk Assessment of Heavy Metals in Groundwater of Guangzhou. Environ. Sci. 2025, 1–18. [Google Scholar] [CrossRef]
  31. Wang, W.; Liu, W.; Xu, Y.; Zhou, S.; Yang, F. Heavy Metal Pollution Sources Analysis and Health Risk Assessment of Groundwater in Lingjiang Basin. Resour. Environ. Eng. 2025, 1–10. Available online: https://link.cnki.net/urlid/42.1736.P.20250114.1436.006 (accessed on 14 January 2025).
  32. Triassi, M.; Cerino, P.; Montuori, P.; Pizzolante, A.; Trama, U.; Nicodemo, F.; D’Auria, J.L.; Vita, S.D.; Rosa, E.D.; Limone, A. Heavy Metals in Groundwater of Southern Italy: Occurrence and Potential Adverse Effects on the Environment and Human Health. Int. J. Environ. Res. Public Health 2023, 20, 1693. [Google Scholar] [CrossRef] [PubMed]
Disclaimer/Publisher’s Note: The statements, opinions and data contained in all publications are solely those of the individual author(s) and contributor(s) and not of MDPI and/or the editor(s). MDPI and/or the editor(s) disclaim responsibility for any injury to people or property resulting from any ideas, methods, instructions or products referred to in the content.

Article Metrics

Citations

Article Access Statistics

Multiple requests from the same IP address are counted as one view.