Article

Comprehensive Cross-Sectional Study of the Triglyceride Glucose Index, Organophosphate Pesticide Exposure, and Cardiovascular Diseases: A Machine Learning Integrated Approach

1
Nantong Key Laboratory of Environmental Toxicology, Department of Occupational Medicine and Environmental Toxicology, School of Public Health, Nantong University, Nantong 226019, China
2
Nantong Hospital to Nanjing University of Chinese Medicine, Nanjing 210023, China
*
Authors to whom correspondence should be addressed.
These authors contributed equally to this work.
Toxics 2025, 13(2), 118; https://doi.org/10.3390/toxics13020118
Submission received: 10 January 2025 / Revised: 27 January 2025 / Accepted: 30 January 2025 / Published: 1 February 2025

Abstract

:
Using NHANES data from 2003 to 2008, 2011 to 2012, and 2015 to 2020, we examined the relationship between urinary organophosphate pesticide (OPP) metabolites and the triglyceride glucose (TyG) index. The TyG index evaluates insulin resistance, a crucial factor in metabolic diseases. Linear regression analyzed urinary metabolites in relation to the TyG index and OPPs. An RCS (restricted cubic spline) model explored the nonlinear relationship of a single OPP metabolite to TyG. A weighted quantile regression and quantile-based g-computation assessed the impact of combined OPP exposure on the TyG index. XGBoost, Random Forest, Support Vector Machines, logistic regression, and SHapley Additive exPlanations models investigated the impact of OPPs on the TyG index and cardiovascular disease. Network toxicology identified CVD targets associated with OPPs. This study included 4429 participants based on specific criteria. Linear regression analysis indicated that diethyl thiophosphate was positively correlated with the TyG index. The positive correlation between OPP metabolites and the TyG index at low to moderate concentrations was confirmed by WQS and QGC analyses. The machine learning results aligned with traditional statistical findings. Network toxicology identified PTGS3, PPARG, HSP40AA1, and CXCL8 as targets influenced by OPPs. OPP exposure influences IR and cardiometabolic health, highlighting the importance of public health prevention.

1. Introduction

Organophosphorus pesticides (OPPs) are commonly utilized in farming, mostly highly or moderately toxic (some low toxic), and used to control pests, increase yield, and improve food nutrition. OPPs represent 34% of worldwide pesticide usage, and around 50,000 tons of OPPs are used annually in the United States [1]. According to a report issued by the World Health Organization and the United Nations Environment Programme (UNEP), globally, 3 million individuals are poisoned due to exposure to OPPs and similar substances, and 200,000 people succumb to such poisoning, with the majority being in developing countries. Exposure to OPPs and their metabolites primarily occurs via contaminated water and food [2]. Once the concentration of OPPs within the body reaches a certain level concerning the nervous system, it may potentially trigger Alzheimer’s disease (AD) [3] and Parkinson’s disease, among others [4]. It may also induce diabetes and metabolic disorders in the metabolic system [5,6].
Additionally, it may also lead to cardiovascular diseases (CVD) [7], and in extreme cases, it may even initiate cancer (including brain cancer, breast cancer, prostate cancer, bladder cancer, and colon cancer) [8,9,10]. In addition, studies have shown that the exposure of mice to pesticides is associated with disorders such as endocrine disruption, insulin resistance (IR), non-alcoholic fatty liver disease, and CVD [11,12]. IR constitutes the core link of metabolic disorders and is closely associated with diseases such as obesity, diabetes, and hypertension [13]. However, there are still relatively few studies on the changes between exposure to OPPs and IR, as well as on the indirect reflection of their direct relationship with cardiovascular diseases and metabolic syndrome. Consequently, research that connects OPP exposure to human cardiovascular and metabolism-related diseases holds significant research value.
IR refers to a condition marked by a reduced sensitivity and reaction to insulin [14]. Research has indicated that IR and related diseases are intimately associated with the occurrence of cardiovascular diseases [15]. Additionally, IR is acknowledged as a contributing factor to disease and a sign of unfavorable outcomes in individuals with CVD. Most conventional insulin resistance metrics, including the Homeostatic Model Assessment (HOMA) [16], Quantitative Insulin Sensitivity Check Index (QUICKI) [17], and Matsuda Insulin Sensitivity Index (MATSUDA) [18], are based on fasting plasma insulin levels. This method of determination has various constraints in clinical practice: (1) the levels of insulin in the plasma vary depending on how long the fasting period lasts; (2) interference related to hemolysis is prevalent; and (3) it is not a reliable measure for individuals with chronic diabetes and diminished insulin production. The triglyceride glucose (TyG) index has been recently suggested as a novel alternative for assessing insulin resistance. Multiple research studies have shown that its effectiveness in assessing IR is comparable to or better than that of HOMA-IR [19,20]. Furthermore, it has been found that the TyG index is associated with CVD [21,22], along with unfavorable clinical results in individuals experiencing acute coronary syndrome (ACS), heart failure (HF), ischemic stroke, and similar conditions. In most current studies, the TyG index is mostly used as a baseline indicator, covariate, or independent variable to explore the relationship with the corresponding outcome events. However, in this study, this index is used as an outcome indicator to reflect the impact on the body after OPP exposure [23,24,25].
At present, numerous studies have been conducted on OPPs and their metabolites. Guo et al. examined the relationship between OPP exposure and diabetes risk among American adults. The research findings suggest a positive correlation between OPP exposure and diabetes, indicating a possible linear trend between diethyl phosphate (DEP) levels and adult diabetes prevalence, with Bayesian Kernel Machine Regression (BKMR) results also supporting a positive correlation between mixed OPP metabolites and diabetes [26]. F. Glover and others studied the effect of OPP exposure on male erectile dysfunction (ED). Research has shown that being exposed to 3,5,6-trichloro-2-pyridinol (TCPy) correlates with a higher likelihood of ED in men [27]. At the same time, there is a wealth of studies regarding the TyG index. Qin Zhang and colleagues investigated the impact of the TyG index on patients with cardiovascular disease along with diabetes or prediabetes. The study indicates that among Americans with CVD and diabetes or prediabetes, the initial TyG index displays a U-shaped relationship with overall CVD mortality, highlighting its significance in prediction [28]. Pei et al. explored the connection between the TyG index and the quality of sleep. The research reveals that TyG has a moderate correlation with HOMA-IR (Spearman r = 0.51) and that a higher TyG index is linked to an increased occurrence of sleep disorders [29]. However, when considering previous cross-sectional studies of the population, relatively few investigations have utilized the TyG index as an outcome indicator to reflect the body’s metabolism and cardiovascular health to a certain degree. Hence, this study aims to fill this void and explore the correlation between OPPs, a common exposure, and the TyG index.
To summarize, we analyzed data from the National Health and Nutrition Examination Survey (NHANES) covering the epidemic cycles from 2003 to 2008, 2011 to 2012, 2015 to 2016, and 2017to 2020 to investigate the connection between exposure to OPPs and the TyG index. In this research, a weighted logistic regression model alongside a restricted cubic spline (RCS)–nonlinear model was used to investigate the impact of a single OPP on the TyG index. Furthermore, a weighted quantile and regression (WQS) model along with the quantile-based g-computation (QGC) method were utilized to assess the impact of mixed OPPs on the TyG index. Additionally, our research utilizes machine learning modeling along with the SHapley Additive exPlanations (SHAP) technique to obtain a deeper insight into the relationship between exposure to OPPs and alterations in the TyG index, as well as the associated diseases behind the changes in the index. Finally, this study employed a network toxicology analysis to investigate potential mechanisms linking exposure to OPPs with diseases associated with the TyG index.

2. Materials and Methods

2.1. Participant Group

NHANES is a continuous cross-sectional study aimed at evaluating the nutritional and health status of the civilian population in the United States. Every two years, a new cycle of NHANES was conducted with about 10,000 participants, and sociodemographic characteristics, health questionnaire data, body measurement, and biological samples tests were collected. Every participant gave their written informed consent before the study began.
Initially, we included a total of 65,906 study participants from six publicly available survey cycles (2003–2008, 2011–2012, 2015–2020). Subsequently, we excluded (1) 29,440 participants with age <20 years, (2) 25,686 participants without available data for urine OPs and TyG index, and (3) 6351 participants with covariates missing. Ultimately, 4429 participants were kept for the final correlation analyses.

2.2. Evaluation of the TyG Index

The TyG index is a numerical assessment of insulin resistance, determined by merging fasting blood glucose concentrations with triglyceride levels. Blood samples were collected from participants at baseline to measure fasting blood glucose (FSG) and triglyceride levels. The TyG index is determined using the formula TyG index = Ln [fasting TG (mg/dL) × fasting glucose (mg/dL)/2].

2.3. Condition of the Exposure

Urinary biomarker data for OPPs are provided in the Organophosphate Insecticides—Dialkyl Phosphate Metabolites—Urine section of the NHANES database. Six common urinary OPPs were covered, specifically dimethyl phosphate (DMP), diethyl phosphate (DEP), dimethyl thiophosphate (DMTP), diethyl thiophosphate (DETP), diethyl dithiophosphate (DEDTP), and dimethyl dithiophosphate (DMDTP). The data from the six cycles were combined, and only metabolites of OPPs with a detection rate of not less than 50%, i.e., DMP, DEP, DMTP, and DETP, were retained for subsequent statistical analysis (Table S1). For measurements falling below the lower limit of detection (LOD), the LOD divided by the square root of 2 was utilized as a substitute. In this assessment, a correction was applied utilizing creatinine, which was determined by dividing the concentration of OPPs by the level of urinary creatinine [30]. In addition, the NHANES Laboratory/Medical Technician Procedures Manual (LPM) provides more detailed information on the collection, measurement, and processing instructions for participant urine samples.

2.4. Covariates

The chosen covariates comprised sociodemographic information such as age, gender, marital status, race/ethnicity, the household poverty-to-income ratio, and education level. The anthropometric measures included body mass index (BMI), while personal behavioral factors considered were smoking status. Additionally, the status of chronic diseases was taken into account, including hypertension, diabetes mellitus, and cardiovascular disease. Information on age and gender was obtained from NHANES demographic data, while data on BMI, smoking status, and chronic diseases were obtained from questionnaires. The final sample size for inclusion was 4429 items. Race/ethnicity was classified into categories such as Mexican American, Other Hispanic, Non-Hispanic White, Non-Hispanic Black, and Other. Gender was divided into two groups: male and female. The educational attainment was classified into three groups: high school, below high school, and above high school. Household poverty income ratios (PIRs) were divided into three categories: low income (≤1.3), moderate income (1.3–3.5), and high income (≥3.5). Smoking status was transformed into categorical variables, i.e., smokers vs. non-smokers. Hypertension, diabetes, and cardiovascular disease were identified by self-reported medical history. For example, individuals who were told that they had hypertension were identified as hypertensive; individuals who self-reported diabetes were identified as diabetic. Body mass index (BMI) and age were treated as continuous variables.

2.5. Data Analysis

Continuous variables are expressed as means ± standard deviation, and the comparison of participant characteristics is conducted using Student’s t-test. Categorical covariates are shown as percentages and chi-square tests are used for comparisons. The creatinine-corrected urine OPP concentration data are processed by applying a logarithmic transformation to form a normal distribution. Pearson correlation coefficients are determined for OPP levels.
OPPs are categorized into quartiles, and three linear regression models are created to compute the β coefficient along with the associated 95% confidence intervals (CIs) to evaluate the relationship between OPPs and the TyG index. Model 1 does not account for any covariates. Model 2 expands upon Model 1 by additionally adjusting for the factors of age, gender, education level, marital status, race, and PIR value. Model 3 expands on Model 2 by also accounting for the impact of smoking, BMI, diabetes, hypertension, and cardiovascular disease. At the same time, a restricted cubic spline model featuring four knots is utilized to assess nonlinear relationships between each OPP and the TyG index.
To assess the overall impact of the four OPPs on the TyG index and the individual contribution of each OPP, a weighted quantile sum (WQS) regression analysis is employed to ensure that all selected OPPs in the model exhibit the same direction of effect on the TyG index. The WQS regression model assumes that the effects of all environmental exposures on outcomes are directionally consistent and linear and have a superimposed effect. In order to more comprehensively explore the relationship between OPPs and the TyG index, we have turned to a quantile-based g-calculation (QGC) approach. This method not only retains the straightforward logic of the WQS model but also integrates the adaptability of g-calculation, which can evaluate the cumulative impacts of various chemicals acting in diverse ways [31]. Statistical evaluation is conducted with R software (version 4.4.0). The “ggplot2” package, “gwqs” package, and “qgcomp” package are utilized to explore linear regression, WQS analysis, and QGC analysis, respectively. A significance level of p < 0.05 (two-sided) is established.

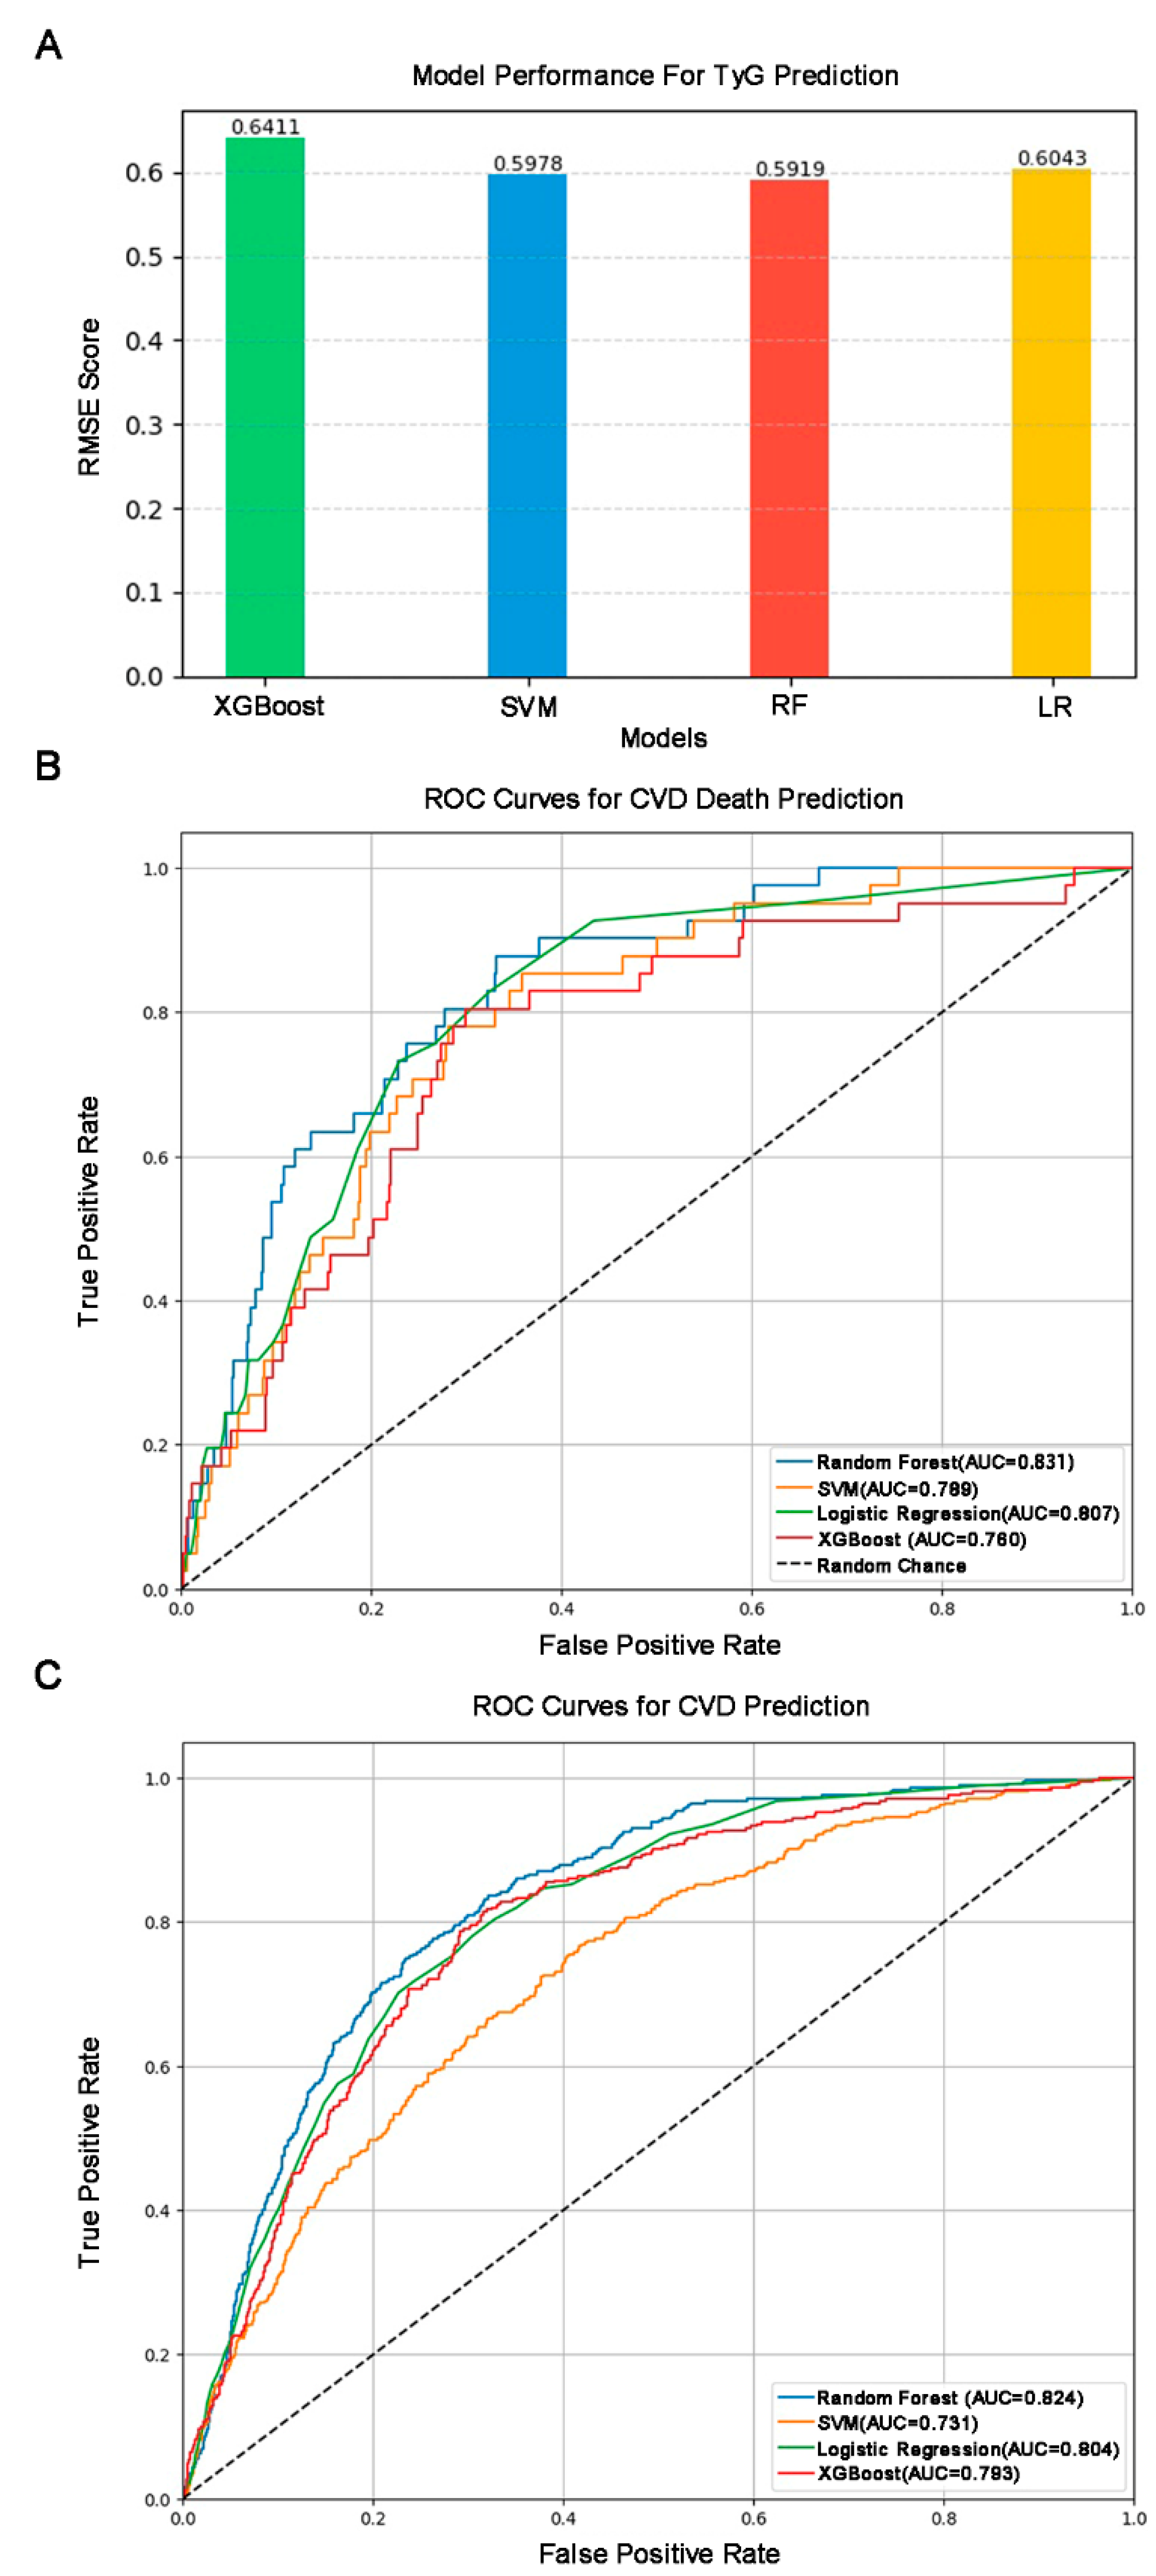
2.6. Machine Learning Analysis

Two previous population-level studies have demonstrated a correlation between organophosphate exposure and changes in the triglyceride glucose index with the development of CVD [32,33]. Consequently, the present study, which explores the correlation between organophosphate pesticide exposure and changes in the triglyceride glucose index, also sought to employ advanced machine learning models to enhance the comprehension of the effects of organophosphate pesticides on metabolism and cardiovascular disease. So, several algorithms are prominent when constructing machine learning models to understand the interaction among OPPs, TyG, and CVD-related health issues. XGBoost and Random Forest (RF), both ensemble methods, offer high accuracy and robustness by combining multiple decision trees. Support Vector Machines (SVMs) excel at classification tasks by finding optimal hyperplanes to separate data points. Finally, logistic regression (LR), a linear model, provides probabilistic predictions suitable for binary classification for CVD, CVD-related death, and the regression task of the TyG index. The choice of algorithm depends on the dataset distribution, with considerations for interpretability, computational cost, and desired prediction accuracy.

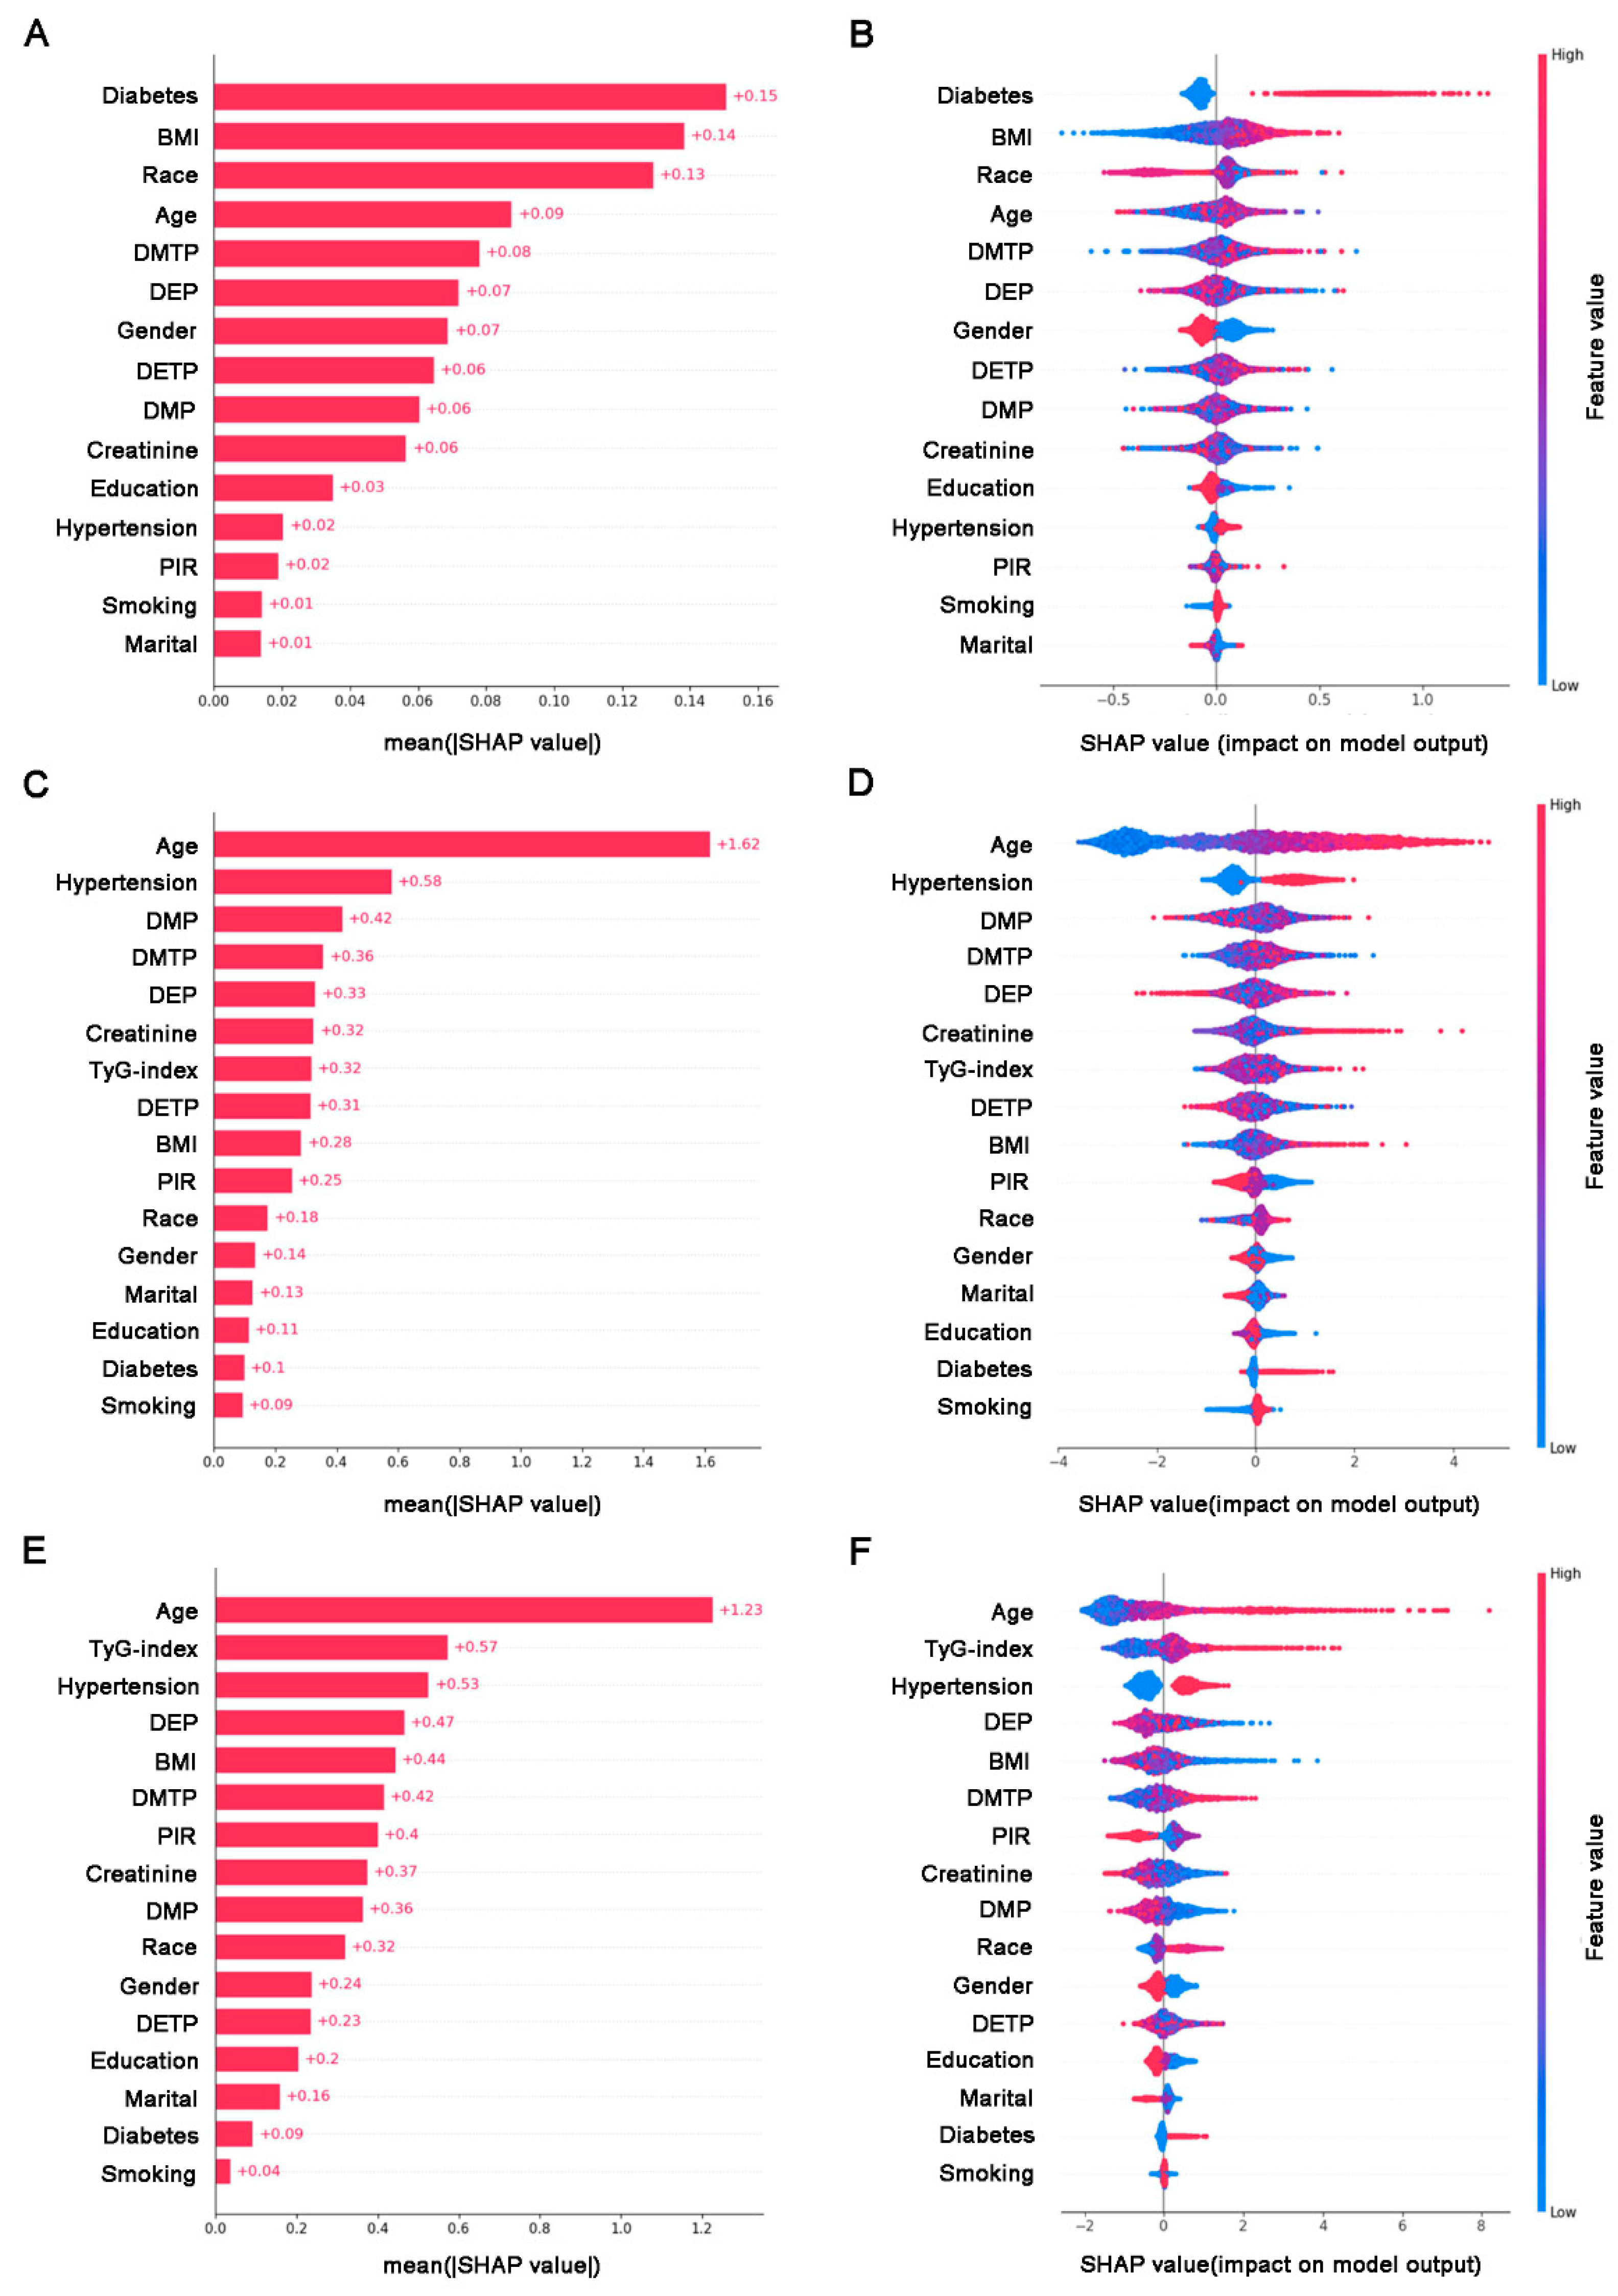
2.7. SHAP Interpretable Analysis

To enhance the interpretability of our machine learning models, we employ SHapley Additive exPlanations (SHAP). SHAP values provide insights into the contribution of each feature (OPPs, TyG index, age, BMI, etc.) to the model’s prediction for individual patients. This allows us to understand not only which factors are most influential in predicting CVD risk or the TyG index but also the direction and magnitude of their effects. For instance, SHAP can reveal whether higher OPP levels increase or decrease the likelihood of CVD and how this relationship varies across different patient subgroups. This interpretability is crucial for clinicians to trust and apply the model’s predictions in real-world healthcare settings, facilitating personalized risk assessment and treatment strategies.

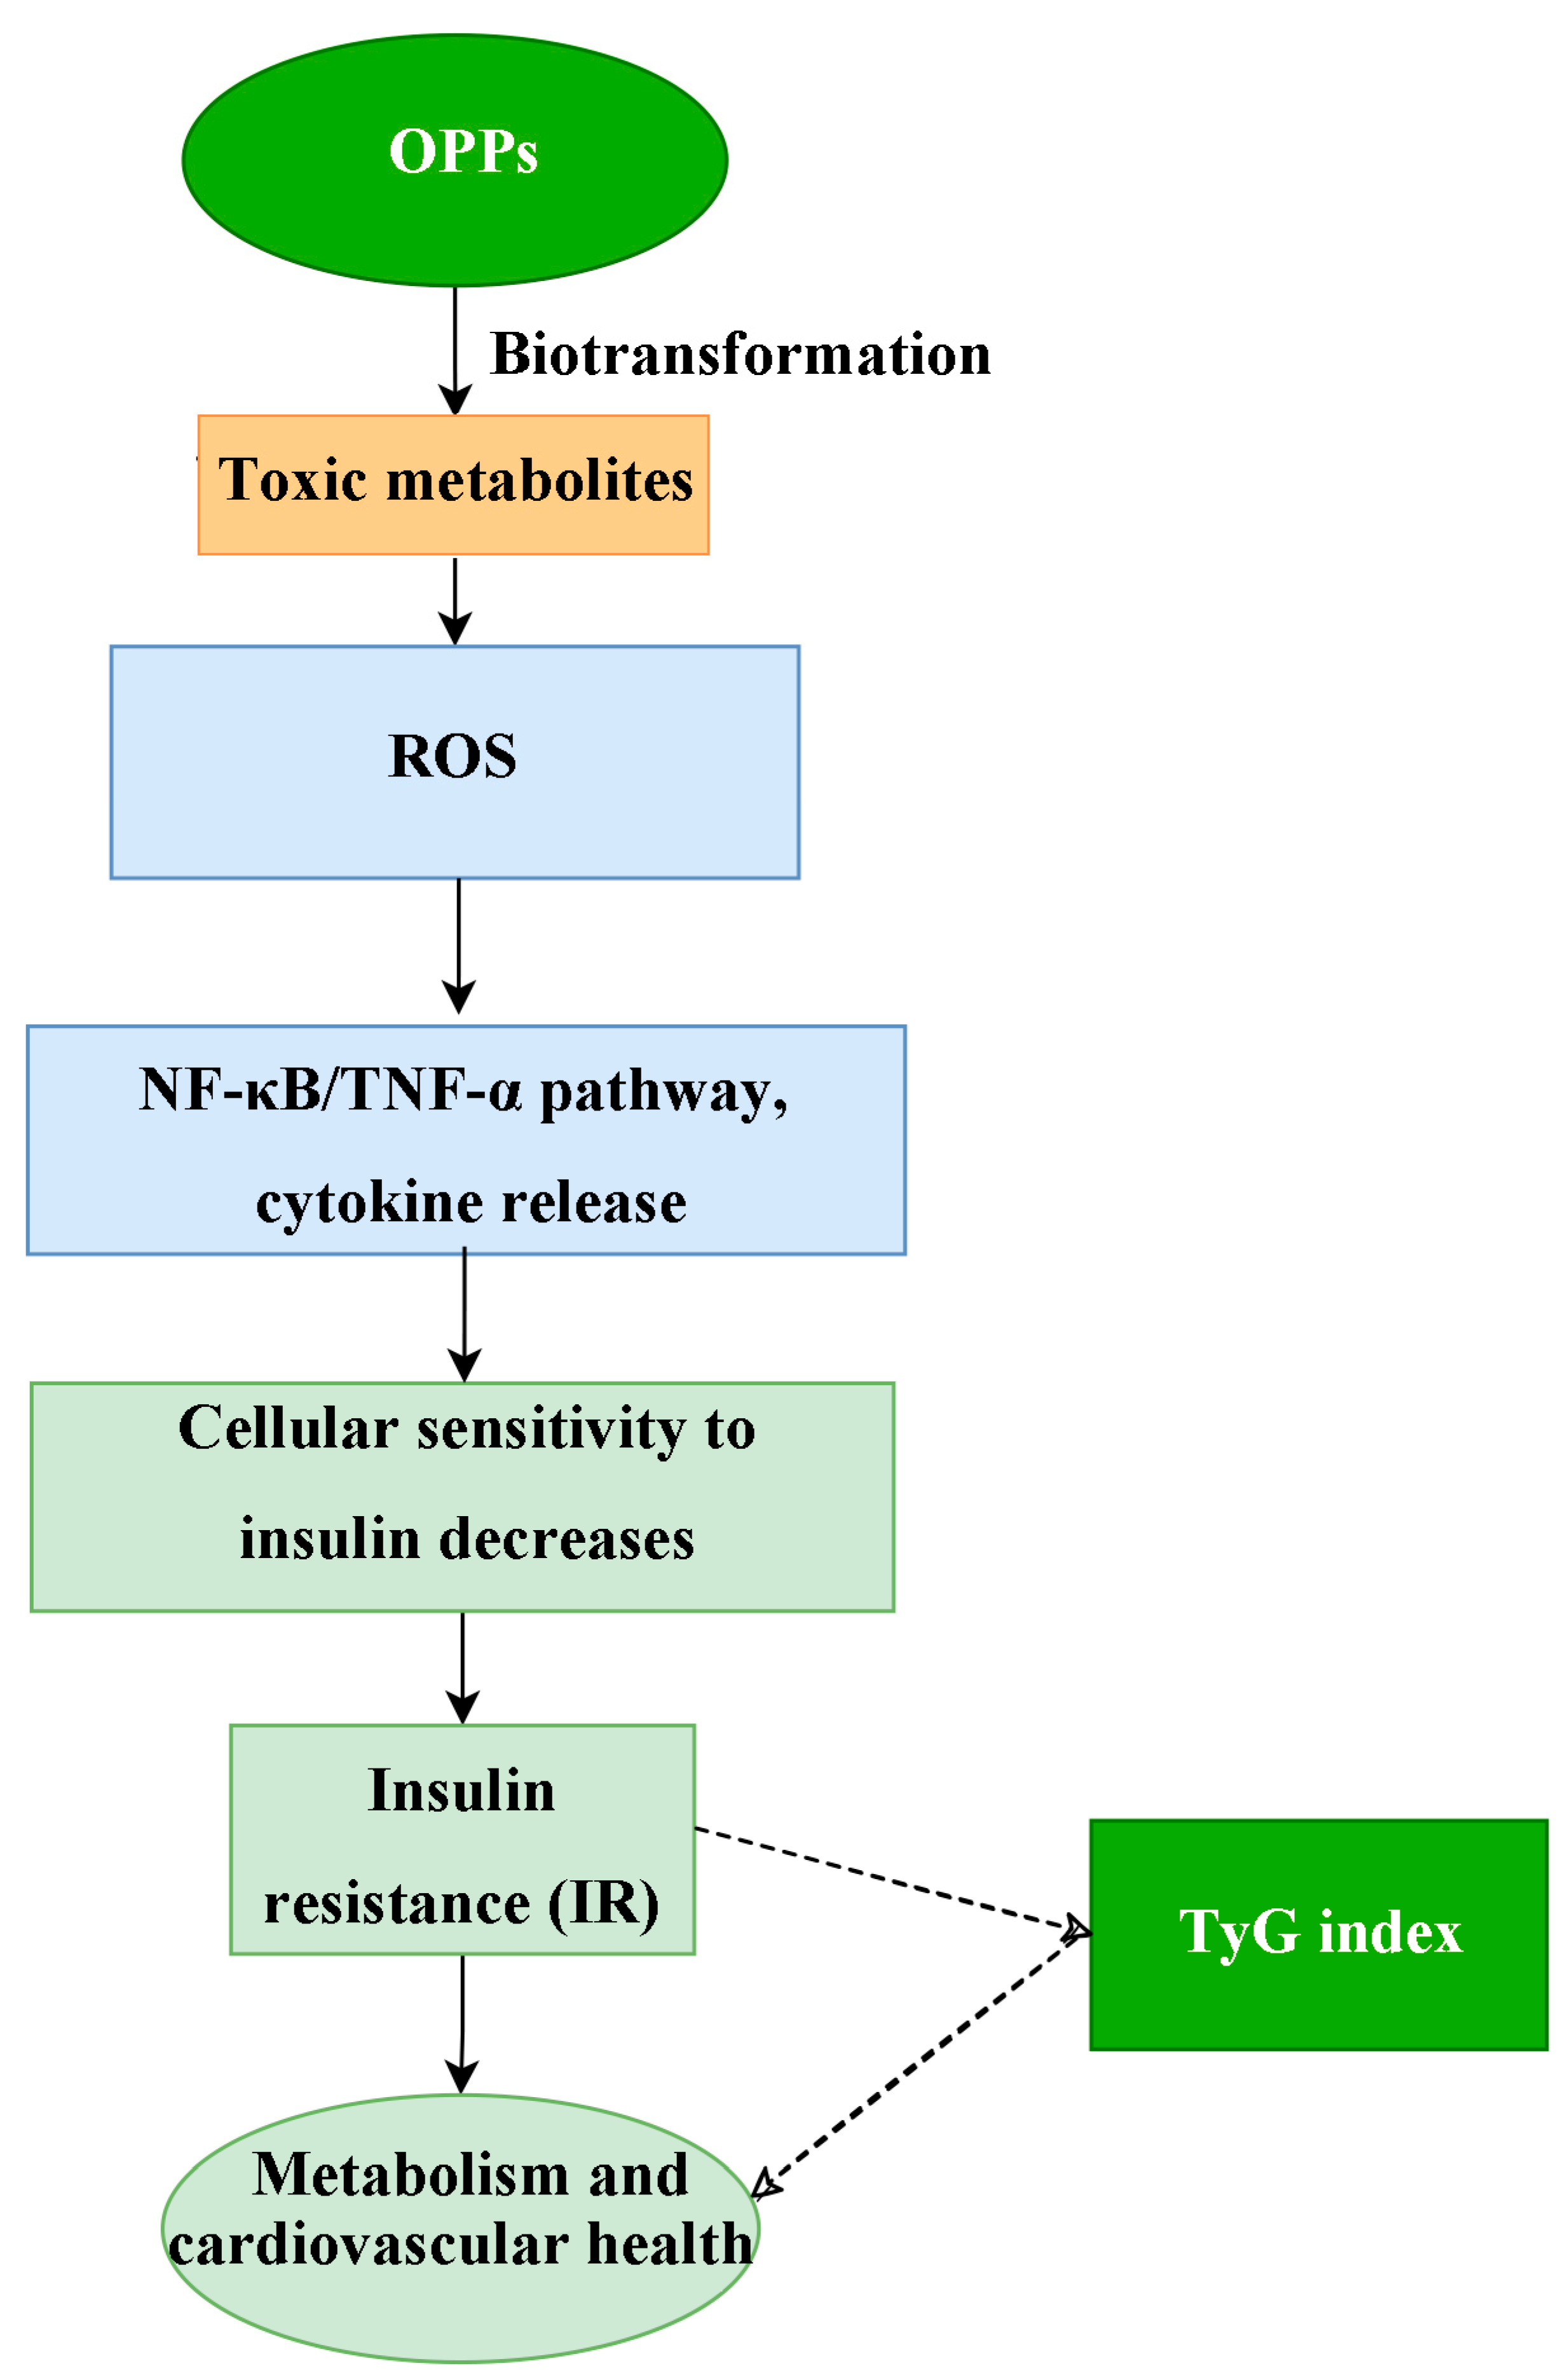
2.8. Network Toxicology Analysis

The possible targets for OPPs were predicted with SwissTargetPrediction [34], and a search was performed in the GeneCards database [35] for protein targets linked to cardiovascular disease using the term “cardiovascular disease”. Venn diagrams were created using pertinent websites, and the overlapping genes derived from these diagrams were input into the STRING database [36] to build protein–protein interaction (PPI) models [37]. Afterward, the identified key intersections were evaluated using eight different topological metrics: Maximal clique centrality (MCC), Maximum neighborhood component (MNC), Degree, Edge percolated component (EPC), Closeness, Radiality, Betweenness, and Stress, by employing the analytics application known as cytoHubba within Cytoscape (Version 3.9.1). Simultaneously, analyses of the overlapping genes identified in Venn diagrams using the Kyoto Encyclopedia of Genes and Genomes (KEGG) and Gene Ontology (GO) were conducted utilizing the R software package (“org.Hs.eg.db”, “clusterProfiler”, and “DOSE”).

3. Results

3.1. Description of Study Participants

The overall features of the study group are summarized in Table 1. The study included 4429 American adults, comprising 2183 (49.3%) men and 2246 (50.7%) women. Most of the participants were aged 60 or below (68.9%), non-Hispanic white (42.8%), with a PIR > 1.3 (70.2%), an average BMI of 28.22 kg/m2, married (60.4%), smokers (74.8%), and the majority (75.9%) had an educational level of high school or above. Moreover, when comparing the group with a higher TyG index to the one with a lower index, there were statistically significant differences noted in terms of gender, age, educational attainment, marital status, race, body mass index (BMI), hypertension, diabetes, and cardiovascular disease status (Table 1). The highest detected concentration in urine was 13.73 ng/cg for DEP, followed by 11.57 ng/cg for DMP, 9.97 ng/cg for DMTP, and finally the lowest was 2.76 ng/cg for DETP.

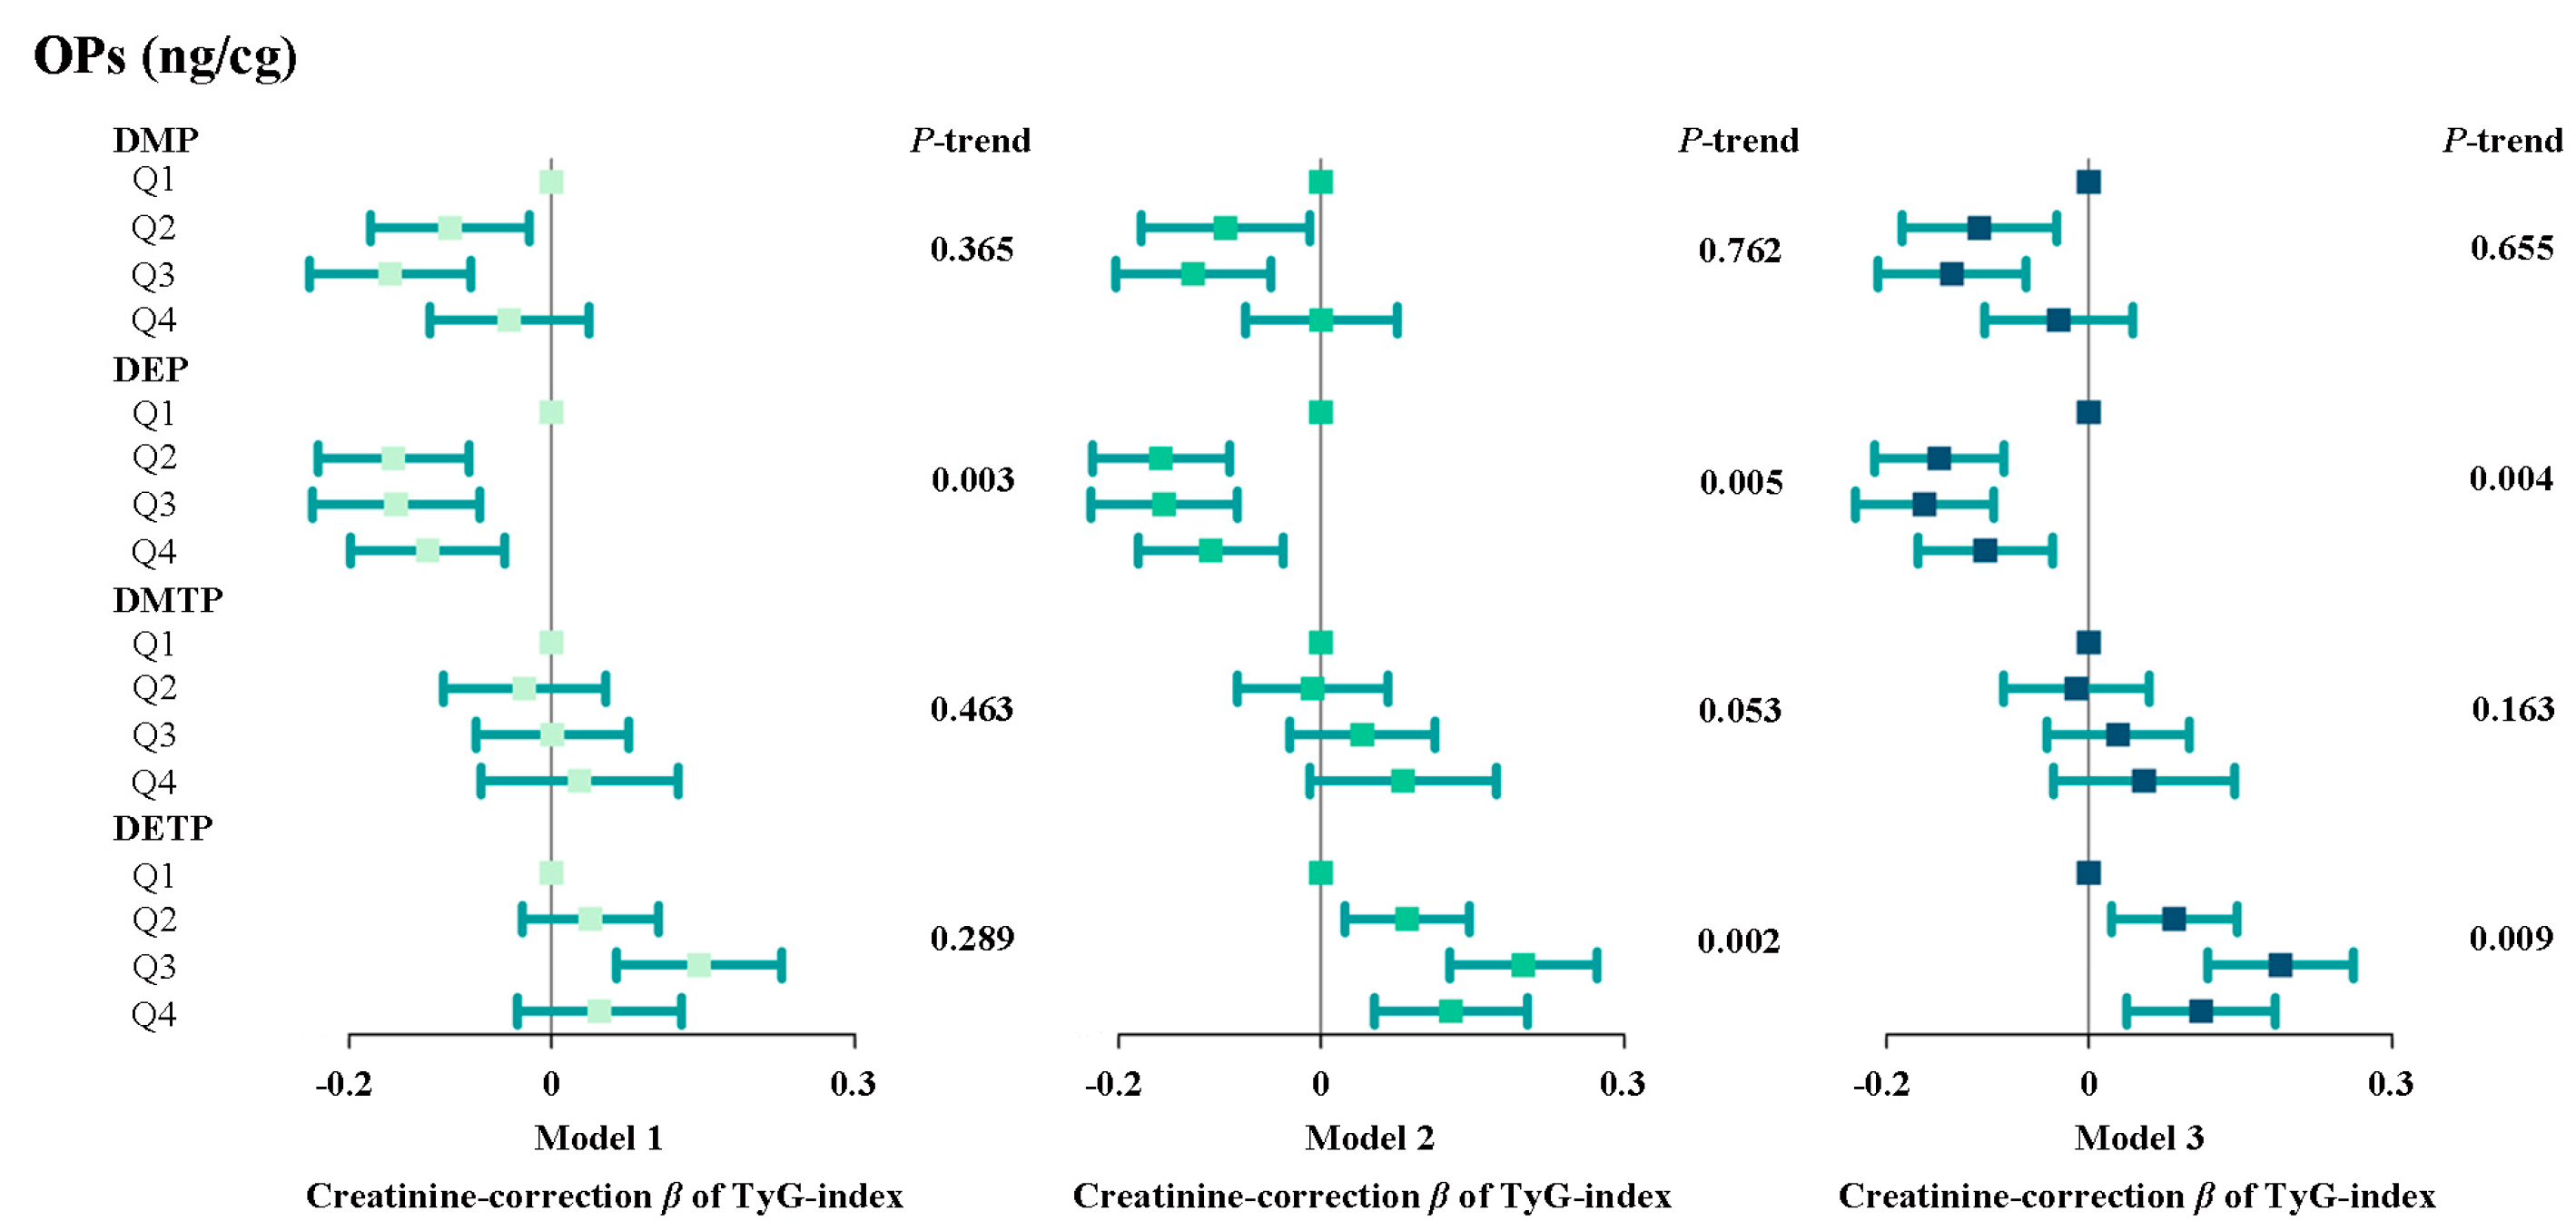
3.2. The Relationship Between Individual Urinary Metabolites of Organophosphate Pesticides and the Tyg Index

Figure 1 shows the results of the linear regression model adjusted for different covariates. This model evaluates the association between DMP, DEP, DMTP, DETP, and the TyG index. As shown in Model 1, in the initial model, compared with the low concentration (Q1), the TyG index of the medium and high concentration groups of the four OPP metabolites mostly shows an upward trend. As shown in Model 2, the DETP concentration is positively correlated with the TyG index. In comparison to Q1, the indices for groups Q2, Q3, and Q4 exhibit a rising trend, and this trend is statistically significant. In the comprehensive Model 3, DETP continues to show a significant positive association with the TyG index and higher DMTP levels are linked to an elevation in the TyG index.

3.3. Dose–Response Curve Between Opp Metabolites and Tyg Index

Furthermore, we further evaluated the dose–response relationship between individual OPP metabolites and the TyG index (Figure 2). The RCS analysis and logistic regression yielded similar results. The RCS analysis shows that there is a significant nonlinear relationship between OPP concentrations (except DMTP) and the TyG index (p for nonlinearity < 0.05, Figure 2). For DETP and the TyG index, we observed a nonlinear dose–response curve characterized by an initial increase and then a gradually decreasing slope. In addition, DMP and DEP have an obvious U-shaped relationship with the TyG index. Generally speaking, in the medium and low concentration range, the concentration of OPP metabolites is significantly positively correlated with the TyG index.

3.4. The Relationship Between Mixtures of Urinary Organophosphate Pesticide Metabolites and the Tyg Index

The interactive relationships among OPP metabolites were examined, and the Pearson correlation among these metabolites was analyzed, with the results presented in Figure S2. There are some interaction phenomena in DMP, DEP, DMTP, and DETP, indicating that the potential co-exposure patterns and multicollinearity among these OPP metabolites cannot be avoided in the conventional regression model. Consequently, we employ the WQS regression model and the QGC model to investigate the possible effects of co-exposure to OPPs, and the results are illustrated in Figure 3. In our examination, we modeled the upward trend of the WQS index and found a notable positive correlation between the WQS index and the TyG index (p < 0.001). In terms of the total effect of mixed exposure, the ranking weights of OPP metabolites show that DMTP (54.7%) and DETP (44.0%) are significant factors affecting the TyG index (Figure 3B). When the analysis is restricted to the negative direction, no significant association is observed in the overall population. In addition, the QGC analysis showed that an increase in the concentration of mixed OPP metabolites was associated with an increase in the TyG index (Figure 3A). Both DMTP and DETP show a positive correlation with the TyG index, which aligns with the findings of the WQS index.

3.5. Model Construction and SHAP Interpretable Result

The regression task for the TyG index was performed with standard preprocessing data pipelines. The XGBoost was trained as the Root Mean Square Error (RMSE) with 0.641. The SVM obtains the RMSE with 0.597. The logistical regression has an RMSE of 0.604. The RF demonstrated the highest performance, showing an RMSE of 0.597 (Figure 4A). Regarding the prediction of CVD, XGBoost achieves an AUC (Area Under the Curve) of 0.793. The SVM records an AUC of 0.731. RF delivered the highest performance with an AUC of 0.824. The LR also demonstrates strong performance, with an AUC of 0.804 (Figure 4B). For the third prediction task, the CVD-related deaths among the four models had over 0.75 performance, while the RF achieved the best AUC performance at 0.831(Figure 4C). To enhance the clarity and model reliability, we recorded the specific model hyperparameter results (Table S2). The DeLong test for the pairwise comparison of different ROCs in Figure 4B,C was performed in fastDeLong. In Table S3, Random Forest (RF) attained the highest AUC (0.831) for predicting CVD mortality. Pairwise comparisons using DeLong’s test revealed that RF significantly outperformed SVM (p = 0.010) and XGB (p = 0.001), as indicated by the positive differences in the AUC (0.042 and 0.051, respectively) and 95% confidence intervals that did not include zero. Although RF showed a higher AUC than LR, the difference was not statistically significant (p = 0.123). Additionally, there were no significant differences among the remaining comparisons (SVM vs. LR, SVM vs. XGB, LR vs. XGB), indicating relatively similar performance among these models. As shown in Table S4, RF again achieved the highest AUC (0.824), with a significantly better performance than SVM (p = 0.0001) and XGB (p = 0.032). However, its advantage over LR was not significant (p = 0.186). Notably, SVM was significantly outperformed by LR (p = 0.0003) and XGB (p = 0.0016), reflecting a lower predictive performance for SVM on general CVD outcomes. The difference between LR and XGB was not statistically significant (p = 0.436). Overall, these results highlight the consistent strong performance of RF across both CVD mortality and broader CVD outcomes, with LR and XGB providing competitive AUC values in certain comparisons.
To interpret the association among TyG, OPPs, and CVD-related health issues, we first deployed SHAP to reveal the correlation between OPPs and the TyG index. As matched by the statistical analysis, the OPPs have a positive relationship with the TyG index. In detail, DMTP has the highest ranking among all OPPs, contributing to higher exposure as the TyG index increases (Figure 5A,B). Furthermore, the game theory-based association between OPPs and CVD diseases with the background of significant factors are hypertension, BMI, and TyG index. The DMP, DMTP, and DEP have higher CVD rankings than the TyG index (Figure 5C,D). In the end, we explore the correlation between OPP exposure and CVD-related death based on the SHAP theory. DMTP has a positive correlation with CVD-related deaths. DEP and DMTP have a negative effect on CVD-related deaths (Figure 5E,F).

3.6. Details About Mechanisms and Targets

To gain a deeper insight into how OPPs, particularly DETP, affect cardiovascular-related diseases, we conducted functional enrichment analysis and built a PPI network at the convergence of OPP targets and proteins associated with cardiovascular diseases. We identified 59 target proteins by comparing the results from the Swisstargetprediction and Genecard databases (Figure S3A). The details of the KEGG and GO enrichment analysis results are presented in Figures S3B,C. Moreover, a protein–protein interaction (PPI) network featuring overlapping targets was established using the STRING database, as shown in Figure S3D. This network comprises 59 nodes and 150 edges, where each protein is illustrated as a node, and every edge symbolizes an interaction. The significance of overlapping targets within the interaction network was assessed using different algorithms available in Cytoscape software, such as MCC, MNC, Degree, EPC, Closeness, Radiality, Betweenness, and Stress. Utilizing the previously discussed algorithms, the overlapping targets were evaluated and prioritized, and the top five scoring proteins from each algorithm were recognized as potential targets for OPPs. Possible targets for OPPs might be further anticipated by intersecting candidate targets found through the eight algorithms, with key proteins identified through this approach, including PTGS3, PPARG, HSP90AA1, and CXCL8 (Figure S3E).

4. Discussion

This representative study suggests that exposure to OPPs is most likely associated with changes in the TyG index, implying a possible link between exposure to OPPs and the development of IR and additionally indicating a link between exposure to OPPs and the onset of cardiovascular or metabolic diseases. The key conclusion of this research is that contact with OPPs could be linked to alterations in the TyG index. The restricted triple spline showed a significant U-shaped relationship between DMP and DEP and the TyG index. Moreover, our results further validated that a notable positive relationship exists between co-exposure to OPPs and the TyG index, as assessed through the WQS model and QGC. This result was validated even after adjusting for other covariates. Meanwhile, Ashot Avagimyan et al. and Seyed Ali Nabipoorashrafi et al. systematically summarized the important role of the TyG index in the prevention of cardiology [38] and metabolic syndrome [39], which is seen to explore the relationship between exposure to OPPs and the TyG index, and thus indirectly predicting the relationship with the occurrence of metabolic diseases is highly feasible. To our knowledge, earlier research has not thoroughly investigated the connection between exposure to OPPs and the development of cardiovascular disease and metabolic syndrome, using the TyG index as a measure of outcomes. Consequently, this study may contribute valuable insights to this area of research.
The metabolic syndrome consists of six key elements, which are an accumulation of excess abdominal visceral fat, impaired IR or glucose tolerance, atherogenic dyslipidemia, increased blood pressure, and states that are pro-inflammatory and pro-thrombotic [40,41], which result in the manifestation of hyperlipidemia, diabetes mellitus, hypertension, and obesity, and increases the risk of cardiovascular disease [42]. It has been suggested that insulin resistance could be a causative factor in the onset of metabolic syndrome, which is marked by reduced tissue sensitivity or response to circulating insulin [43]. The non-biodegradable nature of OPPs and their multiple sources (including ingestion, inhalation, and dermal contact) contribute to the frequent exposure of humans to OPPs and, thus, adverse health effects. Exposure to OPPs has been shown to induce insulin resistance, which is a key factor in the development of cardiovascular and metabolic diseases [44]. Additionally, an increase in the TyG index is an effective indicator of the severity of insulin resistance [45]. Therefore, the TyG index can serve as an indirect measure of the connection between OPP exposure and the risk of cardiovascular and metabolic diseases. For instance, a study by Ou et al. found a positive correlation between exposure to OPPs and diabetes. Specifically, the adjusted odds ratio (aOR) for prediabetes among individuals with high urine concentrations of OPPs was 1.25 (95% confidence interval: 1.08, 1.46) compared to those with low urine concentrations [46]. Additionally, several studies have indicated that individuals with elevated levels of OPPs are at a higher risk of developing hypertension. This suggests a connection between exposure to OPPs and metabolic disorders [47]. Cardiovascular disease and metabolic syndrome are the two major diseases that threaten life and health in the United States. Therefore, our research employed the TyG index to investigate the connection between exposure to OPPs and the cardiovascular and metabolic health issues associated with insulin resistance, and our findings align with those of the aforementioned studies.
Notably, increased inflammatory/oxidative stress pathways are key mechanisms by which organophosphorus pesticide exposure induces metabolic disorders such as hypertension [48]. Oxidative stress and inflammatory responses induced by OPP may then promote vasoconstriction, increase vascular resistance, lead to vascular remodeling and stiffness, and consequently lead to endothelial dysfunction, which in turn affects metabolic homeostasis such as blood pressure regulation and ultimately leads to metabolic disorders such as hypertension [49]. Specifically, animal studies have shown that exposure to chlorpyrifos (CPF), one of the most widely used and dangerous organophosphorus pesticides, induces oxidative stress in vivo [50]. Similarly, chlorpyrifos exposure leads to elevated levels of reactive oxygen species (ROS), which can disrupt cellular antioxidant defenses in vitro [51,52]. In addition, exposure to the chlorpyrifos pesticide not only triggers oxidative stress but also enhances inflammatory responses by increasing the expression of pro-inflammatory cytokine genes (IL-1β and NLRP3) or by activating the NF-κB/TNF-α pathway in both in vivo and in vitro conditions [53,54]. Exposure to OPP leads to increased oxidative stress and inflammation in the body, as shown in Figure 6. OPP raises the levels of reactive oxygen species (ROS), which disrupts the cellular antioxidant defense mechanisms and activates inflammatory signaling pathways, such as the NF-κB/TNF-α pathway. This process also raises the expression of pro-inflammatory cytokines. The resulting oxidative stress and inflammation interfere with the insulin signaling pathway by blocking the phosphorylation of insulin receptor substrates. As a result, cellular sensitivity to insulin decreases, which can lead to insulin resistance [55,56]. In addition, the TyG index is a reliable indicator of insulin resistance, a key factor in the development of cardiovascular and metabolic diseases [45,57]. From another perspective, metabolic syndrome (MetS) manifests itself clinically in part as elevated levels of visceral fat, which enters the liver through the portal system and accumulates in the liver [58]. These interactions lead to higher levels of hepatic triglycerides (TG), reduced insulin reabsorption, and metabolic irregularities that eventually contribute to heightened IR [59]. Therefore, the TyG index can indirectly indicate the relationship between exposure to organophosphate pesticides (OPPs) and cardiovascular and metabolic diseases. Meanwhile, research has indicated that the TyG index is associated with direct indicators of insulin resistance. Studies have revealed that individuals with metabolic syndrome exhibit a notably higher average TyG index compared to those without the syndrome, and it also has correlations with various other health conditions [39,60]. For instance, research has demonstrated that a rise in the TyG index within a certain range elevates the likelihood of developing type 2 diabetes mellitus (T2DM) and cardiovascular disease (CVD) [61]; Ke et al. also revealed that an increase in the TyG index among the study participants heightened both all-cause mortality and CVD-related mortality, noting that a U-shaped TyG index particularly raised the risk of all-cause mortality, with a significant impact on CVD-related deaths [62]. These investigations once more offer robust evidence for the credibility of the findings of this research.
As previously stated, being exposed to OPPs is linked to the onset of metabolic disorders, with insulin resistance being a crucial factor in this process. There is compelling evidence for a significant correlation between insulin resistance, metabolic syndrome, and cardiovascular disease [63]. Therefore, it is feasible and plausible to use the TyG index, an assay of insulin resistance, to side-by-side explore the association of OPP exposure with the development of disorders such as metabolic syndrome and impaired regulation of lipid metabolism such as CVD. In addition, pertinent research has indicated correlations between the TyG index and arterial stiffness, as well as the likelihood of cardiovascular incidents [64,65]. Simal-Mendía et al. found that a higher TyG index correlated with decreased levels of high-density lipoprotein (HDL) and elevated triglycerides (TG) [66]. Various research findings indicate that the TyG index serves as a marker for individuals who are at risk of type 2 diabetes mellitus (T2DM) and prediabetes [67,68]. The diseases mentioned are primarily cardiovascular and metabolic, highlighting a clear correlation between the TyG index and these conditions.
The TyG index is widely recognized as being positively associated with the incidence of diabetes mellitus (DM) and hypertension within metabolic disorders [69], where insulin resistance (IR) is a key factor. Presently, the high insulin orthoglycemic clamp (HEC) technique is considered the gold standard for measuring insulin resistance, although it is both invasive and time-intensive [70]. As a straightforward alternative measure of insulin resistance, numerous studies have shown that the TyG index is effective in evaluating insulin resistance and preventing associated comorbidities. From a public health perspective, particularly for high-risk groups like agricultural workers, it is important to incorporate additional indicators related to insulin resistance and metabolic disorders, such as the TyG index, into regular medical checkups. We should also raise awareness about the dangers of exposure to OPPs to enhance public understanding of the TyG index and metabolic disorders. Furthermore, it is essential to strengthen wastewater treatment and soil remediation efforts, limit pesticide use, and improve environmental monitoring and the evaluation of relevant policies and regulations. In addition, the TyG index can be utilized not only to screen for potential metabolic abnormalities but also to monitor changes during the treatment of individuals with existing metabolic diseases. This information can assist in evaluating the effectiveness of treatment programs. Finally, clinicians can implement interventions based on changes in the TyG index to help prevent the development of complications. It is anticipated that research on the TyG index in public health and related fields will become more comprehensive, with an increased number of experiments devoted to exploring the underlying molecular mechanisms of OPP exposure, changes in the TyG index, and associated diseases.
The survey possesses multiple advantages. To begin with, the population data originated from a significant adult cohort in the United States, which increases the applicability of the results. Furthermore, a blend of conventional environmental mixed exposure assessments, cutting-edge machine learning techniques, and network toxicological analysis approaches were utilized to thoroughly investigate the impact of OPP exposure on diseases related to cardiovascular health and metabolic disorders.
However, despite these advantages, some limitations should also be considered. Firstly, it is important to highlight that NHANES is an observational study, which limits the capacity to establish a causal link between exposure to OPPs and the TyG index. Accordingly, further prospective cohort studies are required. Secondly, while SHAP values can account for interactions between features to some degree, they may overlook crucial interaction information, especially in cases involving complex relationships between variables. The targets identified through network toxicology should undergo experimental validation to provide stronger evidence. Furthermore, although this study assessed the potential effects of some confounders, such as demographics, disease status, and behavioral factors, there remain unmeasured confounders that could influence the observed associations. Ultimately, this study did not concentrate on a particular disease but rather on an index that, through the changes in the index, relatively comprehensively reflects the cardiovascular and metabolic health of individuals. However, the index does not fully represent individual metabolic and cardiovascular health. It is anticipated that the association observed between exposure to OPPs and the TyG index in this study will be confirmed through experimental research. Furthermore, conducting prospective cohort studies is essential to better understand the risks associated with OPPs and to develop more effective preventive measures to mitigate or prevent these hazards.

5. Conclusions

To summarize, our research indicates that exposure to OPPs (particularly DETP) is linked to an increased TyG index, an essential metabolic marker of insulin resistance that may indicate metabolic health to some degree and has a relationship with the development of cardiovascular diseases. This study is observational and still requires experimental validation. Consequently, the findings of this research demonstrate that exposure to OPPs could influence metabolism and cardiovascular health, investigate the underlying mechanisms, and identify potential target proteins, which hold significant importance for future empirical research and public health prevention strategies. Moreover, the TyG index has proven crucial in public health practices concerning cardiovascular and metabolic diseases linked to insulin resistance.

Supplementary Materials

The following supporting information can be downloaded at: https://www.mdpi.com/article/10.3390/toxics13020118/s1, Table S1: detection rates of urine organophosphate 2003–2020; Table S2–1: comparison of XGBoost hyperparameters; Table S2–2: Random Forest hyperparameter comparison; Table S2–3: SVM (Support Vector Machine) hyperparameter comparison; Table S2–4: LR (logistic regression) hyperparameter comparison; Table S3: comparison of four CVD death prediction models; Table S4: four models’ AUC comparison in CVD prediction; Table S5: topological parameters associated with OPP targets for cardiovascular-related diseases; Figure S1: flowchart of the study population; Figure S2: Pearson correlation coefficients between urinary OPPs; Figure S3: the potential targets and mechanisms of OPPs were predicted through network toxicology analysis.

Author Contributions

X.W.: Methodology, investigation, formal analysis, writing—original draft. M.T.: Conceptualization, formal analysis, methodology, writing—original draft, visualization. Z.S.: Formal analysis, methodology. K.T.: Data Curation. Y.F.: Data Curation, methodology. Y.C.: Data Curation. J.R.: Software. S.M.: Visualization. J.D.: Software. W.X.: Methodology. M.J.: Software. X.Z.: Resources. J.Z.: Supervision, resources. J.X.: Project administration, supervision, writing—review and editing. All authors have read and agreed to the published version of the manuscript.

Funding

X.Z. was supported by the the National Natural Science Foundation of China (82173554, 82203993). J.X. was supported by the Nantong Scientific Research Project (MS2023002).

Institutional Review Board Statement

All methods were carried out in accordance with relevant guidelines and regulations. The Research Ethics Review Board (ERB) of the US National Center for Healthcare Statistics (NCHS) authorized the 2003—2020 NHANES (protocol number: Protocol #98-12, Protocol #2005-06, Protocol #2011-17 etc.) (see details at https://www.cdc.gov/nchs/nhanes/irba98.htm (accessed on 8 January 2025)). Before initiating data collection and the NHANES physical examinations, all participants provided written informed consent.

Informed Consent Statement

Not applicable.

Data Availability Statement

The data used in this study can be downloaded for free in NHANES (https://wwwn.cdc.gov/nchs/nhanes/Default.aspx (accessed on 8 January 2025)). The code will be provided as required.

Acknowledgments

The authors would like to express their sincere gratitude to all the staff and participants in this study for their important contributions, and to the staff of the National Center for Health Statistics, who designed the NHANES study and collected, managed, and released the data for public use.

Conflicts of Interest

The authors declare no conflicts of interest.

References

  1. Singh, B.K. Organophosphorus-degrading bacteria: Ecology and industrial applications. Nat. Rev. Microbiol. 2009, 7, 156–164. [Google Scholar] [CrossRef]
  2. Jaiswal, S.; Singh, B.; Dhingra, I.; Joshi, A.; Kodgire, P. Bioremediation and bioscavenging for elimination of organophosphorus threats: An approach using enzymatic advancements. Environ. Res. 2024, 252 Pt 2, 118888. [Google Scholar] [CrossRef]
  3. Frisoni, G.B.; Altomare, D.; Thal, D.R.; Ribaldi, F.; van der Kant, R.; Ossenkoppele, R.; Blennow, K.; Cummings, J.; van Duijn, C.; Nilsson, P.M.; et al. The probabilistic model of Alzheimer disease: The amyloid hypothesis revised. Nat. Rev. Neurosci. 2022, 23, 53–66. [Google Scholar] [CrossRef] [PubMed]
  4. Perrin, L.; Spinosi, J.; Chaperon, L.; Kab, S.; Moisan, F.; Ebaz, A. Pesticides expenditures by farming type and incidence of Parkinson disease in farmers: A French nationwide study. Environ. Res. 2021, 197, 111161. [Google Scholar] [CrossRef] [PubMed]
  5. Hernández-Mariano, J.Á.; Baltazar-Reyes, M.C.; Salazar-Martínez, E.; Cupul-Uicab, L.A. Exposure to the pesticide DDT and risk of diabetes and hypertension: Systematic review and meta-analysis of prospective studies. Int. J. Hyg. Environ. Health 2022, 239, 113865. [Google Scholar] [CrossRef]
  6. Javeres, M.N.L.; Habib, R.; Laure, N.J.; Shah, S.T.A.; Valis, M.; Kuca, K.; Nurulain, S.M. Chronic Exposure to Organophosphates Pesticides and Risk of Metabolic Disorder in Cohort from Pakistan and Cameroon. Int. J. Environ. Res. Public Health 2021, 18, 2310. [Google Scholar] [CrossRef] [PubMed]
  7. Zhu, S.; Zhou, Y.; Chao, M.; Zhang, Y.; Cheng, W.; Xu, H.; Zhang, L.; Tao, Q.; Da, Q. Association between organophosphorus insecticides exposure and osteoarthritis in patients with arteriosclerotic cardiovascular disease. BMC Public Health 2024, 24, 1873. [Google Scholar] [CrossRef] [PubMed]
  8. Rani, L.; Thapa, K.; Kanojia, N.; Sharma, N.; Singh, S.; Grewal, A.S.; Srivastav, A.L.; Kaushal, J. An extensive review on the consequences of chemical pesticides on human health and environment. J. Clean. Prod. 2021, 283, 124657. [Google Scholar] [CrossRef]
  9. Singh, N.S.; Sharma, R.; Parween, T.; Patanjali, P.K. Pesticide Contamination and Human Health Risk Factor. In Modern Age Environmental Problems and their Remediation; 2018; pp. 49–68. Available online: https://link.springer.com/chapter/10.1007/978-3-319-64501-8_3 (accessed on 9 September 2024).
  10. Huo, D.; Jiang, S.; Qin, Z.; Feng, Y.; Yang, R.; Lv, L.; Li, Y. Omethoate induces pharyngeal cancer cell proliferation and G1/S cell cycle progression by activation of Akt/GSK-3β/cyclin D1 signaling pathway. Toxicology 2019, 427, 152298. [Google Scholar] [CrossRef] [PubMed]
  11. Al-Eryani, L.; Wahlang, B.; Falkner, K.C.; Guardiola, J.J.; Clair, H.B.; Prough, R.A.; Cave, M. Identification of Environmental Chemicals Associated with the Development of Toxicant-associated Fatty Liver Disease in Rodents. Toxicol. Pathol. 2015, 43, 482–497. [Google Scholar] [CrossRef]
  12. Wahlang, B.; Falkner, K.C.; Gregory, B.; Ansert, D.; Young, D.; Conklin, D.J.; Bhatnagar, A.; McClain, C.J.; Cave, M. Polychlorinated biphenyl 153 is a diet-dependent obesogen that worsens nonalcoholic fatty liver disease in male C57BL6/J mice. J. Nutr. Biochem. 2013, 24, 1587–1595. [Google Scholar] [CrossRef] [PubMed]
  13. Li, M.; Chi, X.; Wang, Y.; Setrerrahmane, S.; Xie, W.; Xu, H. Trends in insulin resistance: Insights into mechanisms and therapeutic strategy. Signal Transduct. Target. Ther. 2022, 7, 216. [Google Scholar] [CrossRef]
  14. Shen, J.; San, W.; Zheng, Y.; Zhang, S.; Cao, D.; Chen, Y.; Meng, G. Different types of cell death in diabetic endothelial dysfunction. Biomed. Pharmacother. 2023, 168, 115802. [Google Scholar] [CrossRef] [PubMed]
  15. Mancusi, C.; de Simone, G.; Best, L.G.; Wang, W.; Zhang, Y.; Roman, M.J.; Lee, E.T.; Howard, B.V.; Devereux, R.B. Myocardial mechano-energetic efficiency and insulin resistance in non-diabetic members of the Strong Heart Study cohort. Cardiovasc. Diabetol. 2019, 18, 56. [Google Scholar] [CrossRef]
  16. Boza, C.; Riquelme, A.; Ibañez, L.; Duarte, I.; Norero, E.; Viviani, P.; Soza, A.; Fernandez, J.I.; Raddatz, A.; Guzman, S.; et al. Predictors of nonalcoholic steatohepatitis (NASH) in obese patients undergoing gastric bypass. Obes. Surg. 2005, 15, 1148–1153. [Google Scholar] [CrossRef] [PubMed]
  17. Čolak, D.; Pintar, T.; Kučič, A.C.; Salobir, J.; Gašpirc, B. Periodontal and Hepatic Parameters in Obese Patients Undergoing Bariatric Surgery. Oral Health Prev. Dent. 2022, 20, 295–304. [Google Scholar] [PubMed]
  18. Bedogni, G.; Bellentani, S.; Miglioli, L.; Masutti, F.; Passalacqua, M.; Castiglione, A.; Tiribelli, C. The Fatty Liver Index: A simple and accurate predictor of hepatic steatosis in the general population. BMC Gastroenterol. 2006, 6, 33. [Google Scholar] [CrossRef]
  19. Chamroonkiadtikun, P.; Ananchaisarp, T.; Wanichanon, W. The triglyceride-glucose index, a predictor of type 2 diabetes development: A retrospective cohort study. Prim. Care Diabetes 2020, 14, 161–167. [Google Scholar] [CrossRef] [PubMed]
  20. Park, H.M.; Lee, H.S.; Lee, Y.J.; Lee, J.H. The triglyceride-glucose index is a more powerful surrogate marker for predicting the prevalence and incidence of type 2 diabetes mellitus than the homeostatic model assessment of insulin resistance. Diabetes Res. Clin. Pract. 2021, 180, 109042. [Google Scholar] [CrossRef] [PubMed]
  21. Park, K.; Ahn, C.W.; Lee, S.B.; Kang, S.; Nam, J.S.; Lee, B.K.; Kim, J.H.; Park, J.S. Elevated TyG Index Predicts Progression of Coronary Artery Calcification. Diabetes Care 2019, 42, 1569–1573. [Google Scholar] [CrossRef]
  22. Won, K.-B.; Park, E.J.; Han, D.; Lee, J.H.; Choi, S.-Y.; Chun, E.J.; Park, S.H.; Han, H.-W.; Sung, J.; Jung, H.O.; et al. Triglyceride glucose index is an independent predictor for the progression of coronary artery calcification in the absence of heavy coronary artery calcification at baseline. Cardiovasc. Diabetol. 2020, 19, 34. [Google Scholar] [CrossRef] [PubMed]
  23. Zhao, Q.; Zhang, T.-Y.; Cheng, Y.-J.; Ma, Y.; Xu, Y.-K.; Yang, J.-Q.; Zhou, Y.-J. Impacts of triglyceride-glucose index on prognosis of patients with type 2 diabetes mellitus and non-ST-segment elevation acute coronary syndrome: Results from an observational cohort study in China. Cardiovasc. Diabetol. 2020, 19, 108. [Google Scholar] [CrossRef] [PubMed]
  24. Huang, R.; Wang, Z.; Chen, J.; Bao, X.; Xu, N.; Guo, S.; Gu, R.; Wang, W.; Wei, Z.; Wang, L. Prognostic value of triglyceride glucose (TyG) index in patients with acute decompensated heart failure. Cardiovasc. Diabetol. 2022, 21, 88. [Google Scholar] [CrossRef] [PubMed]
  25. Shi, W.; Xing, L.; Jing, L.; Tian, Y.; Yan, H.; Sun, Q.; Dai, D.; Shi, L.; Liu, S. Value of triglyceride-glucose index for the estimation of ischemic stroke risk: Insights from a general population. Nutr. Metab. Cardiovasc. Dis. 2020, 30, 245–253. [Google Scholar] [CrossRef] [PubMed]
  26. Guo, X.; Wang, H.; Song, Q.; Li, N.; Liang, Q.; Su, W.; Liang, M.; Ding, X.; Sun, C.; Lowe, S.; et al. Association between exposure to organophosphorus pesticides and the risk of diabetes among US Adults: Cross-sectional findings from the National Health and Nutrition Examination Survey. Chemosphere 2022, 301, 134471. [Google Scholar] [CrossRef]
  27. Glover, F.; Mehta, A.; Richardson, M.; Muncey, W.; Del Giudice, F.; Belladelli, F.; Seranio, N.; Eisenberg, M.L. Investigating the prevalence of erectile dysfunction among men exposed to organophosphate insecticides. J. Endocrinol. Investig. 2024, 47, 389–399. [Google Scholar] [CrossRef] [PubMed]
  28. Zhang, Q.; Xiao, S.; Jiao, X.; Shen, Y. The triglyceride-glucose index is a predictor for cardiovascular and all-cause mortality in CVD patients with diabetes or pre-diabetes: Evidence from NHANES 2001–2018. Cardiovasc. Diabetol. 2023, 22, 279. [Google Scholar] [CrossRef] [PubMed]
  29. Pei, H.; Li, S.; Su, X.; Lu, Y.; Wang, Z.; Wu, S. Association between triglyceride glucose index and sleep disorders: Results from the NHANES 2005–2008. BMC Psychiatry 2023, 23, 156. [Google Scholar] [CrossRef] [PubMed]
  30. O’Brien, K.M.; Upson, K.; Buckley, J.P. Lipid and Creatinine Adjustment to Evaluate Health Effects of Environmental Exposures. Curr. Environ. Health Rep. 2017, 4, 44–50. [Google Scholar] [CrossRef]
  31. Han, L.; Wang, Q. Association between organophosphorus insecticides exposure and the prevalence of sleep problems in the US adults: An analysis based on the NHANES 2007–2018. Ecotoxicol. Environ. Saf. 2023, 255, 114803. [Google Scholar] [CrossRef] [PubMed]
  32. Guo, X.; Wu, B.; Xia, W.; Gao, J.; Xie, P.; Feng, L.; Sun, C.; Liang, M.; Ding, X.; Zhao, D.; et al. Association of organophosphate ester exposure with cardiovascular disease among US adults: Cross-sectional findings from the 2011–2018 National Health and Nutrition Examination Survey. Chemosphere 2022, 308 Pt 2, 136428. [Google Scholar] [CrossRef]
  33. Dang, K.; Wang, X.; Hu, J.; Zhang, Y.; Cheng, L.; Qi, X.; Liu, L.; Ming, Z.; Tao, X.; Li, Y. The association between triglyceride-glucose index and its combination with obesity indicators and cardiovascular disease: NHANES 2003–2018. Cardiovasc. Diabetol. 2024, 23, 8. [Google Scholar] [CrossRef]
  34. SwissTargetPrediction. SwissDrugDesign. Available online: http://swisstargetprediction.ch (accessed on 9 September 2024).
  35. GeneCards. The Human Gene Database. Available online: https://www.genecards.org/ (accessed on 9 September 2024).
  36. STRING. Protein-Protein Interaction Networks Functional Enrichment Analysis. Available online: https://string-db.org/ (accessed on 9 September 2024).
  37. Bardou, P.; Mariette, J.; Escudié, F.; Djemiel, C.; Klopp, C. jvenn: An interactive Venn diagram viewer. BMC Bioinform. 2014, 15, 293. [Google Scholar] [CrossRef] [PubMed]
  38. Avagimyan, A.; Pogosova, N.; Fogacci, F.; Aghajanova, E.; Djndoyan, Z.; Patoulias, D.; Sasso, L.L.; Bernardi, M.; Faggiano, A.; Mohammadifard, N.; et al. Triglyceride-glucose index (TyG) as a novel biomarker in the era of cardiometabolic medicine. Int. J. Cardiol. 2025, 418, 132663. [Google Scholar] [CrossRef]
  39. Nabipoorashrafi, S.A.; Seyedi, S.A.; Rabizadeh, S.; Ebrahimi, M.; Ranjbar, S.A.; Reyhan, S.K.; Meysamie, A.; Nakhjavani, M.; Esteghamati, A. The accuracy of triglyceride-glucose (TyG) index for the screening of metabolic syndrome in adults: A systematic review and meta-analysis. Nutr. Metab. Cardiovasc. Dis. 2022, 32, 2677–2688. [Google Scholar] [CrossRef] [PubMed]
  40. Grundy, S.M.; Brewer Jr, H.B.; Cleeman, J.I.; Smith, S.C., Jr.; Lenfant, C. Definition of metabolic syndrome: Report of the National Heart, Lung, and Blood Institute/American Heart Association conference on scientific issues related to definition. Circulation 2004, 109, 433–438. [Google Scholar] [CrossRef] [PubMed]
  41. Hua, Y.Q.; Zeng, Y.; Xu, J.; Le Xu, X. Naringenin alleviates nonalcoholic steatohepatitis in middle-aged Apoe(-/-)mice: Role of SIRT1. Phytomedicine 2021, 81, 153412. [Google Scholar] [CrossRef] [PubMed]
  42. Wang, L.; Chao, J.; Zhang, N.; Wu, Y.; Bao, M.; Yan, C.; Chen, T.; Li, X.; Chen, Y. A national study exploring the association between triglyceride-glucose index and risk of hyperuricemia events in adults with hypertension. Prev. Med. Rep. 2024, 43, 102763. [Google Scholar] [CrossRef] [PubMed]
  43. Alberti, K.G.; Zimmet, P.Z. Definition, diagnosis and classification of diabetes mellitus and its complications. Part 1: Diagnosis and classification of diabetes mellitus provisional report of a WHO consultation. Diabet. Med. 1998, 15, 539–553. [Google Scholar]
  44. Seesen, M.; Pratchayasakul, W.; Pintana, H.; Chattipakorn, N.; Chattipakorn, S.C. Exposure to organophosphates in association with the development of insulin resistance: Evidence from in vitro, in vivo, and clinical studies. Food Chem. Toxicol. 2022, 168, 113389. [Google Scholar] [CrossRef]
  45. Sun, Y.; Ji, H.; Sun, W.; An, X.; Lian, F. Triglyceride glucose (TyG) index: A promising biomarker for diagnosis and treatment of different diseases. Eur. J. Intern. Med. 2025, 131, 3–14. [Google Scholar] [CrossRef] [PubMed]
  46. Ou, J.; Xian, R.; Li, J.; Zhao, J.; Zhang, K.; Mo, P.; Fang, J.; Shen, Y.; Hu, X.; Fang, S.; et al. Associations of dichlorophenols, trichlorophenols, and ortho-phenylphenol with the risk and prognosis of diabetes and prediabetes: A population-based study. Ecotoxicol. Environ. Saf. 2024, 277, 116345. [Google Scholar] [CrossRef] [PubMed]
  47. Dong, Y.; Xu, W.; Liu, S.; Xu, Z.; Qiao, S.; Cai, Y. Serum albumin and liver dysfunction mediate the associations between organophosphorus pesticide exposure and hypertension among US adults. Sci. Total Environ. 2024, 948, 174748. [Google Scholar] [CrossRef] [PubMed]
  48. Zhang, Z.; Zhao, L.; Zhou, X.; Meng, X.; Zhou, X. Role of inflammation, immunity, and oxidative stress in hypertension: New insights and potential therapeutic targets. Front. Immunol. 2022, 13, 1098725. [Google Scholar] [CrossRef] [PubMed]
  49. Toh, B.-H.; Bobik, A.; Kyaw, T.S.; Drummond, G.; Sobey, C.G.; Guzik, T.J. Immune mechanisms in vascular disease and stroke. Biomed. Res. Int. 2014, 2014, 730691. [Google Scholar] [CrossRef]
  50. Alipanah, H.; Doraghi, H.K.; Sayadi, M.; Nematollahi, A.; Hekmat, A.S.; Nejati, R. Subacute toxicity of chlorpyrifos on histopathological damages, antioxidant activity, and pro-inflammatory cytokines in the rat model. Environ. Toxicol. 2022, 37, 880–888. [Google Scholar] [CrossRef]
  51. Weis, G.C.C.; Assmann, C.E.; Mostardeiro, V.B.; Alves, A.d.O.; da Rosa, J.R.; Pillat, M.M.; de Andrade, C.M.; Schetinger, M.R.C.; Morsch, V.M.M.; da Cruz, I.B.M.; et al. Chlorpyrifos pesticide promotes oxidative stress and increases inflammatory states in BV-2 microglial cells: A role in neuroinflammation. Chemosphere 2021, 278, 130417. [Google Scholar] [CrossRef] [PubMed]
  52. Bai, J.; Deng, S.; Fu, H.; Yang, Q.; Ren, F.; Zeng, S.; Chen, Z.; Yang, Y.; Wu, Z. Chlorpyrifos induces placental oxidative stress and barrier dysfunction by inducing mitochondrial apoptosis through the ERK/MAPK signaling pathway: In vitro and in vivo studies. Sci. Total Environ. 2023, 903, 166449. [Google Scholar] [CrossRef]
  53. Chen, J.; Shao, B.; Wang, J.; Shen, Z.; Liu, H.; Li, S. Chlorpyrifos caused necroptosis via MAPK/NF-κB/TNF-α pathway in common carp (Cyprinus carpio L.) gills. Comp. Biochem. Physiol. C Toxicol. Pharmacol. 2021, 249, 109126. [Google Scholar] [CrossRef]
  54. Alruhaimi, R.S. Betulinic acid protects against cardiotoxicity of the organophosphorus pesticide chlorpyrifos by suppressing oxidative stress, inflammation, and apoptosis in rats. Environ. Sci. Pollut. Res. Int. 2023, 30, 51180–51190. [Google Scholar] [CrossRef]
  55. Freyre, E.O.; Valencia, A.T.; Guzmán, D.D.; Maldonado, I.C.; Ledezma, L.E.B.; Carrillo, M.F.Z.; Escorza, M.A.Q. Oxidative Stress as a Molecular Mechanism of Exposure to Organophosphorus Pesticides: A Review. Curr. Protein Pept. Sci. 2021, 22, 890–897. [Google Scholar] [CrossRef] [PubMed]
  56. Sule, R.O.; Condon, L.; Gomes, A.V. A Common Feature of Pesticides: Oxidative Stress-The Role of Oxidative Stress in Pesticide-Induced Toxicity. Oxidative Med. Cell. Longev. 2022, 2022, 5563759. [Google Scholar] [CrossRef]
  57. Zhao, X.; An, X.; Yang, C.; Sun, W.; Ji, H.; Lian, F. The crucial role and mechanism of insulin resistance in metabolic disease. Front. Endocrinol. 2023, 14, 1149239. [Google Scholar] [CrossRef]
  58. Tchernof, A.; Després, J.P. Pathophysiology of human visceral obesity: An update. Physiol. Rev. 2013, 93, 359–404. [Google Scholar] [CrossRef] [PubMed]
  59. Coker, R.H.; Williams, R.H.; Yeo, S.E.; Kortebein, P.M.; Bodenner, D.L.; Kern, P.A.; Evans, W.J. Visceral fat and adiponectin: Associations with insulin resistance are tissue-specific in women. Metab. Syndr. Relat. Disord. 2009, 7, 61–67. [Google Scholar] [CrossRef] [PubMed]
  60. Abbasi, F.; Reaven, G.M. Comparison of two methods using plasma triglyceride concentration as a surrogate estimate of insulin action in nondiabetic subjects: Triglycerides × glucose versus triglyceride/high-density lipoprotein cholesterol. Metabolism 2011, 60, 1673–1676. [Google Scholar] [CrossRef] [PubMed]
  61. Sánchez-García, A.; Rodríguez-Gutiérrez, R.; Mancillas-Adame, L.; González-Nava, V.; Díaz González-Colmenero, A.; Solis, R.C.; Alvarez-Villalobos, N.A.; González-González, J.G. Diagnostic Accuracy of the Triglyceride and Glucose Index for Insulin Resistance: A Systematic Review. Int. J. Endocrinol. 2020, 2020, 4678526. [Google Scholar] [CrossRef]
  62. Ke, J.; Ruan, X.; Liu, W.; Liu, X.; Wu, K.; Qiu, H.; Wang, X.; Ding, Y.; Tan, X.; Li, Z.; et al. Prospective cohort studies underscore the association of abnormal glycemic measures with all-cause and cause-specific mortalities. iScience 2024, 27, 110233. [Google Scholar] [CrossRef] [PubMed]
  63. Muzurović, E.; Mikhailidis, D.P.; Mantzoros, C. Non-alcoholic fatty liver disease, insulin resistance, metabolic syndrome and their association with vascular risk. Metabolism 2021, 119, 154770. [Google Scholar] [CrossRef]
  64. Wu, S.; Xu, L.; Wu, M.; Chen, S.; Wang, Y.; Tian, Y. Association between triglyceride-glucose index and risk of arterial stiffness: A cohort study. Cardiovasc. Diabetol. 2021, 20, 146. [Google Scholar] [CrossRef]
  65. Barzegar, N.; Tohidi, M.; Hasheminia, M.; Azizi, F.; Hadaegh, F. The impact of triglyceride-glucose index on incident cardiovascular events during 16 years of follow-up: Tehran Lipid and Glucose Study. Cardiovasc. Diabetol. 2020, 19, 155. [Google Scholar] [CrossRef] [PubMed]
  66. Simental-Mendía, L.E.; Hernández-Ronquillo, G.; Gómez-Díaz, R.; Rodríguez-Morán, M.; Guerrero-Romero, F. The triglycerides and glucose index is associated with cardiovascular risk factors in normal-weight children and adolescents. Pediatr. Res. 2017, 82, 920–925. [Google Scholar] [CrossRef] [PubMed]
  67. Xuan, X.; Hamaguchi, M.; Cao, Q.; Okamura, T.; Hashimoto, Y.; Obora, A.; Kojima, T.; Fukui, M.; Yuan, G.; Guo, Z.; et al. U-shaped association between the triglyceride-glucose index and the risk of incident diabetes in people with normal glycemic level: A population-base longitudinal cohort study. Clin. Nutr. 2021, 40, 1555–1561. [Google Scholar] [CrossRef] [PubMed]
  68. Wen, J.; Wang, A.; Liu, G.; Wang, M.; Zuo, Y.; Li, W.; Zhai, Q.; Mu, Y.; Gaisano, H.Y.; He, Y.; et al. Elevated triglyceride-glucose (TyG) index predicts incidence of Prediabetes: A prospective cohort study in China. Lipids Health Dis. 2020, 19, 226. [Google Scholar] [CrossRef]
  69. Luo, Y.; Hao, J.; He, X.; Wang, C.; Zhao, H.; Zhang, Z.; Yang, L.; Ren, L. Association Between Triglyceride-Glucose Index and Serum Uric Acid Levels: A Biochemical Study on Anthropometry in Non-Obese Type 2 Diabetes Mellitus Patients. Diabetes Metab. Syndr. Obes. 2022, 15, 3447–3458. [Google Scholar] [CrossRef]
  70. Tahapary, D.L.; Pratisthita, L.B.; Fitri, N.A.; Marcella, C.; Wafa, S.; Kurniawan, F.; Rizka, A.; Tarigan, T.J.E.; Harbuwono, D.S.; Purnamasari, D.; et al. Challenges in the diagnosis of insulin resistance: Focusing on the role of HOMA-IR and Tryglyceride/glucose index. Diabetes Metab. Syndr. 2022, 16, 102581. [Google Scholar] [CrossRef]
Figure 1. Relationship between urine OPP levels and TyG index for all participants. The square in the center of the line is the β value, and the width of the line represents the 95% CI. Model 1 did not include covariates; Model 2 included age, gender, education level, marital status, race, and PIR; Model 3 on 2 then includes smoking, BMI, diabetes, hypertension, and cardiovascular disease.
Toxics 13 00118 g001
Figure 2. Relationship between urinary OPP levels and TyG index based on RCS analysis. Solid blue lines indicate ORs and blue shaded ranges indicate 95% CIs. Horizontal dashed lines represent reference ratios to 1.0.
Toxics 13 00118 g002
Figure 3. The relationship between OPP combinations and TyG index in the QGC and WQS model. (A) The result of the quantile-based g-computation. (B) The result of the weighted quantile and regression. All models were adjusted for demographic characteristics (age, gender, education level, marital status, race, PIR, and BMI), lifestyle (smoking), and disease status (diabetes, hypertension, and cardiovascular disease).
Toxics 13 00118 g003
Figure 4. Machine learning model performance and the ROC of the four machine learning models. (A) Machine learning model performance for TyG index prediction. (B) ROC curves for CVD death prediction. (C) ROC curves for CVD prediction.
Toxics 13 00118 g004
Figure 5. The contribution of OPPs and baseline variables in predictive model. (A) The SHAP features importance plot of OPPs and TyG index. (B) The SHAP summary plot of OPPs and TyG index. (C) The SHAP features importance plot of OPPs and CVD. (D) The SHAP summary plot of OPPs and CVD. (E) The SHAP features importance plot of OPPs and CVD-related deaths. (F) The SHAP summary plot of OPPs and CVD-related deaths.
Toxics 13 00118 g005
Figure 6. Mechanistic pathway of OPP-induced insulin resistance. OPPs, organophosphate pesticides; ROS, reactive oxygen species; NF-κB, Nuclear Factor-kappa B; TNF-α, Tumor Necrosis Factor-alpha; IR, insulin resistance; TyG index, triglyceride glucose index.
Toxics 13 00118 g006
Table 1. Demographic and clinical characteristics according to triglyceride glucose index level (n = 4429).
TyG Index QuartileTotalQ1Q2Q3Q4p-Value
Number44291106110911071107
Gender (%) a <0.001
 Male2183 (49.3)441 (39.9)541 (48.8)579 (52.3)622 (56.2)
 Female2246 (50.7)665 (60.1)568 (51.2)528 (47.7)485 (43.8)
Age (years) group (%) a <0.001
 20–391480 (33.4)541 (48.9)382 (34.4)307 (27.7)250 (22.6)
 40–591571 (35.5)354 (32.0)374 (33.7)400 (36.1)443 (40.0)
 ≥601378 (31.1)211 (19.1)353 (31.8)400 (36.1)414 (37.4)
Education level (%) a <0.001
Below high school1068 (24.1)196 (17.7)241 (21.7)290 (26.2)341 (30.8)
High school989 (22.3)222 (20.1)263 (23.7)250 (22.6)254 (22.9)
Above high school2372 (53.6)688 (62.2)605 (54.6)567 (51.2)512 (46.3)
Marital status (%) a <0.001
Married/living with partner2675 (60.4)605 (54.7)649 (58.5)720 (65.0)701 (63.3)
Widowed/divorced/separated/980 (22.1)218 (19.7)252 (22.7)242 (21.9)268 (24.2)
Never married774 (17.5)283 (25.6)208 (18.8)145 (13.1)138 (12.5)
Race (%) a <0.001
Mexican American682 (15.4)104 (9.4)165 (14.9)186 (16.8)227 (20.5)
Other Hispanic376 (8.5)77 (7.0)77 (6.9)117 (10.6)105 (9.5)
Non-Hispanic White1897 (42.8)394 (35.6)495 (44.6)495 (44.7)513 (46.3)
Non-Hispanic Black1008 (22.8)410 (37.1)262 (23.6)193 (17.4)143 (12.9)
Other race466 (10.5)121 (10.9)110 (9.9)116 (10.5)119 (10.7)
Household income (%) a 0.265
≤1.3 PIR1321 (29.8)309 (27.9)335 (30.2)318 (28.7)359 (32.4)
1.3–3.5 PIR1681 (38.0)417 (37.7)425 (38.3)428 (38.7)411 (37.1)
>3.5 PIR1427 (32.2)380 (34.4)349 (31.5)361 (32.6)337 (30.4)
Body mass index (kg/m2),
(median (25th, 75th)) b
28.22
(24.50, 32.70)
25.63
(22.41, 30.20)
27.79
(24.15, 32.02)
28.91
(25.53, 33.21)
30.00
(26.60, 34.19)
<0.001
Smoking (%) a3318 (74.8)815 (73.7)850 (76.6)816 (73.7)837 (75.6)0.285
Hypertension (%) a1613 (36.4)282 (25.5)377 (34.0)424 (38.3)530 (47.9)<0.001
Diabetes (%) a582 (13.1)39 (3.5)89 (8.0)125 (11.3)329 (29.7)<0.001
Cardiovascular diseases (%) a502 (11.3)81 (7.3)132 (11.9)125 (11.3)164 (14.8)<0.001
Creatinine-adjusted urinary OPs
(ng/cg), (median (25th, 75th)) b
DMP11.57
(3.80, 35.94)
11.41
(4.36, 30.05)
12.02
(3.93, 35.34)
11.49
(3.69, 37.05)
11.48
(3.55, 39.44)
<0.001
DEP13.73
(3.49, 34.28)
15.27
(5.52, 34.87)
14.35
(3.48, 33.51)
12.80
(2.91, 33.93)
11.95
(2.80, 34.43)
<0.001
DMTP9.97
(3.72, 30.22)
8.18
(3.38, 22.78)
9.59
(3.61, 30.07)
10.42
(3.85, 34.22)
12.30
(4.33, 35.24)
<0.001
DETP2.76
(1.21, 6.34)
2.32
(1.04, 5.58)
2.69
(1.19, 6.21)
2.83
(1.24, 6.46)
3.22
(1.48, 6.84)
<0.001
a Number of participants and percentage. The chi-square test was used for quartile groups of different TyG indexes. b Median (25th, 75th percentiles). The Kruskal–Wallis H test was used for quartile groups of different TyG indexes.
Disclaimer/Publisher’s Note: The statements, opinions and data contained in all publications are solely those of the individual author(s) and contributor(s) and not of MDPI and/or the editor(s). MDPI and/or the editor(s) disclaim responsibility for any injury to people or property resulting from any ideas, methods, instructions or products referred to in the content.

