Article

Emission Characteristics, Co-Drivers, and Mitigation Implications of NH3, N2O, and CH4 from Livestock Manure in China from 2013 to 2023

1
College of Environment and Energy, South China University of Technology, Guangzhou 510006, China
2
College of Environment and Climate, Jinan University, Guangzhou 511436, China
3
College of Ecology, Hainan University, Haikou 570228, China
*
Author to whom correspondence should be addressed.
Toxics 2025, 13(11), 933; https://doi.org/10.3390/toxics13110933
Submission received: 6 September 2025 / Revised: 25 October 2025 / Accepted: 27 October 2025 / Published: 30 October 2025

Highlights

What are the main findings?
  • Established a unified 17 category source classification and a coupled, bottom-up statistical inventory to estimate livestock-manure NH3, N2O, and CH4 at species and province level.
  • Spatial analysis reveals persistent hotspots in the North China Plain and the Sichuan Basin, alongside pronounced inter provincial heterogeneity.
What is the implication of the main finding?
  • The main findings highlight that effective livestock manure management is critical for controlling air pollution and mitigating climate change
  • Pronounced inter-provincial discrepancies in livestock-manure emissions indicate that China should adopt region-dependent control measures.

Abstract

Livestock and poultry manure emits substantial amounts of ammonia and non-CO2 greenhouse gases of nitrous oxide and methane, contributing simultaneously to climate forcing and air quality degradation. However, few studies have provided an integrated quantification of ammonia, nitrous oxide and methane emissions across multiple species and provinces in China. This study established a coupled provincial inventory for 2013–2023 and applied the Logarithmic Mean Divisia Index (LMDI) to identify socioeconomic drivers. Results show that NH3 emissions declined slightly from ~4.1 Tg in 2013 to 3.95 Tg in 2023 (−3.7%), while N2O increased from 2.1 to 2.3 Tg (+9.5%) and CH4 rose from 3.1 to 4.2 Tg (+35%). Consequently, the aggregated global warming potential increased by ~24% (from ~1100 to ~1370 Tg CO2-eq). Hogs were identified as the dominant contributor across gases. High-emission provinces contributed disproportionately, whereas metropolitan and western provinces reported marginal levels. LMDI decomposition revealed that affluence and technological intensification were the main drivers of growth, partially offset by production efficiency and labor decline. This study provides one of the first integrated multi-gas, multi-species, and region-specific assessments of livestock manure emissions in China, offering insights into targeted mitigation strategies that simultaneously support carbon neutrality and air quality improvement.

1. Introduction

China is an agriculture-based country, with rising affluence and a stable population increasing consumption demand for animal-based foods [1]; the scale of the populations of livestock and poultry farming has been continuously expanding [2]. According to the China Statistical Yearbook [3], the populations of cattle, goats, and poultry increased by 48%, 79%, and 49%, respectively, between 2010 and 2020. Concurrently, the economic output of the livestock sector has grown substantially, with livestock GDP rising from CNY 1331 billion in 2000 to 2058 billion in 2020 [4]. Its share of total agricultural gross domestic product (GDP) increased from 12.4% to 35.5% over the same period [5]. Livestock production has become a pillar industry within China’s agricultural and rural economy. The expansion of livestock numbers and GDP has led to a corresponding increase in manure production [6]. Over the past decade, China’s livestock sector produced approximately 3.5 to 3.8 billion tons of manure annually [7]. Although the comprehensive utilization rate of livestock manure has reached 60–75%, a substantial amount remains untreated, causing serious environmental pollution and climate change [8].
Livestock manure simultaneously emits NH3, N2O, and CH4 [9], increasing global warming potential (GWP) and posing combined air quality and climate impacts. Fecal organic matter and nitrogenous compounds are hydrolyzed by urease to produce ammonium (NH4+), which can volatilize into the atmosphere as gaseous NH3 [10]. During nitrification, aerobic nitrifying bacteria oxidize NH4+ to nitrite (NO2) and subsequently to nitrate (NO3), with small amounts of N2O emitted as a by-product [11]. Denitrifying microbes also produce N2O during the stepwise reduction of NO3/NO2 to N2 under oxygen-limited conditions. In anaerobic conditions, the anaerobic bacteria will decompose organic matter and methanogens are converted to CH4 [12]. Based on simulations, the radiative efficiencies of CH4 and N2O are 3.63 × 10⁻⁴ and 2.987 × 10⁻³ W m−2 ppb−1, respectively, while that of CO2 is 1.37 × 10⁻⁵ W m−2 ppb−1. Accordingly, the global warming potentials (GWP100) of CH4 and N2O are 28 and 273 times higher than that of CO2, respectively. In China, livestock production emits approximately 4000–5500 kt of NH3 [13,14,15], 44 kt of N2O [16,17,18], and 867–1000 kt of CH4 annually [19,20,21]. It is estimated that livestock manure contributes approximately 52%, 29%, and 11% of agriculturally derived NH3, N2O and CH4 emissions in China, respectively. China officially announced the national strategic goal of achieving carbon neutrality by 2060 [22], aiming to attain net-zero greenhouse gas (GHG) emissions. In the context of carbon neutrality and air quality improvement, it is essential to consecutively assess the magnitude of livestock manure emissions and identify mitigation opportunities as the mitigation targets are scheduled [23].
A comprehensive assessment of the emission characteristics, underlying co-drivers, and policy implications of livestock farming air pollutants—NH3, the non-CO2 greenhouse gas N2O, and CH4—is critical for designing targeted mitigation strategies and for projecting future environmental and climate impacts [24,25,26]. Previous research efforts at global or national scales have sought to identify, characterize, and estimate livestock emissions from diverse sources concentrated on single gases. For example, Huang et al. [13] estimated that ammonia (NH3) emissions from livestock in 2006 were 5.3 Tg, accounting for approximately 54% of the national total. Henan, Hebei, and Shandong were the highest-emitting provinces, whereas Hong Kong and Macao showed zero emissions. By category, cattle were the largest source (1.9 Tg NH3 yr−1), followed by laying hens and pigs (0.7 Tg NH3 yr−1 each). Kang et al. [14] estimated NH3 emissions from animal husbandry and characterized their spatiotemporal distribution, showing an increase from 2.8 Tg (1980) to 5.1 Tg (2012) and hotspot concentrations in eastern China, eastern Sichuan, and portions of Xinjiang. Xu et al. [27] used county-level statistics for 1978–2008 to estimate NH3 emissions from the land application of livestock manure and to assess mitigation potential via scenario analysis. Emissions from manure spreading were 3.8 Tg, with source shares of cattle (30.2%), pigs (28.9%), poultry (26.2%), and dairy cattle (7.9%). Zhang et al. [15] recompiled the 2008 agricultural ammonia emission inventory of China using a “bottom-up” emission coefficient method combined with a “top-down” remote sensing inversion method, quantified NH3 emissions of 5.31 Tg from agriculture livestock waste in China for the year 2008, and identified a pronounced summer peak driven by temperature.
Recent works have advanced understanding of the emission of non-CO2 greenhouse gases such as CH4 and N2O from livestock manure. For instance, Liang et al. [28] compiled a full-scale national inventory spanning four decades from 1980 to 2020, showing N2O emissions rising from 79.9 Gg in 1980 to 119.3 Gg in 2000, then declining to 91.7 Gg in 2020, with livestock manure contributing 26.3% of total N2O emissions. Complementing this, Luo et al. [29] analyzed temporal and spatial patterns from 1978 to 2015, reporting that livestock-related N2O emissions nearly doubled up to the early 2000s (about 20% share), then gradually decreased with a turning point around 2004, trends they linked to intensification, herd scaling, and evolving husbandry techniques. In the multigap context, Yuan et al. [30] quantified China’s greenhouse gas budget for 2000 to 2023, highlighting the roles of manure management in N2O (13.1%) and CH4 (5.0%) source contributions. Looking forward, Chen et al. [31] assessed mitigation trajectories for non-CO2 greenhouse gases in Chinese agriculture and identified livestock management, including improved manure handling and reduced enteric fermentation via feed strategies, as providing the largest technical reduction potential (46%). However, previous emission inventories of N2O and CH4 have relied mostly on European observational and experimental data. Therefore, it is important that N2O and CH4 emission values are re-evaluated by considering regional characteristics. On the other hand, direct comparisons of NH3, N2O, and CH4 gas emission characteristics from the manure of different livestock species remain scarce in the literature. Furthermore, there is insufficient clarity on which regions and livestock types should be targeted and prioritized to effectively advance mitigation efforts.
To address these challenges, this study refines China’s livestock manure emission estimates using species-specific, region-specific data and develops a coupled, integrated inventory that simultaneously quantifies air pollutants of NH3 and greenhouse gases of N2O and CH4, replacing the conventional practice of constructing separate air pollutants and greenhouse gas inventories. Based on a long-term historical inventory of livestock, we analyzed changes in emissions, variations in source contributions, and spatial patterns. Meanwhile, we used the Logarithmic Mean Divisia Index (LMDI) method to reveal the socioeconomic drivers of livestock emissions. Further, the global warming potential (GWP) associated with manure from different livestock species was simultaneously analyzed and compared across China’s provinces. These findings offer a scientific and data-driven basis to support the implementation of China’s “Carbon Neutrality Strategy”. This study also offers valuable insights into regional ecological security and sustainable green agriculture.

2. Methods and Datasets

2.1. Study Domain and Source Categories

Given pronounced differences across China’s regions and provinces in climate conditions, livestock composition, and production practices, this study divided the area into six macro-regions, according to the administrative division codes of the People’s Republic of China [32] and the Resource and Environment Data Cloud Platform [33] to objectively assess regional and inter-provincial disparities in agricultural livestock emissions. Therefore, this study encompasses 31 provinces, municipalities, and autonomous regions in mainland China; Taiwan, Hong Kong, and Macao were excluded due to data limitations.
As shown in Figure 1, the agricultural regions were divided as follows: (i) Northeast China (NEC: Liaoning, Jilin, and Heilongjiang), dominated by agro-livestock systems in major grain production areas with strong crop–livestock integration; (ii) North China (NC: Beijing, Tianjin, Shanxi, Hebei, and Inner Mongolia), characterized primarily by grassland pastoral systems and supplemented by suburban intensive livestock production; (iii) East China (EC: Shanghai, Jiangsu, Zhejiang, Anhui, Fujian, Jiangxi, and Shandong), dominated by agricultural livestock systems; (iv) South Central China (SCC: Henan, Hubei, Hunan, Guangdong, Guangxi, and Hainan), also dominated by agricultural livestock systems with high pig and poultry densities; (v) Southwest China (SWC: Chongqing, Sichuan, Guizhou, Yunnan, and Tibet), characterized by mountainous livestock production and highland pastoral systems; and (vi) Northwest China (NWC: Shaanxi, Gansu, Qinghai, Ningxia, and Xinjiang), representing vast grassland and desert pastoral systems. This study encompasses 31 provinces, municipalities, and autonomous regions in mainland China. Taiwan was excluded due to the lack of accessible agricultural statistical data, while Hong Kong and Macau were excluded because of their limited agricultural activities and data unavailability.
Based on the classification system of the China Agricultural Statistical Yearbook and our previous work [34], the emission sources in this inventory were updated to include 17 categories in total, comprising 10 livestock categories and 7 poultry categories (Table 1). To maintain methodological and pollutant coherence with the livestock manure management framework, CH4 from enteric fermentation was not considered. Detailed activity data for different livestock and poultry species numbers are listed in Supplementary Materials Table S1.

2.2. Calculation of Livestock Emissions

This study develops a bottom-up approach that uses consistent province-level activity data and species-specific emission factors to estimate emissions and then aggregates the results to the national level. Using this framework, we calculate NH3, N2O, and CH4 emissions from China’s livestock sector for 2013–2023, as shown below:
E i = j A D i , j , m × E F i , j , m
where Ei denotes the total estimated emissions for the source category; i, j, and m represent the source type, the province in China, and the month, respectively; ADi,j,m refers to the activity level associated with the category; and EFi,j,m is the corresponding specific condition emission factor for the category. The detailed calculation methods for compiling activity data and emission factors for each source were presented and discussed by Zhang et al. [34].

2.2.1. Calculation of NH3 Emissions

Livestock-related NH3 emissions were estimated following the methodology established by Zheng et al. [24], which provides a systematic framework for compiling agricultural emission inventories. NH3 emissions from livestock manure management were calculated as follows:
E L M M , i = j k P L j , k × E F L M M , i , k , l , t
where ELMM,i denotes the NH3 emissions from LMM, i represents NH3, and PLj,k,l (head) represents the population of livestock for j province, k source of livestock, and l type of breeding method. EFi,j,k,l,t are the emission factors for i gas, k sub-source of livestock, l type of breeding method (kg/head), and t temperature.
Emission factors were modified based on temperature-dependent parameters following the Technical Guidelines [36]. Pixel-level monthly EFs were obtained by adjusting nitrogen excretion rates, feeding times, and NH3 volatilization rates across different livestock categories. NH3 emissions from livestock were estimated across four manure management stages, housing, storage, land spreading, and grazing, using the following equations:
Housing (ef1):
ef1 = NX1 V1
Storage (ef2):
ef2 = NX1 (1 − V1) V2
Land Spreading (ef3):
ef3 = NX1(1 − V1) (1 − V2) V3
Grazing (ef4):
ef4 = NX4 V4
Total Emission Factor (EF):
EF = ef1 + ef2 + ef3 + ef4
where ef1,2,3,4 are the NH3 emissions at different stages. NX1,4 are nitrogen excretions during housing (1) and grazing (4), respectively. V1,2,3,4 are the temperature-dependent NH3 volatilization rates at each stage, and EF is the final emission factor. Detailed NH3 emission factors for different livestock and poultry species under different temperatures are listed in Supplementary Materials Table S2.

2.2.2. Calculation of N2O Emissions

We applied emission inventory methodologies from the province’s Guidelines for the National Emission Inventory [37]. Direct N2O emissions from livestock manure arise from two main processes: (i) nitrification and denitrification of nitrogen in manure during storage and treatment, and (j) subsequent emissions following the application of manure to soils. Detailed emission factors are provided in Supplementary Table S3. The first summation term represents N2O emissions during manure storage and processing, while the second term accounts for emissions released after manure application to agricultural soils.
E N 2 O = i ( N e x ( i ) × M S ( i ) × E F N 2 O ( i ) ) + j ( N a p p ( j ) × E F N 2 O s o i l ( j ) )
where E N 2 O   is total direct N2O emissions (kg N2O yr−1), Nex(i) is the amount of nitrogen excreted by livestock category i (kg N yr−1), MS(i) is the fraction of manure managed under the system, E F N 2 O ( i ) is the emission factor for direct N2O emissions from manure management system i (kg N2O–N per kg N excreted), Napp(j) is the amount of nitrogen applied to soils from manure management system j (kg yr−1), and E F N 2 O s o i l ( j ) is the emission factor for direct N2O emissions from manure applied to soils (kg N2O–N per kg N applied).

2.2.3. Calculation of CH4 Emissions

We applied emission inventory methodologies from the province’s Guidelines for the National Emission Inventory [37]. This study did not include intestinal fermentation of livestock and poultry, as shown below:
E i = j ( A D i , j , m × E F i , j , m )
where Ei denotes the total estimated emissions for the source category; i, j, and m represent the source type, the province in China, and the month, respectively; ADi,j,m refers to the activity level associated with the category; and EFi,j,m is the emission factor for the category (Table S4).

2.2.4. Calculation of GWP Emissions

IPCC has used the global warming potential (GWP) to allow for comparisons of the global warming impacts of different gases [38]. Specifically, the GWP is a measure of how much energy the emission of 1 ton of a gas will absorb over a given period of time, relative to the emission of 1 ton of carbon dioxide (CO2). The larger the GWP, the more a given gas warms the Earth compared to CO2 over that time period. The time period usually used for GWPs is 100 years. GWPs provide a common unit of measure, which allows analysts to add up emissions estimates of different gases:
GWP = 28 × ECH4 + 256 × (EN2O + 0.01ENH3-N × 44/28)
where GWP is the greenhouse gas global warming potential, kt, expressed in CO2-eq; ECH4 is the cumulative CH4 emissions, kt−1; EN2O is the cumulative N2O emissions, kt−1; and ENH3-N is the cumulative NH3-N emissions, kt−1. Additionally, 28 and 265 are the 100-year warming potentials of CH4 and N2O relative to CO2, respectively (IPCC, 2013); 0.01 is the conversion coefficient of NH3 (measured as NH3-N) to N2O (measured as N2O-N) through atmospheric deposition and chemical reactions; and 44/28 is the conversion coefficient of N2O-N to N2O.

2.3. Spatial Allocation of Livestock Emissions

Emissions from livestock manure management (LMM) were allocated based on the spatial distribution of rural residential areas. Livestock emissions were spatially allocated to 9 km × 9 km grid cells using a Geographic Information System (ArcGIS, version 10.2). The allocation was performed according to the following equation:
E i , j = E t o t a l × ( W i , j i , j W i , j )
where Ei,j presents the emissions allocated to grid cell (i,j), Etotal is total livestock emissions for the region. Wi,j is the weighting factor for grid cell (i,j) based on agricultural activity, and i,j Wi,j is the sum of weighting factors across all grid cells.

2.4. Uncertainty Analysis

Various sources of uncertainty in emission factors, activity data, and calculation parameters [39] can lead to uncertainties in emission estimates. In this study, a quantitative approach using the Monte Carlo model with R (version 4.2.3) was applied to evaluate the uncertainty of all sources of livestock emissions according to the method by Zheng et al. [24]. By establishing emission factor databases from the literature, the uncertainties for each source and total emissions were quantified and key sources leading to uncertainty in model outputs were identified using sensitivity analysis approaches. Detailed input parameters are provided in Supplementary Table S5.

2.5. Driving Force Analysis Based on the LMDI

To investigate the determinants of livestock emissions, this study employed the Logarithmic Mean Divisia Index (LMDI) decomposition approach, which has been widely used in emission factor analysis owing to its additive property, absence of residuals, and consistency across decomposition forms [40]. The general identity can be expressed as follows:
E = E S × S A × A M × M L × L P × P = i α   × β × γ × ρ × δ α = E / S ,   β = S / A ,   γ = A / M ,   ρ = M / L ,   δ = L / P
where α is agricultural livestock production efficiency, β is agricultural industrial structure, γ is agricultural affluence, ρ is agricultural technology level, and δ is agricultural population labor force. The 5 components are explained in Table 2.

3. Results and Discussion

3.1. Emissions Trends and Comparison with Previous Studies

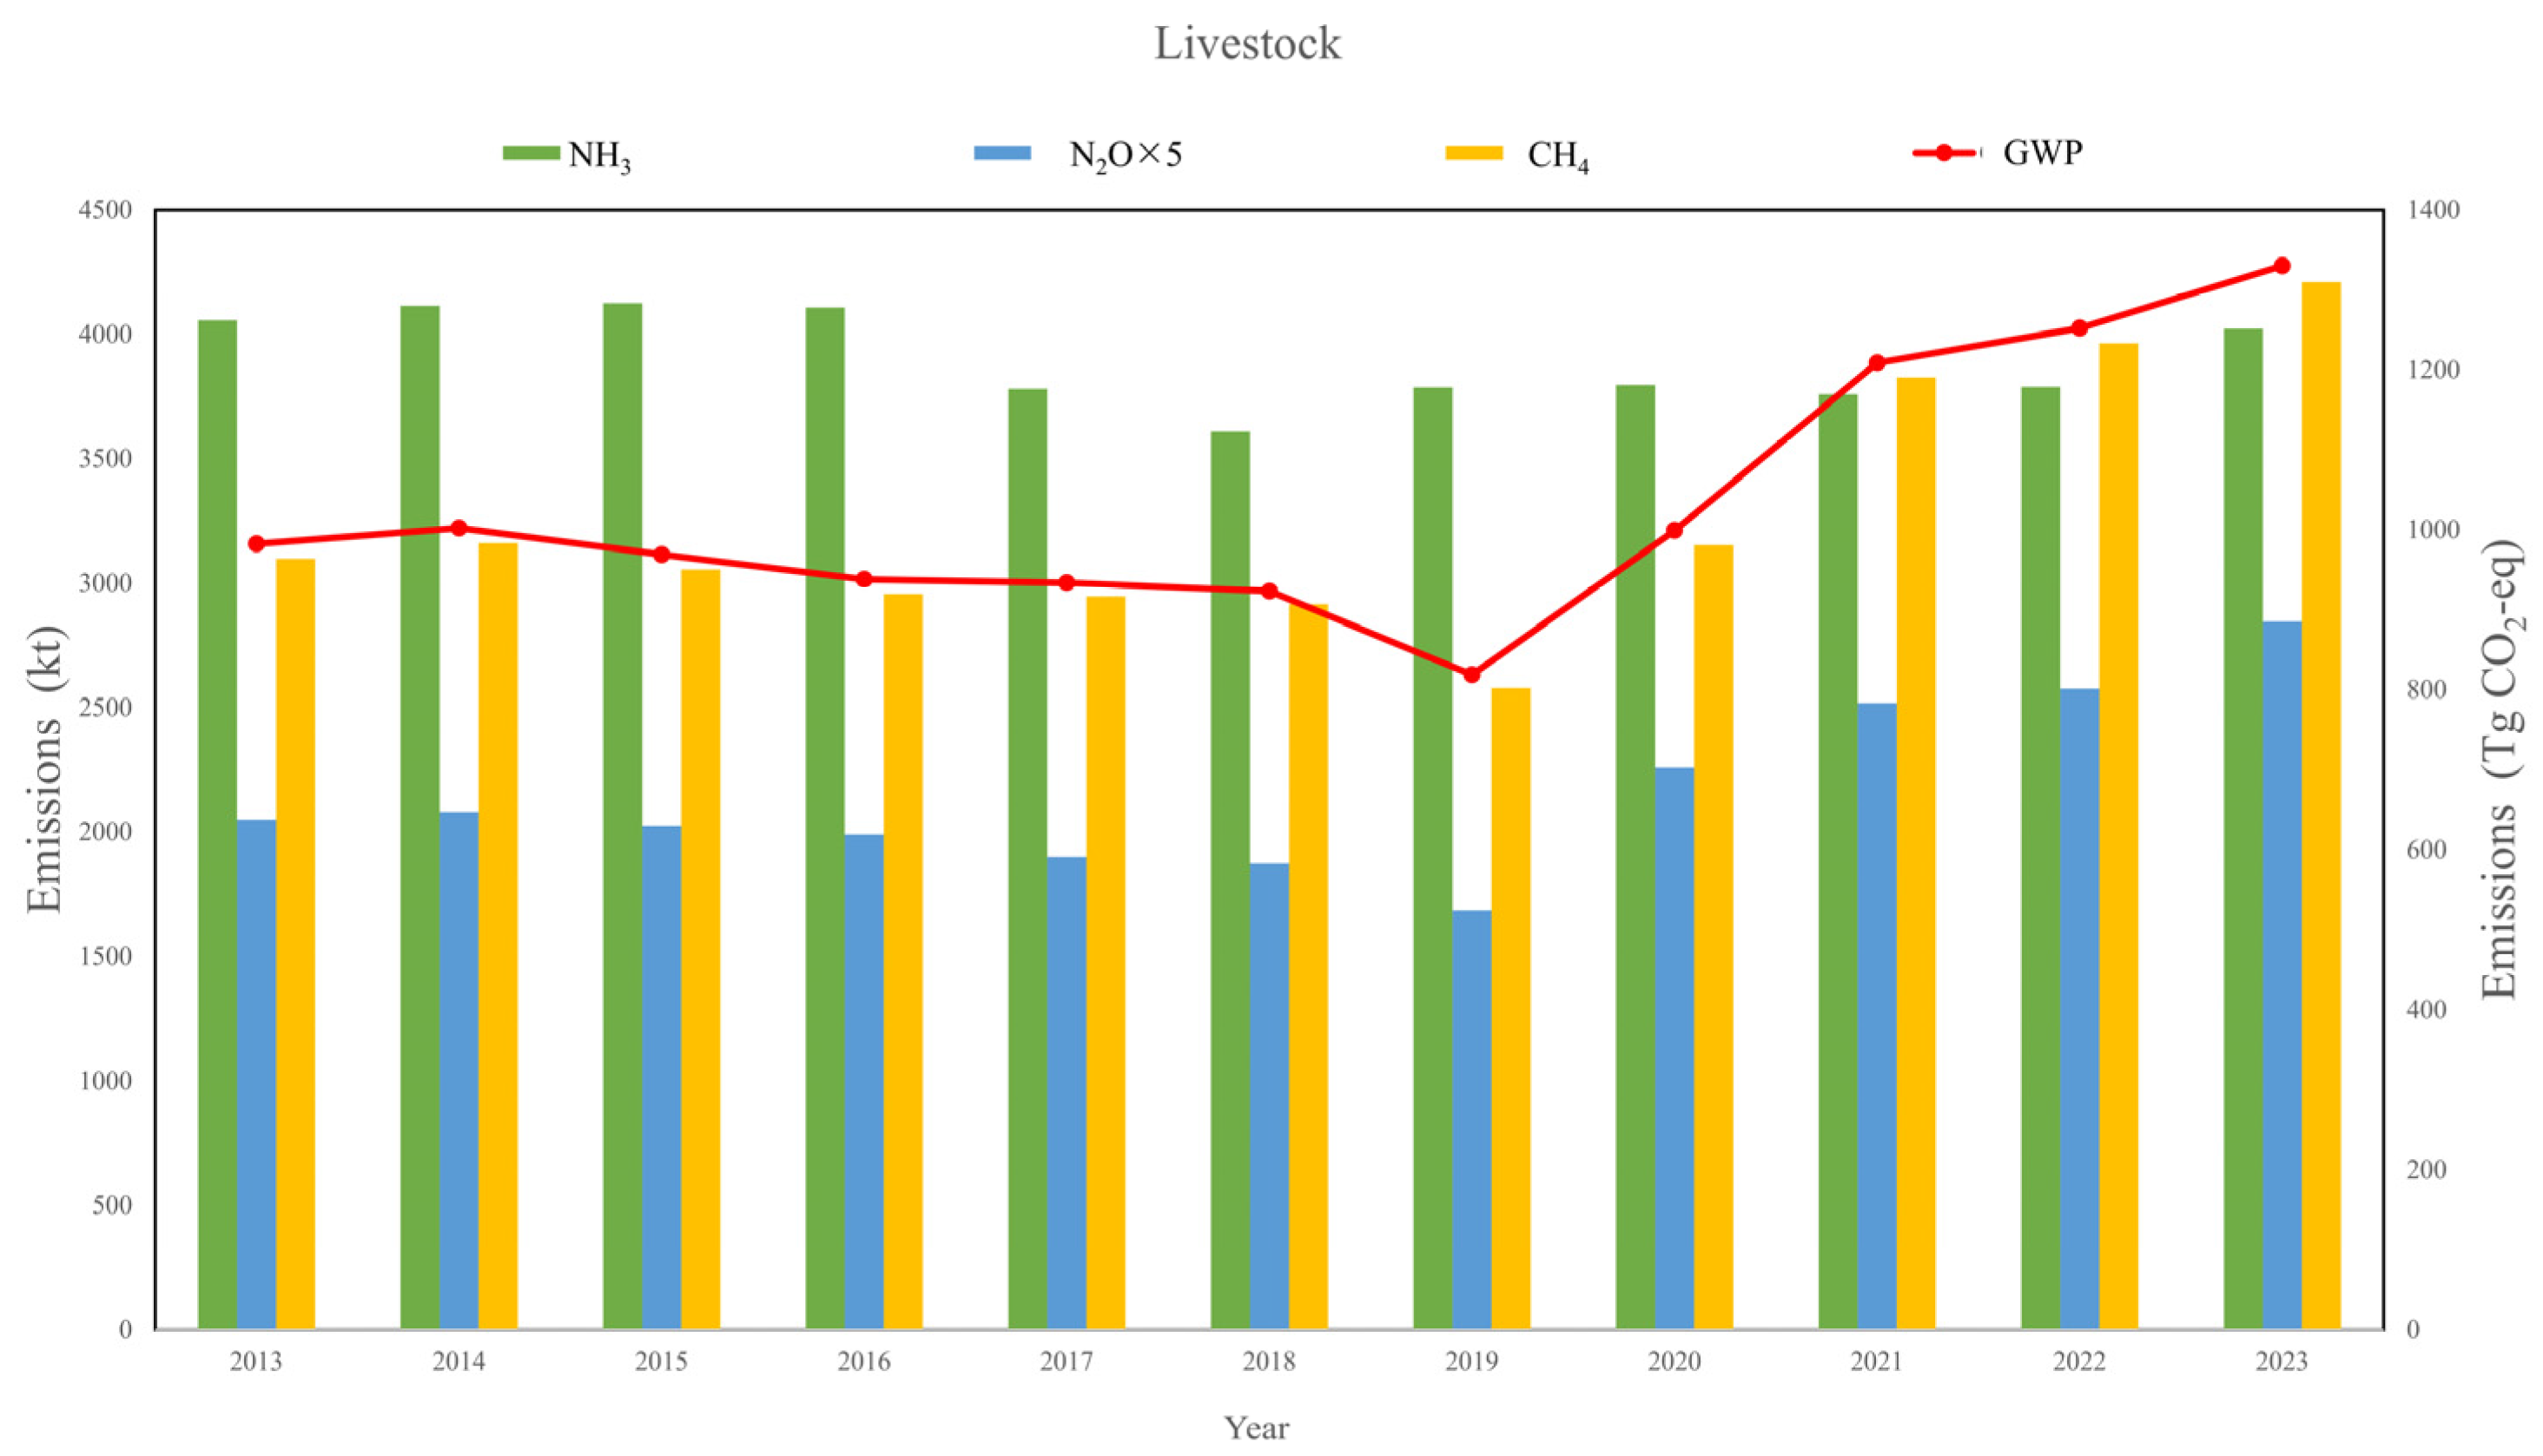
Livestock-related NH3, N2O, and CH4 emissions in China exhibited divergent trajectories during 2013–2023 (Figure 2). NH3 emissions decreased slightly from approximately 4.1 Tg in 2013 to 3.95 Tg in 2023 (−3.7%), reflecting improvements in manure management and partial adoption of emission mitigation practices. In contrast, N2O emissions increased from ~2.1 Tg to 2.3 Tg (+9.5%), driven largely by manure storage and treatment processes. CH4 emissions rose more substantially, from ~3.1 Tg in 2013 to ~4.2 Tg in 2023 (+35%), consistent with the expansion of ruminant livestock populations. As a result, the aggregated GWP of livestock emissions increased steadily from ~1100 Tg CO2-eq to ~1370 Tg CO2-eq (+24%), highlighting the dominant climate forcing role of CH4. These results align with previous studies that reported sustained growth in livestock-related non-CO2 GHG emissions in China. Our estimates of NH3 are broadly consistent with national inventories, while the upward CH4 trend parallels findings from the Emissions Database for Global Atmospheric Research (EDGAR) [41] and the Greenhouse Gas and Air Pollution Interactions and Synergies (GAINS) databases [42], though with slightly higher values, likely due to updated emission factors and refined activity data.

3.2. Contribution by Livestock Emissions

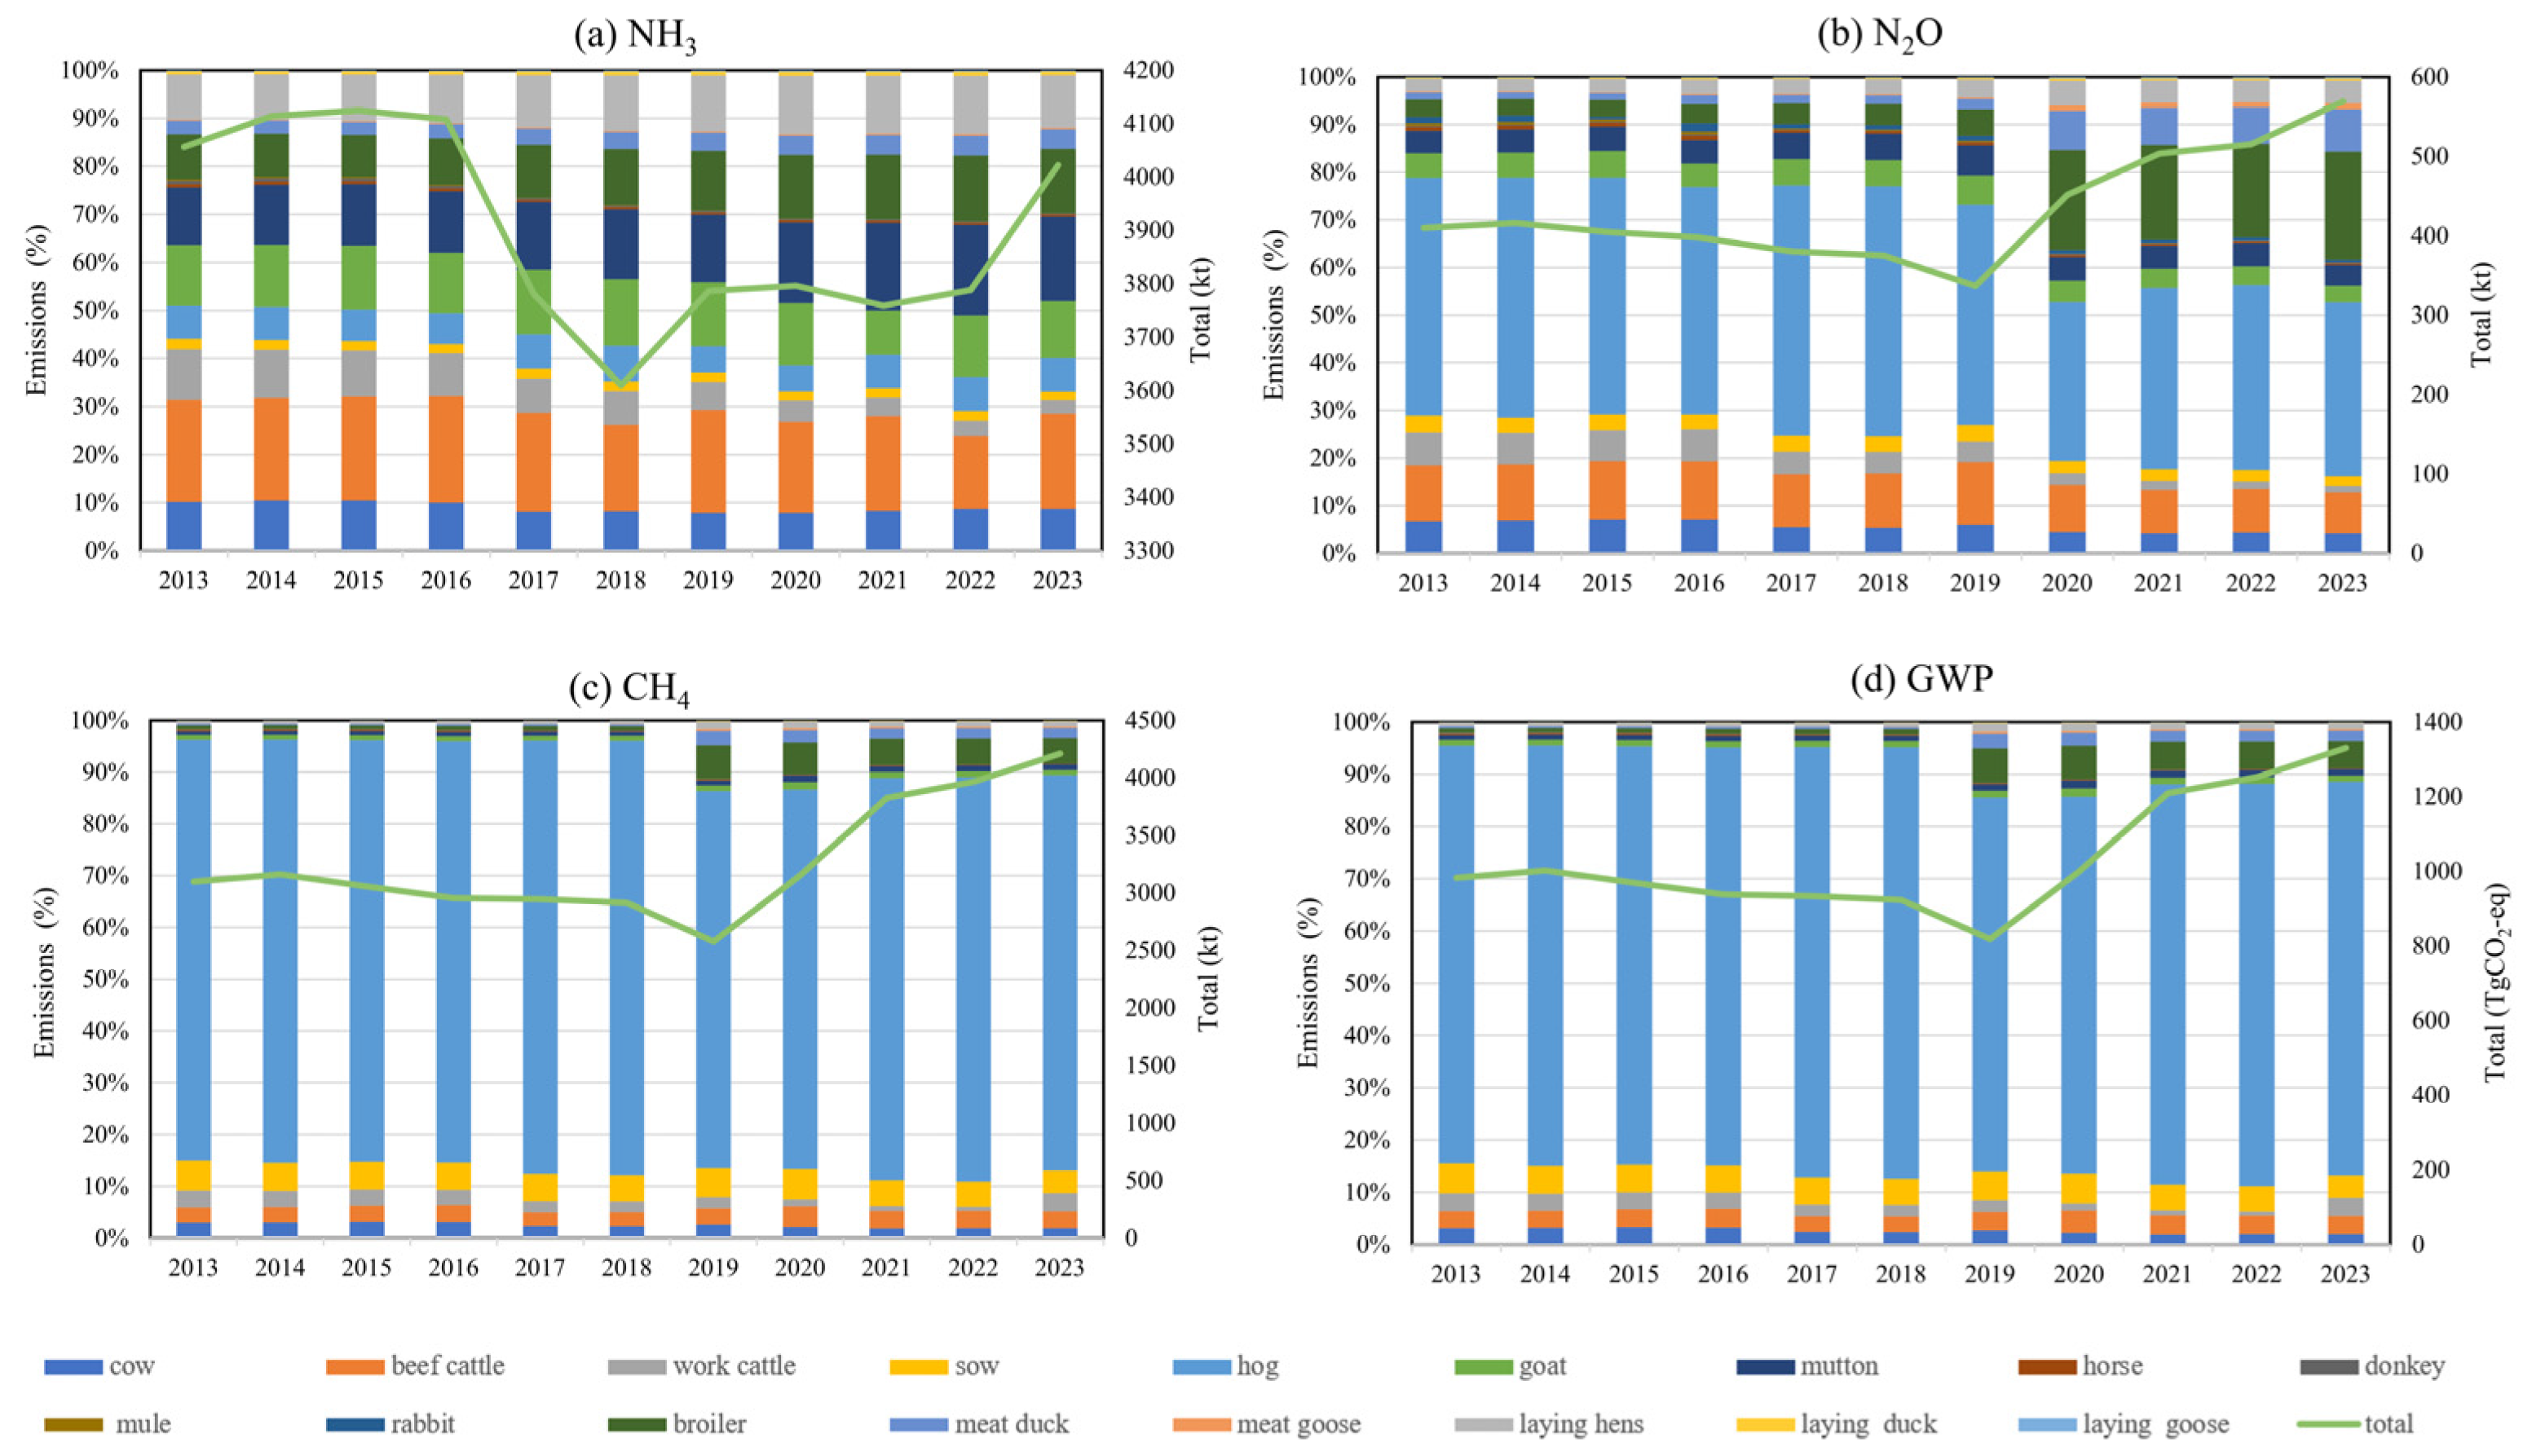
Figure 3 presents the relative contributions of different livestock categories specific to total agricultural livestock emissions of NH3, N2O, CH4, and the aggregated global warming potential (GWP) in China during 2013–2023. Distinct emission patterns are observed across gas species. For NH3 and N2O (Figure 3a,b), emissions are primarily attributable to pigs (sows and hogs), followed by cattle (dairy and beef). Poultry (broilers, layers, ducks, and geese) and small ruminants (sheep and goats) provide comparatively smaller contributions, though their shares exhibit a slight upward trend after 2018.
In addition, the contribution of the livestock manure management N2O is depicted in Figure 3b. It demonstrates that pigs, cattle, and poultry produce significant amounts of emissions, accounting for 40.97%, 19%, and 13% of total livestock N2O emissions in 2023. This could be ascribed to the relatively quick increase in meat, egg, and milk consumption in recent years, which resulted in greater production of these animals to meet the population’s daily nutrition requirements. Hog emissions constituted the largest proportion of the livestock emissions, which is related to people’s dietary habits. Emissions from poultry now make a more significant contribution due to the sharply increased consumption in recent years. In contrast, the lesser contributions provided by work livestock (30% to 5%) (include the work cattle, horses, donkeys, and mules) were discovered to be related to lower levels of activity data that were predominantly obtained for draft animals.
Figure 3c illustrates the livestock manure management CH4 emissions of the major categories. The results show that cattle’s relative contributions to these components have increased while work livestock emissions have dramatically decreased. With 4.5% of CH4 emissions coming from draft animals, they were the primary cause of emissions in 2000, whereas cattle contributed 4.6% of CH4 emissions, being the largest source of emissions in 2023. Pigs and sheep contributed significantly to the overall emissions at this time as well. The change in the proportion of contributing sources is caused by the increase in the number of beef cattle breeding, which suggests that more effective emission reduction measures should be taken at this source.
The relative contributions of different livestock types to total NH3, N2O, and CH4 emissions in China from 2013 to 2023 reveal clear species-specific patterns (Figure 3). NH3 emissions were predominantly associated with beef cattle production, accounting for nearly half of the total throughout the study period, followed by cattle and poultry, which together contributed more than 30%. This finding is consistent with previous studies that identified hog manure management as the single largest source of agricultural NH3 emissions in China [27]. N2O and CH4 emissions showed a similar structure, with hogs as the major contributor and poultry providing a smaller but gradually increasing share, in agreement with reports linking intensive poultry and swine housing to rising N2O release from manure storage. Consequently, the aggregated GWP of livestock emissions was primarily determined by hog CH4 emissions, although hog-derived NH3 and N2O also exerted a notable influence. Overall, these stable yet differentiated contribution patterns underscore the necessity of targeted mitigation measures, such as improving manure management in hog and poultry systems.

3.3. Spatial Variations

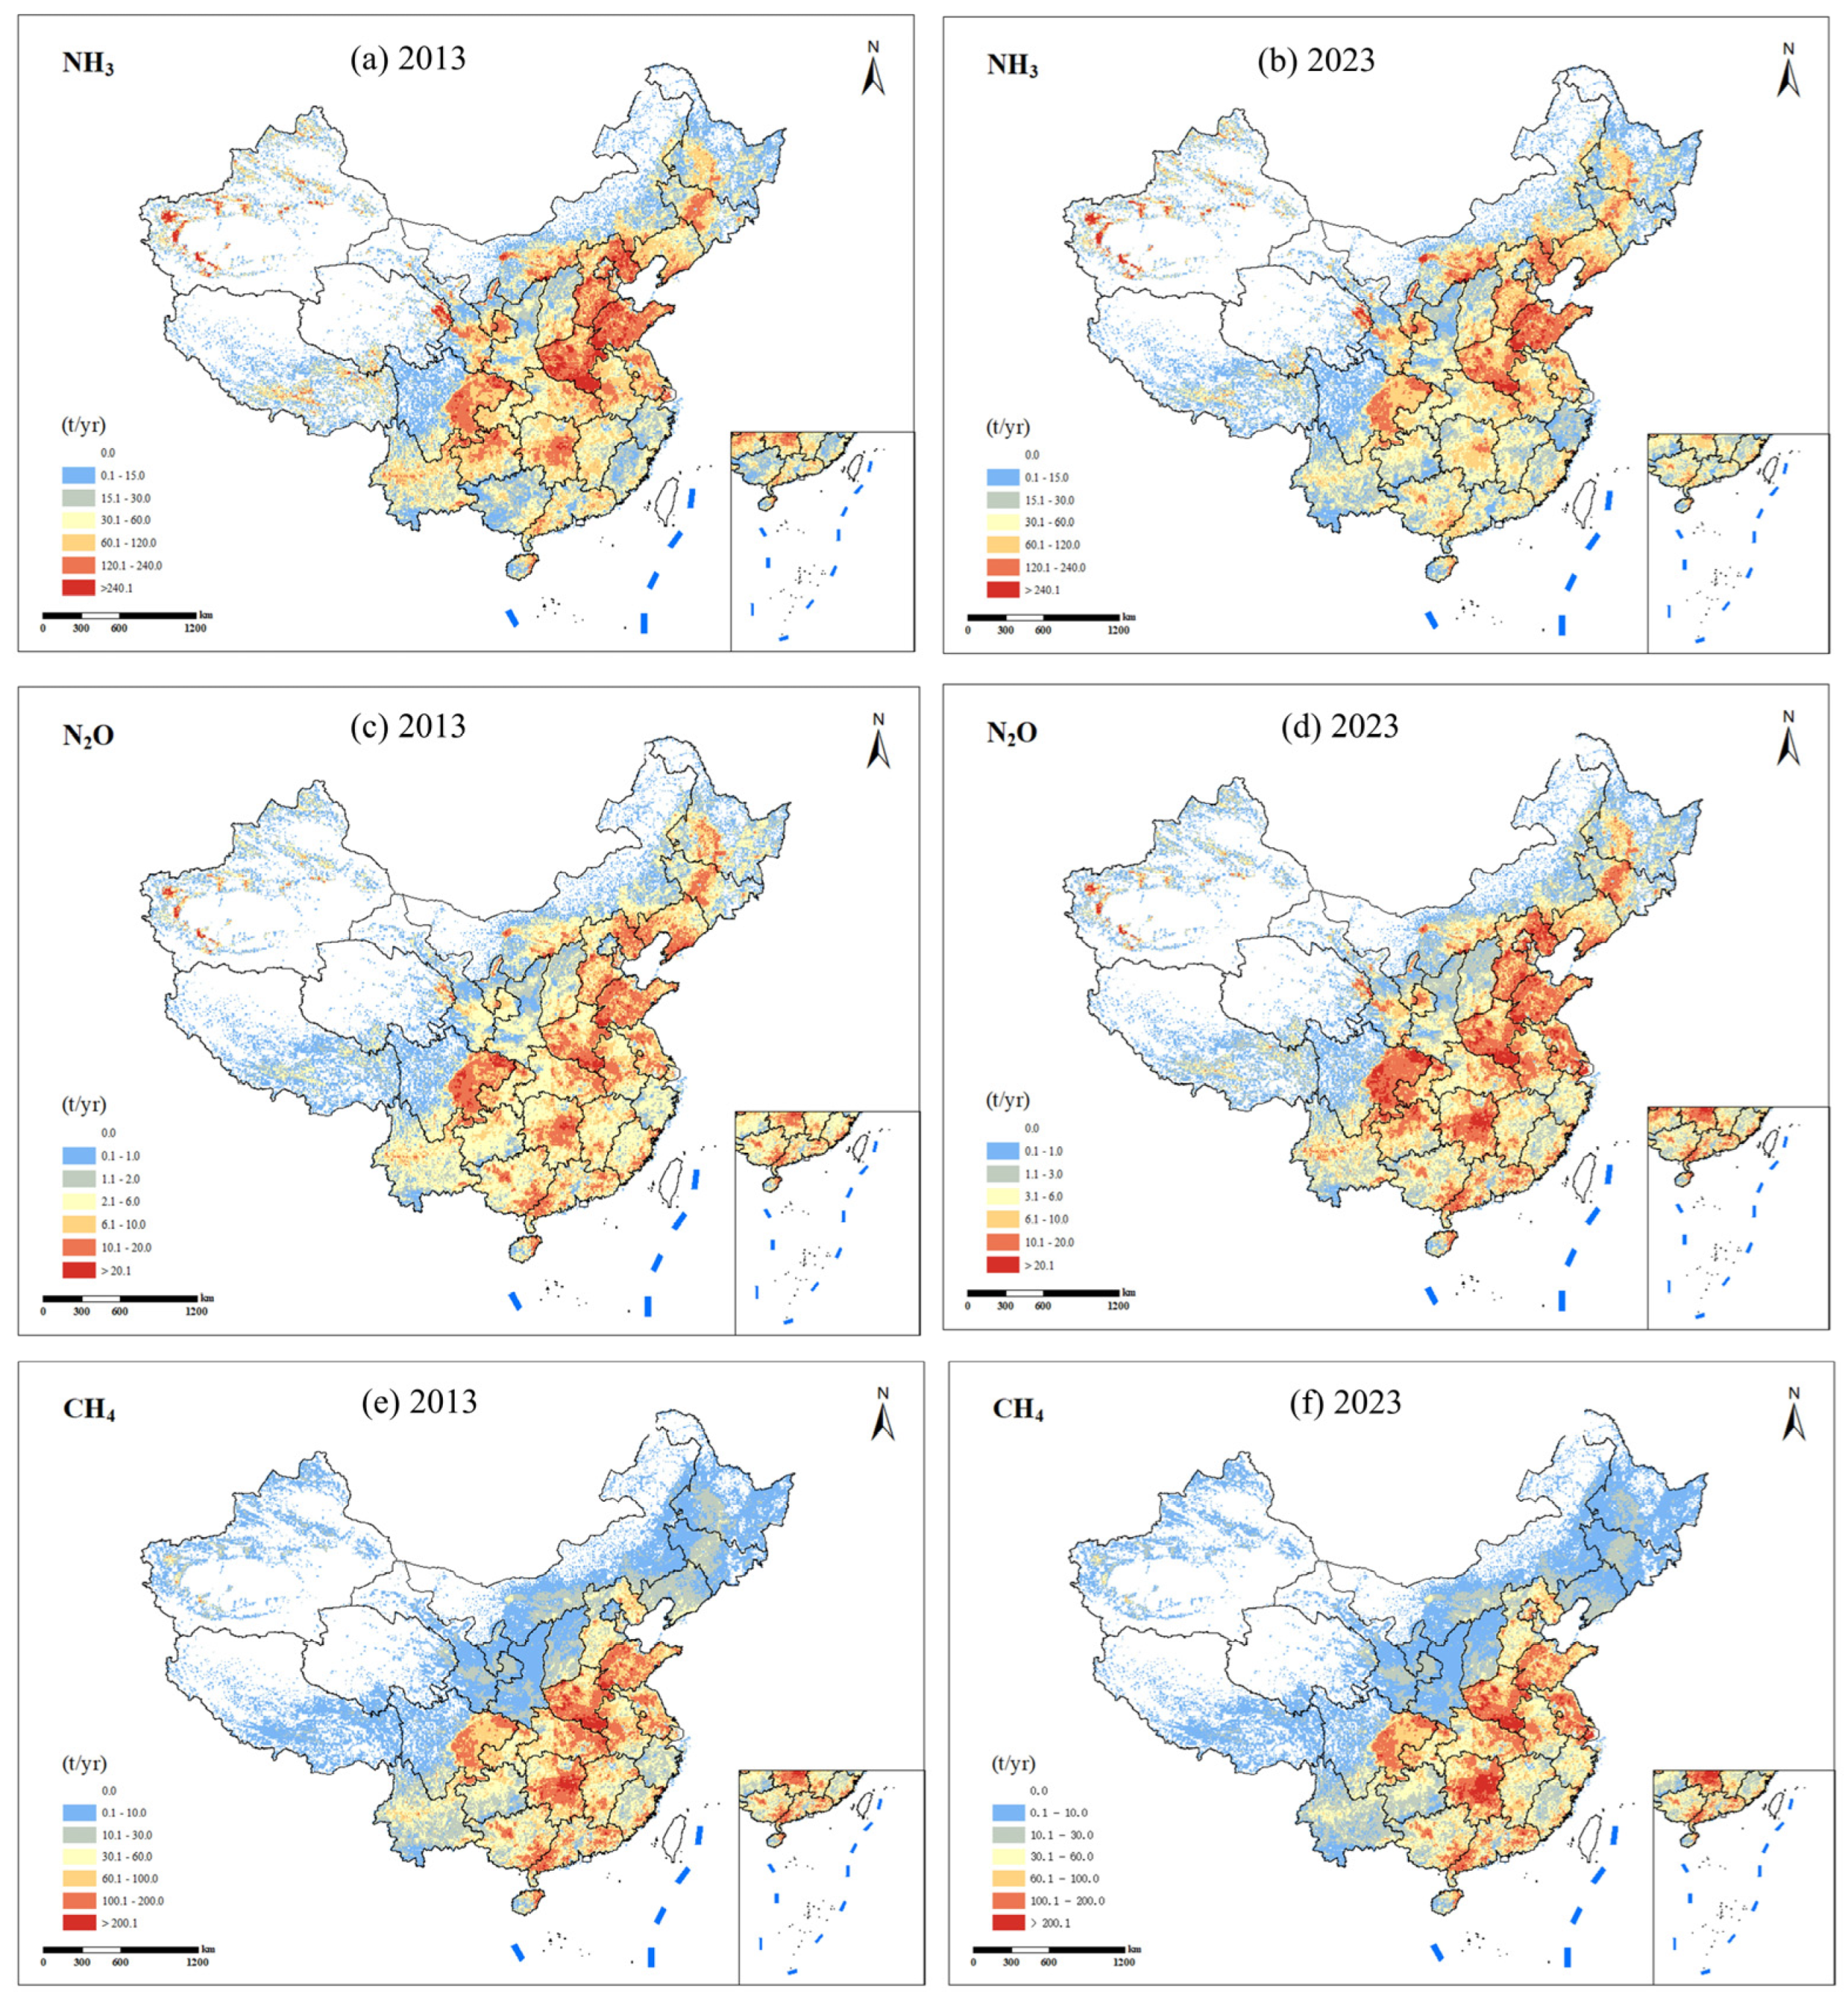
Spatial patterns of livestock-related NH3, N2O, and CH4 emissions in China exhibit pronounced regional heterogeneity (Figure 4). A comparison between 2013 and 2023 highlights both persistence and shifts in major emission hotspots. For NH3, the North China Plain and the Sichuan Basin remain dominant high-emission zones; however, emission intensity has slightly declined in parts of Shandong and Hebei while expanding southward into Hunan and Jiangxi, reflecting regional adjustments in livestock production and manure management practices. N2O emissions display similar spatial persistence but with intensified hotspots in Heilongjiang and Xinjiang, consistent with the expansion of large-scale livestock operations and forage crop cultivation. CH4 emissions remain concentrated in the Northeast, North China Plain, and Sichuan Basin, yet the spatial extent of high-emission areas has expanded notably in Heilongjiang and Inner Mongolia, indicating intensification of ruminant livestock systems.
These redistributions are attributable to three mechanisms, primarily structural adjustment and partial relocation of production toward central and western provinces. Additionally, tighter coupling of herds to local feed and grassland resources in the Northeast and Northwest due to climate change is increasing precipitation and temperature in the north. Finally, during the COVID-19 pandemic, migrant workers moved from eastern cities to rural areas, increasing the economic income through livestock and poultry farming, leading to increased emissions. Overall, while the primary emission clusters have persisted, the observed redistribution and intensification trends underscore the need for mitigation strategies that increasingly address emerging hotspots in central and western provinces alongside the traditionally dominant regions.

3.4. Identification of Key Uncertainty Sources

A comprehensive uncertainty analysis was conducted to evaluate the robustness of estimates of NH3 and GHG (N2O and CH4) emissions originating from livestock manure management (LMM) sources (Table 3). The uncertainty of NH3, N2O, and CH4 was estimated to be (−70.51%; 112.77%), (−52.34%; 71.63%), and (−67%; 136.07%), respectively. The uncertainty for livestock emissions is relatively moderate in this study because we applied a bottom-up approach and adopted recalibrated, China-specific emission factors with parameter adjustments for Chinese conditions, rather than relying on unmodified factors from other regions. This localization of parameters improves consistency with observed practices and helps constrain the uncertainty. Meanwhile, the results demonstrate pronounced variability across various agricultural sub-sectors for livestock. Poultry emissions exhibit the highest uncertainty range (−98.36% to +520.7%), followed by hogs and work cattle, reflecting the challenges in quantifying emissions from intensive and diverse production systems. In contrast, emissions from cattle, though still uncertain, show comparatively narrower bounds (−86.32% to +137.26%). These wide ranges underscore the necessity for improved data collection, enhanced field-based measurements, and the development of livestock species-specific emission factors tailored to local conditions.

3.5. Driving Forces and Policy Implications

The time series decomposition of agricultural livestock GWP emissions at the national level is presented in Figure 5, which includes both multiplicative (Figure 5a) and additive (Figure 5b) forms.
Figure 5a illustrates the long-term evolution of emission-driving factors in China’s agricultural sector from 2013 to 2023. Among the five contributors, affluence exhibited the most pronounced upward trend, rising steadily from the baseline to nearly 1.6 in 2023. This indicates that the improvement of living standards and increasing demand for animal products have been the dominant drivers of emission growth. Technology also showed a consistent increase, reaching over 1.4 by 2023, suggesting that the intensification and modernization of livestock production have exerted additional upward pressure on emissions. In contrast, efficiency declined markedly after 2013, reaching a minimum of ~0.7 in 2019–2020, before recovering slightly. This pattern demonstrates that efficiency improvements have played a significant role in mitigating emissions, although their effect has fluctuated. Structural changes presented a mild downward trend overall, contributing to emission reduction, but with intermittent rebounds during 2017–2020. Meanwhile, labor consistently decreased, reflecting rural depopulation and mechanization, which exerted a sustained but relatively modest mitigation effect.
The annual decomposition results (Figure 5b) further reveal the marginal contributions of each factor. Affluence and technology contributed positively in nearly all years, confirming their long-term role in driving emission increases. By contrast, efficiency exerted a strong negative effect in several years, particularly in 2015–2016 and 2018–2019 (−0.25 to −0.30), offsetting part of the growth driven by affluence and technology. However, efficiency temporarily turned positive in 2020–2021, weakening its mitigation role. Structural effects were relatively minor but variable, alternating between weak inhibition and promotion of emissions, with a noticeable positive effect in 2020–2021. Labor changes consistently contributed to emission reductions, though at a smaller magnitude compared to efficiency.
Overall, these results highlight a persistent tension between economic and technological growth versus efficiency and demographic shifts. While affluence and technology have continuously amplified agricultural emissions, improvements in production efficiency, structural optimization, and labor transitions have partially counteracted these pressures [43]. Nevertheless, the compensatory effects have proven insufficient to fully offset the increasing demand-driven emissions, indicating that without stronger technological innovation oriented towards mitigation [44], emissions from China’s agricultural sector are likely to remain on an upward trajectory.
The decomposition results provide critical insights for designing effective mitigation strategies in China’s agricultural livestock sector. First, the consistently positive contribution of affluence highlights the challenge of reconciling emission control with rising demand for livestock products. This underscores the need to promote dietary transitions and encourage the consumption of low-emission protein alternatives. Second, the persistent upward pressure from technology suggests that modernization, if oriented solely toward production intensification, may inadvertently accelerate emissions. Therefore, policy incentives should prioritize green technological innovation, including precision feeding, manure management, and low-emission breeding systems, to ensure that technological progress translates into emission reduction rather than expansion.
Meanwhile, the negative effects of efficiency and labor factors demonstrate the potential for emission abatement through improved production efficiency and structural transformation. Enhancing productivity per unit of input, together with promoting region-specific structural optimization—such as shifting production away from environmentally sensitive regions—could generate substantial co-benefits for both climate and air quality. Furthermore, the observed variability of structural effects suggests that regionalized and species-specific policies are essential, targeting dominant sources such as pigs in eastern and southwestern China.
In sum, the findings indicate that China’s agricultural emission mitigation should rely on a dual approach: curbing demand-side growth while accelerating efficiency-oriented and low-carbon technological innovations. Such integrated strategies would enable the sector to balance food security with emission reduction, thereby contributing to national carbon neutrality and global climate goals.

3.6. Provincial Discrepancies and Mitigation Strategies

Provincial livestock manure GWP emissions in China between 2013 and 2023 exhibited substantial spatial heterogeneity, with both increases and declines observed across provinces (Table 4). The regional heterogeneity of livestock manure GHG emissions suggests that uniform mitigation strategies may not be effective. Instead, region-specific policies are needed. Sichuan, Henan, and Shandong consistently ranked among the largest contributors, reflecting their intensive livestock production bases and high animal population densities. Specifically, Sichuan maintained the highest emissions until 2020, after which Shandong surpassed it, reaching 24.48 Tg in 2023, while Henan shifted from the second-largest emitter in 2013–2017 to third place by 2023. Provinces in central and southern China, such as Hunan (18.39 Tg in 2023), Guangxi (16.46 Tg), and Guangdong (16.55 Tg), also remained within the top ten, underscoring their persistent importance in the national livestock emission profile. These high-emission provinces (Sichuan, Shandong, Henan, Hunan, Guangdong, Guangxi) should be prioritized for targeted manure management interventions, including improved biogas recovery, composting, and precision feeding technologies. Given their scale, even modest reductions could deliver substantial national benefits.
By contrast, metropolitan regions with limited livestock activity—including Beijing, Shanghai, and Tianjin—consistently reported the lowest emissions (<1 Tg) and remained at the bottom of the national ranking (28th–31st). Western provinces such as Tibet, Qinghai, Ningxia, and Hainan also showed relatively low emissions (<3 Tg), largely due to smaller populations and reduced demand for intensive livestock production. The contribution of low-emission regions (Beijing, Shanghai, Tianjin, Tibet, Qinghai, Ningxia, Hainan) to national totals is limited, and they can serve as pilot zones for innovative manure treatment technologies and provide replicable models for sustainable urban–rural integration in livestock management.
However, pastoral regions like Inner Mongolia and Xinjiang contributed moderate but non-negligible amounts, ranging from 7 to 10 Tg in recent years; although emissions are moderate, these areas host extensive ruminant systems with strong cultural and livelihood importance. Policies should focus on promoting grazing management, feed efficiency, and ruminant-specific mitigation options (e.g., methane inhibitors). Emerging hotspots (Anhui, Fujian, Jiangxi, Yunnan) experienced accelerated emission growth after 2017, indicating shifts in production patterns. Early implementation of mitigation measures in these areas can prevent the entrenchment of high-emission production systems.

4. Conclusions and Limitations

This study provides one of the first decadal-scale assessments of livestock-related NH3, N2O, and CH4 emissions in China during 2013–2023, highlighting both persistent and shifting emission patterns. Our results show that national NH3 emissions declined slightly (−3.7%), whereas N2O (+9.5%) and CH4 (+35%) increased, leading to a 24% rise in the aggregated GWP (from ~1100 Tg to ~1370 Tg CO2-eq). Swine remained the dominant contributors to NH3 and N2O, while poultry emissions also rose significantly in recent years, reflecting intensified production. Spatially, the North China Plain and the Sichuan Basin persisted as major hotspots, while new high-emission regions emerged in Hunan, Jiangxi, Heilongjiang, and Xinjiang after 2017, indicating structural shifts in livestock production. Despite only modest national-scale changes, the analysis revealed pronounced source- and region-specific heterogeneity, underscoring the necessity of differentiated mitigation approaches. High-emission provinces should be prioritized for intensive manure management interventions, pastoral regions require ruminant-specific measures, low-emission areas may serve as innovation pilots, and emerging hotspots warrant early preventive action. Taken together, these findings demonstrate that uniform strategies are unlikely to be effective, and that region- and species-targeted mitigation pathways are essential to simultaneously advance air quality improvement and support China’s national climate goals.
Although this study updates 2013–2023 livestock manure emission trends and couples them with key drivers, providing recommendations for emission reductions, two limitations still need to be improved in future studies. First, the driver analysis considers only macroeconomic development levels, overlooking potential trade-offs, co-benefits, and implementation barriers, as well as explicit policy interventions. Incorporating policy-specific scenarios and quantifying their impacts on future emission trajectories would enhance the study’s depth and policy relevance. Second, future work should model how livestock NH3 emissions and their mitigation alter particulate-matter composition and how greenhouse gas emissions and mitigation modify radiative forcing. The implications for carbon neutrality and air quality improvement should be articulated more explicitly.

Supplementary Materials

The following supporting information can be downloaded at https://www.mdpi.com/article/10.3390/toxics13110933/s1. Table S1: The number of livestock and poultry breeding in 2023 (ten thousand heads). Table S2: NH3 emission factors from livestock manure management. Table S3: N2O emission factors from livestock manure management (kg N2O/head). Table S4: CH4 emission factors from livestock manure management (kgCH4/head). Table S5: Parameters used for uncertainty analysis.

Author Contributions

Conceptualization, methodology and validation, X.Z.; formal analysis, Z.W.; visualization, J.W.; writing—review and editing, supervision and funding acquisition, Q.S. All authors have read and agreed to the published version of the manuscript.

Funding

This work was supported by the National Natural Science Foundation of China (42305112), the Guangdong Basic and Applied Basic Research Foundation (2025A1515011328), and the National Key Research and Development Program of China (2022YFC3700604).

Institutional Review Board Statement

Not applicable.

Informed Consent Statement

Not applicable.

Data Availability Statement

The original contributions presented in the study are included in the article/Supplementary Material; further inquiries can be directed to the corresponding authors.

Conflicts of Interest

The authors declare no conflicts of interest.

References

  1. Shi, L.; Shi, G.; Qiu, H. General review of intelligent agriculture development in China. China Agric. Econ. Rev. 2018, 11, 39–51. [Google Scholar] [CrossRef]
  2. Hena, S.; Luan, J.; Rehman, A.; Zhang, O. A comparative analysis of agricultural development and modernization between China and Pakistan. Int. J. Adv. Appl. Sci. 2019, 6, 81–94. [Google Scholar] [CrossRef]
  3. CSY. China Statistical Yearbook; 2014–2024. China Statistics Press: Beijing, China. Available online: https://www.stats.gov.cn/english/Statisticaldata/yearbook/ (accessed on 26 October 2025).
  4. Nie, S.; Yang, J.; Guo, H. China Animal Husbandry Yearbook; 2014–2024. China Agriculture Press: Beijing, China. Available online: https://www.stats.gov.cn/sj/ndsj/2024/indexeh.htm (accessed on 26 October 2025).
  5. CRSY. China Rural Statistical Yearbook; 2014–2024. China Statistics Press: Beijing, China. Available online: https://data.oversea.cnki.net/en/trade/yearBook/single?id=N2025020018&nav=Statistical+Yearbooks&zcode=Z009&utm (accessed on 26 October 2025).
  6. Ju, X.; Zhang, F.; Bao, X.; Römheld, V.; Roelcke, M. Utilization and management of organic wastes in Chinese agriculture: Past, present and perspectives. Sci. China Ser. C Life Sci. 2005, 48, 965–979. [Google Scholar] [CrossRef]
  7. Menzi, H.; Oenema, O.; Burton, C.H.; Shipin, O.; Gerber, P. Impacts of intensive livestock production and manure management on the environment (Chapter 9). In Livestock in A Changing Landscape: Drivers, Consequences and Responses; Steinfeld, H., Ed.; Island Press: Washington, DC, USA, 2010; Volume 1, pp. 139–163. [Google Scholar]
  8. Bai, Z.; Ma, W.; Ma, L.; Velthof, G.L.; Wei, Z.; Havlík, P.; Oenema, O.; Lee, M.R.F.; Zhang, F. China’s livestock transition: Driving forces, impacts, and consequences. Sci. Adv. 2018, 4, eaar8534. [Google Scholar] [CrossRef]
  9. Bai, M.; Impraim, R.; Coates, T.; Flesch, T.; Trouvé, R.; van Grinsven, H.; Cao, Y.; Hill, J.; Chen, D. Lignite effects on NH3, N2O, CO2 and CH4 emissions during composting of manure. J. Environ. Manag. 2020, 271, 110960. [Google Scholar] [CrossRef] [PubMed]
  10. Zhou, Z.; Zhu, Z.; Dong, H.; Chen, Y.; Shang, B. NH3, N2O, CH4 and CO2 emissions from growing process of caged broilers. Environ. Sci. 2013, 34, 2098–2106. [Google Scholar] [CrossRef]
  11. Wang, Y.; Li, X.; Yang, J.; Tian, Z.; Sun, Q.; Xue, W.; Dong, H. Mitigating greenhouse gas and ammonia emissions from beef cattle feedlot production: A system meta-analysis. Environ. Sci. Technol. 2018, 52, 11232–11242. [Google Scholar] [CrossRef]
  12. Tang, R.; Zhao, J.; Liu, Y.; Huang, X.; Zhang, Y.; Zhou, D.; Ding, A.; Nielsen, C.P.; Wang, H. Air quality and health co-benefits of China’s carbon dioxide emissions peaking before 2030. Nat. Commun. 2022, 13, 1008. [Google Scholar] [CrossRef] [PubMed]
  13. Huang, X.; Song, Y.; Li, M.; Li, J.; Huo, Q.; Cai, X.; Zhu, T.; Hu, M.; Zhang, H. A high-resolution ammonia emission inventory in China. Glob. Biogeochem. Cycl. 2012, 26, GB1030. [Google Scholar] [CrossRef]
  14. Kang, Y.; Liu, M.; Song, Y.; Huang, X.; Yao, H.; Cai, X.; Zhang, H.; Kang, L.; Liu, X.; Yan, X.; et al. High-resolution ammonia emissions inventories in China from 1980 to 2012. Atmos. Chem. Phys. 2016, 16, 2043–2058. [Google Scholar] [CrossRef]
  15. Zhang, L.; Chen, Y.; Zhao, Y.; Henze, D.K.; Zhu, L.; Song, Y.; Paulot, F.; Liu, X.; Pan, Y.; Lin, Y.; et al. Agricultural ammonia emissions in China: Reconciling bottom-up and top-down estimates. Atmos. Chem. Phys. 2018, 18, 339–355. [Google Scholar] [CrossRef]
  16. Zhou, F.; Shang, Z.; Ciais, P.; Tao, S.; Piao, S.; Raymond, P.; He, C.; Li, B.; Wang, R.; Wang, X.; et al. A new high-resolution N2O emission inventory for China in 2008. Environ. Sci. Technol. 2014, 48, 8538–8547. [Google Scholar] [CrossRef]
  17. Tian, H.; Pan, N.; Thompson, R.L.; Canadell, J.G.; Suntharalingam, P.; Regnier, P.; Davidson, E.A.; Prather, M.; Ciais, P.; Muntean, M.; et al. Global nitrous oxide budget (1980–2020). Earth Syst. Sci. Data 2024, 16, 2543–2604. [Google Scholar] [CrossRef]
  18. Wang, G.; Liu, P.; Hu, J.; Zhang, F. Agriculture-induced N2O emissions and reduction strategies in china. Int. J. Environ. Res. Public Health 2022, 19, 12193. [Google Scholar] [CrossRef] [PubMed]
  19. Peng, S.; Piao, S.; Bousquet, P.; Ciais, P.; Li, B.; Lin, X.; Tao, S.; Wang, Z.; Zhang, Y.; Zhou, F. Inventory of anthropogenic methane emissions in mainland China from 1980 to 2010. Atmos. Chem. Phys. 2016, 16, 14545–14562. [Google Scholar] [CrossRef]
  20. Huang, M.; Wang, T.; Zhao, X.; Xiaodong, X.; Wang, D. Estimation of atmospheric methane emissions and its spatial distribution in China during 2015. Acta Sci. Circumst. 2019, 39, 1371–1380. [Google Scholar] [CrossRef]
  21. Gong, S.; Shi, Y. Evaluation of comprehensive monthly-gridded methane emissions from natural and anthropogenic sources in China. Sci. Total Environ. 2021, 784, 147116. [Google Scholar] [CrossRef] [PubMed]
  22. Li, L.; Zhang, Y.; Zhou, T.; Wang, K.; Wang, C.; Wang, T.; Yuan, L.; An, K.; Zhou, C.; Lü, G. Mitigation of China’s carbon neutrality to global warming. Nat. Commun. 2022, 13, 5315. [Google Scholar] [CrossRef]
  23. Lei, Y.; Yin, Z.; Lu, X.; Zhang, Q.; Gong, J.; Cai, B.; Cai, C.; Chai, Q.; Chen, H.; Chen, R.; et al. The 2022 report of synergetic roadmap on carbon neutrality and clean air for China: Accelerating transition in key sectors. Environ. Sci. Ecotechnol. 2024, 19, 100335. [Google Scholar] [CrossRef]
  24. Zheng, J.Y.; Yin, S.S.; Kang, D.W.; Che, W.W.; Zhong, L.J. Development and uncertainty analysis of a high-resolution NH3 emissions inventory and its implications with precipitation over the Pearl River Delta region, China. Atmos. Chem. Phys. 2012, 12, 7041–7058. [Google Scholar] [CrossRef]
  25. Zhong, Z.; Sha, Q.E.; Zheng, J.; Yuan, Z.; Gao, Z.; Ou, J.; Zheng, Z.; Li, C.; Huang, Z. Sector-based VOCs emission factors and source profiles for the surface coating industry in the Pearl River Delta region of China. Sci. Total Environ. 2017, 583, 19–28. [Google Scholar] [CrossRef]
  26. Bian, Y.; Huang, Z.; Ou, J.; Zhong, Z.; Xu, Y.; Zhang, Z.; Xiao, X.; Ye, X.; Wu, Y.; Yin, X.; et al. Evolution of anthropogenic air pollutant emissions in Guangdong Province, China, from 2006 to 2015. Atmos. Chem. Phys. 2019, 19, 11701–11719. [Google Scholar] [CrossRef]
  27. Xu, P.; Liao, Y.J.; Lin, Y.H.; Zhao, C.X.; Yan, C.H.; Cao, M.N.; Wang, G.S.; Luan, S.J. High-resolution inventory of ammonia emissions from agricultural fertilizer in China from 1978 to 2008. Atmos. Chem. Phys. 2016, 16, 1207–1218. [Google Scholar] [CrossRef]
  28. Liang, M.; Zhou, Z.; Ren, P.; Xiao, H.; Xu, R.; Hu, Z.; Piao, S.; Tian, H.; Tong, Q.; Zhou, F.; et al. Four decades of full-scale nitrous oxide emission inventory in China. Natl. Sci. Rev. 2024, 11, nwad285. [Google Scholar] [CrossRef] [PubMed]
  29. Luo, Z.; Lam, S.K.; Fu, H.; Hu, S.; Chen, D. Temporal and spatial evolution of nitrous oxide emissions in China: Assessment, strategy and recommendation. J. Clean. Prod. 2019, 223, 360–367. [Google Scholar] [CrossRef]
  30. Yuan, W.; Liang, M.; Gao, Y.; Huang, L.; Dan, L.; Duan, H.; Hong, S.; Jiang, F.; Ju, W.; Li, T.; et al. China’s greenhouse gas budget during 2000–2023. Natl. Sci. Rev. 2025, 12, nwaf069. [Google Scholar] [CrossRef]
  31. Chen, M.; Cui, Y.; Jiang, S.; Forsell, N. Toward carbon neutrality before 2060: Trajectory and technical mitigation potential of non-CO2 greenhouse gas emissions from Chinese agriculture. J. Clean. Prod. 2022, 368, 133186. [Google Scholar] [CrossRef]
  32. MCA. Administrative Division Code. Available online: https://www.mca.gov.cn/n156/n186/index.html (accessed on 15 November 2024).
  33. CAS. The Resource and Environment Data Cloud Platform. Available online: http://www.resdc.cn (accessed on 15 November 2024).
  34. Zhang, X.; Sha, Q.e.; Liao, S.; Wang, J.; Wu, Z.; Chen, H.; Jiang, S.; Liu, L.; Zhang, C. Agricultural sector homologous emission inventory of air pollutants and greenhouse gases for China. Sustainability 2025, 17, 2966. [Google Scholar] [CrossRef]
  35. Rural Social and Economic Survey Department of the National Bureau of Statistics. Compilation of Statistics Data of Chinese Agriculture: 1949–2019; China Statistics Press: Beijing, China, 2020. [Google Scholar]
  36. MEE. Technical Guidelines for the Preparation of Atmospheric Ammonia Source Emission Inventory (Trial); China Environmental Science Press: Beijing, China, 2014. [Google Scholar]
  37. NDRC. Guidelines on Provincial Greenhouse Gas Emission Inventory (Trial); National Development and Reform Commission of the People’s Republic of China: Beijing, China, 2011.
  38. IPCC. Climate Change 2021: The Physical Science Basis; Intergovernmental Panel on Climate Change: Cambridge, UK; New York, NY, USA, 2021. [Google Scholar]
  39. Huang, Z.; Zhong, Z.; Sha, Q.; Xu, Y.; Zhang, Z.; Wu, L.; Wang, Y.; Zhang, L.; Cui, X.; Tang, M.; et al. An updated model-ready emission inventory for Guangdong Province by incorporating big data and mapping onto multiple chemical mechanisms. Sci. Total Environ. 2021, 769, 144535. [Google Scholar] [CrossRef]
  40. Lyu, W.; Li, Y.; Guan, D.; Zhao, H.; Zhang, Q.; Liu, Z. Driving forces of Chinese primary air pollution emissions: An index decomposition analysis. J. Clean. Prod. 2016, 133, 136–144. [Google Scholar] [CrossRef]
  41. Crippa, M.; Solazzo, E.; Huang, G.; Guizzardi, D.; Koffi, E.; Muntean, M.; Schieberle, C.; Friedrich, R.; Janssens-Maenhout, G. High resolution temporal profiles in the Emissions Database for Global Atmospheric Research. Sci. Data 2020, 7, 121. [Google Scholar] [CrossRef] [PubMed]
  42. Amann, M.; Jiang, K.; Jiming, H.; Wang, S.; Xing, Z.; Wei, W.; Xiang, D.; Hong, L.; Xing, J.; Chuying, Z.; et al. GAINS-Asia: Scenarios for Cost-Effective Control of Air Pollution and Greenhouse Gases in China; International Institute for Applied Systems Analysis (IIASA): Laxenburg, Austria, 2008. [Google Scholar]
  43. Dietz, T.; Rosa, E.A. Effects of population and affluence on CO2 emissions. Proc. Natl. Acad. Sci. USA 1997, 94, 175–179. [Google Scholar] [CrossRef] [PubMed]
  44. Rosa, E.A.; Dietz, T. Human drivers of national greenhouse-gas emissions. Nat. Clima. Chang. 2012, 2, 581–586. [Google Scholar] [CrossRef]
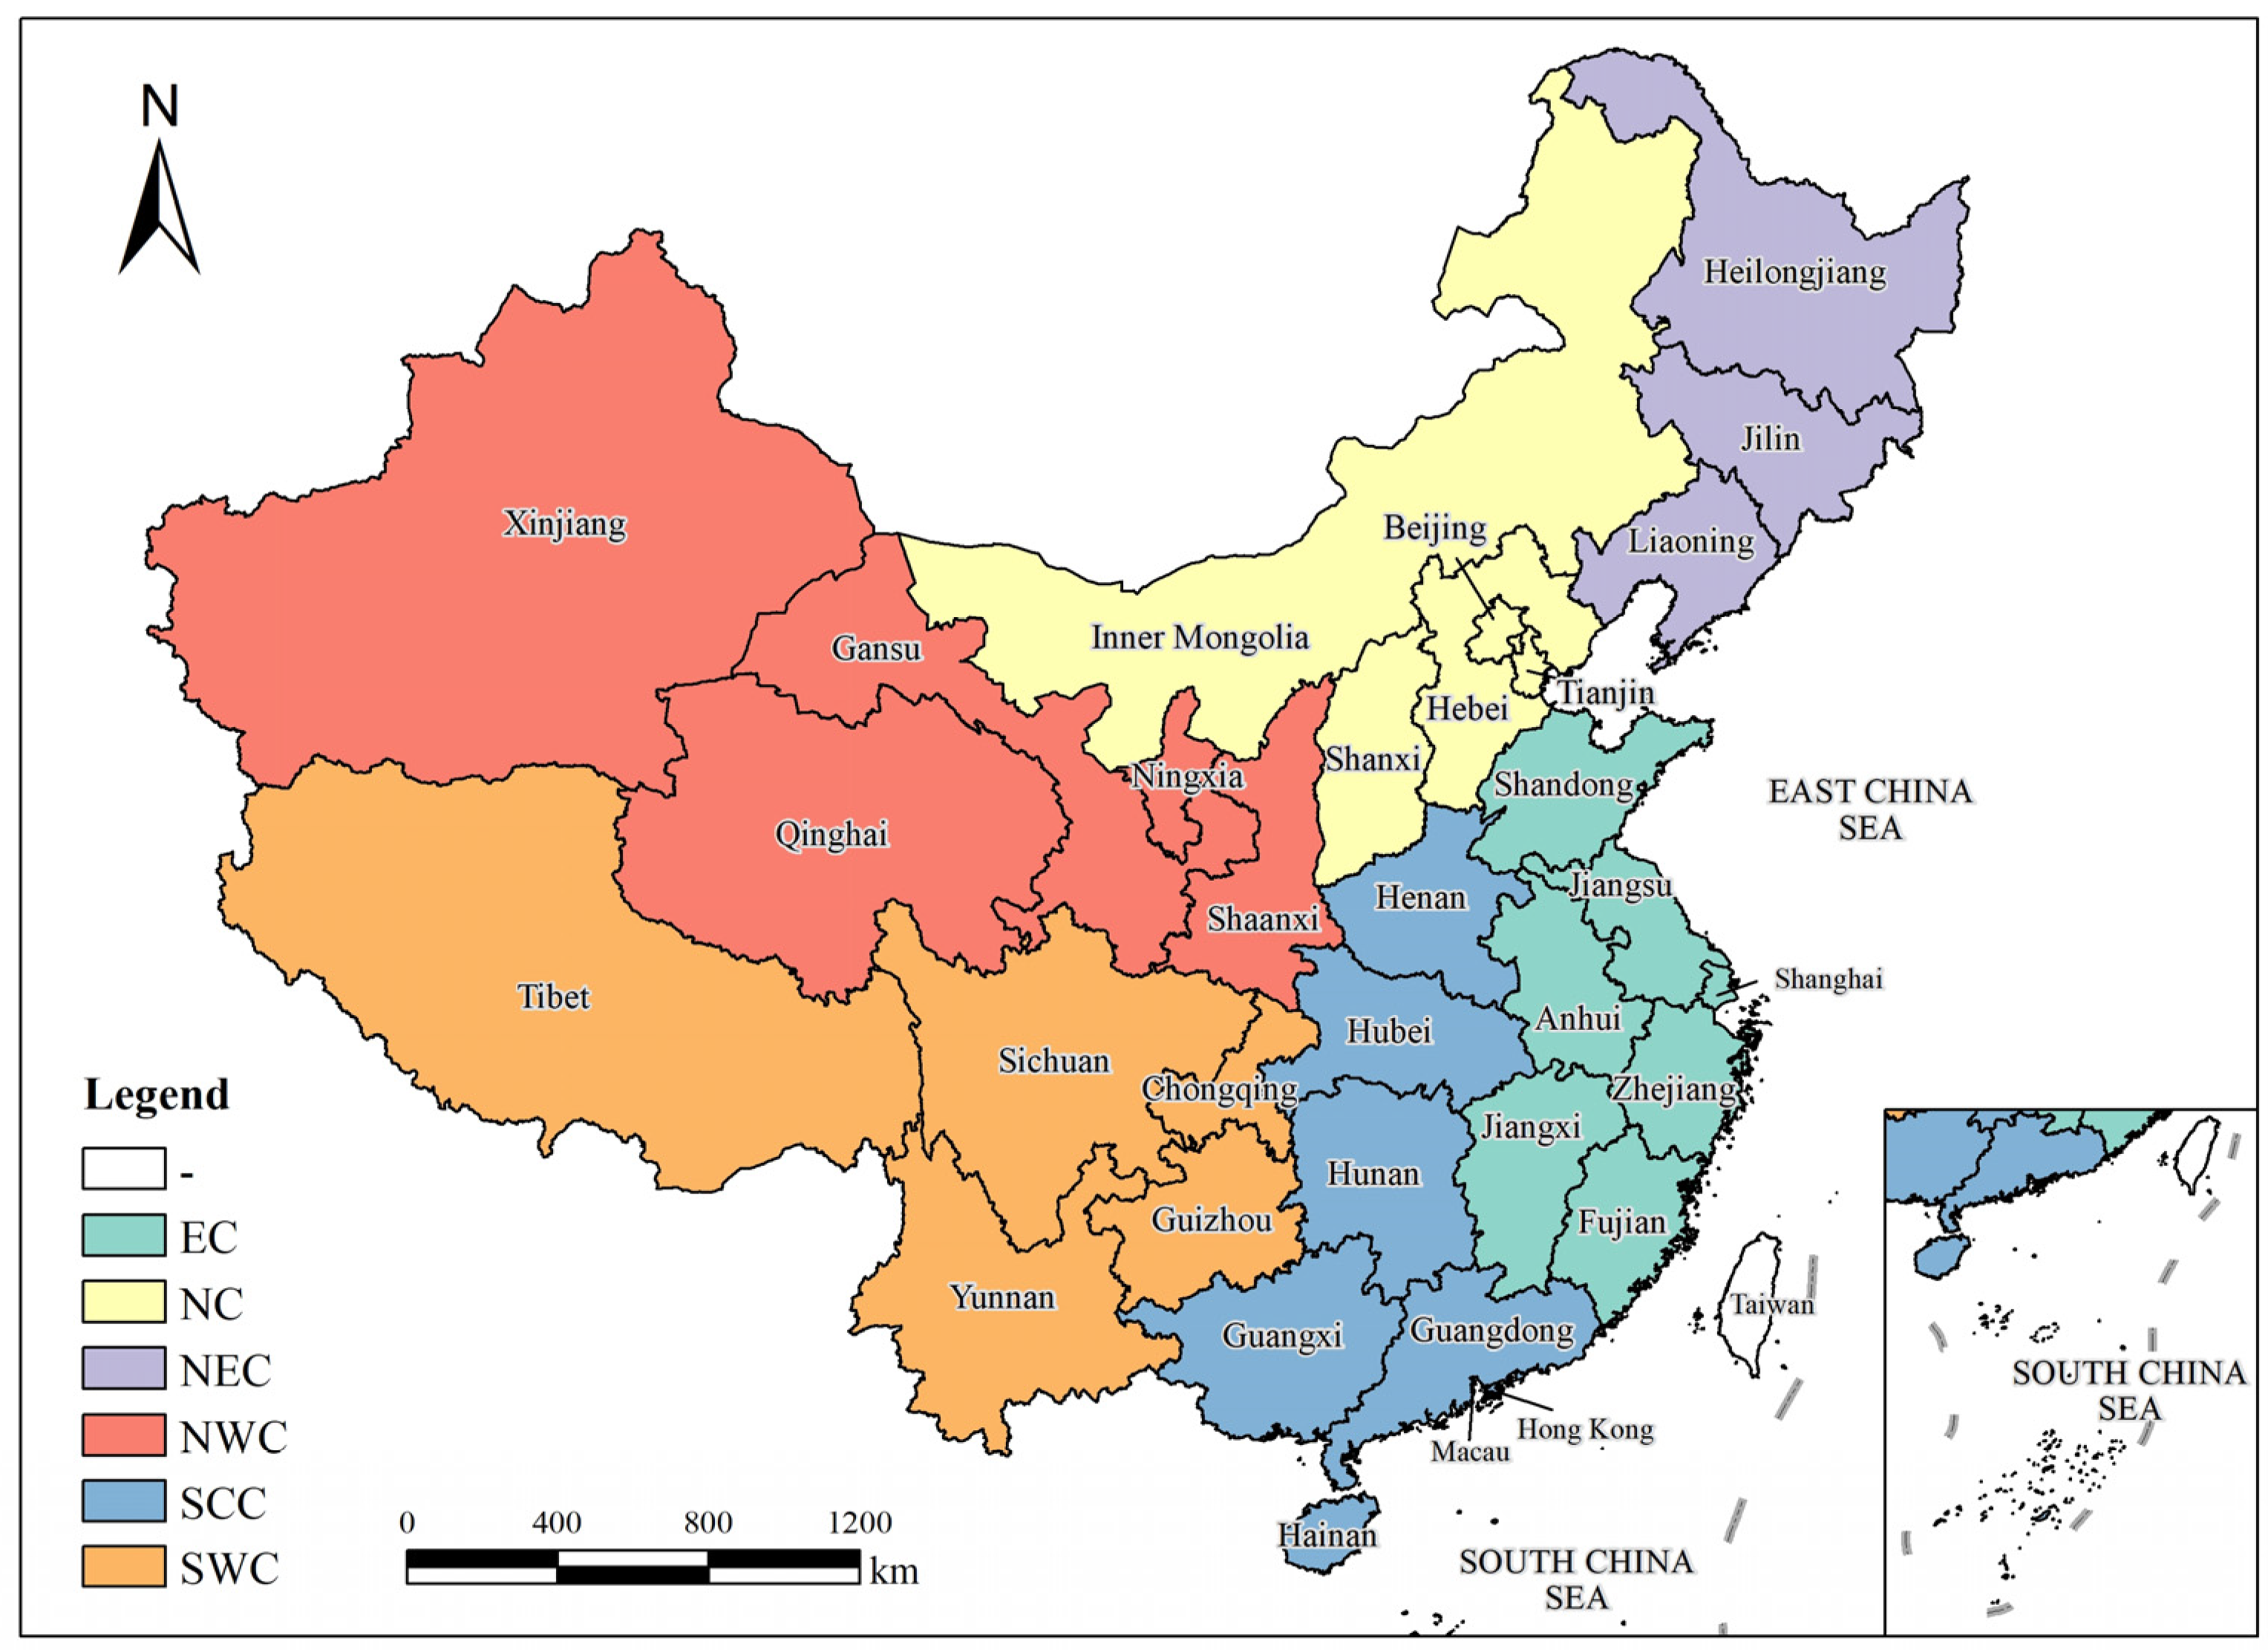
Figure 1. Study areas.
Toxics 13 00933 g001
Figure 2. Historical livestock emissions from 2013 to 2023 in China.
Toxics 13 00933 g002
Figure 3. Contributions of livestock types to total NH3, N2O, and CH4 emissions from 2013 to 2023 in China.
Toxics 13 00933 g003
Figure 4. Spatial distributions of NH3, N2O, and CH4 emissions in livestock for 2013 and 2023 in China (a) 2013 NH3, (b) 2023 NH3, (c) 2013 N2O, (d) 2023 N2O, (e) 2013 CH4, and (f) 2023 CH4.
Toxics 13 00933 g004
Figure 5. Time series decomposition multiplicative (a) and additive (b) decomposition of GWP emissions in agriculture livestock at the national level.
Toxics 13 00933 g005
Table 1. Emission source categorization in the livestock sector and data sources.
CategorySub-CategoryCategorySub-Category
Livestock aCowPoultry b,cRabbit
Beef cattle Broiler
Sow Meat duck
Hog Meat goose
Mutton Laying goose
Goat Laying hens
Mule Laying duck
Donkey
Horse
Work cattle
a Data collected from China Statistical Yearbook, 2014–2024 [3]. b Data collected from the Compilation of Statistics Data of Chinese agriculture 2014–2024 [35]. c Data collected from the China Rural Statistical Yearbook 2014–2024 [5].
Table 2. Descriptions of variables referred to in this paper.
DriverVariablesSymbolUnit
∆αProduction efficiencyLivestock emissions ETg
∆βIndustry structureLivestock gross domestic productSYuan
∆γAffluenceAgricultural gross domestic productAYuan
∆ρTechnologyTotal power of agricultural machineryMKw
∆δLabor forceThe rural populationLPerson
The total populationPPerson
Table 3. Uncertainty analysis (95% confidence level).
CategorySub-CategoryNH3N2OCH4
LivestockCow(−92.65%; 185.47%)(−68%; 75.06%)(−80.16%; 109.54%)
Beef cattle(−83.4%; 156.59%)(−55.99%; 52.97%)(−67.72%; 139.75%)
Sow(−90.48%; 314.47%)(−30.63%; 39.67%)(−74.53%; 91.54%)
Hog
Mutton(−81.84%; 220.05%)(−82.88%; 230.43%)(−58.48%; 83.31%)
Goat
Mule(−90.39%; 175.22%)(−62.34%; 63.68%)(−36.64%; 28.63%)
Donkey
Horse
Work cattle(−82.73%; 119.03%)(−66.18%; 70.92%)(−23.65%; 16.7%)
PoultryRabbit(−57.69%; 55.81%)(−2.3%, 2.34%)(−53.87%, 49.76%)
Broiler
Meat duck
Meat goose
Laying goose
Laying hens
Laying duck
Total (−70.51%; 112.77%)(−52.34%; 71.63%)(−67%; 136.07%)
Table 4. Livestock GWP emissions and ranks at provincial level.
Total Carbon Emissions (Tg) Rank
Regions20132017202020232013201720202023
Beijing0.770.540.270.1830303131
Tianjin0.900.730.830.8128292929
Hebei10.5210.1111.5713.757778
Shanxi2.542.633.134.6223222222
Inner Mongolia8.277.739.0710.2210121212
Liaoning7.526.499.7111.5911141011
Jilin4.874.445.607.1419191817
Heilongjiang6.006.076.628.1215151616
Shanghai0.560.450.360.3731313030
Jiangsu7.376.608.099.6313131315
Zhejiang3.952.262.403.2821232423
Anhui7.446.939.5413.201212119
Fujian5.284.636.5810.2116181613
Jiangxi7.247.007.7710.1814111414
Shandong14.8714.7118.2024.483321
Henan17.5415.2317.2020.812232
Hubei10.8210.8610.1814.336597
Hunan13.8513.9914.2418.394444
Guangdong10.299.6411.9216.558865
Guangxi11.8410.5812.5016.465656
Hainan1.961.601.702.3026262626
Chongqing4.513.814.495.4820202020
Sichuan18.5816.7418.7420.531113
Guizhou5.164.684.895.7318171919
Yunnan8.218.9810.4713.20109810
Tibet2.332.031.872.6224252525
Shaanxi2.312.222.492.9525242324
Gansu2.722.663.454.6422212121
Qinghai1.511.451.671.7727272727
Ningxia0.870.941.251.7029282828
Xinjiang5.265.335.696.9317161718
Disclaimer/Publisher’s Note: The statements, opinions and data contained in all publications are solely those of the individual author(s) and contributor(s) and not of MDPI and/or the editor(s). MDPI and/or the editor(s) disclaim responsibility for any injury to people or property resulting from any ideas, methods, instructions or products referred to in the content.