Article

The Cocktail Effects on the Acute Cytotoxicity of Pesticides and Pharmaceuticals Frequently Detected in the Environment

1
Department of Environmental Safety, Institute of Aquaculture and Environmental Safety, Hungarian University of Agriculture and Life Sciences, 1 Páter Károly u., 2100 Gödöllő, Hungary
2
Department of Environmental Toxicology, Institute of Aquaculture and Environmental Safety, Hungarian University of Agriculture and Life Sciences, 1 Páter Károly u., 2100 Gödöllő, Hungary
*
Author to whom correspondence should be addressed.
Toxics 2024, 12(3), 189; https://doi.org/10.3390/toxics12030189
Submission received: 29 December 2023 / Revised: 22 February 2024 / Accepted: 27 February 2024 / Published: 28 February 2024
(This article belongs to the Section Ecotoxicology)

Abstract

:
Xenobiotics never appear as single, isolated substances in the environment but instead as multi-component mixtures. However, our understanding of the ecotoxicology of mixtures is far from sufficient. In this study, three active pharmaceutical ingredients (carbamazepine, diclofenac, and ibuprofen) and three pesticides (S-metolachlor, terbuthylazine, and tebuconazole) from the most frequently detected emerging micropollutants were examined for their acute cytotoxicity, both individually and in combination, by bioluminescence inhibition in Aliivibrio fischeri (NRRL B-11177). Synergy, additive effects, and antagonism on cytotoxicity were determined using the combination index (CI) method. Additionally, PERMANOVA was performed to reveal the roles of these chemicals in binary, ternary, quaternary, quinary, and senary mixtures influencing the joint effects. Statistical analysis revealed a synergistic effect of diclofenac and carbamazepine, both individually and in combination within the mixtures. Diclofenac also exhibited synergy with S-metolachlor and when mixed with ibuprofen and S-metolachlor. S-metolachlor, whether alone or paired with ibuprofen or diclofenac, increased the toxicity at lower effective concentrations in the mixtures. Non-toxic terbuthylazine showed great toxicity-enhancing ability, especially at low concentrations. Several combinations displayed synergistic effects at environmentally relevant concentrations. The application of PERMANOVA was proven to be unique and successful in determining the roles of compounds in synergistic, additive, and antagonistic effects in mixtures at different effective concentrations.

1. Introduction

Each year, a significant proportion of the approximately 2.3 billion tons of synthetic chemicals used globally, and 300 million tons used in the European Union, ultimately enters natural waters, which form the basis of our drinking water [1,2]. Approximately one-fifth of the world’s population lacks access to safe drinking water of sufficient quality. Although the chemicals released into the environment, in the majority of cases, are present at very low concentrations (µg/L or lower), their persistent presence represents long-term exposure to the elements of the ecosystem. Many of them may exert a range of chronic effects, such as genotoxicity/mutagenicity, carcinogenicity, teratogenicity, immunosuppressive effects, and endocrine disruption, in addition to acute toxicity, especially when present as components of complex mixtures [3,4].
Among the emerging micropollutants (EMPs), pesticides and pharmaceutical residues stand out for their widespread occurrence and highly diverse biological effects. The annual global use of pesticides is estimated to be around 3 million tons [5]. Concurrently, projections indicate that spending on medicines and will reach USD 1.6 trillion and 3335 billion doses (DDD—defined daily dose, the dose defined by the WHO for a given active substance) in 2024 [6]. This highlights the substantial impact of these chemicals on the environment and underscores the need for comprehensive understanding and management of their presence and effects. Pesticides are predominantly released into the environment through agricultural and horticultural applications. They can leach into deeper soil layers due to precipitation and ultimately enter groundwater or surface waters through agricultural run-off. There is an extensive body of literature, including thousands of studies, documenting the environmental occurrence of pesticide substances. These substances have been detected in every environmental compartment, from Antarctica to the Arctic, and even in rainwater. In the European Union, terbuthylazine (TRB) has emerged as one of the most frequently detected herbicides, replacing the banned atrazine [7,8,9,10,11,12,13]. Terbuthylazine is commonly used in combination with metolachlor (MTC), which is also frequently identified as a residue [14,15,16]. Tebuconazole (TBZ), a triazole fungicide, has gained increasing importance, mainly applied to cereals and grapes. In 2022, it was ranked as the fifth most widely marketed pesticide in Hungary, following metolachlor in the third position and terbuthylazine in the fourth position [17]. These compounds frequently occur together in environmental matrices, mainly in surface and ground waters. Terbuthylazine is most commonly used in combination with S-metolachlor in the EU to control broad-leaved weeds and annual grasses on both agricultural and non-agricultural soils [18]. Alongside terbuthylazine and metolachlor, tebuconazole is being detected in environmental compartments and wastewaters with increasing frequency [19,20,21,22].
Continuously used and released from wastewater treatment plants, pharmaceuticals and pesticides are considered to be pseudo-persistent contaminants. Once they enter the environment, they can persist in their original form or in structurally similar transformation products [23]. The number and concentration of pesticides and their concentrations peak during and after the excessive agricultural application of said compounds in late spring and summer in water bodies [24]. Čelić et al. (2021) reported the co-occurrence of carbamazepine, metolachlor, tebuconazole, and terbuthylazine in all of the samples taken from the Ebro River [25]. Xu et al. (2019) detected carbamazepine (0.02–4.34 ng/L), ibuprofen (0.70–22.91 ng/L), and tebuconazole (0.58–50.04 ng/L) in surface watersheds [26]. Ibuprofen, diclofenac, metolachlor, and tebuconazole have been detected in Lake Guaíba [27]. S-metolachlor, tebuconazole, and terbuthylazine have been detected in Lake Balaton and its sub-catchment area [28]. The main pathways for active pharmaceutical ingredients (APIs) entering surface waters are through domestic wastewater, mainly due to inadequate removal of micropollutants during wastewater treatment processes. In recent years, increasing attention has been given to the monitoring of biologically active chemical residues in our environment [29,30]. On a global scale and within the EU, 771 and 596 APIs have been detected in environmental matrices between 2010 and 2016, respectively. Among them, two nonsteroidal anti-inflammatory drugs (NSAIDs), diclofenac (DCF) and ibuprofen (IBU), and the antiepileptic carbamazepine (CBZ) were the most frequently detected APIs in surface water, groundwater, and drinking water, with 2441, 2363, and 1686 positive hits, respectively [31].
While there is a rich literature available on the toxicology and ecotoxicology of these chemicals, there is a significant research gap regarding the cocktail effects of pesticides and APIs, despite their extremely frequent co-occurrence in the environment [14,32,33].
The investigation of the ecotoxicological effects of mixtures is an arduous task, even though numerous studies on mixture toxicity have been published in recent years. In 2007, Belden et al. reviewed the results of 303 experiments from 45 publications on the cocktail effects of pesticides [34]. In 2014, Cedergreen reviewed 194 two-component pesticide mixtures, 21 metal ion mixtures, and 136 antifoulant mixtures [35]. Martin reported in his 2023 review that there were 761 different publications on mixture toxicology between 2007 and 2017. At the same time, nearly two-thirds of these experiments investigated the effects of binary mixtures [36].
The vast number of possible mixtures makes it nearly impossible to assess every mixture experimentally. Therefore, modeling can be a key approach to assessing the toxic properties of mixtures. However, current modeling methods also have their limitations in practical application. Nowadays, there are two widely used and prominent reference models, concentration addition (CA) [37] and independent action (IA) [38], for predicting the combined effect of chemical mixtures; however, they are only suitable for the additive effect of mixtures. CA assumes that mixture components have the same or similar mode of action (MOA) [37], whereas IA assumes they have a different or dissimilar MOA [38]. According to Cedergreen et al. [39], the use of IA and CA to predict the cocktail effect of binary mixtures resulted in approximately 20% (of 158 mixtures), and 10% accuracy. The Chou–Talalay method (combination index method) is one of the most widely used methods for detecting and quantifying synergistic interactions between two or more chemicals, having been cited over 7000 times over the past few decades [40]. While there have been an increasing number of studies assessing the mixture toxicity of APIs [41] or pesticides [34], the interactions between them have been studied only by a few researchers, applying, in most cases, binary mixtures [42,43].
Considering that the chemicals can form a practically infinite number of combinations, quantitative structure–activity relationship (QSAR) models have been extensively used in forecasting not only the activity of single chemicals but the combined effects of components in mixtures [44]. Still, most of the QSAR models are feasible only for binary combinations and additive toxicities of mixtures [45,46,47,48,49]. The QSAR models are limited by the accuracy of the dataset used to train them. The data available are typically composed of single or few experimental values, which may capture complex biological systems poorly. Overall, the currently available workflow for the analysis of mixture toxicity with QSAR is insufficient and limited. For the more accurate use of QSAR models, there is a need for more reliable, and in general, more experimental data to incorporate [50,51].
Following the whole-mixture or top-down approach, in vitro assays can be used to determine the overall toxicity triggered by complex mixtures and are also widely employed to identify previously unknown effects [52].
The objective of this study was to assess the acute cytotoxicity of the most frequently detected pesticides and pharmaceuticals, namely, metolachlor, tebuconazole, terbuthylazine, carbamazepine, diclofenac, and ibuprofen. We sought to examine their individual impact as well as the mixture effects of their binary, ternary, quaternary, quinary, and senary mixtures using the acute Aliivibrio fischeri assay. The synergistic, additive, and antagonistic effects between the chemicals in different mixtures at various effective concentrations were determined using the combination index (CI) method. Furthermore, we aimed to define the role of each compound in the cocktail effects using statistical analytical methods.

2. Materials and Methods

2.1. Chemicals and Stock Solutions

Active ingredients of pesticides and pharmaceuticals were purchased from Sigma-Aldrich Ltd. (Budapest, Hungary). For toxicity experiments, 20 mg/mL carbamazepine (Supelco®, Budapest, Hungary, CAS 298-46-4, purity ≥ 99%), diclofenac-sodium (Supelco®, Budapest, Hungary, CAS 15307-79-6, purity ≥ 98.5%), ibuprofen (Sigma-Aldrich®, Budapest, Hungary, CAS 15687-27-1, purity ≥ 98%), S-metolachlor (Pestanal®, CAS 87392-12-9, purity 98.4%), tebuconazole (Supelco®, Budapest, Hungary, CAS 107534-96-3, neat), and terbuthylazine (Pestanal®,Budapest, Hungary, CAS 5915-41-3, purity 99.4%) stock solutions were prepared in dimethyl sulfoxide (DMSO, CAS 67-68-5, purity ≥ 99.99%, Fisher Scientific, Budapest, Hungary). For the mixtures, stock solutions containing the active ingredients were mixed in the same proportion (1:1 ratio) (from binary to senary). Additional information about the used pesticides and pharmaceuticals can be found in Table S1.

2.2. Aliivibrio fischeri Acute Bioluminescence Assay (Microtox®)

To determine the acute cytotoxicity of pesticides, APIs, and their mixtures, a standard Microtox® acute assay was performed using the bioluminescence Aliivibrio fischeri (AVF) (DSM-7151, NRRL B-11177) test organism. A decrease in light emission due to any negative changes in the metabolic status of the cells is easily detectable, and the results obtained are highly reproducible. The test is often used as the first screening method, due to its rapid and cost-effective feasibility.
Microtox® acute AVF tests were performed according to ISO 11348-1 (ISO 11348-1:2007 Water quality (https://www.iso.org/standard/40516.html (1998) (accessed on 28 December 2023)). Determination of the inhibitory effect of water samples on the light emission of Vibrio fischeri (Luminescent bacteria test) Part1: Method using freshly prepared bacteria. A total of 20 mg/mL stock solutions of carbamazepine (CBZ), diclofenac (DCF), ibuprofen (IBU), S-metolachlor (MTC), tebuconazole (TBZ), and terbuthylazine (TRB) were used in the acute assay, diluted from 100 mg/L to 6.25 mg/L in a 2 w/w% NaCl solution containing 1 v/v% DMSO. From binary to senary mixtures, chemicals were combined in equal concentrations and diluted from 200 mg/L to 12.5 mg/L. The solvent control sample was the dilution solution (2 w/w% NaCl; 1 v/v% DMSO). The final concentration of DMSO was 0.5 v/v% in the assay, which is non-toxic to the test organism as described in Tóth et al. (2019) [53], and also did not result in any aberrance in bioluminescence in the negative control after 30 min of exposure, according to the ISO standard. Tests were performed in two parallels with a control and nine different concentrations of the chemicals at 15 ± 0.2 °C. The relative bioluminescence was detected by the Microtox® Model 500 Analyzer (SDI, Carlsbad, California) after 30 min of incubation, and bioluminescence inhibition was determined. For each compound and mixture, the effective concentration values resulting in 10, 20, 50, 80, and 95% inhibition in the bioluminescence (EC10, 20, 50, 80, 95) were calculated from the concentration-response curves using the MicrotoxOmni® software (version 1.1, AZUR Environmental Corp., Carlsbad, California, USA).

2.3. Combination Index (CI) Method to Determine Joint Toxicities

Synergistic, additive, and antagonistic effects for the combinations were characterized by combination index (CI) values at inhibition rates in the bioluminescence of 10%, 20%, 50%, 80%, and 95% (EC10, EC20, EC50, EC80, EC95, respectively). The CI values were calculated using the following equation, as described by Chou and Yang et al. [54,55]:
n ( C I ) x = j = 1 n D x 1 n { D j / 1 n D } D m j f a x j / 1 f a x j 1 / m j
  • n(CI)x—the combination index (CI) for n chemicals at an inhibition rate of x%.
  • (Dx)1−n—the sum of the concentrations of n chemicals, causing an inhibition rate of x% in the mixture.
  • {[D]j/ 1 n D }—the proportionality of the individual concentration of n chemical causing an inhibition rate of x% in the mixture.
  • (Dm)j{(fax)j/[1 − (fax)j]}1/mj—the concentration of each individual chemical causing an inhibition rate of x%, where Dm is the median-effect concentration (antilog of the x-intercept of the median-effect plot), fax is the fractional inhibition at x% inhibition, and m is the slope of the median-effect plot.
The effects of mixtures were classified according to Chou and Talalay [56] as synergistic if CI < 1, additive (concentration addition) if CI = 1, and antagonistic if CI > 1. Chou described a more detailed classification with ranges of combination index and description, which were the following: < 0.1—very strong synergism, 0.1–0.3—strong synergism, 0.3–0.7—synergism, 0.7–0.85—moderate synergism, 0.85–0.90—slight synergism, 0.90–1.10—nearly additive, 1.10–1.20—slight antagonism, 1.20–1.45—moderate antagonism, 1.45–3.3—antagonism, 3.3–10—strong antagonism, >10—very strong antagonism [54].
CompuSyn 1.0 software (ComboSyn, Inc., Paramus, NJ, USA) was used to determine and calculate concentration–response curve parameters (m—quantitative estimation of sigmoidicity and r—regression coefficient) and CI values [49]. To determine synergism, additive effect, or antagonism, 6 concentration-response data points (EC10, EC20, EC50, EC80, EC90, and EC95) were used for the combinations, consisting of 2, 3, 4, 5, and 6 compounds.

2.4. Statistical Analysis—Methods

Statistical analyses were conducted in R Statistical Software (version 4.0.2., R Core Team, 2020) by the following packages: ‘tidyr’, ‘scales’, ‘dtw’, ‘vegan’, ‘ggplot2′, ‘circlize’, ‘ComplexHeatmap’, ‘gridExtra’ (‘RColorBrewer’, ‘ggsci’, ‘colorRamps’, ‘viridis’).
The type and intensity of interaction between chemical components are frequently expressed by combination indices (CIs) ranging from zero (extremely strong synergy) to positive infinity (extremely strong antagonism), where values close to one denote additivity (see Table S5). Distances between the limit values (of steps from strong synergy) to additive effect are relatively similar, while steps from additivity to antagonism are increasing exponentially.
For statistical and visual purposes, the combination indices (CIs) of the compounds calculated by CompuSyn software were transformed and centered as follows [57]:
if x > 1 x’ = (−1) × log10(x), and
x ≤ 1 x’ = 1 − x,
where x refers to the raw value and x’ is the result of transformation (see Table S5, Figure S1).
Euclidean distances were calculated between the 26 samples using the transformed CI values at effect sizes of 10%, 20%, 50%, 80%, 90%, and 95%. To identify the most prominent compounds and compound combinations, the distance matrix was subjected to permutational multivariate analyses of variance (PERMANOVA), where 999 permutations established significance. Multivariate homogeneity of variances (BETADISPER) was also examined using the spatial median to reduce original distances to principal coordinates [58,59,60,61].
In any case, where the cytotoxic effect was not detectable, meaning one-sided simple enhancement or potentiation [62], the enhancement of the non-toxic chemical in a mixture was expressed as a percent of the required dose (mg/L) change of the other compounds in the mixture not containing the non-toxic chemical to result in the same effect size as the mixture containing it. We used the following equation to calculate the enhancing effect (E%) of a non-toxic chemical:
E% = {1 − [(ECxA × n)/(n + 1))/(ECxB/n)]} × 100
where
  • ECxA—the effective concentration divided by the number of compounds in the mixture containing the non-toxic component resulting in x% bioluminescence inhibition.
  • n—the number of the chemicals in the mixture not containing the non-toxic component.
  • ECxB—the effective concentration divided by the number of compounds in the mixture not containing the non-toxic component resulting in x% bioluminescence inhibition.
In these cases, the dose change data at effect sizes of 10%, 20%, 50%, 80%, 90%, and 95% were used for Euclidean distance calculation, and then PERMANOVA and BETADISPER were conducted to identify which compounds or compound combinations were significantly affected by the presence of a non-toxic chemical.

3. Results

3.1. Cytotoxicity on Aliivibrio fischeri

The effective concentration values of carbamazepine, diclofenac, ibuprofen, S-metolachlor, tebuconazole, and terbuthylazine, as well as their mixtures resulting in 10, 20, 50, 80, 90, and 95% inhibition in the bioluminescence of Aliivibrio fischeri, are summarized in Table 1.
The effective concentrations resulting in bioluminescence inhibition in Aliivibrio fischeri varied over an extremely large range. Among the APIs, the NSAID ibuprofen and diclofenac had similar cytotoxic effects at lower concentrations; however, diclofenac showed higher toxicity with an increase in concentrations. Carbamazepine had significantly lower toxic effects at 50% effective concentration and above. Among pesticides, tebuconazole induced the highest inhibitions, while terbuthylazine, as described in our previous work [53], was non-toxic at any applied concentrations (up to its solubility limit). At 50% effective concentrations, the binary DCF + IBU, IBU + TRB, and ternary CBZ + DCF + IBU mixtures were the most toxic cocktails, with 12, 18, and 12 mg/L EC50 values, respectively. The effective concentration values eliciting 10% inhibition in bioluminescence altered between 2 and 10 mg/L in most cases, but there were cocktails that could cause 10% inhibition only at higher applied concentrations. At 95% effective concentrations, the most toxic mixtures were the binary DCF + IBU and ternary CBZ + DCF + IBU with 62 and 54 mg/L EC95 values, respectively. Compared to the effects of single chemicals, the most outstanding interactions, i.e., excessively increased toxicity at all concentrations, were observed when combining diclofenac and ibuprofen, and ibuprofen with terbuthylazine, up to 50% above the original effect due to the potentiation effect of the latter. Mixing the three APIs also resulted in highly increased toxicity compared to the single compounds.

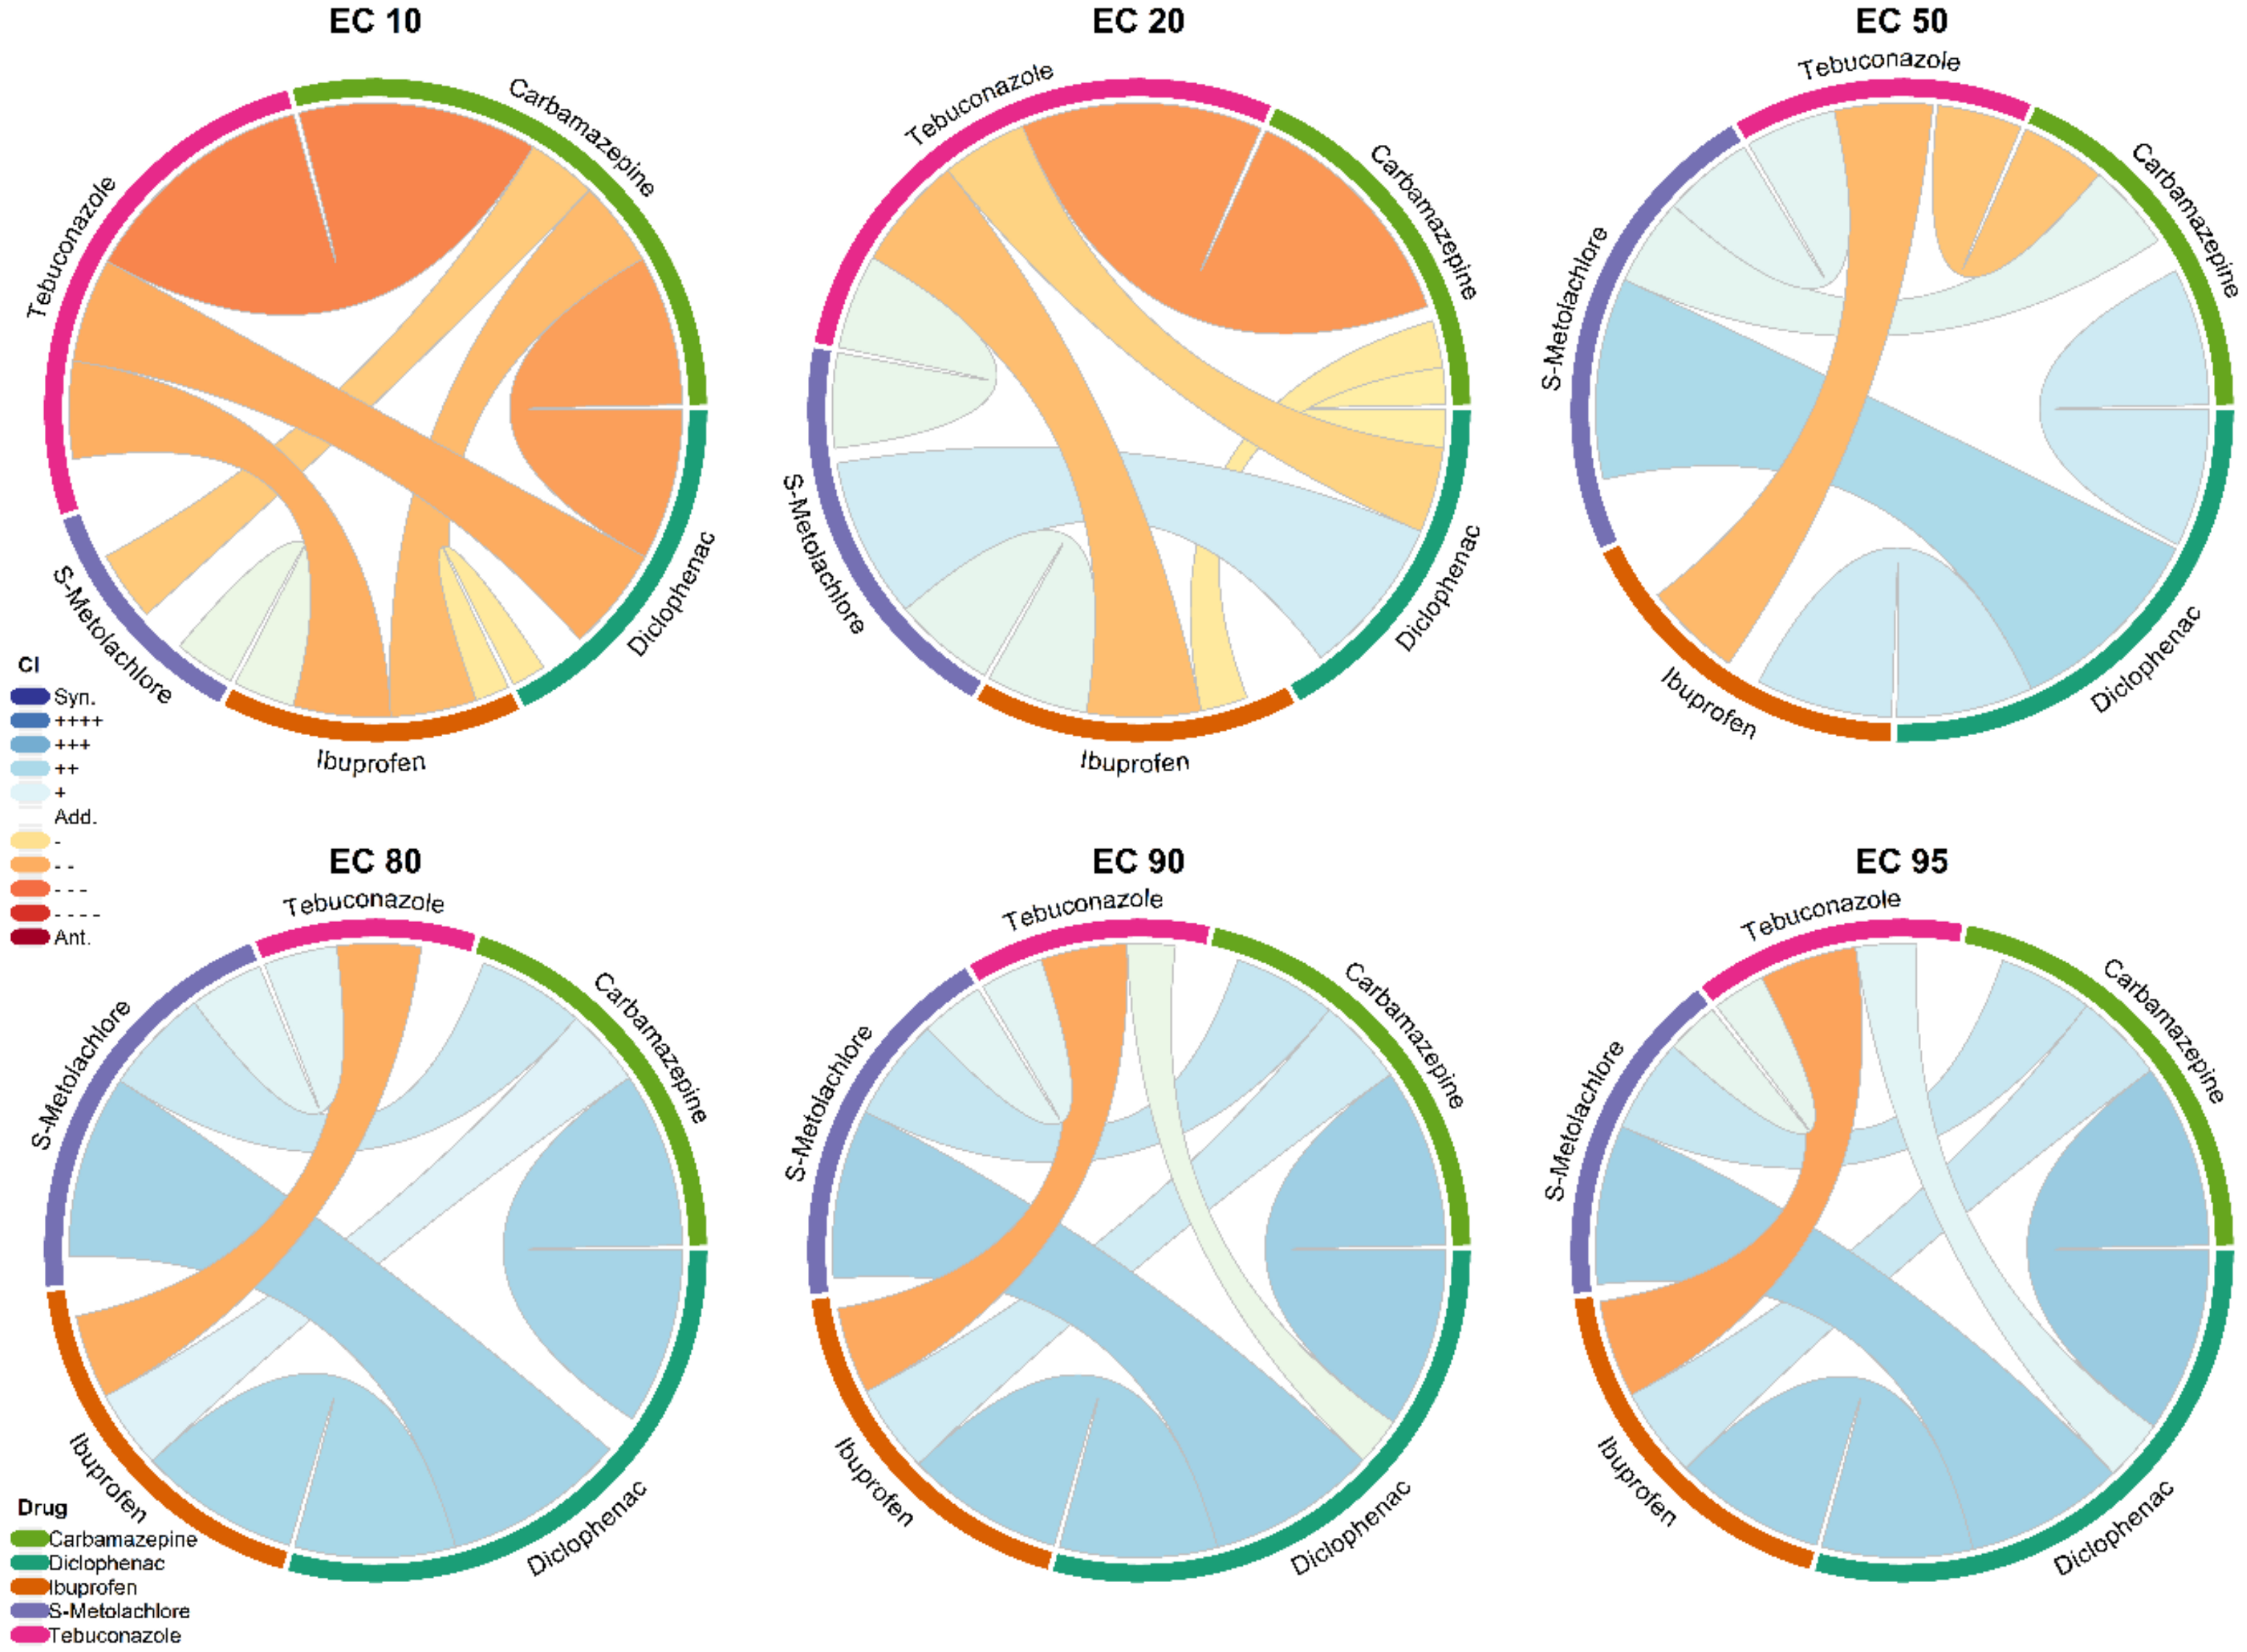
3.2. Combination Index Values and Enhancement by Terbuthylazine

Combination indices for the mixtures containing carbamazepine, diclofenac, ibuprofen, S-metolachlor, and tebuconazole are summarized in Table 2.
Overall, synergy was observed in 73% of the mixtures in at least one effective concentration. Three cocktails showed additive toxicity compared to the individual components at EC50 or higher concentrations, and only four mixtures (15%) were antagonistic on bioluminescence inhibition in Aliivibrio fischeri at all effective concentrations.
In general, synergism appeared and intensified as the concentrations were increased. Regarding the CI values at EC50, the strongest synergy occurred between the binary DCF + IBU (CI = 0.525), ternary CBZ + DCF + IBU (CI = 0.399), DCF + MTC + TBZ (CI = 0.511), and CBZ + DCF + MTC (CI = 0.534), while the lowest CI values were produced by the APIs in a ternary mixture, followed by the binary carbamazepine + S-metolachlor pair.
Among the combinations, the binary DCF + IBU, DCF + MTC, and MTC + TBZ and ternary CBZ + IBU + MTC, DCF + IBU + MTC, and DCF + MTC + TBZ mixtures showed synergistic effects in cytotoxicity at all concentrations from EC10 to EC95.
In two ternary mixtures containing CBZ + IBU + MTC and IBU + MTC + TBZ, synergistic effects could be observed at the lowest effective concentrations, while antagonism appeared with increased concentrations.
The quaternary CBZ + IBU + MTC + TBZ mixture showed moderate synergism at the lowest effective concentration, an additive effect at EC20, and antagonism at higher concentrations.
The cytotoxic effect of terbuthylazine alone was not detectable (see Table 1); therefore, its effect combined with the other compounds or compound combinations is not synergism or antagonism but a one-sided simple enhancement, potentiation, or augmentation. Thus, the CI calculation is not applicable in this case [62]. The enhancement of cytotoxicity in a mixture resulting in the presence of terbuthylazine is expressed as a percentage and summarized in Table 3.
In almost all the mixtures, terbuthylazine had a great enhancing effect on the other chemicals at lower effective concentrations, which decreased in parallel with the concentration increase. Only the binary mixture with carbamazepine had no effect on terbuthylazine, while in the ternary mixture, it had an inhibitory effect on the other two pesticides at all concentrations.
Overall, 29 of 31 mixtures containing non-toxic terbuthylazine were more toxic at low (in some cases environmentally relevant) effective concentrations toward Aliivibrio fischeri than the individual components.

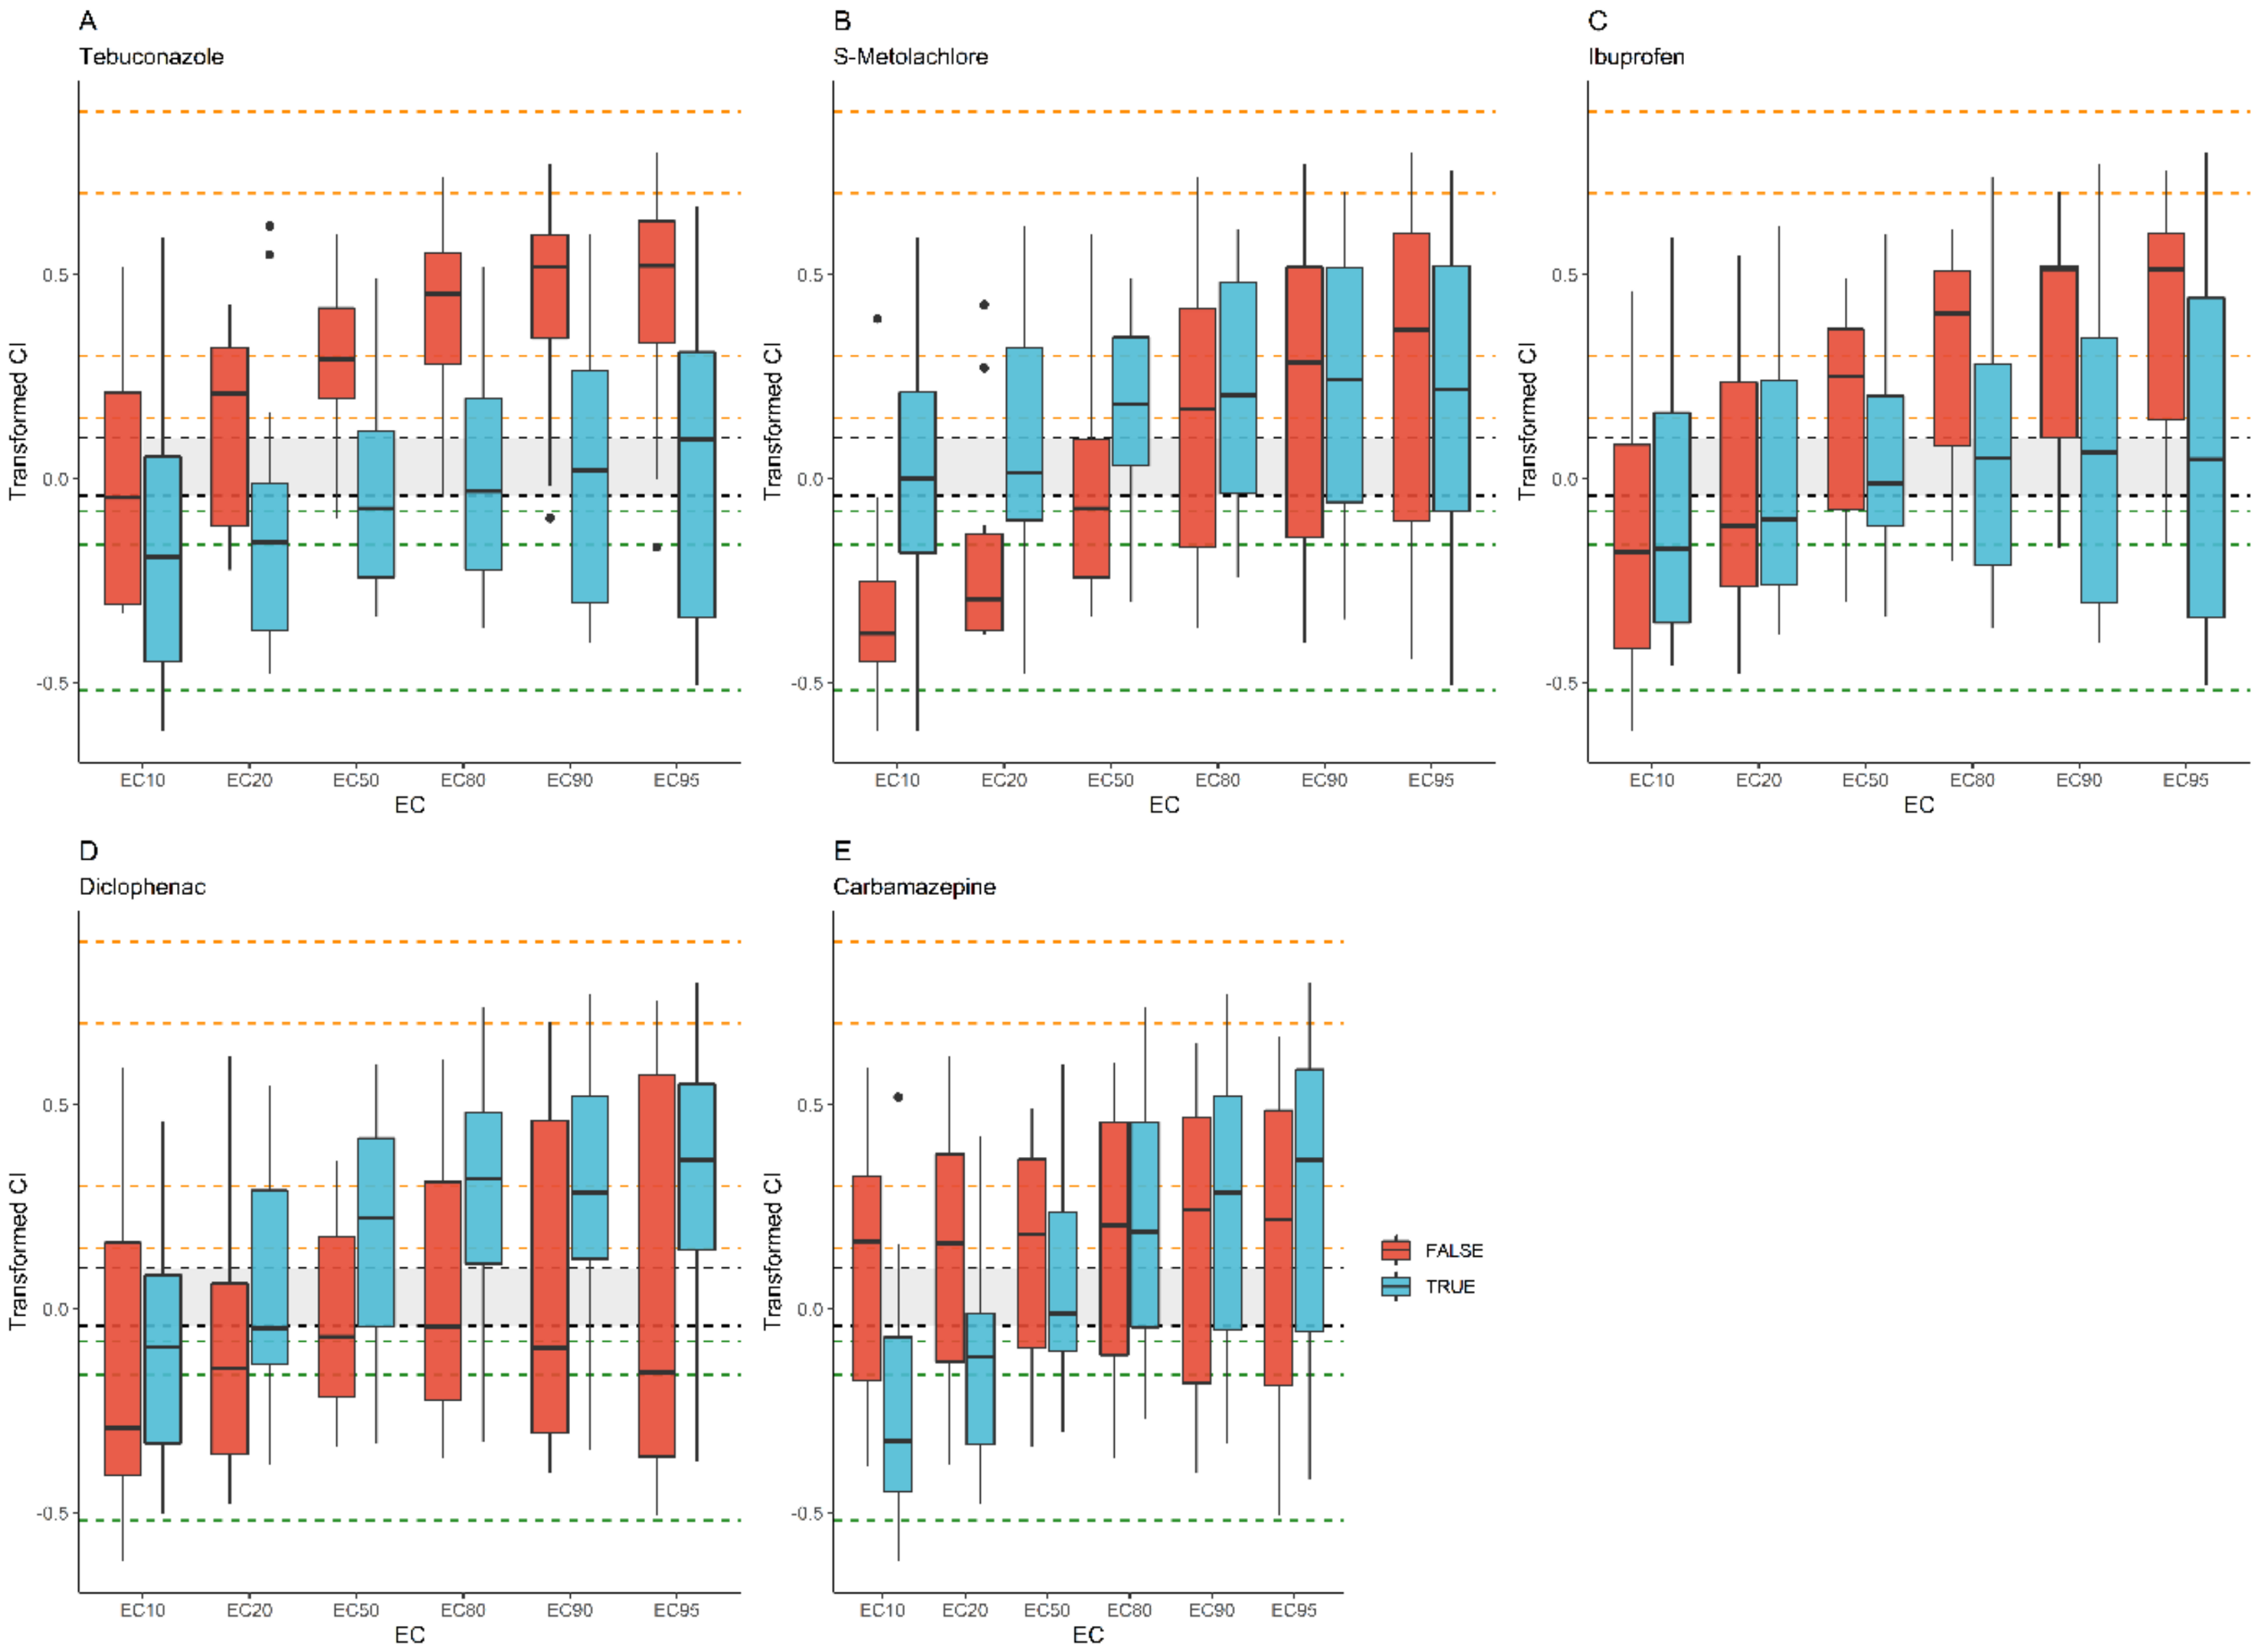
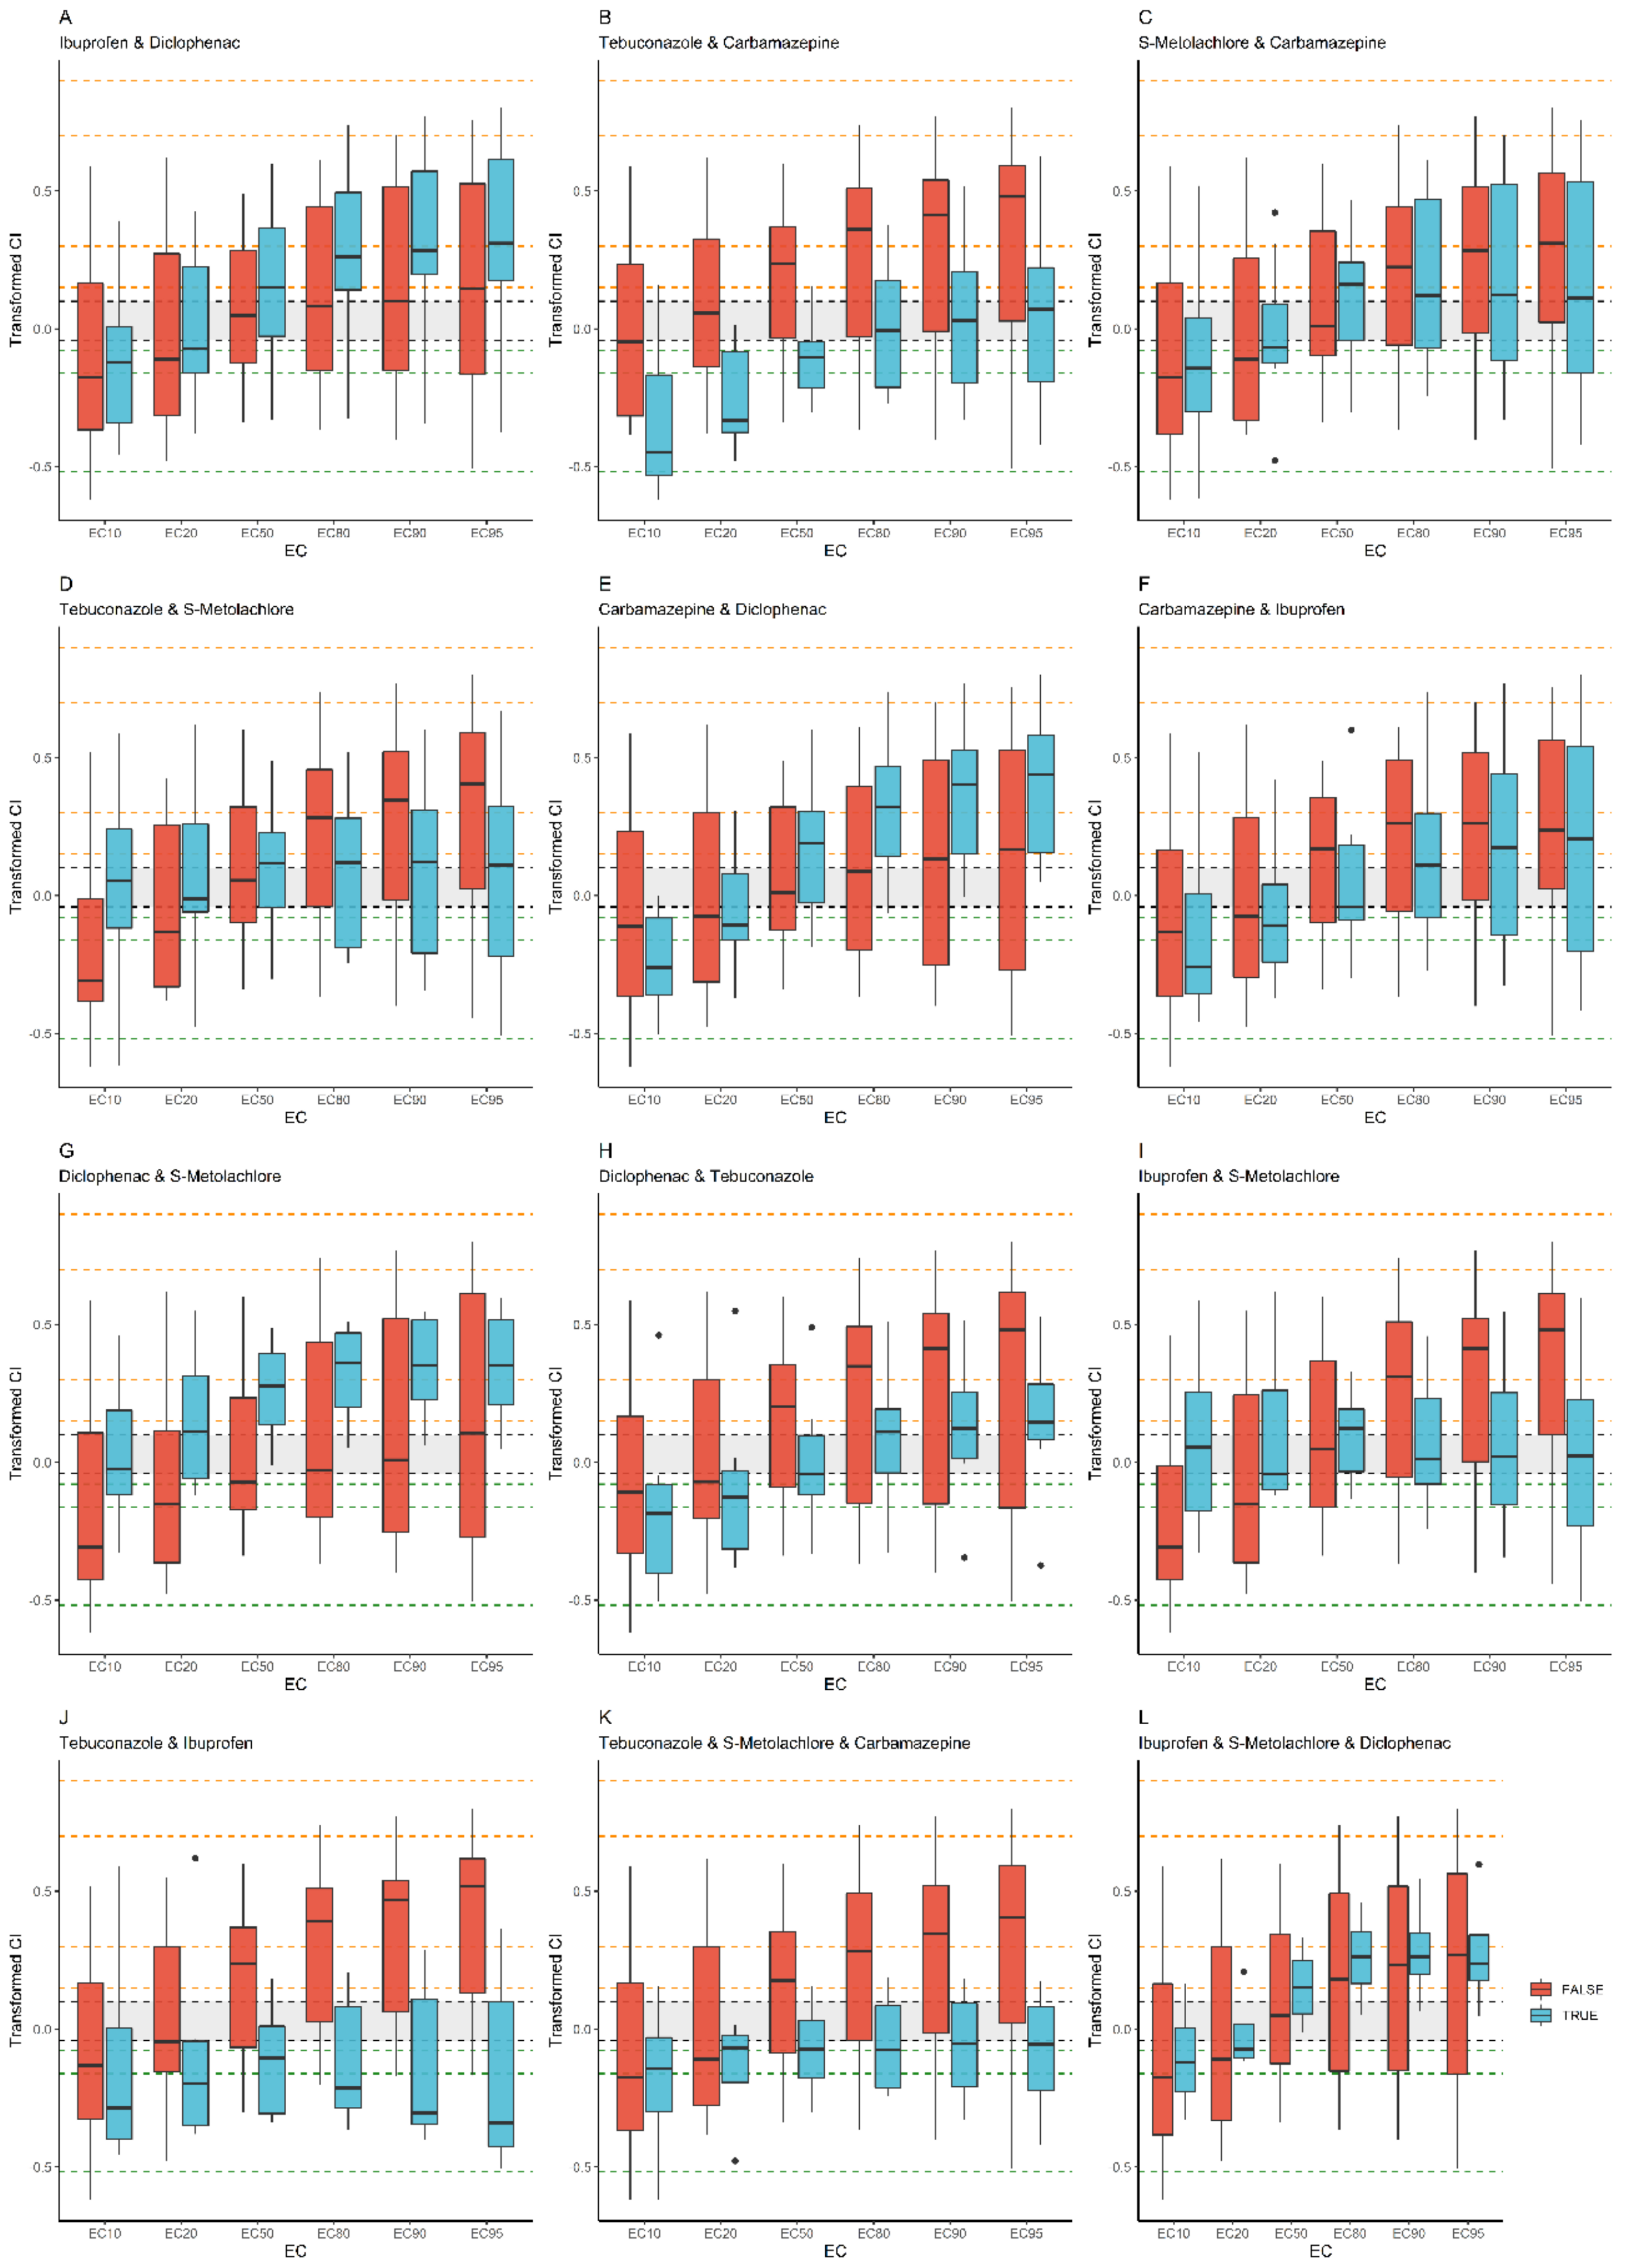
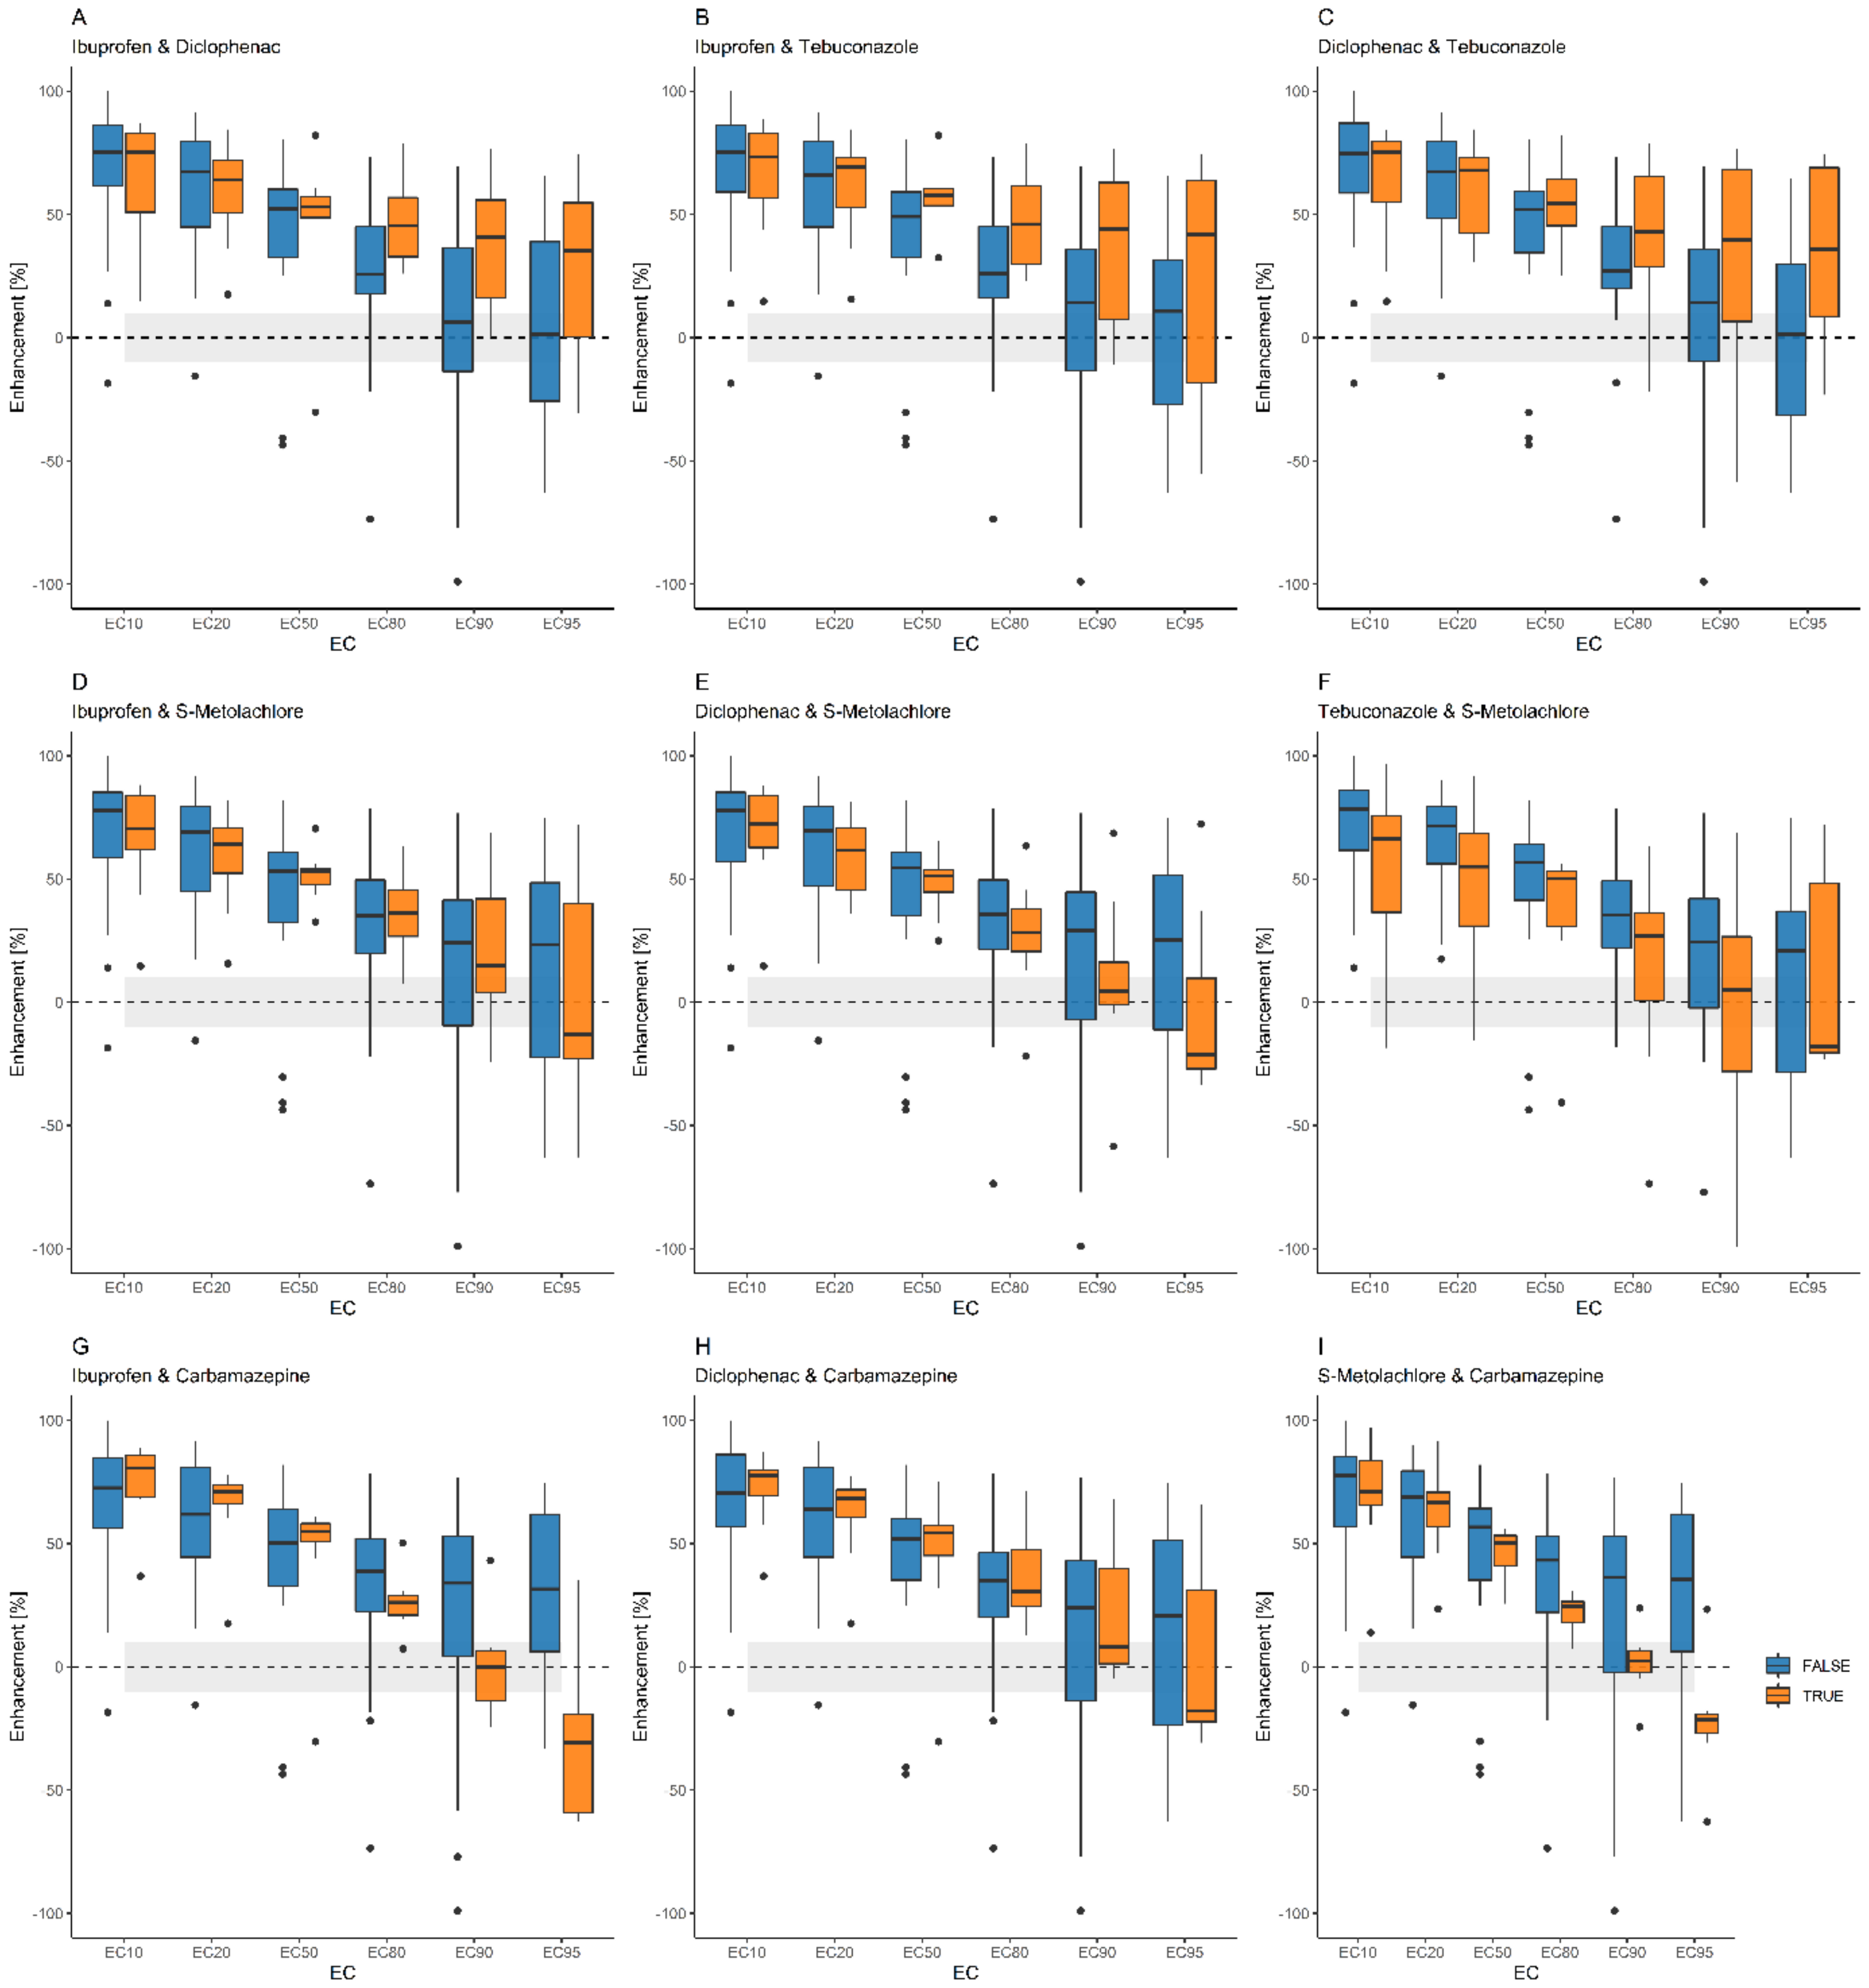
3.3. Statistical Analysis of Synergism or Antagonism between Carbamazepine, Diclofenac, Ibuprofen, S-metolachlor, and Tebuconazole

3.3.1. Pairwise Description

The weighted mean of transformed CI values of all combinations where the compound pairs were present, the defining relationships of compound pairs in all the examined combinations, and effect sizes are shown in Figure 1.
Regarding all the mixtures, at 10% effect size, only the pair of ibuprofen and S-metolachlor caused slight synergistic effects; the relationships of the other pairs were additivity or antagonism.
At a 50% effective concentration, tebuconazole had moderate antagonistic relationships with carbamazepine as well as with ibuprofen. At this concentration, the type of relationships of diclofenac in pairs with carbamazepine, with ibuprofen, or with S-metolachlor were moderate synergisms in every mixture, although the latter was close to the bound between synergism and moderate synergism. S-metolachlor also showed slight synergism in combination with carbamazepine or with tebuconazole.
At the 95% effect size, only the pair of ibuprofen and tebuconazole was antagonistic. The types of relationships of diclofenac in pair with carbamazepine, with ibuprofen, or with S-metolachlor were synergies, and with tebuconazole there was a slight synergism. Moderate synergism occurred in the case of carbamazepine combined with ibuprofen or with S-metolachlor. Slight synergism describes the combination of the S-metolachlor and tebuconazole pair.
In Figure 1, the size of the colored bars for each chemical represents the summed absolute values of the strength of synergy and antagonism. At a 10% effect size, carbamazepine and tebuconazole had the largest areas, while at a 50–95% effect size, diclofenac was the most dominant one.
The relationship between the carbamazepine and diclofenac pair was mostly synergistic, especially at effect sizes above 50%, but at 10% effect size, it was antagonism. The carbamazepine and ibuprofen pair was also moderately antagonistic at the 10% effect size, and it changed to moderate synergism with increasing effective concentrations. Most pairs showed a similar tendency along with increasing effect sizes. The most prominent exception was the ibuprofen–tebuconazole pair, which showed antagonism at all effect sizes.

3.3.2. PERMANOVA

According to PERMANOVA, the chosen parameters explain 88.4% of the variance (Table 4). The most significant compounds were tebuconazole (21.95%), ibuprofen (10.69%), and S-metolachlor (8.1%).
Samples containing tebuconazole mainly showed moderate or slight antagonism at 10–20% effect sizes and additivity at 80–95% effect sizes (Figure 2). Ibuprofen affected samples similarly. In both cases, medians were less synergistic across nearly all effect sizes than medians not containing the compound. Samples containing S-metolachlor were mainly additive at 10–20% effect sizes and moderately synergistic at 50–95% effect sizes. Medians of samples not containing S-metolachlor were more antagonistic at 10–20% effect sizes. Samples containing diclofenac showed mainly slight antagonism at 10% effect size and mainly moderate antagonism at 50–95% effect size. In most cases, they were more synergistic at all effect sizes than samples without it. Medians of samples containing carbamazepine showed antagonism, moderate antagonism, or additivity, while medians of other samples were slightly or moderately synergistic at 10–50% effect sizes.
Interactions of ibuprofen–diclofenac (10.56%), tebuconazole–S-metolachlor (7.58%), and tebuconazole–S-metolachlor–carbamazepine (5.7%) were also remarkable. Medians of samples containing ibuprofen and diclofenac were more synergistic than samples that did not contain this combination (Figure 3). Medians of samples containing the combination of tebuconazole and S-metolachlor were additive or slightly synergistic, while medians of samples not containing this combination were antagonistic at 10% effect size and synergistic at 90–95% effect sizes. Medians of samples containing the combination of tebuconazole, S-metolachlor, and carbamazepine showed slight antagonism, while medians of other samples were at least moderately synergistic at 50–95% effect sizes.
Variances of each parameter included in the model were homogenous, and therefore the significant differences detected by PERMANOVA were the result of a locational effect and not by dispersion (Tables S6 and S7). Distances between samples are represented by nonmetric multidimensional scaling ordinations (stress = 0.0081) by parameters in Figures S2–S4.

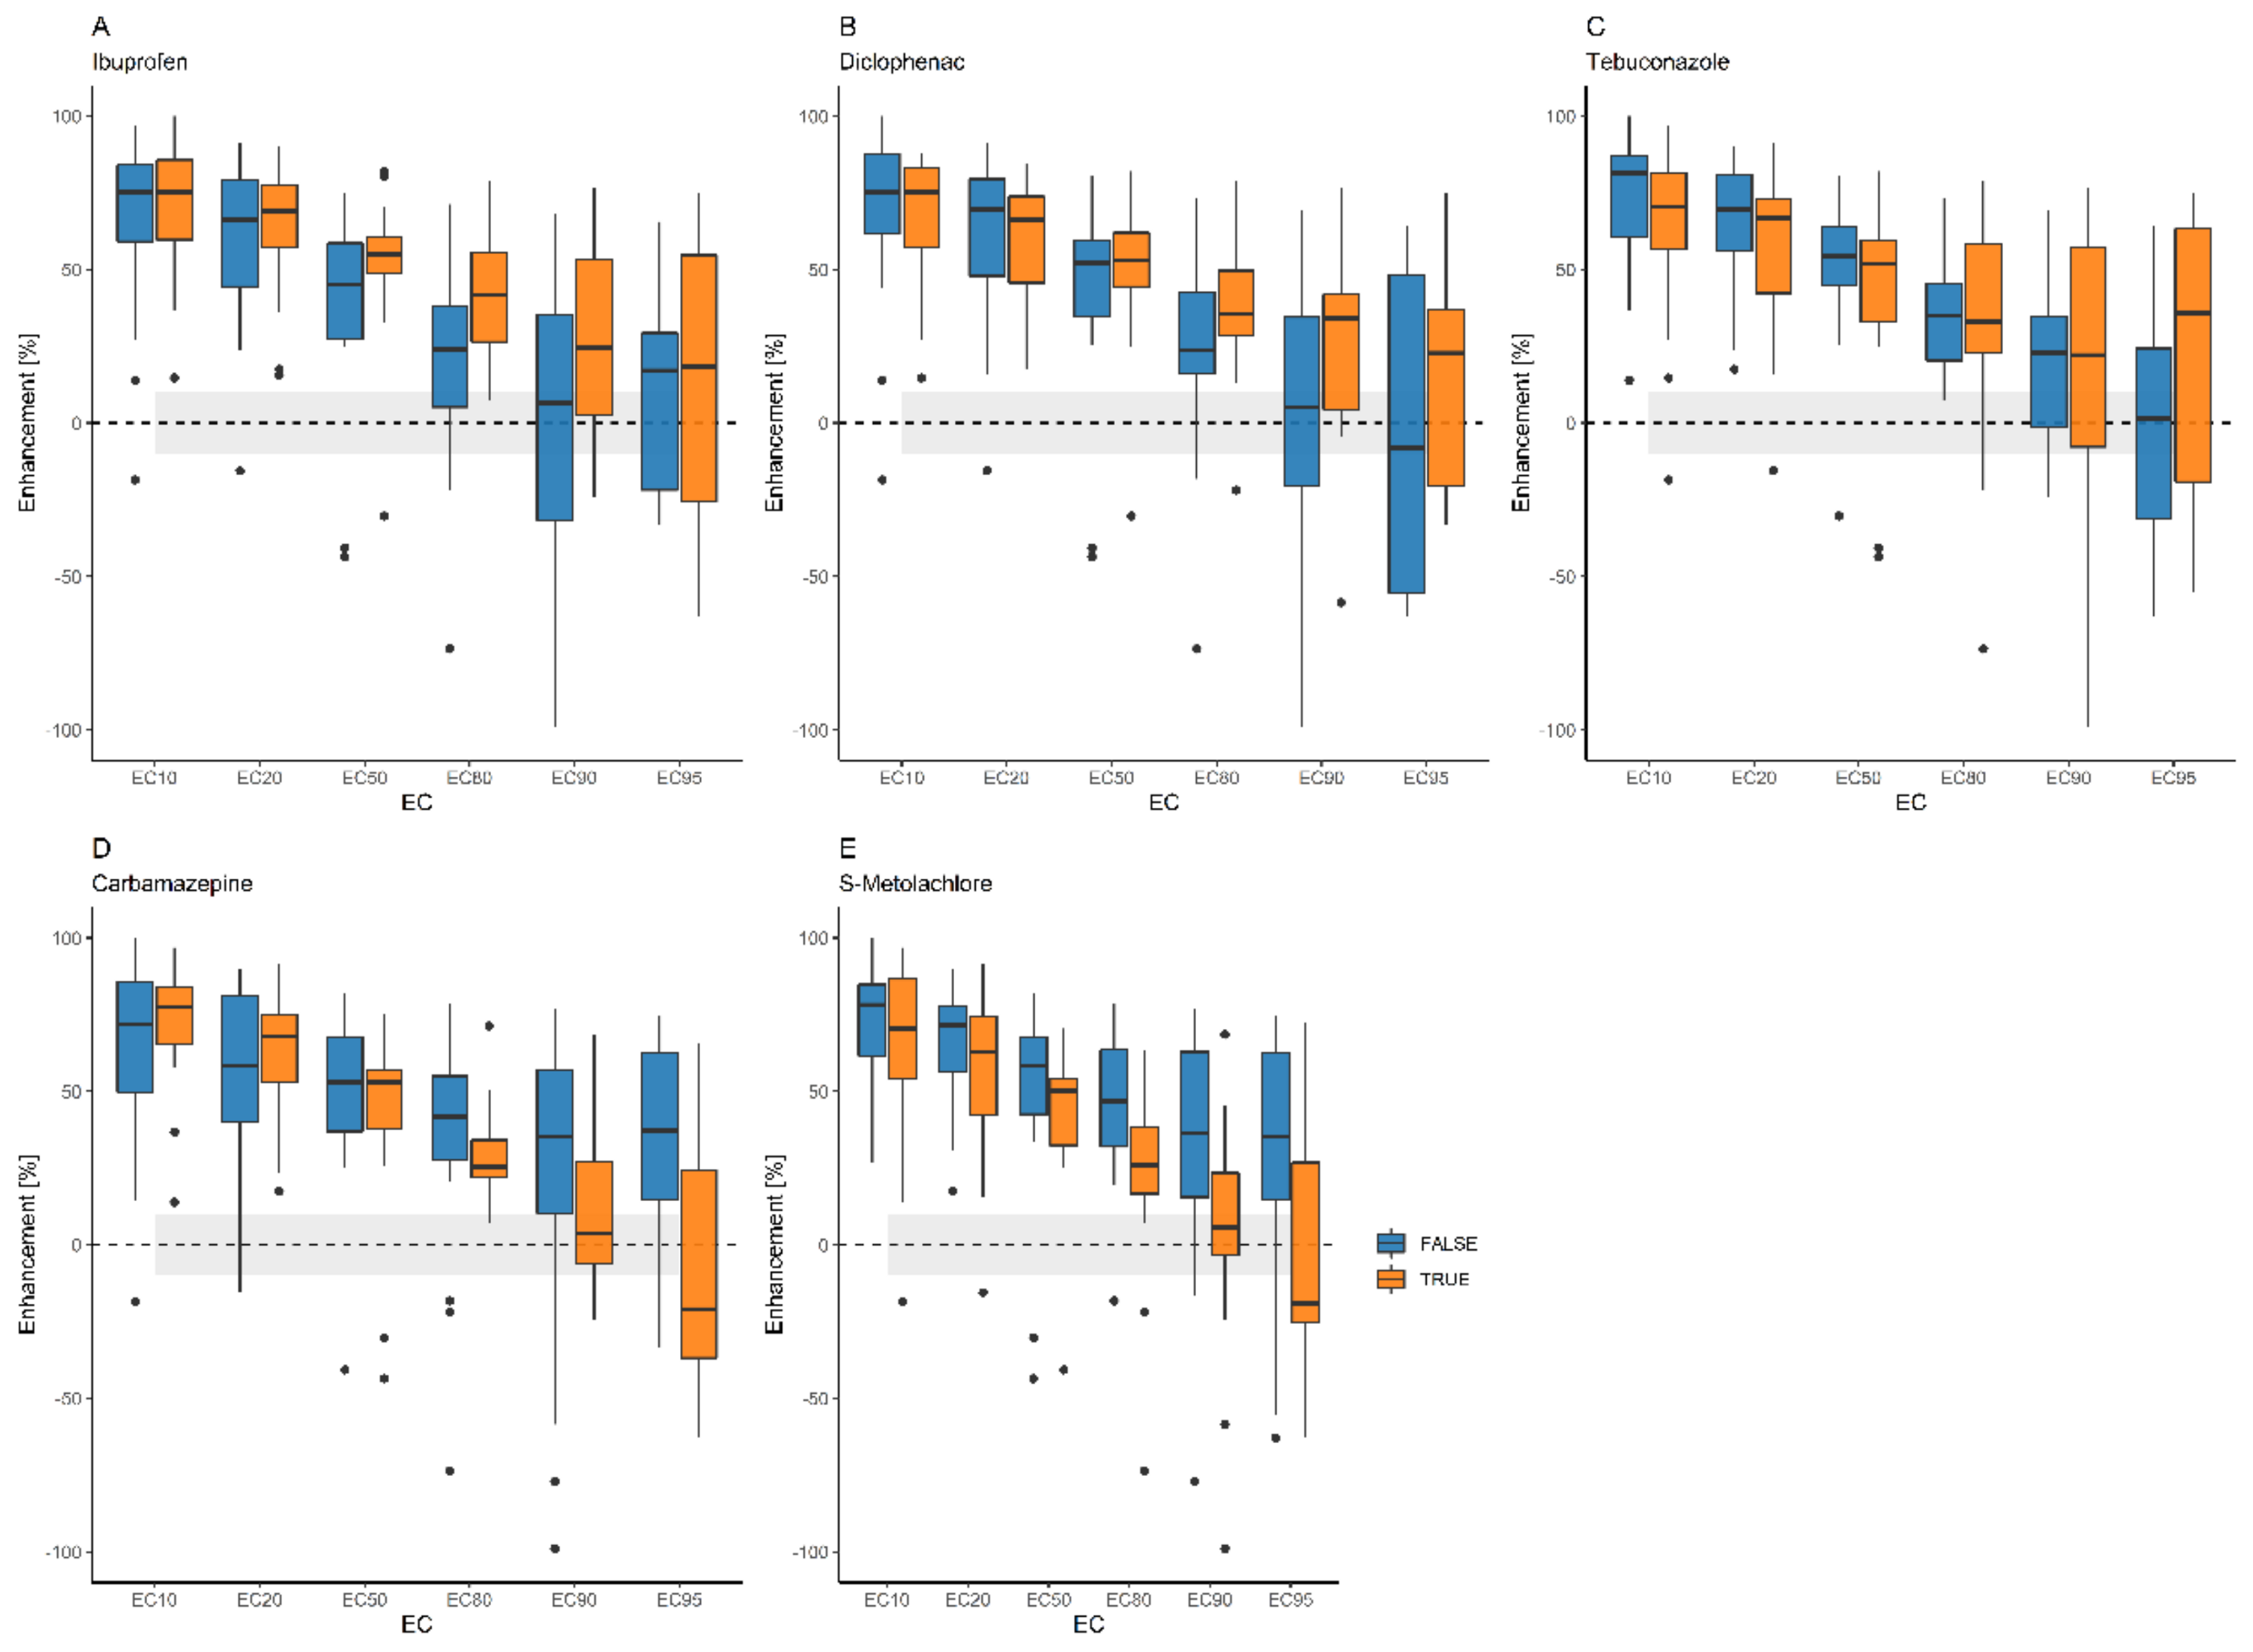
3.4. Enhancement by Terbuthylazine

3.4.1. Pairwise Description

Effects of most chemicals and chemical combinations were greatly enhanced (over or around 50%) by terbuthylazine at lower effect levels (10–50%). On the other hand, median enhancement was a lesser and lesser characteristic at increasing effect levels. The median enhancement by terbuthylazine was greater with diclofenac above 80% effect levels, with ibuprofen at 80 and 90% effect levels, or with tebuconazole at a 95% effect level compared to other samples. The combination of terbuthylazine with carbamazepine or S-metolachlor resulted in lower median enhancement above 80% effect levels or even reduced the effects at the 95% effect level (see Figure 4 and Figure 5).

3.4.2. PERMANOVA

According to PERMANOVA, samples containing terbuthylazine were most strongly affected by the combination of ibuprofen, diclofenac, and carbamazepine (16.3%); by the combination of ibuprofen and diclofenac (13.7%); by diclofenac alone (11.9%); by the combination of ibuprofen, diclofenac, and tebuconazole (10.97%); by ibuprofen alone (9.8%); by the combination of diclofenac and carbamazepine (7.2%); by carbamazepine alone (6.8%); and by the combination of diclofenac and tebuconazole (5.7%). The effect of tebuconazole alone was also significant, but it explained only 1.7% of the variance. Further significant combinations with smaller proportions of explained variance are also listed in Table 5.
Variances of each parameter included in the model were homogenous, and therefore the significant differences detected by PERMANOVA were the result of the locational effect and not by dispersion (Tables S6–S11). Distances between samples are represented by non-metric multidimensional scaling ordinations (stress = 0.0050) by parameters in Figures S5–S7.

4. Discussion

Among the arsenal of micropollutants, active pharmaceutical ingredients and pesticides are one of the greatest ecotoxicological concerns, especially when they are occurring as an unintentional mixture in the environment derived from many different sources at varying doses.
In our work, we experimentally assessed the cocktail effects between three APIs and three pesticides from the most frequently detected micropollutants, creating all the possible combinations in the acute (30 min) Aliivibrio fischeri ecotoxicological assay. Interactions between the compounds in non-equitox mixtures were determined by using the combination index method [40]. Moreover, going beyond the sheer characterization of interactions between the compounds by combination indices, we uniquely used a permutational multivariant analysis of variance (PERMANOVA) to determine the roles of the compounds in the mixtures containing pharmaceuticals and pesticide with different modes of action.
While these compounds were developed to affect specific biological processes in humans, animals, and plants, they also have an effect on non-target organisms in the ecosystem. The exact effects how these compounds with varying mode of actions impact the non-target organism is still unclear. Furthermore, there is a possibility of various unpredictable chemical interactions between these compounds at the molecular level, influencing toxicity [63,64]. Ecotoxicological testing is necessary to assess the cumulative biological effects of chemical cocktails including the changed biological effects due to molecular reactions between the compounds.
The Aliivibrio fischeri bioluminescence assay serves as a sensitive, easy, and reproducible method for evaluating the general cytotoxic effects of chemicals and environmental samples. Several studies have been conducted on binary mixtures of pharmaceuticals, including diclofenac and ibuprofen. Noteworthy among these are investigations by Di Nica et al., Ukić et al., Zuriaga et al., and Drzymała et al., who reported a relatively high incidence of synergy and additive effects [65,66,67,68]. In contrast, studies by Ge et al. (2020) [69], focusing on the interaction between antibiotics in binary mixtures, did not observe synergic effects; instead, they reported antagonism or additive actions. Additionally, Cedergreen et al. (2006) and Sigurnjak et al. (2020) delved into the effects of binary mixtures of pesticides [70,71] and frequently identified additive action and synergy between pesticide pairs using the Aliivibrio fischeri assay. These findings underscore the assay’s utility in discerning interactions and effects within various chemical mixtures. Assessing the interactions between pesticides and antibiotics, Baek et al. (2019) registered synergy only in 12% of the mixtures, while Matias et al. (2023) found high synergistic incidence in those containing prochloraz [42,72]. Villa et al. (2012) investigated the effect of eight complex mixtures with a high number of components (up to 84 chemicals) on Aliivibrio fischeri but found that none of the interactions were a synergy [73]. Jacob et al. (2020) examined four pharmaceuticals (metformin, simvastatin, diazepam, and omeprazole) and all their possible mixtures, detecting only antagonism [74]. Białk-Bielińska et al. (2022) conducted experiments on Aliivibrio fischeri with a mixture of three NSADs (diclofenac, ibuprofen, and naproxen) and three antibacterial drugs, registering mostly additive actions between the APIs [43].
According to our results, in all the mixtures not containing terbuthylazine, the most significant effects were induced by tebuconazole, ibuprofen, and S-metolachlor. While tebuconazole and ibuprofen generated additivity only at higher effective concentrations, S-metolachlor (with low toxicity on itself) provoked additivity and synergy at all concentrations. Tebuconazole and S-metolachlor together were also acting additively or synergistically. Mixtures containing terbuthylazine were highly enhanced, especially at lower effective concentrations.
Previous reviews highlighted that synergy is a fairly rare phenomenon in mixtures [35,36]; however, in our study, synergistic effects occurred in more than 70% of the cocktails in at least one effective concentration, and non-toxic terbuthylazine had a toxicity-enhancing effect in all mixtures but two. Moreover, while most of the mixtures that we tested showed increased synergy in proportion to the increased concentration, ibuprofen and tebuconazole paired with carbamazepine or S-metolachlor showed synergy at low, environmentally relevant concentrations.
Similarly to previous studies [65,66], our results showed the synergistic effects of diclofenac on other pharmaceuticals; however, DCF also had a toxicity-increasing effect on pesticides. PERMANOVA analysis (based on the CI values), uniquely used for this purpose in our study, confirmed that both diclofenac and carbamazepine, alone and together, acted synergistically in the mixtures. Diclofenac also resulted in significant synergism paired with S-metolachlor and in a ternary mixture with ibuprofen and S-metolachlor. S-metolachlor alone and paired with ibuprofen or diclofenac increased the toxicity at lower effective concentrations in the mixtures.
Due to the ineffective techniques for the removal of micropollutants and the lack of force of legislation regarding these compounds, both APIs and pesticides are often detected at a high level in effluent wastewater [31]. Usually, these substances appear in low μg/L concentration, apart from some places with extreme exposure. However, these xenobiotics appear in high concentrations (mg/L or mg/kg) in extreme cases; for example, in Pakistan, DCF was detected as high as 252–836 μg/L, 695–4968 μg/kg, 125–6632 μg/kg, and 101–257 μg/kg, and IBU 703–1673 μg/L, 2053–6046 μg/kg, 133–1229 μg/kg, and 321–610 μg/kg concentrations in wastewater, sludge, solid waste, and soil, respectively [75]. DCF was detected at a concentration of 2.051 mg/L in Slovakia from untreated urban wastewater [31]. Bibi et al. (2023) reported extreme concentration in wastewater with the highest level at 311,495 µg/L DCF [76]. Metolachlor and terbuthylazine were detected in runoff water at 228.3 μg/L and 290.5 μg/L, respectively. Ibuprofen also was detected at these concentrations in environmental samples and runoff waters [77,78,79]. Additionally, detection data do not necessarily exhaustively represent the concentrations of the active substances in environmental matrices. According to our study, ibuprofen and diclofenac in combination showed synergistic effects at a mixture concentration of 2 mg/L (EC10), and terbuthylazine enhanced the cytotoxicity of ibuprofen even at a mixture concentration of 1 mg/L. The quaternary mixture containing carbamazepine, ibuprofen, tebuconazole, and terbuthylazine should also be highlighted, which was proven to be toxic and moderately synergic at even 1 mg/L total concentration, which is below the aforementioned environmental levels. It must be emphasized that the tested concentration ranges in our research were often several orders of magnitude higher than the concentrations of these compounds found in environmental samples. Therefore, in further chronic experiments, testing on other trophic levels should be taken into account. However, one of the main objectives of ecotoxicological studies is to provide data on the toxicity of certain substances using test organisms that enable the estimation of concentration of substances that have no adverse effect on the ecosystem (using assessment factors). Thus, it is crucial not only to test environmentally relevant concentrations but also to gain ecotoxicological information in general, especially considering that sensitive test organisms representing the sensitivity of an ecosystem are not applicable in every case.
The toxicity-enhancing effect of terbuthylazine at low effective levels is foreboding, seeing that it has become nearly a ubiquitous pesticide, particularly in countries where atrazine has been banned. Currently there is no generally accepted all-encompassing explanation for either synergy or one-sided enchantment. In general, the most frequently observed type of synergism occurs when the toxic effect of one substance, referred to as the ‘driver’, is enhanced by a second substance, called the ‘enhancer’. The enhancer can reduce the metabolic inactivation or excretion of the driver, leading to a situation where more of the driver substance is present at the site of effect [80]. On a vertebrate model organism, terbuthylazine and atrazine increased the toxicity of chlorpyrifos, presumably by accelerating its metabolic conversion into a more toxic form, highlighting the possibility of interactions between pesticides when co-occurring in the environment [81]. In a short-term exposure test using a prokaryote as test organism, as applied in this study, the increased toxicity is likely attributed to chemical interactions between terbuthylazine and other substances.
Regarding the toxicology and ecotoxicology of mixtures, there is a significant knowledge gap and inconsistency, coupled with global concern about the assessment, prediction, and impact of pharmaceuticals and pesticide residues in mixtures on the environment.
Alternative statistical analysis methods and a careful selection of chemicals play pivotal roles in achieving a more precise prediction of ecotoxicological effects for environmentally relevant chemicals and the interaction in their cocktails.

5. Conclusions

A comprehensive dataset regarding the acute cytotoxicity of three APIs and three pesticides and their all-possible combinations on Aliivibrio fischeri was generated. PERMANOVA, uniquely used in this study, was successfully applied to determine the roles of compounds in synergistic, additive, and antagonistic effects in mixtures at different effective concentrations. Diclofenac with ibuprofen, S-metolachlor, and carbamazepine, as well as ibuprofen with S-metolachlor, exhibited synergistic effects in all combinations, even at environmentally relevant concentrations. Diclofenac paired with ibuprofen, carbamazepine, or S-metolachlor induced synergism in the mixtures, parallel to the increase in effective concentrations. Terbuthylazine, now an almost ubiquitous pesticide residue, should also be highlighted, having had no acute cytotoxic effect on Aliivibrio fischeri alone, but it significantly enhanced the toxicity of mixtures containing it, especially at low concentrations.

Supplementary Materials

The following supporting information can be downloaded at: https://www.mdpi.com/article/10.3390/toxics12030189/s1, Table S1. Name, CAS number, IUPAC name, structure and LD50 of tested compounds carbamazepine, diclofenac, ibuprofen, S-metolachlor, tebuconazole, terbuthylazine; Table S2. Acute cytotoxicity of the test chemicals alone and in mixtures. Concentrations are expressed in mg/L resulting in 10, 20, 50, 80, 90, and 95% bioluminescence inhibition in Aliivibrio fischeri after 30 min of exposure. 1: carbamazepine, 2: diclofenac, 3: ibuprofen, 4: S-metolachlor, 5: tebuconazole, 6: terbuthylazine. N.t.—non-toxic at the applied concentration; Table S3. Combination Indices for mixtures containing carbamazepine (CBZ), diclofenac (DCF), ibuprofen (IBU), S-metolachlor (MTC), and tebuconazole (TBZ) at effective concentration resulting in 10, 20, 50, 80, 90, and 95% inhibition in bioluminescence in Aliivibrio fischeri. CI values were calculated by CompuSyn software using 6 concentration-response data points (EC10, EC20, EC50, EC80, EC90, and EC95). Synergistic (CI < 0.9) and additive effects (0.9 < CI < 1.1) are indicated in bold and italics, respectively; Table S4. Enhancement on cytotoxicity by terbuthylazine at concentrations resulting in 10, 20, 50, 80, 90, and 95% bioluminescence inhibition in Aliivibrio fischeri after 30 min of exposure. Enhancement of non-toxic terbuthylazine is expressed in percent of the required dose change of the other compounds in the mixture not containing terbuthylazine to result in the same effect size as the mixture containing it. n.e.—no enhancing effect. Carbamazepine (CBZ), diclofenac (DCF), ibuprofen (IBU), S-metolachlor (MTC), and tebuconazole (TBZ), terbuthylazine (TRB); Table S5. Description of synergism or antagonism in drug combination studies analyzed with the CI method described by Chou and Talalay (Chou, 2008) [56]; Table S6. Analyses of multivariate homogeneity: comparing samples containing a specific compound to other samples based on the distance matrix based on transformed combination indices; Table S7. Analyses of multivariate homogeneity: comparing samples containing a specific compound to other samples based on the distance matrix based on transformed combination indices; Table S8. Analyses of multivariate homogeneity: comparing samples containing a specific compound to other samples based on the distance matrix of enhancement by terbuthylazine; Table S9. Analyses of multivariate homogeneity: comparing samples containing compound combinations included in the model of the permutational multivariate analyses of variance to other samples based on the distance matrix of enhancement by Terbuthylazine; Table S10. Analyses of multivariate homogeneity: comparing samples containing compound combinations included in the model of the permutational multivariate analyses of variance to other samples based on the distance matrix of enhancement by terbuthylazine. Table S11. Analyses of multivariate homogeneity: comparing samples containing compound combinations included in the model of the permutational multivariate analyses of variance to other samples based on the distance matrix of enhancement by terbuthylazine. Figure S1. A: Raw CI limits; B: Transformed CI value limit; C: RAW CI data distribution; D: Transformed CI data distribution. Figure S2. Effect level contours and compounds in Non-Metric Multidimensional scaling ordinations based on Euclidean distances of transformed combination indices. Figure S3. Non-Metric Multidimensional scaling ordinations based on Euclidean distances of transformed combination indices by compounds. Figure S4. Non-Metric Multidimensional scaling ordinations based on Euclidean distances of transformed combination indices by compounds. Figure S5. Effect level contours and compounds in Non-Metric Multidimensional scaling ordinations based on Euclidean distances of enhancement by Terbuthylazine. Figure S6. Non-Metric Multidimensional scaling ordinations based on Euclidean distances of enhancement by Terbuthylazine by compounds and compound combinations. Figure S7. Non-Metric Multidimensional scaling ordinations based on Euclidean distances of enhancement by Terbuthylazine by compounds and compound combinations. Figure S8. Weighted mean of transformed Combination Indexes of compound pairs from all the combinations where the chemicals were present in the examined combinations at effect sizes 10%, 20%, 50%, 80%, 90%, and 95%. The strength of synergy (blue) and antagonism (red) is shown by the width of linkage and color intensity.

Author Contributions

Conceptualization, J.H.; methodology, J.H. and R.E.S.; validation, G.T. and G.S.; formal analysis, J.H., B.G., R.E.S. and G.S.; investigation, B.G., J.H., R.E.S. and G.T.; resources, J.H., B.K. and E.K.; data curation, J.H. and G.S.; writing—original draft preparation, J.H., B.G. and R.E.S.; writing—review and editing, J.H., B.G., G.S., E.K., S.S. and G.T.; visualization, J.H., B.G. and R.E.S.; supervision, J.H.; project administration, J.H.; funding acquisition, J.H., E.K., S.S. and B.K. All authors have read and agreed to the published version of the manuscript.

Funding

This research was supported by the ÚNKP-20-4-II New National Excellence Program of the Ministry for Innovation and Technology from the source of the National Research, Development and Innovation Fund. Project no. 2020-1.1.2-PIACI-KFI-2021-00239 was implemented with the support provided by the Ministry of Innovation and Technology of Hungary from the National Research, Development and Innovation Fund, financed under the PIACI KFI funding scheme, and the Thematic Excellence Program TKP2020-NKA-16 of Hungarian University of Agriculture and Life Sciences, awarded by Ministry for Innovation and Technology.

Data Availability Statement

Data are available upon request by email to the corresponding author.

Conflicts of Interest

The authors declare no conflicts of interest.

References

  1. Naidu, R.; Biswas, B.; Willett, I.R.; Cribb, J.; Kumar Singh, B.; Paul Nathanail, C.; Coulon, F.; Semple, K.T.; Jones, K.C.; Barclay, A.; et al. Chemical Pollution: A Growing Peril and Potential Catastrophic Risk to Humanity. Environ. Int. 2021, 156, 106616. [Google Scholar] [CrossRef]
  2. EUROSTAT Chemicals Production and Consumption Statistics. Available online: https://ec.europa.eu/eurostat/statistics-explained/index.php?title=Chemicals_production_and_consumption_statistics#Total_production_of_chemicals (accessed on 23 January 2024).
  3. Schwarzenbach, R.; Escher, B.; Fenner, K.; Hofstetter, T.; Johnson, A.; Gunten, U.; Wehrli, B. The Challenge of Micropollutants in Aquatic Systems. Science 2006, 313, 1072–1077. [Google Scholar] [CrossRef]
  4. Schirmer, K.; Schirmer, M. Who Is Chasing Whom? A Call for a More Integrated Approach to Reduce the Load of Micro-Pollutants in the Environment. Water Sci. Technol. 2008, 57, 145–150. [Google Scholar] [CrossRef] [PubMed]
  5. Zhang, W. Global Pesticide Use: Profile, Trend, Cost/Benefit and More. Proc. Int. Acad. Ecol. Environ. Sci. 2018, 8, 1–27. [Google Scholar]
  6. IQVIA-Institute for Human Data Science. The Global Use of Medicines 2023. Outlook to 2027. Available online: https://www.iqvia.com/insights/the-iqvia-institute/reports-and-publications/reports/the-global-use-of-medicines-2023 (accessed on 23 January 2024).
  7. Bottoni, P.; Grenni, P.; Lucentini, L.; Caracciolo, A.B. Terbuthylazine and Other Triazines in Italian Water Resources. Microchem. J. 2013, 107, 136–142. [Google Scholar] [CrossRef]
  8. Álvarez, P.M.; Quiñones, D.H.; Terrones, I.; Rey, A.; Beltrán, F.J. Insights into the Removal of Terbuthylazine from Aqueous Solution by Several Treatment Methods. Water Res. 2016, 98, 334–343. [Google Scholar] [CrossRef]
  9. Sbrilli, G.; Bimbi, B.; Cioni, F.; Pagliai, L.; Luchi, F.; Lanciotti, E. Surface and Ground Waters Characterization in Tuscany (Italy) by Using Algal Bioassay and Pesticide Determinations: Comparative Evaluation of the Results and Hazard Assessment of the Pesticides Impact on Primary Productivity. Chemosphere 2005, 58, 571–578. [Google Scholar] [CrossRef]
  10. Di Guardo, A.; Volpi, E.; Finizio, A. Analysis of Large-Scale Monitoring Data to Identify Spatial and Temporal Trend of Risk for Terbuthylazine and Desethyl-Terbuthylazine in Surface Water Bodies of Po Plain (Italy). Sci. Total Environ. 2020, 740, 140121. [Google Scholar] [CrossRef]
  11. Boldrin, A.; Langone, L.; Miserocchi, S.; Turchetto, M.; Acri, F. Po River Plume on the Adriatic Continental Shelf: Dispersion and Sedimentation of Dissolved and Suspended Matter during Different River Discharge Rates. Mar. Geol. 2005, 222–223, 135–158. [Google Scholar] [CrossRef]
  12. Touloupakis, E.; Giannoudi, L.; Piletsky, S.A.; Guzzella, L.; Pozzoni, F.; Giardi, M.T. A Multi-Biosensor Based on Immobilized Photosystem II on Screen-Printed Electrodes for the Detection of Herbicides in River Water. Biosens. Bioelectron. 2005, 20, 1984–1992. [Google Scholar] [CrossRef] [PubMed]
  13. Carafa, R.; Wollgast, J.; Canuti, E.; Ligthart, J.; Dueri, S.; Hanke, G.; Eisenreich, S.J.; Viaroli, P.; Zaldívar, J.M. Seasonal Variations of Selected Herbicides and Related Metabolites in Water, Sediment, Seaweed and Clams in the Sacca Di Goro Coastal Lagoon (Northern Adriatic). Chemosphere 2007, 69, 1625–1637. [Google Scholar] [CrossRef]
  14. Loos, R.; Locoro, G.; Comero, S.; Contini, S.; Schwesig, D.; Werres, F.; Balsaa, P.; Gans, O.; Weiss, S.; Blaha, L.; et al. Pan-European Survey on the Occurrence of Selected Polar Organic Persistent Pollutants in Ground Water. Water Res. 2010, 44, 4115–4126. [Google Scholar] [CrossRef]
  15. Roubeix, V.; Fauvelle, V.; Tison-Rosebery, J.; Mazzella, N.; Coste, M.; Delmas, F. Assessing the Impact of Chloroacetanilide Herbicides and Their Metabolites on Periphyton in the Leyre River (SW France) via Short Term Growth Inhibition Tests on Autochthonous Diatoms. J. Environ. Monit. 2012, 14, 1655–1663. [Google Scholar] [CrossRef]
  16. Velisek, J.; Stara, A.; Zuskova, E.; Kubec, J.; Buric, M.; Kouba, A. Chronic Toxicity of Metolachlor OA on Growth, Ontogenetic Development, Antioxidant Biomarkers and Histopathology of Early Life Stages of Marbled Crayfish. Sci. Total Environ. 2018, 643, 1456–1463. [Google Scholar] [CrossRef] [PubMed]
  17. NFCSO—National Food Security Office. Hungary. Available online: https://portal.nebih.gov.hu/documents/10182/367102/2022_Szerforg_publikus.pdf/4212dc94-24c8-c38f-43d9-288b84a9fe5d?t=1699541239342 (accessed on 23 January 2024).
  18. Ackerman, F. The Economics of Atrazine. Int. J. Occup. Environ. Health 2007, 13, 437–445. [Google Scholar] [CrossRef]
  19. Lefrancq, M.; Jadas-Hécart, A.; La Jeunesse, I.; Landry, D.; Payraudeau, S. High Frequency Monitoring of Pesticides in Runoff Water to Improve Understanding of Their Transport and Environmental Impacts. Sci. Total Environ. 2017, 587–588, 75–86. [Google Scholar] [CrossRef]
  20. Herrero-Hernández, E.; Andrades, M.S.; Álvarez-Martín, A.; Pose-Juan, E.; Rodríguez-Cruz, M.S.; Sánchez-Martín, M.J. Occurrence of Pesticides and Some of Their Degradation Products in Waters in a Spanish Wine Region. J. Hydrol. 2013, 486, 234–245. [Google Scholar] [CrossRef]
  21. Herrero-Hernández, E.; Pose-Juan, E.; Sánchez-martín, M.J. Intra-Annual Trends of Fungicide Residues in Waters from Vineyard Areas in La Rioja Region of Northern Spain. Environ. Sci. Pollut. Res. 2016, 23, 22924–22936. [Google Scholar] [CrossRef] [PubMed]
  22. Masiá, A.; Campo, J.; Navarro-Ortega, A.; Barceló, D.; Picó, Y. Pesticide Monitoring in the Basin of Llobregat River (Catalonia, Spain) and Comparison with Historical Data. Sci. Total Environ. 2015, 503–504, 58–68. [Google Scholar] [CrossRef] [PubMed]
  23. Vulava, V.M.; Cory, W.C.; Murphey, V.L.; Ulmer, C.Z. Sorption, Photodegradation, and Chemical Transformation of Naproxen and Ibuprofen in Soils and Water. Sci. Total Environ. 2016, 565, 1063–1070. [Google Scholar] [CrossRef]
  24. Konstantinou, I.K.; Hela, D.G.; Albanis, T.A. The Status of Pesticide Pollution in Surface Waters (Rivers and Lakes) of Greece. Part I. Review on Occurrence and Levels. Environ. Pollut. 2006, 141, 555–570. [Google Scholar] [CrossRef] [PubMed]
  25. Čelić, M.; Jaén-Gil, A.; Briceño-Guevara, S.; Rodríguez-Mozaz, S.; Gros, M.; Petrović, M. Extended Suspect Screening to Identify Contaminants of Emerging Concern in Riverine and Coastal Ecosystems and Assessment of Environmental Risks. J. Hazard. Mater. 2021, 404, 124102. [Google Scholar] [CrossRef]
  26. Xu, M.; Huang, H.; Li, N.; Li, F.; Wang, D.; Luo, Q. Occurrence and Ecological Risk of Pharmaceuticals and Personal Care Products (PPCPs) and Pesticides in Typical Surface Watersheds, China. Ecotoxicol. Environ. Saf. 2019, 175, 289–298. [Google Scholar] [CrossRef]
  27. Perin, M.; Dallegrave, A.; Suchecki Barnet, L.; Zanchetti Meneghini, L.; de Araújo Gomes, A.; Pizzolato, T.M. Pharmaceuticals, Pesticides and Metals/Metalloids in Lake Guaíba in Southern Brazil: Spatial and Temporal Evaluation and a Chemometrics Approach. Sci. Total Environ. 2021, 793, 148561. [Google Scholar] [CrossRef] [PubMed]
  28. Tóth, G.; Háhn, J.; Szoboszlay, S.; Harkai, P.; Farkas, M.; Radó, J.; Göbölös, B.; Kaszab, E.; Szabó, I.; Urbányi, B.; et al. Spatiotemporal Analysis of Multi-Pesticide Residues in the Largest Central European Shallow Lake, Lake Balaton, and Its Sub-Catchment Area. Environ. Sci. Eur. 2022, 34, 50. [Google Scholar] [CrossRef]
  29. Kümmerer, K. Pharmaceuticals in the Environment–A Brief Summary. In Pharmaceuticals in the Environment: Sources, Fate, Effects and Risks; Springer: Berlin/Heidelberg, Germany, 2008. [Google Scholar] [CrossRef]
  30. Aus der Beek, T.; Weber, F.A.; Bergmann, A.; Hickmann, S.; Ebert, I.; Hein, A.; Küster, A. Pharmaceuticals in the Environment-Global Occurrences and Perspectives. Environ. Toxicol. Chem. 2016, 35, 823–835. [Google Scholar] [CrossRef] [PubMed]
  31. Dusi, E.; Rybicki, M.; Jungmann, D. The Database “Pharmaceuticals in the Environment”—Update and New Analysis; Final Report; Umweltbundesamt: Dessau-Roßlau, Germany, 2019. [Google Scholar]
  32. Loos, R.; Gawlik, B.M.; Locoro, G.; Rimaviciute, E.; Contini, S.; Bidoglio, G. EU-Wide Survey of Polar Organic Persistent Pollutants in European River Waters. Environ. Pollut. 2009, 157, 561–568. [Google Scholar] [CrossRef]
  33. Li, W.C. Occurrence, Sources, and Fate of Pharmaceuticals in Aquatic Environment and Soil. Environ. Pollut. 2014, 187, 193–201. [Google Scholar] [CrossRef]
  34. Belden, J.B.; Gilliom, R.J.; Lydy, M.J. How Well Can We Predict the Toxicity of Pesticide Mixtures to Aquatic Life? Integr. Environ. Assess. Manag. 2007, 3, 364–372. [Google Scholar] [CrossRef]
  35. Cedergreen, N. Quantifying Synergy: A Systematic Review of Mixture Toxicity Studies within Environmental Toxicology. PLoS ONE 2014, 9, e96580. [Google Scholar] [CrossRef]
  36. Martin, O.V. Synergistic Effects of Chemical Mixtures: How Frequent Is Rare? Curr. Opin. Toxicol. 2023, 36, 100424. [Google Scholar] [CrossRef]
  37. Loewe, S.; Muischenk, H. Kombinationswirkungen. 1. Mitteilung: Hilfsmittel Der Fragestellung. Naunyn-Schmiedeberg’s Arch. Exp. Path. Pharmakol. 1926, 24, 316–326. [Google Scholar] [CrossRef]
  38. Bliss, C.I. The Toxicity of Poisons Applied Jointly. Ann. Appl. Biol. 1939, 26, 585–615. [Google Scholar] [CrossRef]
  39. Cedergreen, N.; Christensen, A.M.; Kamper, A.; Kudsk, P.; Mathiassen, S.K.; Streibig, J.C.; Sørensen, H. A Review of Independent Action Compared to Concentration Addition as Reference Models for Mixtures of Compounds with Different Molecular Target Sites. Environ. Toxicol. Chem. 2008, 27, 1621–1632. [Google Scholar] [CrossRef] [PubMed]
  40. Roell, K.R.; Reif, D.M.; Motsinger-Reif, A.A. An Introduction to Terminology and Methodology of Chemical Synergy-Perspectives from across Disciplines. Front. Pharmacol. 2017, 8, 158. [Google Scholar] [CrossRef] [PubMed]
  41. Kahatagahawatte, Y.B.P.; Hara-Yamamura, H. Review on Mixture Toxicity of Pharmaceuticals in Environmental Waters and Wastewater Effluents. In Resilience, Response, and Risk in Water Systems; Springer Transactions in Civil and Environmental Engineering; Springer: Singapore, 2020; pp. 105–126. [Google Scholar]
  42. Baek, I.H.; Kim, Y.; Baik, S.; Kim, J. Investigation of the Synergistic Toxicity of Binary Mixtures of Pesticides and Pharmaceuticals on Aliivibrio fischeri in Major River Basins in South Korea. Int. J. Environ. Res. Public Health 2019, 16, 208. [Google Scholar] [CrossRef]
  43. Białk-Bielińska, A.; Grabarczyk, Ł.; Mulkiewicz, E.; Puckowski, A.; Stolte, S.; Stepnowski, P. Mixture Toxicity of Six Pharmaceuticals towards Aliivibrio fischeri, Daphnia magna, and Lemna minor. Environ. Sci. Pollut. Res. 2022, 29, 26977–26991. [Google Scholar] [CrossRef]
  44. Altenburger, R.; Nendza, M.; Schüürmann, G. Mixture Toxicity and Its Modeling by Quantitative Structure-Activity Relationships. Environ. Toxicol. Chem. 2003, 22, 1900–1915. [Google Scholar] [CrossRef]
  45. Ajmani, S.; Rogers, S.C.; Barley, M.H.; Livingstone, D.J. Application of QSPR to Mixtures. J. Chem. Inf. Model. 2006, 46, 2043–2055. [Google Scholar] [CrossRef]
  46. Lu, G.; Wang, C.; Tang, Z.; Guo, X. Joint Toxicity of Aromatic Compounds to Algae and QSAR Study. Ecotoxicology 2007, 16, 485–490. [Google Scholar] [CrossRef] [PubMed]
  47. Toropova, A.P.; Toropov, A.A.; Benfenati, E.; Gini, G.; Leszczynska, D.; Leszczynski, J. CORAL: Models of Toxicity of Binary Mixtures. Chemom. Intell. Lab. Syst. 2012, 119, 39–43. [Google Scholar] [CrossRef]
  48. Yao, Z.; Lin, Z.; Wang, T.; Tian, D.; Zou, X.; Gao, Y.; Yin, D. Using Molecular Docking-Based Binding Energy to Predict Toxicity of Binary Mixture with Different Binding Sites. Chemosphere 2013, 92, 1169–1176. [Google Scholar] [CrossRef]
  49. Wang, T.; Tang, L.; Luan, F.; Cordeiro, M.N.D.S. Prediction of the Toxicity of Binary Mixtures by Qsar Approach Using the Hypothetical Descriptors. Int. J. Mol. Sci. 2018, 19, 3423. [Google Scholar] [CrossRef]
  50. Kolmar, S.S.; Grulke, C.M. The Effect of Noise on the Predictive Limit of QSAR Models. J. Cheminform. 2021, 13, 92. [Google Scholar] [CrossRef]
  51. Belfield, S.J.; Firman, J.W.; Enoch, S.J.; Madden, J.C.; Erik Tollefsen, K.; Cronin, M.T.D. A Review of Quantitative Structure-Activity Relationship Modelling Approaches to Predict the Toxicity of Mixtures. Comput. Toxicol. 2023, 25, 100251. [Google Scholar] [CrossRef]
  52. Kienzler, A.; Berggren, E.; Bessems, J.; Bopp, S.; Van Der Linden, S.; Worth, A. Assessment of Mixtures-Review of Regulatory Requirements and Guidance; Publications Office of the European Union: Luxembourg, 2017; ISBN 9789279384790. [Google Scholar]
  53. Tóth, G.; Háhn, J.; Kriszt, B.; Szoboszlay, S. Acute and Chronic Toxicity of Herbicides and Their Mixtures Measured by Aliivibrio fischeri Ecotoxicological Assay. Ecotoxicol. Environ. Saf. 2019, 185, 109702. [Google Scholar] [CrossRef]
  54. Chou, T.-C. Theoretical Basis, Experimental Design, and Computerized Simulation of Synergism and Antagonism in Drug Combination Studies. Pharmacol. Rev. 2006, 58, 621–681. [Google Scholar] [CrossRef]
  55. Yang, G.; Chen, C.; Wang, Y.; Peng, Q.; Zhao, H.; Guo, D.; Wang, Q.; Qian, Y. Mixture Toxicity of Four Commonly Used Pesticides at Different Effect Levels to the Epigeic Earthworm, Eisenia Fetida. Ecotoxicol. Environ. Saf. 2017, 142, 29–39. [Google Scholar] [CrossRef] [PubMed]
  56. Chou, T.-C.; Talalay, P. Quantitative Analysis of Dose-Effect Relationships: The Combined Effects of Multiple Drugs or Enzyme Inhibitors. Adv. Enzym. Regul. 1984, 22, 27–55. [Google Scholar] [CrossRef] [PubMed]
  57. Chou, T.-C.; Martin, T. CompuSyn for Drug Combinations: PC Software and User’s Guide: A Computer Program for Quantification of Synergism and Antagonism in Drug Combinations and the Determination of IC50 and ED50 and LD50 Values; ComboSyn, Inc.: Paramus, NJ, USA, 2005. [Google Scholar]
  58. Anderson, M.J. Distance-Based Tests for Homogeneity of Multivariate Dispersions. Biometrics 2006, 62, 245–253. [Google Scholar] [CrossRef] [PubMed]
  59. Anderson, M.J.; Ellingsen, K.E.; McArdle, B.H. Multivariate Dispersion as a Measure of Beta Diversity. Ecol. Lett. 2006, 9, 683–693. [Google Scholar] [CrossRef]
  60. O’Neill, M.E.; Mathews, K. A Weighted Least Squares Approach to Levene’s Test of Homogeneity of Variance. Aust. New Zeal. J. Stat. 2000, 42, 81–100. [Google Scholar] [CrossRef]
  61. Stier, A.C.; Geange, S.W.; Hanson, K.M.; Bolker, B.M. Predator Density and Timing of Arrival Affect Reef Fish Community Assembly. Ecology 2013, 94, 1057–1068. [Google Scholar] [CrossRef]
  62. Chou, T.C. Preclinical versus Clinical Drug Combination Studies. Leuk. Lymphoma 2008, 49, 2059–2080. [Google Scholar] [CrossRef] [PubMed]
  63. Nolte, T.M. 300-Fold Higher Neuro- and Immunotoxicity from Low-Redox Transformation of Carbamazepine. Toxicol. Rep. 2023, 11, 319–329. [Google Scholar] [CrossRef] [PubMed]
  64. Devi, R.N.; Stephen, A.D.; Justin, P.; Saravanan, K.; Macchi, P.; Jelsch, C. Topological and Electrostatic Properties of Diclofenac Molecule as a Non-Steroidal Anti-Inflammatory Drug: An Experimental and Theoretical Study. J. Mol. Struct. 2019, 1196, 42–53. [Google Scholar] [CrossRef]
  65. Di Nica, V.; Villa, S.; Finizio, A. Toxicity of Individual Pharmaceuticals and Their Mixtures to Aliivibrio fischeri: Evidence of Toxicological Interactions in Binary Combinations. Environ. Toxicol. Chem. 2017, 36, 815–822. [Google Scholar] [CrossRef] [PubMed]
  66. Ukić; Sigurnjak, M.; Cvetnić, M.; Markić, M.; Stankov, M.N.; Rogošić, M.; Rasulev, B.; Lončarić Božić, A.; Kušić, H.; Bolanča, T. Toxicity of Pharmaceuticals in Binary Mixtures: Assessment by Additive and Non-Additive Toxicity Models. Ecotoxicol. Environ. Saf. 2019, 185, 109696. [Google Scholar] [CrossRef]
  67. Zuriaga, E.; Lomba, L.; German, B.; Lanuza, P.M.; Aldea, L.; Ribate, M.P.; García, C.B.; Giner, B. Ecotoxicity in Aliivibrio fischeri of Ibuprofen, Omeprazole and Their Mixtures. Chem. Ecol. 2019, 35, 102–114. [Google Scholar] [CrossRef]
  68. Drzymała, J.; Kalka, J. Ecotoxic Interactions between Pharmaceuticals in Mixtures: Diclofenac and Sulfamethoxazole. Chemosphere 2020, 259, 127407. [Google Scholar] [CrossRef]
  69. Ge, H.; Zhou, M.; Lv, D.; Wang, M.; Xie, D.; Yang, X.; Dong, C.; Li, S.; Lin, P. Novel Segmented Concentration Addition Method to Predict Mixture Hormesis of Chlortetracycline Hydrochloride and Oxytetracycline Hydrochloride to Aliivibrio fischeri. Int. J. Mol. Sci. 2020, 21, 481. [Google Scholar] [CrossRef] [PubMed]
  70. Cedergreen, N.; Kamper, A.; Streibig, J.C. Is Prochloraz a Potent Synergist across Aquatic Species? A Study on Bacteria, Daphnia, Algae and Higher Plants. Aquat. Toxicol. 2006, 78, 243–252. [Google Scholar] [CrossRef] [PubMed]
  71. Sigurnjak, M.; Ukić; Cvetnić, M.; Markić, M.; Novak Stankov, M.; Rasulev, B.; Kušić, H.; Lončarić Božić, A.; Rogošić, M.; Bolanča, T. Combined Toxicities of Binary Mixtures of Alachlor, Chlorfenvinphos, Diuron and Isoproturon. Chemosphere 2020, 240, 124973. [Google Scholar] [CrossRef] [PubMed]
  72. Matias, V.A.; Weber, A.G.; Gueretz, J.S.; Walz, G.C.; Tagliari-Corrêa, C.V.; Toumi, H.; Férard, J.F.; Radetski, C.M.; Somensi, C.A.; Cotelle, S. An Alternative Approach to Assess Ecotoxicological Effects of Agrochemical Combinations Used in Brazilian Aquaculture Farms. Environ. Sci. Pollut. Res. 2023, 30, 70713–70721. [Google Scholar] [CrossRef] [PubMed]
  73. Villa, S.; Migliorati, S.; Monti, G.S.; Vighi, M. Toxicity on the Luminescent Bacterium Vibrio fischeri (Beijerinck) II: Response to Complex Mixtures of Heterogeneous Chemicals at Low Levels of Individual Components. Ecotoxicol. Environ. Saf. 2012, 86, 93–100. [Google Scholar] [CrossRef] [PubMed]
  74. Jacob, R.S.; de Souza Santos, L.V.; d’Auriol, M.; Lebron, Y.A.R.; Moreira, V.R.; Lange, L.C. Diazepam, Metformin, Omeprazole and Simvastatin: A Full Discussion of Individual and Mixture Acute Toxicity. Ecotoxicology 2020, 29, 1062–1071. [Google Scholar] [CrossRef]
  75. Ashfaq, M.; Nawaz Khan, K.; Saif Ur Rehman, M.; Mustafa, G.; Faizan Nazar, M.; Sun, Q.; Iqbal, J.; Mulla, S.I.; Yu, C.P. Ecological Risk Assessment of Pharmaceuticals in the Receiving Environment of Pharmaceutical Wastewater in Pakistan. Ecotoxicol. Environ. Saf. 2017, 136, 31–39. [Google Scholar] [CrossRef] [PubMed]
  76. Bibi, M.; Rashid, J.; Malik, M.; Iqbal, A.; Xu, M. Physicochemical Analysis and Detection of Exceptionally High Diclofenac Concentration in the Pharmaceutical Wastewaters Collected from the Production Units of National Industrial Zone, Rawat, Pakistan. Appl. Water Sci. 2023, 13, 157. [Google Scholar] [CrossRef]
  77. Chopra, S.; Kumar, D. Ibuprofen as an Emerging Organic Contaminant in Environment, Distribution and Remediation. Heliyon 2020, 6, e04087. [Google Scholar] [CrossRef]
  78. Cardinali, A.; Otto, S.; Zanin, G. Herbicides Runoff in Vegetative Filter Strips: Evaluation and Validation of a Recent Rainfall Return Period Model. Int. J. Environ. Anal. Chem. 2013, 93, 1628–1637. [Google Scholar] [CrossRef]
  79. Otto, S.; Pappalardo, S.E.; Cardinali, A.; Masin, R.; Zanin, G.; Borin, M. Vegetated Ditches for the Mitigation of Pesticides Runoff in the Po Valley. PLoS ONE 2016, 11, e0153287. [Google Scholar] [CrossRef] [PubMed]
  80. Bloch, D.; Diel, P.; Epe, B.; Hellwig, M.; Lampen, A.; Mally, A.; Marko, D.; Villar Fernández, M.A.; Guth, S.; Roth, A.; et al. Basic Concepts of Mixture Toxicity and Relevance for Risk Evaluation and Regulation. Arch. Toxicol. 2023, 97, 3005–3017. [Google Scholar] [CrossRef] [PubMed]
  81. Pérez, J.; Domingues, I.; Monteiro, M.; Soares, A.M.V.M.; Loureiro, S. Synergistic Effects Caused by Atrazine and Terbuthylazine on Chlorpyrifos Toxicity to Early-Life Stages of the Zebrafish Danio Rerio. Environ. Sci. Pollut. Res. 2013, 20, 4671–4680. [Google Scholar] [CrossRef] [PubMed]
Figure 1. Weighted mean of transformed combination indices of the compound pairs from all the combinations where the chemicals were present in the examined combinations at effect sizes of 10%, 20%, 50%, 80%, 90%, and 95%. The strength of synergy (blue) and antagonism (red) is shown by the width of linkage and color intensity.
Toxics 12 00189 g001
Figure 2. Comparison of transformed combination indices (from 0.5 to −0.5) of samples containing a certain compound (blue) with samples not containing it (red). Dotted lines indicate bounds between synergism (orange lines)–antagonism (green lines) assignments, while the grey band marks additivity. Transformed CI values are indicated in Table S5 in detail. (A) Tebuconazole; (B) S-metolachlor; (C) ibuprofen; (D) diclofenac; (E) carbamazepine.
Toxics 12 00189 g002
Figure 3. Comparison of transformed combination indices (from 0.5 to −0.5) of samples containing a certain compound combination (blue) with samples not containing it (red). Dotted lines indicate bounds between synergism (orange lines)–antagonism (green lines) assignments, while the grey band marks additivity. Transformed CI values are indicated in Table S5 in detail. (A) Ibuprofen and diclofenac; (B) tebuconazole and carbamazepine; (C) S-metolachlor and carbamazepine; (D) tebuconazole and S-metolachlor; (E) carbamazepine and diclofenac; (F) carbamazepine and ibuprofen; (G) diclofenac and S-metolachlor; (H) tebuconazole and diclofenac; (I) ibuprofen and S-metolachlor; (J) tebuconazole and ibuprofen; (K) tebuconazole and S-metolachlor and carbamazepine; (L) ibuprofen and diclofenac and S-metolachlor.
Toxics 12 00189 g003
Figure 4. Comparisons of the enhancement (from 100% to −100%) effect by terbuthylazine on samples containing a certain compound (blue) with other samples (red). Grey band marks less than ± 10% enhancement. (A) Ibuprofen; (B) diclofenac; (C) tebuconazole; (D) carbamazepine; (E) S-metolachlor.
Toxics 12 00189 g004
Figure 5. Comparison of enhancement effect (from 100% to −100%) by terbuthylazine on samples containing a certain compound combination (blue) with other samples. Grey band marks less than ± 10% enhancement. (A) Ibuprofen and diclofenac; (B) ibuprofen and tebuconazole; (C) diclofenac and tebuconazole; (D) ibuprofen and S-metolachlor; (E) diclofenac and S-metolachlor; (F) tebuconazole and S-metolachlor; (G) ibuprofen and carbamazepine; (H) diclofenac and carbamazepine; (I) S-metolachlor and carbamazepine.
Toxics 12 00189 g005
Table 1. Acute cytotoxicity of the test chemicals alone and in mixtures. Concentrations are expressed in mg/L resulting in 10, 20, 50, 80, 90, and 95% bioluminescence inhibition in Aliivibrio fischeri after 30 min of exposure. 1: carbamazepine, 2: diclofenac, 3: ibuprofen, 4: S-metolachlor, 5: tebuconazole, 6: terbuthylazine. n.t.—non-toxic at the applied concentration. The same table with acronyms instead of number codes can be found in the Supplementary Materials Table S2.
Effective Concentration Values at Different Effective Sizes
EC10EC20EC50EC80EC90EC95 EC10EC20EC50EC80EC90EC95
mg/L mg/L
141486520147838662 + 3 + 4482264118208
27132750771072 + 3 + 5102054144258442
32523962224712 + 3 + 624143868114
455100265715n.t.n.t.2 + 4 + 56820426698
581432741201882 + 4 + 6362282177360
6n.t.n.t.n.t.n.t.n.t.n.t.2 + 5 + 620285193132182
1 + 21216285070943 + 4 + 524301784881240
1 + 3612401202304183 + 4 + 625332266941953
1 + 41632882324086883 + 5 + 671550169345665
1 + 5243252801081364 + 5 + 63252114250394598
1 + 61836120n.t.n.t.n.t.1 + 2 + 3 + 41014306496140
2 + 324122640621 + 2 + 3 + 512183672108156
2 + 410142856841201 + 2 + 3 + 6592888174324
2 + 512183464921261 + 2 + 4 + 510163888144224
2 + 6410321022023801 + 2 + 4 + 66123499186332
3 + 4612501843968041 + 2 + 5 + 6812245078116
3 + 5816561923947601 + 3 + 4 + 5412582545981312
3 + 612181022726721 + 3 + 4 + 6144037613934661
4 + 512203664881161 + 3 + 5 + 628482948422214
4 + 630804282278605414,8961 + 4 + 5 + 6281101431641525,568
5 + 66167635085019182 + 3 + 4 + 56123070114180
1 + 2 + 346122438542 + 3 + 4 + 6262062124232
1 + 2 + 481228641001542 + 3 + 5 + 6361755107199
1 + 2 + 5203054981381902 + 4 + 5 + 6482791186360
1 + 2 + 661228621001541 + 2 + 3 + 4 + 581438100172284
1 + 3 + 4264022863016101 + 2 + 3 + 4 + 6262274150286
1 + 3 + 51020662144268021 + 2 + 3 + 5 + 648225696158
1 + 3 + 6263821860215321 + 2 + 4 + 5 + 64930106220431
1 + 4 + 534561262824547021 + 3 + 4 + 5 + 626422908862470
1 + 4 + 6315514739469911872 + 3 + 4 + 5 + 681222405678
1 + 5 + 62040168684154832881 + 2 + 3 + 4 + 5 + 62624100228482
Table 2. Combination indices for mixtures containing carbamazepine (1), diclofenac (2), ibuprofen (3), S-metolachlor (4), and tebuconazole (5) at effective concentration resulting in 10, 20, 50, 80, 90, and 95% inhibition in bioluminescence in Aliivibrio fischeri. CI values were calculated by CompuSyn software using 6 concentration–response data points (EC10, EC20, EC50, EC80, EC90, and EC95). Synergistic (CI < 0.9) and additive effects (0.9 < CI < 1.1) are indicated in bold and italics, respectively. The same table with acronyms instead of number codes can be found in the Supplementary Materials Table S3.
Combination Index Values at Different Effective Concentrations (Based on the Effective Concentration)
EC10EC20EC50EC80EC90EC95
1 + 22.141.300.750.550.480.42
1 + 32.111.671.170.750.590.48
1 + 41.961.400.710.390.300.24
1 + 54.172.421.140.620.480.37
2 + 30.610.570.520.400.350.33
2 + 40.740.670.630.600.580.55
2 + 51.511.431.241.070.980.88
3 + 41.481.271.251.111.041.00
3 + 52.392.202.182.332.522.77
4 + 50.830.840.640.480.400.33
1 + 2 + 31.110.730.400.260.230.20
1 + 2 + 41.000.690.530.500.480.49
1 + 2 + 53.172.361.531.161.010.90
1 + 3 + 40.480.580.831.061.251.47
1 + 3 + 52.752.351.991.871.912.02
1 + 4 + 54.143.012.001.591.471.43
2 + 3 + 40.830.790.670.680.720.78
2 + 3 + 52.432.402.142.122.222.37
2 + 4 + 50.540.450.510.490.480.47
3 + 4 + 50.410.380.821.522.213.20
1 + 2 + 3 + 42.131.310.780.540.450.40
1 + 2 + 3 + 52.861.971.180.830.710.64
1 + 2 + 4 + 51.240.990.840.810.820.82
1 + 3 + 4 + 50.841.091.361.752.132.62
2 + 3 + 4 + 51.121.110.920.800.760.74
1 + 2 + 3 + 4 + 51.561.251.030.950.940.95
Table 3. Enhancement on cytotoxicity by terbuthylazine at concentrations resulting in 10, 20, 50, 80, 90, and 95% bioluminescence inhibition in Aliivibrio fischeri after 30 min of exposure. Enhancement of non-toxic terbuthylazine is expressed as a percent of the required dose change of the other compounds in the mixture not containing terbuthylazine to result in the same effect size as the mixture containing it. n.e.—no enhancing effect. The same table with acronyms instead of number codes can be found in the Supplementary Materials Table S4.
EC10EC20EC50EC80EC90EC95
Toxicity enhancement by terbuthylazine (%) in the mixtures
1 + 6n.e.n.e.n.e.n.e.n.e.n.e.
2 + 6858170493411
3 + 61009080736964
4 + 686806020n.e.n.e.
5 + 6817141−18−77−155
1 + 2 + 6786756453727
1 + 3 + 685785819−16−63
1 + 4 + 6142326252423
1 + 5 + 66344−44−280−537−975
2 + 3 + 6565648352418
2 + 4 + 6888165356−33
2 + 5 + 6273133363636
3 + 4 + 68882704522−8
3 + 5 + 6615860616161
4 + 5 + 6−19−16−41−74−99−129
1 + 2 + 3 + 63018−30−107−157−237
1 + 2 + 4 + 658463213−5−21
1 + 2 + 5 + 6787875716866
1 + 3 + 4 + 66960447−24−63
1 + 3 + 5 + 689785923−11−55
1 + 4 + 5 + 6979251−185−695−1898
2 + 3 + 4 + 6725849464137
2 + 3 + 5 + 6848582797775
2 + 4 + 5 + 6644425−22−59−107
3 + 4 + 5 + 6441633424548
1 + 2 + 3 + 4 + 687735326n.e.−31
1 + 2 + 3 + 5 + 6797261504335
1 + 3 + 4 + 5 + 6686854275−20
1 + 2 + 4 + 5 + 6736649232−23
2 + 3 + 4 + 5 + 6153653636972
1 + 2 + 3 + 4 + 5 + 6837056318−18
Table 4. Permutational multivariate analyses of variance results based on Euclidean distances between chemical combination variations of carbamazepine, diclofenac, ibuprofen, S-metolachlor, and tebuconazole at effect sizes 10%, 20%, 50%, 80%, 90%, and 95% expressed in transformed combination indices. * (p = 0.01–0.05), ** (p = 0.001–0.01), *** (p = 0.0001–0.001).
PERMANOVA (999 Permutations)
dfSum SqR2F-Modelp-Value
Tebuconazole13.92890.2195017.08480.001***
Ibuprofen11.91330.106898.31980.009**
Diclofenac10.91450.051093.97680.033*
S-Metolachlor11.45740.081426.33750.009**
Carbamazepine10.80520.044983.50120.056
Tebuconazole: ibuprofen10.26680.014911.16030.335
Tebuconazole: diclofenac10.23180.012951.00820.374
Ibuprofen: diclofenac11.89060.105628.22110.006**
Tebuconazole: S-metolachlor11.07580.060114.67830.027*
Tebuconazole: carbamazepine10.19920.011130.86610.394
S-metolachlor: carbamazepine10.65470.036572.84680.072
Ibuprofen: S-metolachlor10.17900.010000.77830.464
Diclofenac: S-metolachlor10.39240.021921.70640.219
Tebuconazole: ibuprofen: diclofenac10.26950.015051.17180.339
Tebuconazole: S-metolachlor: carbamazepine11.02170.057084.44300.028*
Ibuprofen: diclofenac: S-metolachlor10.62880.035132.73450.091
Residual92.06970.11563
Total2517.89921.00000
Table 5. Permutational multivariate analyses of variance results based on dynamic time warping distances between the enhancement effect of terbuthylazine on chemical combination variations of carbamazepine, diclofenac, ibuprofen, S-metolachlor, and tebuconazole at effect sizes of 10%, 20%, 50%, 80%, 90%, and 95% expressed as a percentage of enhancement.
dfSum SqR2F-Modelp-Value
Ibuprofen152.680.0976290.49150.002**
Diclofenac164.300.11917110.45980.003**
Tebuconazole19.420.0174616.18140.009**
S-metolachlor12.210.004093.79160.112
Carbamazepine136.870.0683263.33090.001***
Ibuprofen: diclofenac174.090.13730127.27310.005**
Ibuprofen: tebuconazole123.520.0436040.41100.002**
Diclofenac: tebuconazole130.660.0568152.66220.006**
Ibuprofen: S-metolachlor15.210.009668.95480.038*
Diclofenac: S-metolachlor12.380.004424.09670.123
Tebuconazole: S-metolachlor15.880.0109010.10140.013*
Ibuprofen: carbamazepine111.540.0213919.82740.009**
Diclofenac: carbamazepine138.950.0721866.90760.002**
S-metolachlor: carbamazepine11.230.002282.11700.191
Ibuprofen: diclofenac: tebuconazole159.170.10965101.64370.003**
Ibuprofen: diclofenac: S-metolachlor13.750.006956.44370.087.
Ibuprofen: tebuconazole: S-metolachlor10.240.000440.40690.642
Diclofenac: tebuconazole: S-metolachlor11.810.003353.10900.070.
Ibuprofen: diclofenac: carbamazepine187.930.16295151.04640.001***
Ibuprofen: S-metolachlor: carbamazepine16.010.0111410.32960.033*
Diclofenac: S-metolachlor: carbamazepine16.970.0129111.96920.026*
Ibuprofen: diclofenac: S-metolachlor: carbamazepine111.290.0209219.39250.023*
Residual63.490.00647
Total28539.611.00000
* (p = 0.01–0.05), ** (p = 0.001–0.01), *** (p = 0.0001–0.001). PERMANOVA (999 Permutations).
Disclaimer/Publisher’s Note: The statements, opinions and data contained in all publications are solely those of the individual author(s) and contributor(s) and not of MDPI and/or the editor(s). MDPI and/or the editor(s) disclaim responsibility for any injury to people or property resulting from any ideas, methods, instructions or products referred to in the content.

