
The Combined Effects of Hourly Multi-Pollutant on the Risk of Ambulance Emergency Calls: A Seven-Year Time Series Study


 ,
,  ,
, 
Abstract
:1. Introduction
2. Materials and Methods
2.1. Study Participants
2.2. Outcome Ascertainment
2.3. Air Pollutant Exposure Ascertainment and Covariates
2.4. Statistical Analysis
3. Results
4. Discussion
5. Conclusions
Supplementary Materials
Author Contributions
Funding
Institutional Review Board Statement
Informed Consent Statement
Data Availability Statement
Conflicts of Interest
References
- Sun, S.; Weinberger, K.R.; Nori-Sarma, A.; Spangler, K.R.; Sun, Y.; Dominici, F.; A Wellenius, G. Ambient heat and risks of emergency department visits among adults in the United States: Time stratified case crossover study. BMJ 2021, 375, e065653. [Google Scholar] [CrossRef]
- (IHME) IfHMaE. GBD Compare Seattle, WA: IHME: University of Washington. 2020. Available online: http://vizhub.healthdata.org/gbd-compare (accessed on 4 April 2023).
- Mak, H.W.L.; Ng, D.C.Y. Spatial and Socio-Classification of Traffic Pollutant Emissions and Associated Mortality Rates in High-Density Hong Kong via Improved Data Analytic Approaches. Int. J. Environ. Res. Public Health 2021, 18, 6532. [Google Scholar] [CrossRef] [PubMed]
- Chen, K.; Schneider, A.; Cyrys, J.; Wolf, K.; Meisinger, C.; Heier, M.; von Scheidt, W.; Kuch, B.; Pitz, M.; Peters, A.; et al. Hourly Exposure to Ultrafine Particle Metrics and the Onset of Myocardial Infarction in Augsburg, Germany. Environ. Health Perspect. 2020, 128, 17003. [Google Scholar] [CrossRef] [PubMed]
- Sanyal, S.; Rochereau, T.; Maesano, C.N.; Com-Ruelle, L.; Annesi-Maesano, I. Long-Term Effect of Outdoor Air Pollution on Mortality and Morbidity: A 12-Year Follow-Up Study for Metropolitan France. Int. J. Environ. Res. Public Health 2018, 15, 2487. [Google Scholar] [CrossRef] [PubMed]
- Klompmaker, J.O.; Hart, J.E.; James, P.; Sabath, M.B.; Wu, X.; Zanobetti, A.; Dominici, F.; Laden, F. Air pollution and cardiovascular disease hospitalization—Are associations modified by greenness, temperature and humidity? Environ. Int. 2021, 156, 106715. [Google Scholar] [CrossRef] [PubMed]
- Olaniyan, T.; Pinault, L.; Li, C.; van Donkelaar, A.; Meng, J.; Martin, R.V.; Hystad, P.; Robichaud, A.; Ménard, R.; Tjepkema, M.; et al. Ambient air pollution and the risk of acute myocardial infarction and stroke: A national cohort study. Environ. Res. 2022, 204 Pt A, 111975. [Google Scholar] [CrossRef] [PubMed]
- Chen, T.-T.; Zhan, Z.-Y.; Yu, Y.-M.; Xu, L.-J.; Guan, Y.; Ou, C.-Q. Effects of hourly levels of ambient air pollution on ambulance emergency call-outs in Shenzhen, China. Environ. Sci. Pollut. Res. 2020, 27, 24880–24888. [Google Scholar] [CrossRef]
- Ai, S.; Wang, C.; Qian, Z.; Cui, Y.; Liu, Y.; Acharya, B.K.; Sun, X.; Hinyard, L.; Jansson, D.R.; Qin, L.; et al. Hourly associations between ambient air pollution and emergency ambulance calls in one central Chinese city: Implications for hourly air quality standards. Sci. Total Environ. 2019, 696, 133956. [Google Scholar] [CrossRef]
- Yao, J.; Brauer, M.; Wei, J.; McGrail, K.M.; Johnston, F.H.; Henderson, S.B. Sub-Daily Exposure to Fine Particulate Matter and Ambulance Dispatches during Wildfire Seasons: A Case-Crossover Study in British Columbia, Canada. Environ. Health Perspect. 2020, 128, 67006. [Google Scholar] [CrossRef]
- Ichiki, T.; Onozuka, D.; Kamouchi, M.; Hagihara, A. An association between fine particulate matter (PM(2.5)) levels and emergency ambulance dispatches for cardiovascular diseases in Japan. Int. Arch. Occup. Environ. Health 2016, 89, 1329–1335. [Google Scholar] [CrossRef]
- Straney, L.; Finn, J.; Dennekamp, M.; Bremner, A.; Tonkin, A.; Jacobs, I. Evaluating the impact of air pollution on the incidence of out-of-hospital cardiac arrest in the Perth Metropolitan Region: 2000–2010. J. Epidemiol. Community Health 2014, 68, 6–12. [Google Scholar] [CrossRef] [PubMed]
- Chen, R.; Jiang, Y.; Hu, J.; Chen, H.; Li, H.; Meng, X.; Ji, J.S.; Gao, Y.; Wang, W.; Liu, C.; et al. Hourly Air Pollutants and Acute Coronary Syndrome Onset in 1.29 Million Patients. Circulation 2022, 145, 1749–1760. [Google Scholar] [CrossRef] [PubMed]
- Nirel, R.; Adar, S.D.; Dayan, U.; Vakulenko-Lagun, B.; Golovner, M.; Levy, I.; Alon, Z.; Peretz, A. Fine and Coarse Particulate Matter Exposures and Associations with Acute Cardiac Events among Participants in a Telemedicine Service: A Case-Crossover Study. Environ. Health Perspect. 2018, 126, 97003. [Google Scholar] [CrossRef] [PubMed]
- Liu, C.; Chen, R.; Sera, F.; Vicedo-Cabrera, A.M.; Guo, Y.; Tong, S.; Coelho, M.S.Z.S.; Saldiva, P.H.N.; Lavigne, E.; Matus, P.; et al. Ambient Particulate Air Pollution and Daily Mortality in 652 Cities. N. Engl. J. Med. 2019, 381, 705–715. [Google Scholar] [CrossRef] [PubMed]
- Bhaskaran, K.; Hajat, S.; Armstrong, B.; Haines, A.; Herrett, E.; Wilkinson, P.; Smeeth, L. The effects of hourly differences in air pollution on the risk of myocardial infarction: Case crossover analysis of the MINAP database. BMJ 2011, 343, d5531. [Google Scholar] [CrossRef]
- Peters, A.; Dockery, D.W.; Muller, J.E.; Mittleman, M.A. Increased particulate air pollution and the triggering of myocardial infarction. Circulation 2001, 103, 2810–2815. [Google Scholar] [CrossRef]
- Keil, A.P.; Buckley, J.P.; O’brien, K.M.; Ferguson, K.K.; Zhao, S.; White, A.J. A Quantile-Based g-Computation Approach to Addressing the Effects of Exposure Mixtures. Environ. Health Perspect. 2020, 128, 47004. [Google Scholar] [CrossRef]
- Tung, P.W.; Burt, A.; Karagas, M.; Jackson, B.P.; Punshon, T.; Lester, B.; Marsit, C.J. Prenatal exposure to metal mixtures and newborn neurobehavior in the Rhode Island Child Health Study. Environ. Epidemiol. 2022, 6, e194. [Google Scholar] [CrossRef]
- Niehoff, N.M.; Keil, A.P.; O’Brien, K.M.; Jackson, B.P.; Karagas, M.R.; Weinberg, C.R.; White, A.J. Metals and trace elements in relation to body mass index in a prospective study of US women. Environ. Res. 2020, 184, 109396. [Google Scholar] [CrossRef]
- Liu, R.; Zeng, J.; Jiang, X.; Chen, J.; Gao, X.; Zhang, L.; Li, T. The relationship between airborne fine particle matter and emergency ambulance dispatches in a southwestern city in Chengdu, China. Environ. Pollut. 2017, 229, 661–667. [Google Scholar] [CrossRef]
- Rao, X.; Zhong, J.; Brook, R.D.; Rajagopalan, S.; Münzel, T.; Sørensen, M.; Schmidt, F.; Schmidt, E.; Steven, S.; Kröller-Schön, S.; et al. Effect of Particulate Matter Air Pollution on Cardiovascular Oxidative Stress Pathways. Antioxid. Redox Signal. 2018, 28, 797–818. [Google Scholar] [CrossRef] [PubMed]
- Nirel, R.; Levy, I.; Adar, S.D.; Vakulenko-Lagun, B.; Peretz, A.; Golovner, M.; Dayan, U. Concentration-response relationships between hourly particulate matter and ischemic events: A case-crossover analysis of effect modification by season and air-mass origin. Sci. Total Environ. 2021, 760, 143407. [Google Scholar] [CrossRef] [PubMed]
- Liang, Z.; You, C.; Zhang, X.; Wang, X.; Xiao, D.; He, S.; Wu, F.; Meng, Q. Three exposure metrics of size-specific particulate matter associated with acute lower respiratory infection hospitalization in children: A multi-city time-series analysis in China. Sci. Total Environ. 2022, 816, 151636. [Google Scholar] [CrossRef] [PubMed]
- Amini, H.; Dehlendorff, C.; Lim, Y.-H.; Mehta, A.; Jørgensen, J.T.; Mortensen, L.H.; Westendorp, R.; Hoffmann, B.; Loft, S.; Cole-Hunter, T.; et al. Long-term exposure to air pollution and stroke incidence: A Danish Nurse cohort study. Environ. Int. 2020, 142, 105891. [Google Scholar] [CrossRef] [PubMed]
- Avellaneda-Gómez, C.; Vivanco-Hidalgo, R.; Olmos, S.; Lazcano, U.; Valentin, A.; Milà, C.; Ambrós, A.; Roquer, J.; Tonne, C. Air pollution and surrounding greenness in relation to ischemic stroke: A population-based cohort study. Environ. Int. 2022, 161, 107147. [Google Scholar] [CrossRef]
- Li, T.; Yu, Z.; Xu, L.; Wu, Y.; Yu, L.; Yang, Z.; Shen, P.; Lin, H.; Shui, L.; Tang, M.; et al. Residential greenness, air pollution, and incident ischemic heart disease: A prospective cohort study in China. Sci. Total Environ. 2022, 838 Pt 1, 155881. [Google Scholar] [CrossRef]
- Hystad, P.; Larkin, A.; Rangarajan, S.; AlHabib, K.F.; Avezum, A.; Calik, K.B.T.; Chifamba, J.; Dans, A.; Diaz, R.; du Plessis, J.L.; et al. Associations of outdoor fine particulate air pollution and cardiovascular disease in 157 436 individuals from 21 high-income, middle-income, and low-income countries (PURE): A prospective cohort study. Lancet Planet. Health 2020, 4, e235–e245. [Google Scholar] [CrossRef]
- Li, R.; Hou, J.; Tu, R.; Liu, X.; Zuo, T.; Dong, X.; Pan, M.; Yin, S.; Hu, K.; Mao, Z.; et al. Associations of mixture of air pollutants with estimated 10-year atherosclerotic cardiovascular disease risk modified by socio-economic status: The Henan Rural Cohort Study. Sci. Total Environ. 2021, 793, 148542. [Google Scholar] [CrossRef]
- Wen, F.; Li, B.; Cao, H.; Li, P.; Xie, Y.; Zhang, F.; Sun, Y.; Zhang, L. Association of long-term exposure to air pollutant mixture and incident cardiovascular disease in a highly polluted region of China. Environ. Pollut. 2023, 328, 121647. [Google Scholar] [CrossRef]
- Fiordelisi, A.; Piscitelli, P.; Trimarco, B.; Coscioni, E.; Iaccarino, G.; Sorriento, D. The mechanisms of air pollution and particulate matter in cardiovascular diseases. Heart Fail. Rev. 2017, 22, 337–347. [Google Scholar] [CrossRef]
- Rajagopalan, S.; Al-Kindi, S.G.; Brook, R.D. Air Pollution and Cardiovascular Disease: JACC State-of-the-Art Review. J. Am. Coll. Cardiol. 2018, 72, 2054–2070. [Google Scholar] [CrossRef] [PubMed]
- Shi, D.; Liu, Z.; Fu, J.; Yu, H. The impact of drivers’ short-term exposure to air pollution on traffic deaths. Environ. Sci. Pollut. Res. 2022, 29, 61323–61333. [Google Scholar] [CrossRef] [PubMed]
- Li, J.; Liu, C.; Cheng, Y.; Guo, S.; Sun, Q.; Kan, L.; Chen, R.; Kan, H.; Bai, H.; Cao, J. Association between ambient particulate matter air pollution and ST-elevation myocardial infarction: A case-crossover study in a Chinese city. Chemosphere 2019, 219, 724–729. [Google Scholar] [CrossRef] [PubMed]
- Conti, S.; Harari, S.; Caminati, A.; Zanobetti, A.; Schwartz, J.D.; Bertazzi, P.A.; Cesana, G.; Madotto, F. The association between air pollution and the incidence of idiopathic pulmonary fibrosis in Northern Italy. Eur. Respir. J. 2018, 51, 1700397. [Google Scholar] [CrossRef]
- Shin, H.H.; Maquiling, A.; Thomson, E.M.; Park, I.-W.; Stieb, D.M.; Dehghani, P. Sex-difference in air pollution-related acute circulatory and respiratory mortality and hospitalization. Sci. Total Environ. 2022, 806 Pt 3, 150515. [Google Scholar] [CrossRef]
- Clawson, J.J.; Dernocoeu, K.; Murray, C. Principles of Emergency Medical Dispatch, 6th ed.; National Academy of EMD: Salt Lake City, UT, USA, 2015. [Google Scholar]


| All | Vascular Disease | Respiratory Disease | Reproductive Illness | Injury | Others a | |
|---|---|---|---|---|---|---|
| Cases | 3,022,164 | 636,288 | 137,960 | 208,408 | 1,324,656 | 714,852 |
| Age, years | ||||||
| Less than 20 | 185,152 (6.1) | 35,412 (5.6) | 19,836 (14.4) | 8172 (3.9) | 84,764 (6.4) | 36,968 (5.2) |
| 20 to 64 | 2,462,968 (81.5) | 437,064 (68.7) | 68,252 (49.5) | 193,904 (93.0) | 1,130,360 (85.3) | 633,388 (88.6) |
| Equal or more than 65 | 373,884 (12.4) | 163,796 (25.7) | 49,852 (36.1) | 6304 (3.1) | 109,464 (8.3) | 44,468 (6.2) |
| Sex | ||||||
| Male | 1,942,832 (64.3) | 372,092 (58.5) | 80,760 (58.5) | 46,016 (22.1) | 920,836 (69.5) | 523,128 (73.2) |
| Female | 1,079,256 (35.7) | 264,188 (41.5) | 57,196 (41.5) | 162,380 (77.9) | 403,780 (30.5) | 191,712 (26.8) |
| Cases by year | ||||||
| 2013 | 355,816 (11.8) | 70,340 (11.1) | 15,172 (11.0) | 26,784 (12.9) | 168,940 (12.8) | 74,580 (10.4) |
| 2014 | 385,232 (12.7) | 76,648 (12.0) | 15,804 (11.5) | 29,292 (14.1) | 179,432 (13.5) | 84,056 (11.8) |
| 2015 | 399,756 (13.2) | 83,152 (13.0) | 16,760 (12.1) | 26,704 (12.8) | 185,484 (14.0) | 87,656 (12.3) |
| 2016 | 429,948 (14.2) | 90,872 (14.3) | 19,704 (14.3) | 30,792 (14.7) | 192,880 (14.6) | 95,700 (13.4) |
| 2017 | 465,060 (15.4) | 96,648 (15.2) | 20,748 (15.0) | 31,232 (15.0) | 204,800 (15.5) | 111,632 (15.6) |
| 2018 | 475,104 (15.7) | 102,792 (16.2) | 22,464 (16.3) | 31,248 (15.0) | 196,036 (14.7) | 122,564 (17.1) |
| 2019 | 511,248 (17.0) | 115,836 (18.2) | 27,308 (19.8) | 32,356 (15.5) | 197,084 (14.9) | 138,664 (19.4) |
| Time of day b | ||||||
| Daytime | 1,553,480 (51.4) | 381,668 (60.0) | 77,084 (55.9) | 79,484 (38.1) | 711,324 (53.7) | 219,124 (30.7) |
| Nighttime | 1,468,684 (48.6) | 254,620 (40.0) | 60,876 (44.1) | 128,924 (61.9) | 613,332 (46.3) | 495,728 (69.3) |
| Pollutants, μg/m3 | ||||||
| PM2.5 | 30.1 ± 18.7 | 30.0 ± 18.6 | 29.4 ± 18.5 | 29.5 ± 18.4 | 29.7 ± 18.4 | 29.9 ± 18.5 |
| PM10 | 49.3 ± 27.1 | 49.2 ± 27.1 | 48.5 ± 26.9 | 48.5 ± 26.7 | 48.9 ± 26.6 | 49.2 ± 27.0 |
| Ozone | 60.5 ± 24.6 | 60.6 ± 24.7 | 60.4 ± 24.9 | 60.4 ± 24.9 | 60.4 ± 24.8 | 60.6 ± 24.8 |
| NO2 | 32.0 ± 12.4 | 31.9 ± 12.3 | 31.7 ± 12.4 | 31.6 ± 12.2 | 32.0 ± 12.4 | 31.9 ± 12.3 |
| SO2 | 19.7 ± 10.0 | 19.7 ± 10.0 | 19.3 ± 9.9 | 19.3 ± 9.8 | 19.6 ± 9.9 | 19.6 ± 9.9 |
| Meteorology | ||||||
| Temperature, °C | 23.4 ± 5.8 | 23.5 ± 5.8 | 23.6 ± 5.8 | 23.5 ± 5.8 | 23.9 ± 5.7 | 23.4 ± 5.8 |
| Relative humidity, % | 69.8 ± 14.9 | 69.4 ± 14.9 | 69.2 ± 14.7 | 71.0 ± 14.4 | 68.8 ± 14.9 | 70.1 ± 14.7 |
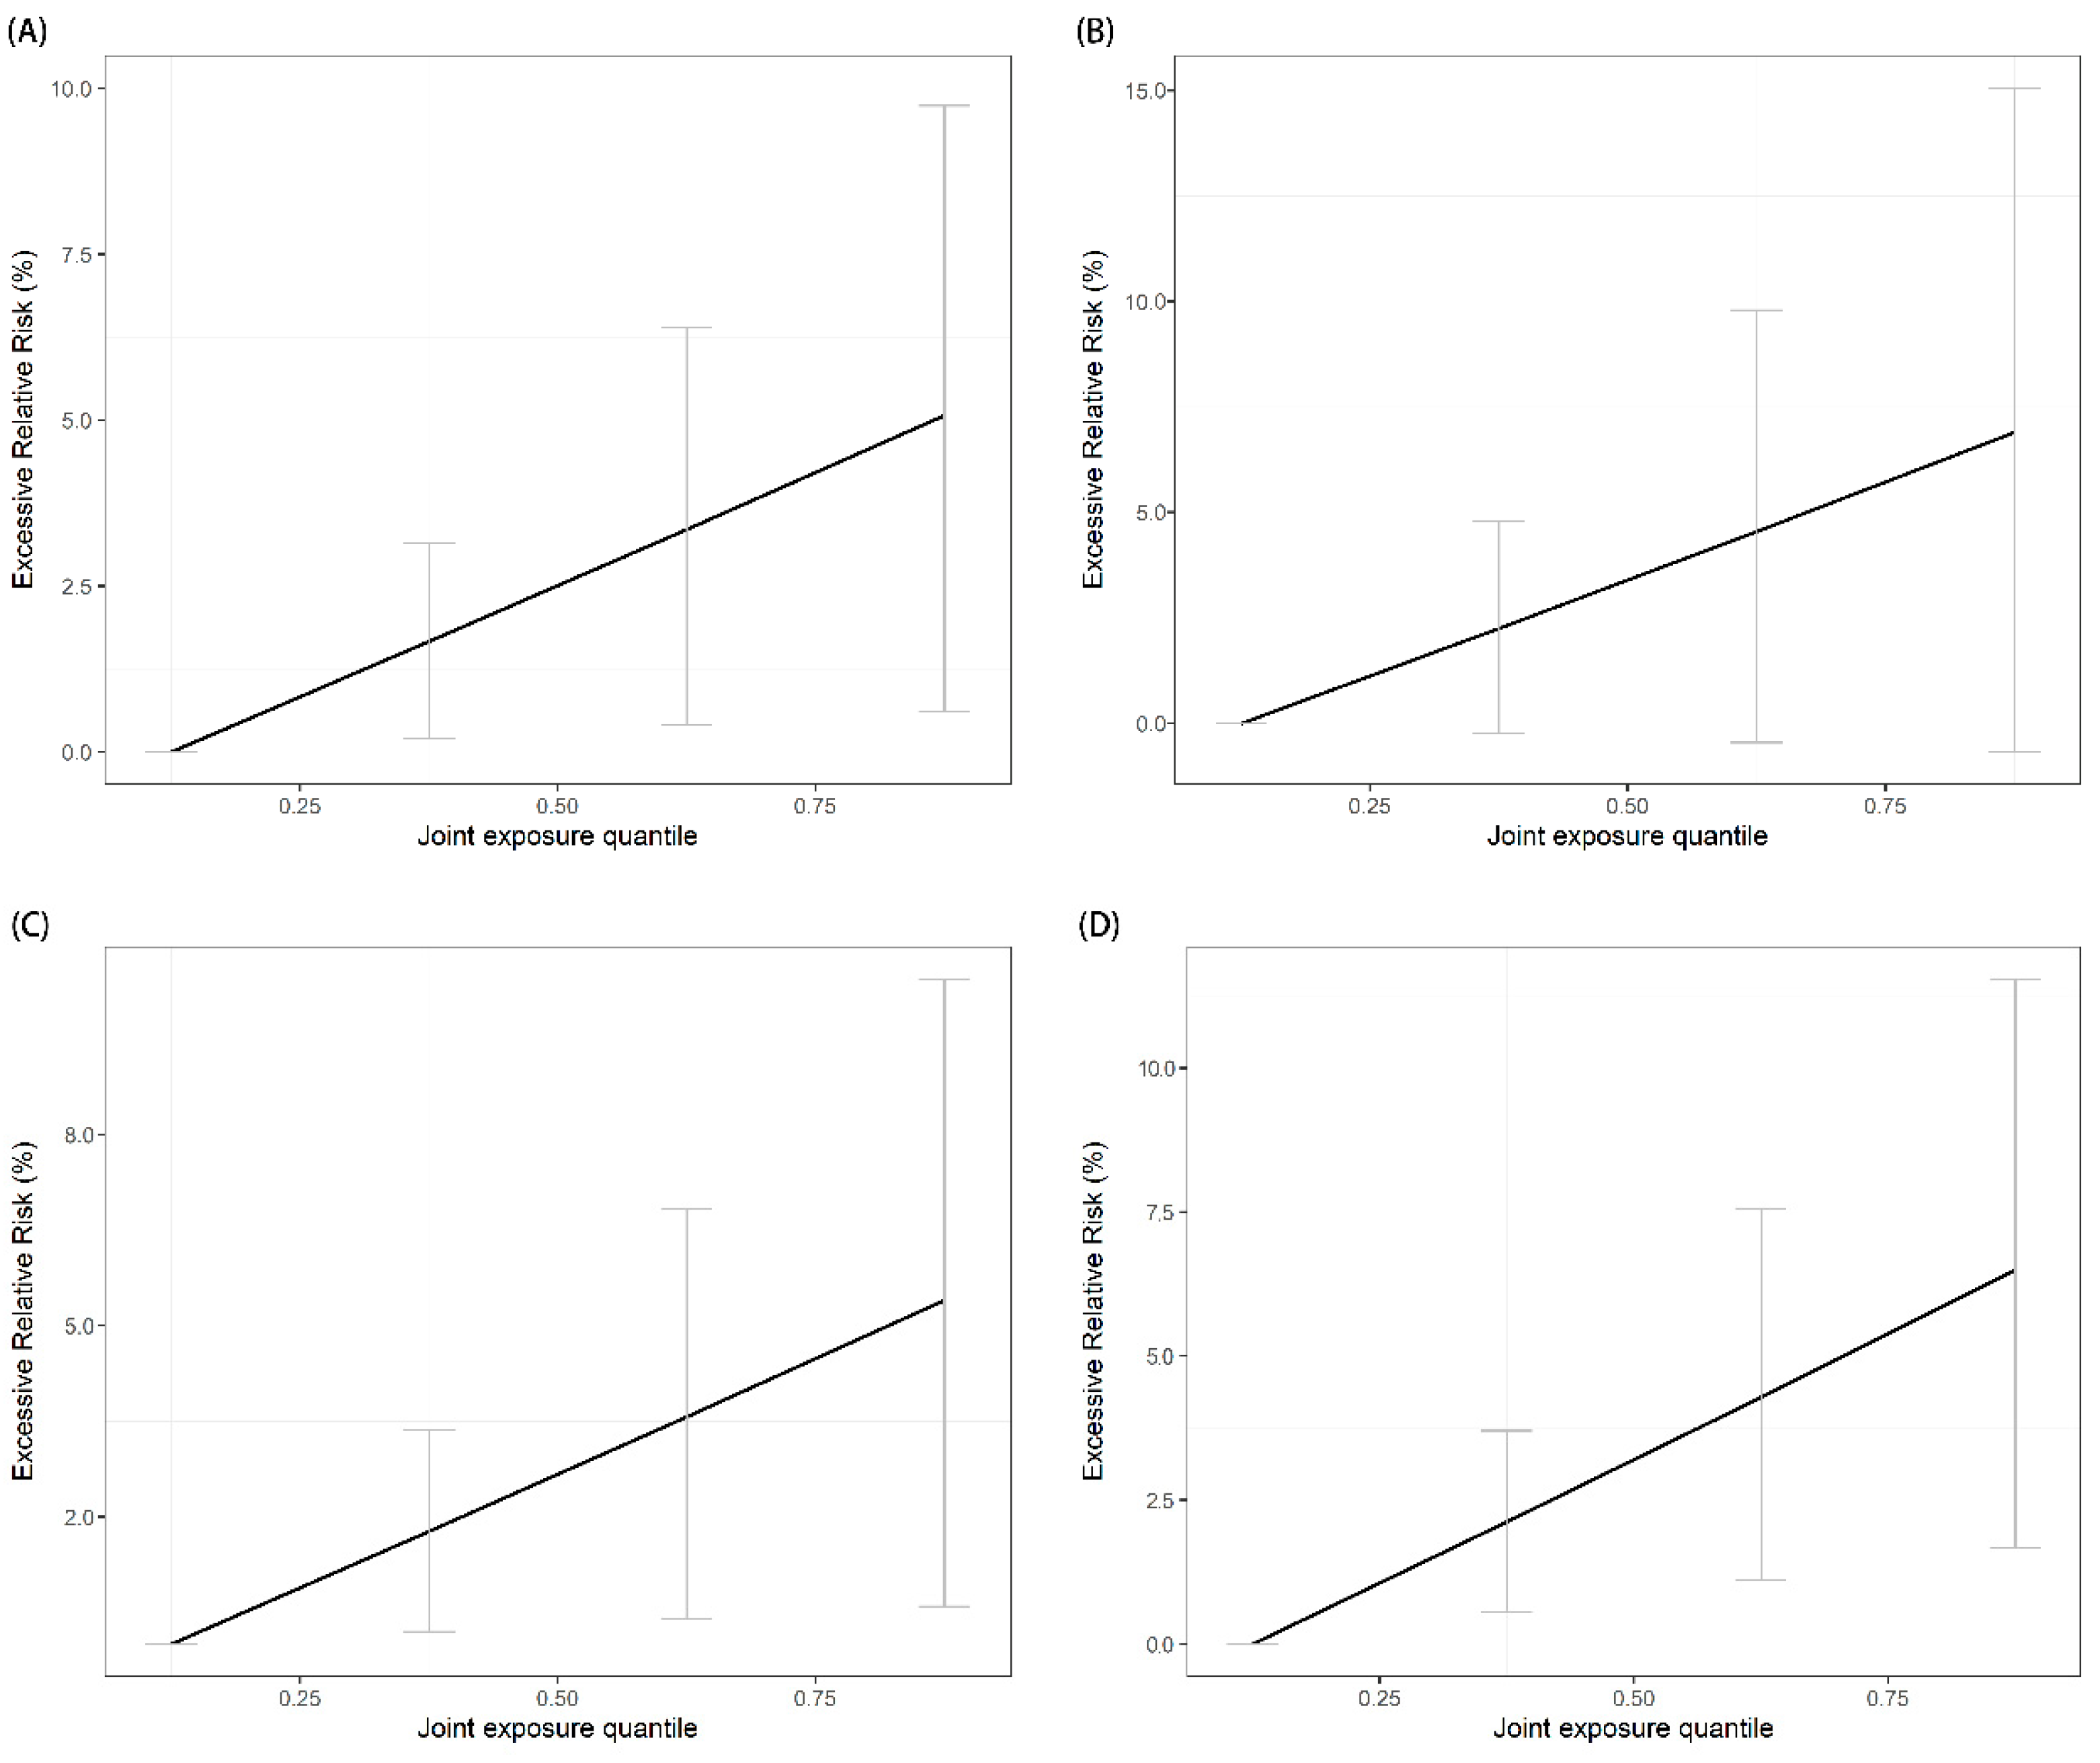
| Ambulance Emergency Calls | Effect of Mixtures ψ (log RR, %) | ERR (%) | 95% CI (%) | p-Value |
|---|---|---|---|---|
| All-cause | 1.65 | 1.67 | (0.12, 3.22) | 0.03 |
| Vascular disease | 1.79 | 1.81 | (0.25, 3.39) | 0.02 |
| Respiratory disease | 2.22 | 2.25 | (−0.15, 4.70) | 0.07 |
| Reproductive illness | 1.75 | 1.77 | (0.44, 3.11) | 0.008 |
| Injury | 2.10 | 2.12 | (0.56, 3.71) | 0.008 |
| Subgroups | All-Cause | Vascular Disease | Respiratory Disease | Reproductive Illness | Injury |
|---|---|---|---|---|---|
| ERR, % (95% CI, %) | ERR, % (95% CI, %) | ERR, % (95% CI, %) | ERR, % (95% CI, %) | ERR, % (95% CI, %) | |
| Sex | |||||
| Male | 1.62 (0.36, 2.87) | 1.74 (−0.23, 3.72) | 2.13 (−0.51, 4.78) | - | 1.96 (−1.42, 5.31) |
| Female | 1.63 (0.16, 3.11) | 1.75 (0.20, 3.31) | 2.14 (1.31, 2.92) | 1.79 (−0.84, 4.17) | 2.02 (−0.81, 4.69) |
| Age group, years | |||||
| Less than 20 | 1.61 (0.79, 2.42) | - | 2.14 (0.00, 4.14) | 1.79 (−0.47, 4.05) | 1.92 (−1.30, 5.15) |
| 20 to 64 | 1.61 (0.0, 3.30) | 1.77 (0.00, 3.51) | 2.12 (−0.11, 4.38) | 1.77 (−1.33, 4.91) | 1.90 (−2.80, 6.78) |
| Equal or more than 65 | 1.89 (0.17, 3.62) | 1.87 (0.00, 3.82) | 2.23 (−0.74, 5.16) | - | 1.99 (0.02, 3.61) |
| Season | |||||
| Warm | 3.06 (1.44, 4.58) | 3.16 (1.00, 5.33) | 3.03 (0.75, 5.20) | 2.99 (0.42, 5.55) | 3.83 (0.72, 6.91) |
| Cool | 0.91 (−1.36, 3.22) | 1.29 (−0.81, 3.39) | 1.57 (−0.50, 3.62) | 0.92 (−1.85, 3.68) | 1.38 (−3.70, 6.35) |
| Time of day | |||||
| Daytime | 1.84 (−0.31, 3.98) | 2.00 (0.42, 3.56) | 2.53 (0.81, 4.26) | 2.21 (−0.81, 5.23) | 1.92 (−1.62, 5.40) |
| Nighttime | 1.41 (−0.27, 3.10) | 1.48 (−1.03, 3.99) | 1.91 (−1.64, 5.47) | 1.56 (−1.52, 4.65) | 2.55 (−1.70, 6.72) |
Disclaimer/Publisher’s Note: The statements, opinions and data contained in all publications are solely those of the individual author(s) and contributor(s) and not of MDPI and/or the editor(s). MDPI and/or the editor(s) disclaim responsibility for any injury to people or property resulting from any ideas, methods, instructions or products referred to in the content. |
© 2023 by the authors. Licensee MDPI, Basel, Switzerland. This article is an open access article distributed under the terms and conditions of the Creative Commons Attribution (CC BY) license (https://creativecommons.org/licenses/by/4.0/).
Share and Cite
Shi, H.; Zhou, Q.; Zhang, H.; Sun, S.; Zhao, J.; Wang, Y.; Huang, J.; Jin, Y.; Zheng, Z.; Wu, R.; et al. The Combined Effects of Hourly Multi-Pollutant on the Risk of Ambulance Emergency Calls: A Seven-Year Time Series Study. Toxics 2023, 11, 895. https://doi.org/10.3390/toxics11110895
Shi H, Zhou Q, Zhang H, Sun S, Zhao J, Wang Y, Huang J, Jin Y, Zheng Z, Wu R, et al. The Combined Effects of Hourly Multi-Pollutant on the Risk of Ambulance Emergency Calls: A Seven-Year Time Series Study. Toxics. 2023; 11(11):895. https://doi.org/10.3390/toxics11110895
Chicago/Turabian StyleShi, Hanxu, Qiang Zhou, Hongjuan Zhang, Shengzhi Sun, Junfeng Zhao, Yasha Wang, Jie Huang, Yinzi Jin, Zhijie Zheng, Rengyu Wu, and et al. 2023. "The Combined Effects of Hourly Multi-Pollutant on the Risk of Ambulance Emergency Calls: A Seven-Year Time Series Study" Toxics 11, no. 11: 895. https://doi.org/10.3390/toxics11110895
APA StyleShi, H., Zhou, Q., Zhang, H., Sun, S., Zhao, J., Wang, Y., Huang, J., Jin, Y., Zheng, Z., Wu, R., & Zhang, Z. (2023). The Combined Effects of Hourly Multi-Pollutant on the Risk of Ambulance Emergency Calls: A Seven-Year Time Series Study. Toxics, 11(11), 895. https://doi.org/10.3390/toxics11110895