
Time Patterns in Internal Human Exposure Data to Bisphenols, Phthalates, DINCH, Organophosphate Flame Retardants, Cadmium and Polyaromatic Hydrocarbons in Europe

 , , ,
, , ,  , ,
, ,  , ,
, ,  , ,
, ,  , , , ,
  , , , , , , , , , , , , , , , ,
  , , ,
, , ,  and
and 
Abstract
:1. Introduction
2. Materials and Methods
2.1. Study Design and Study Population
2.2. Exposure Analysis
2.3. Statistical Methods
3. Results and Discussion
3.1. Time Patterns Observed in Children (5–12 Years) in Europe
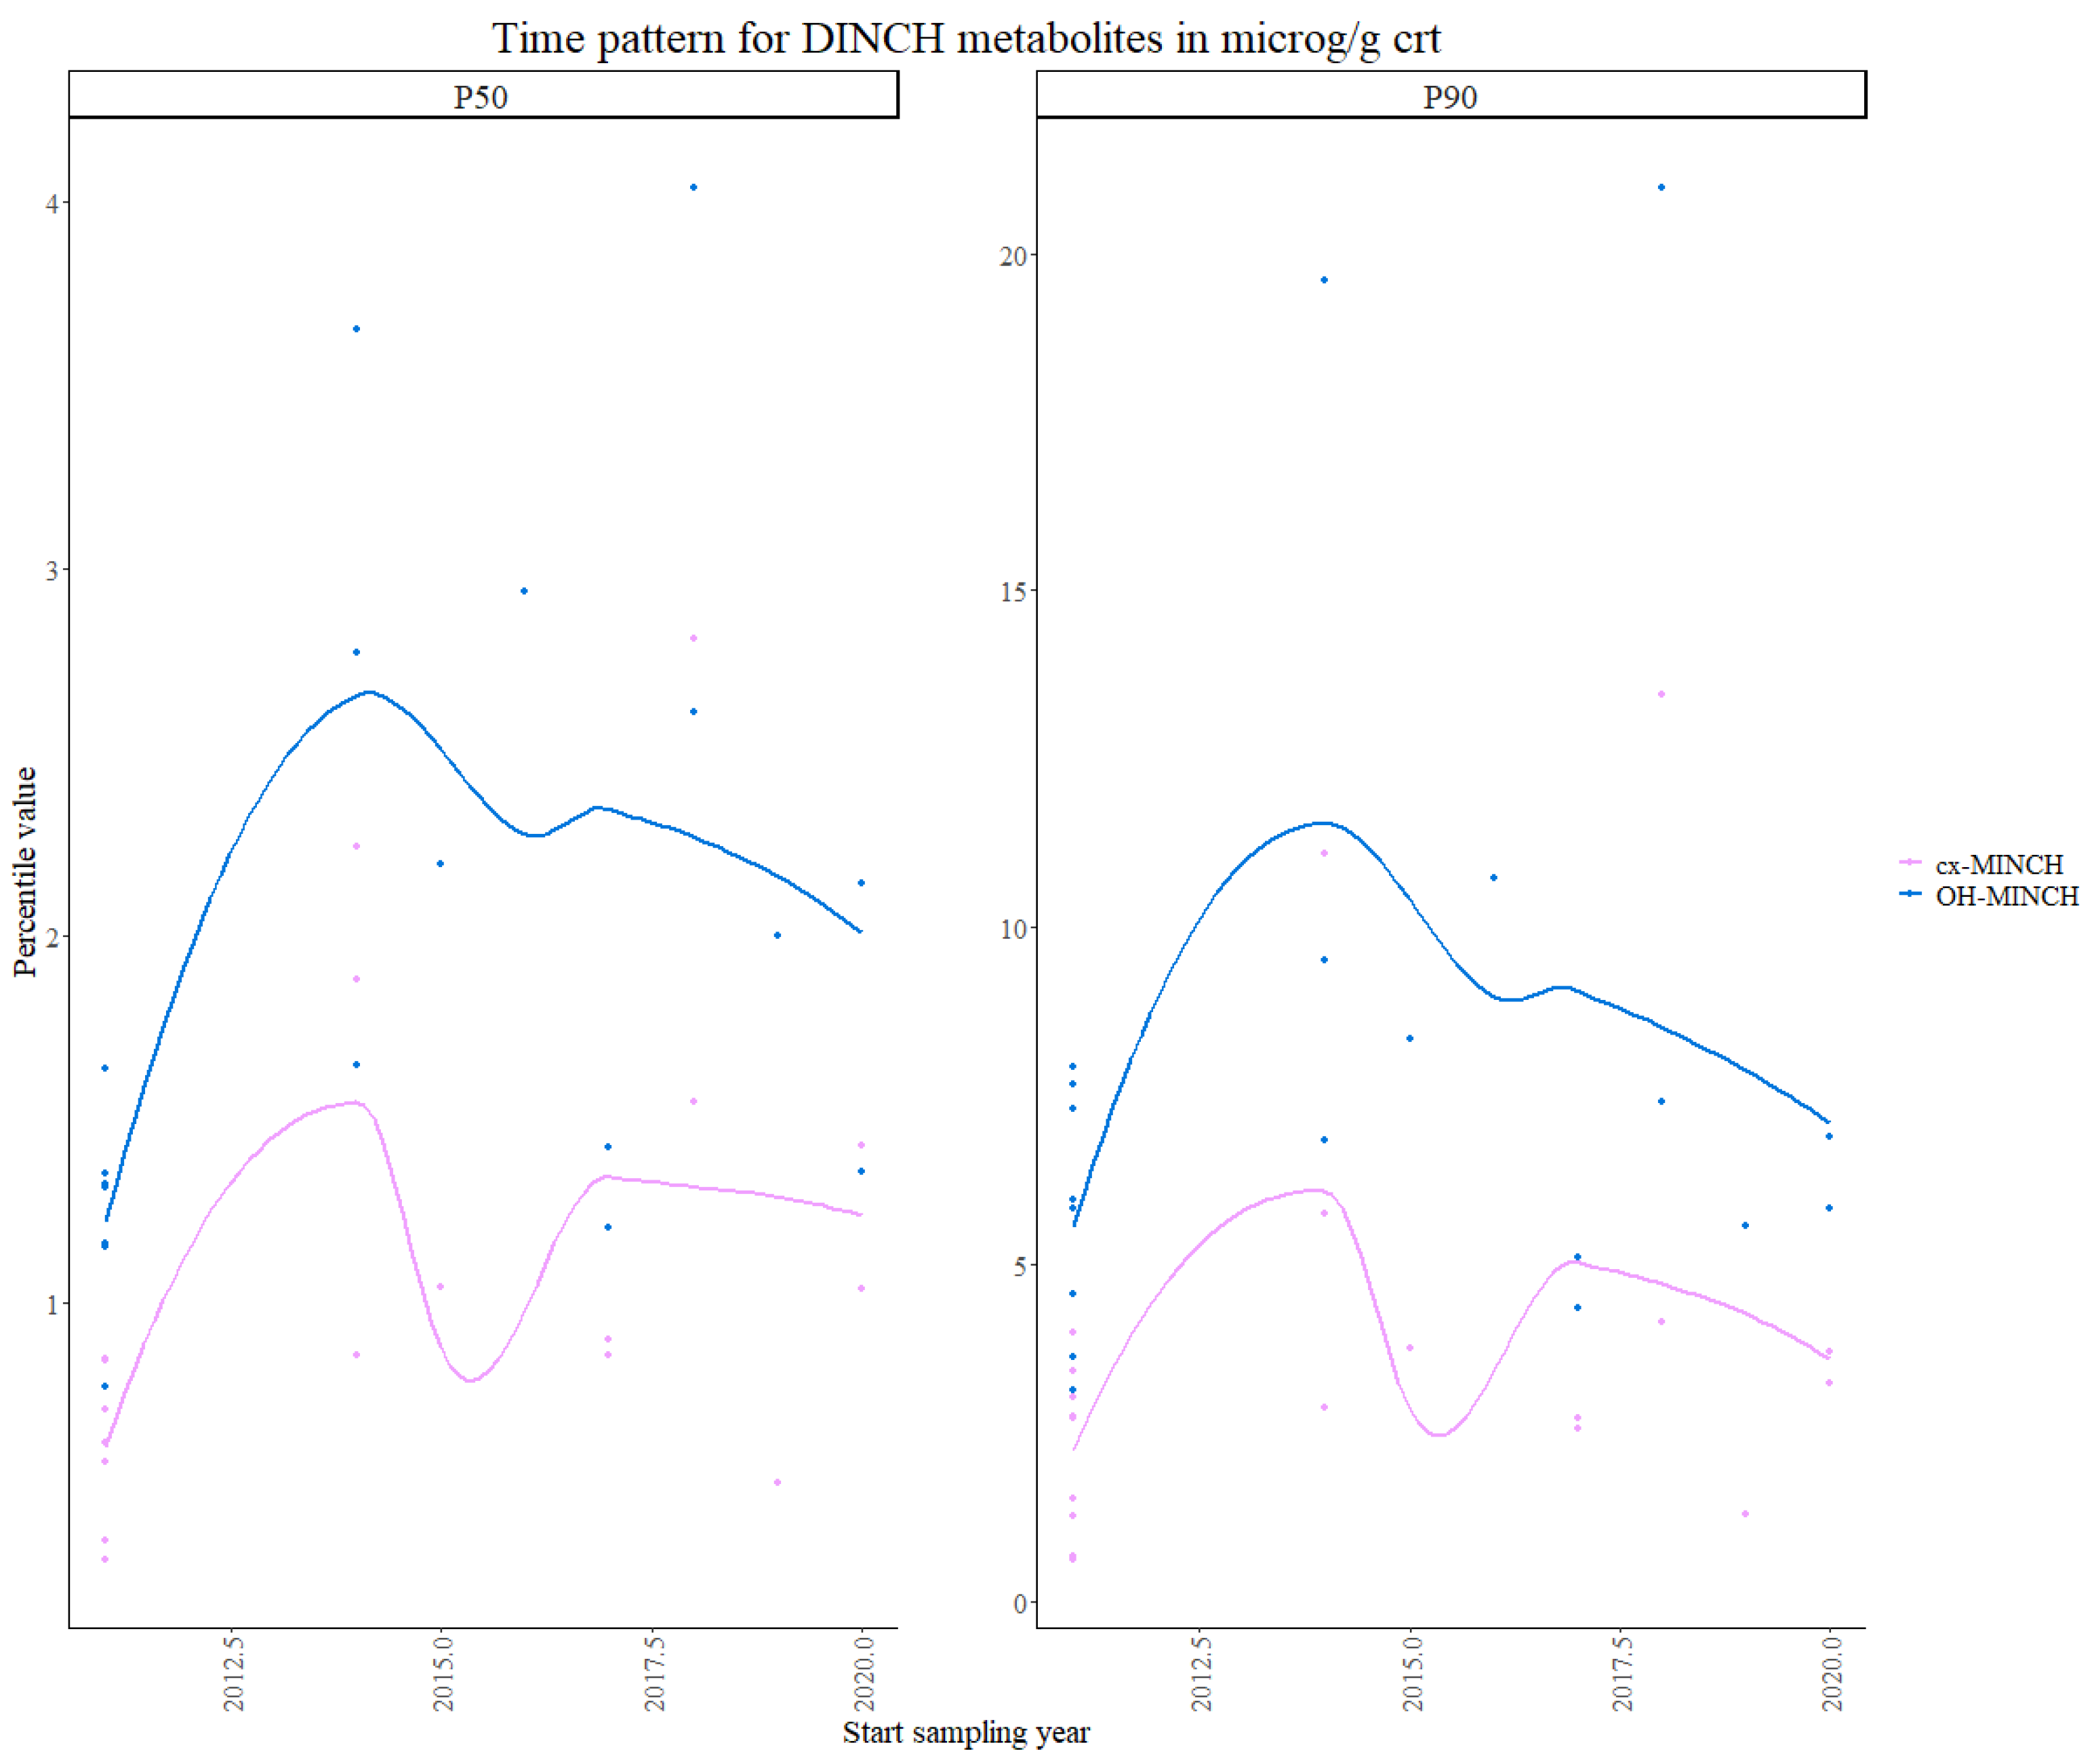
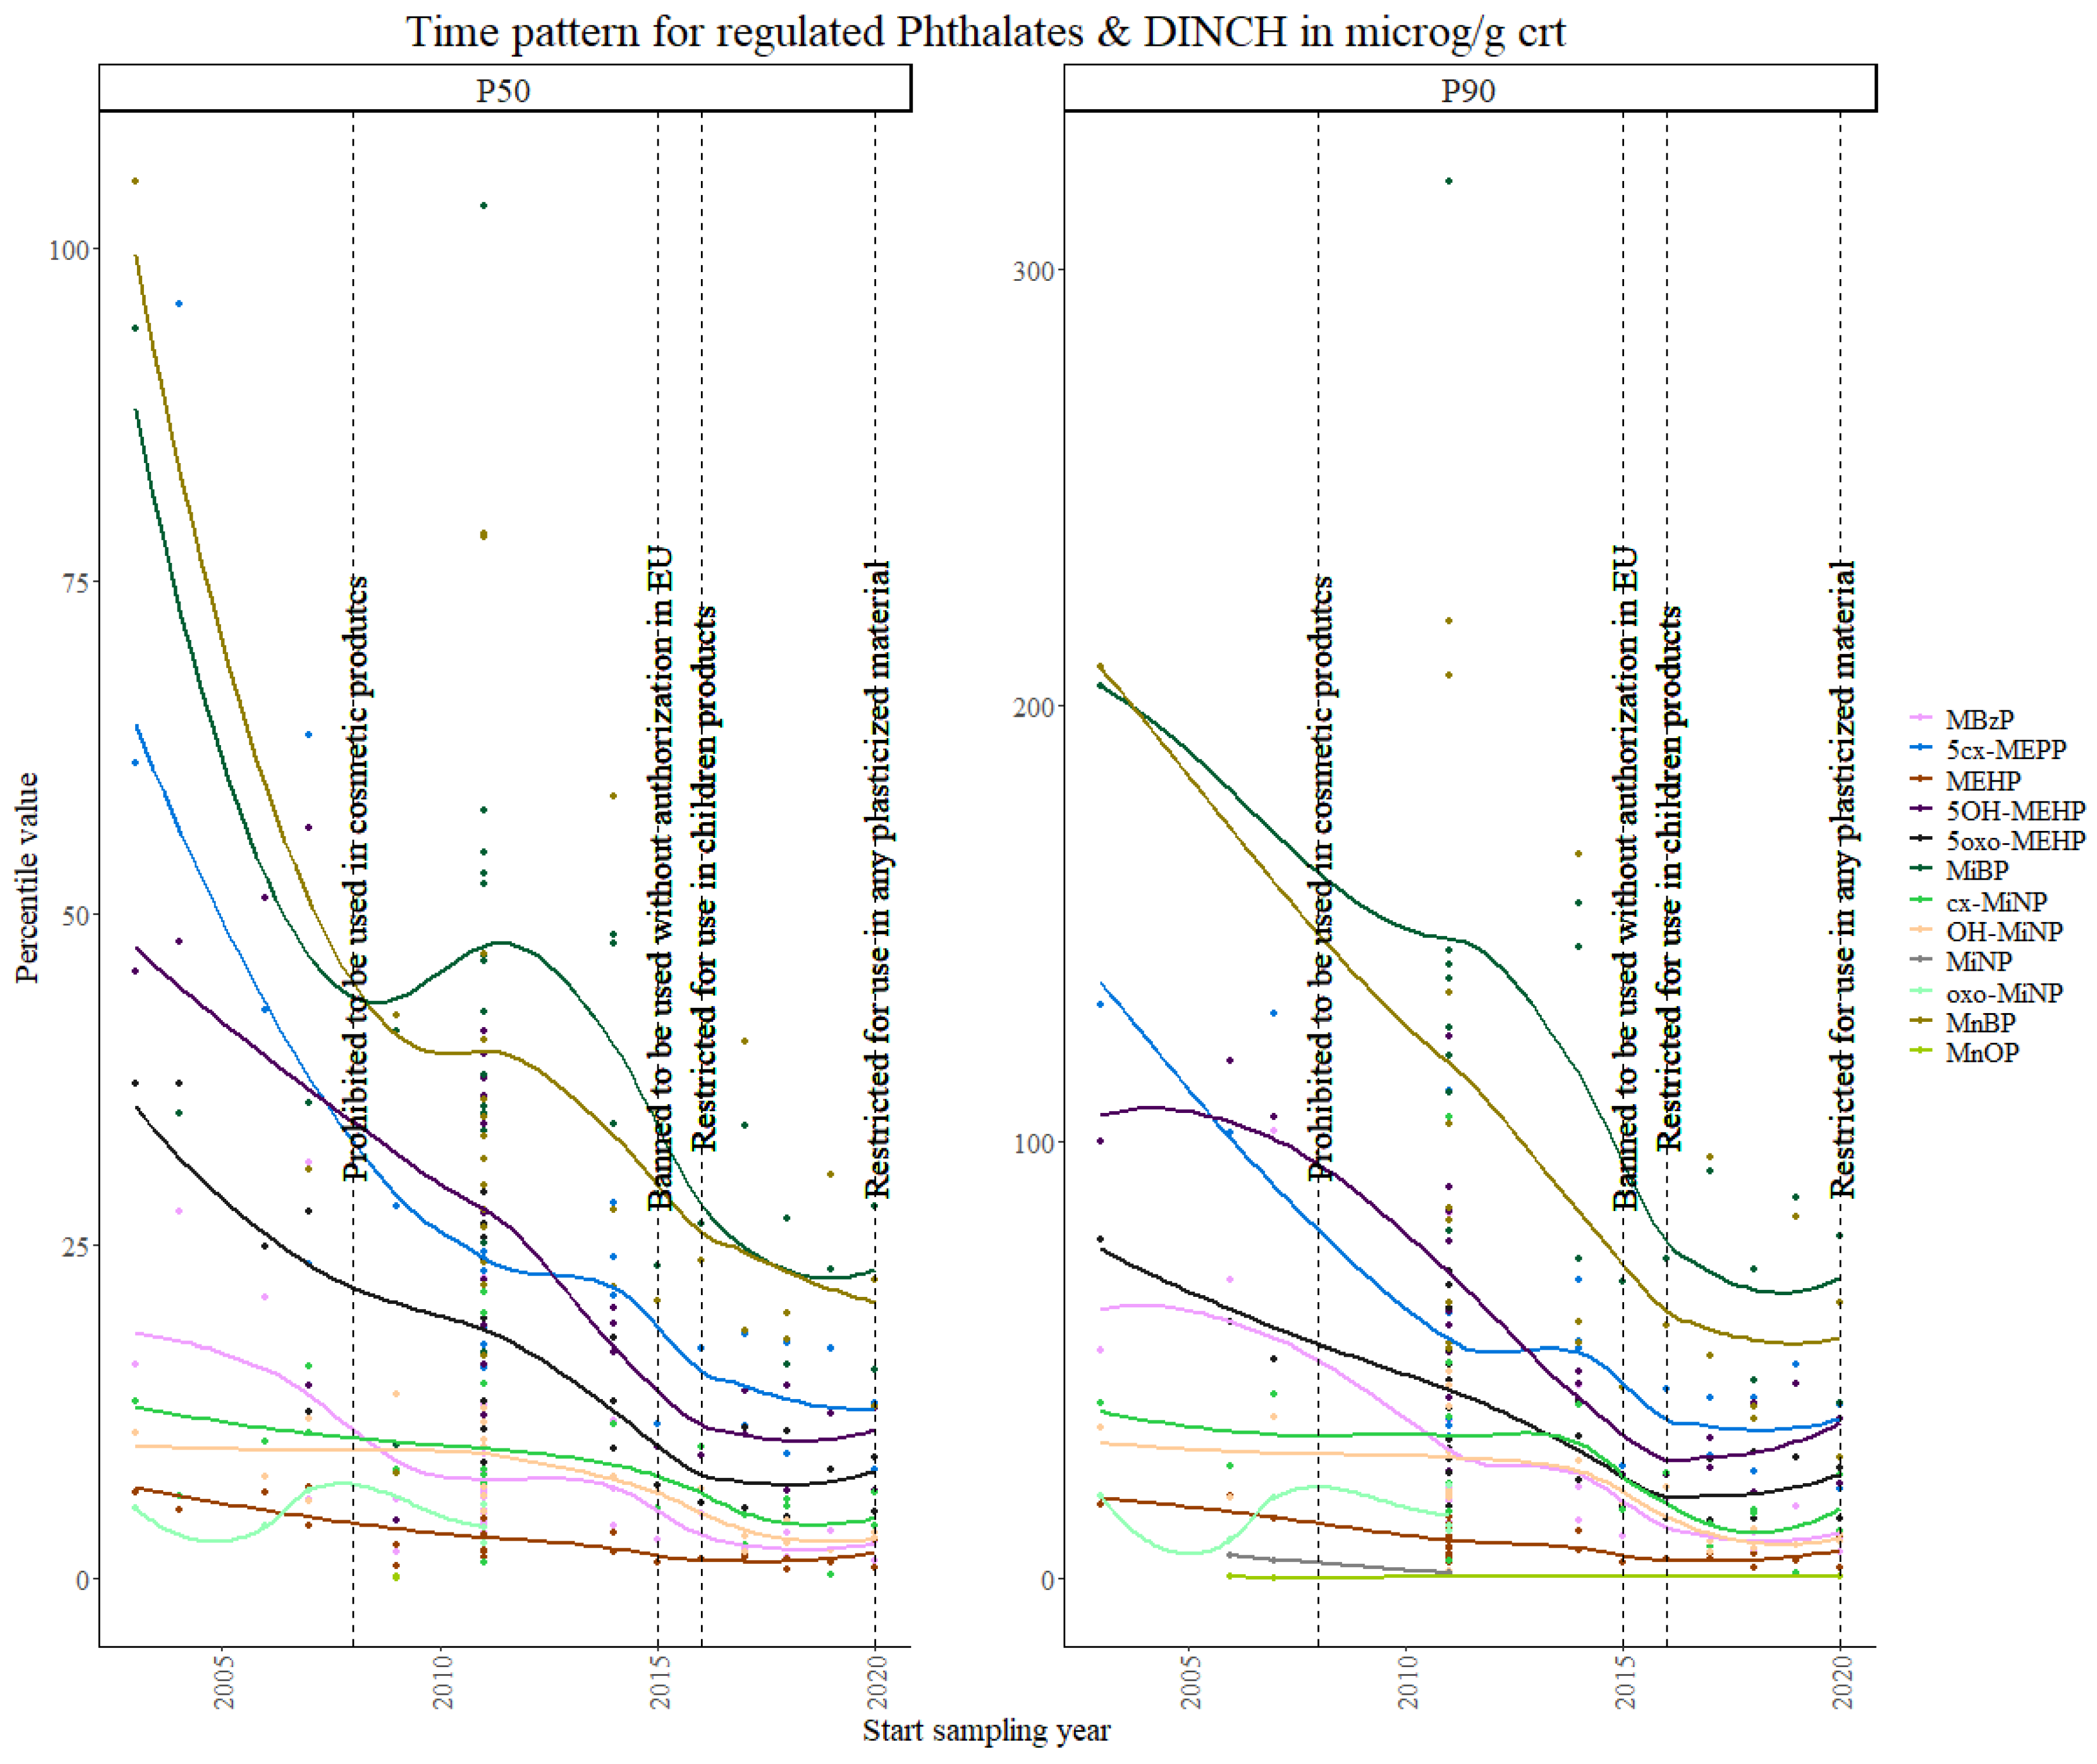
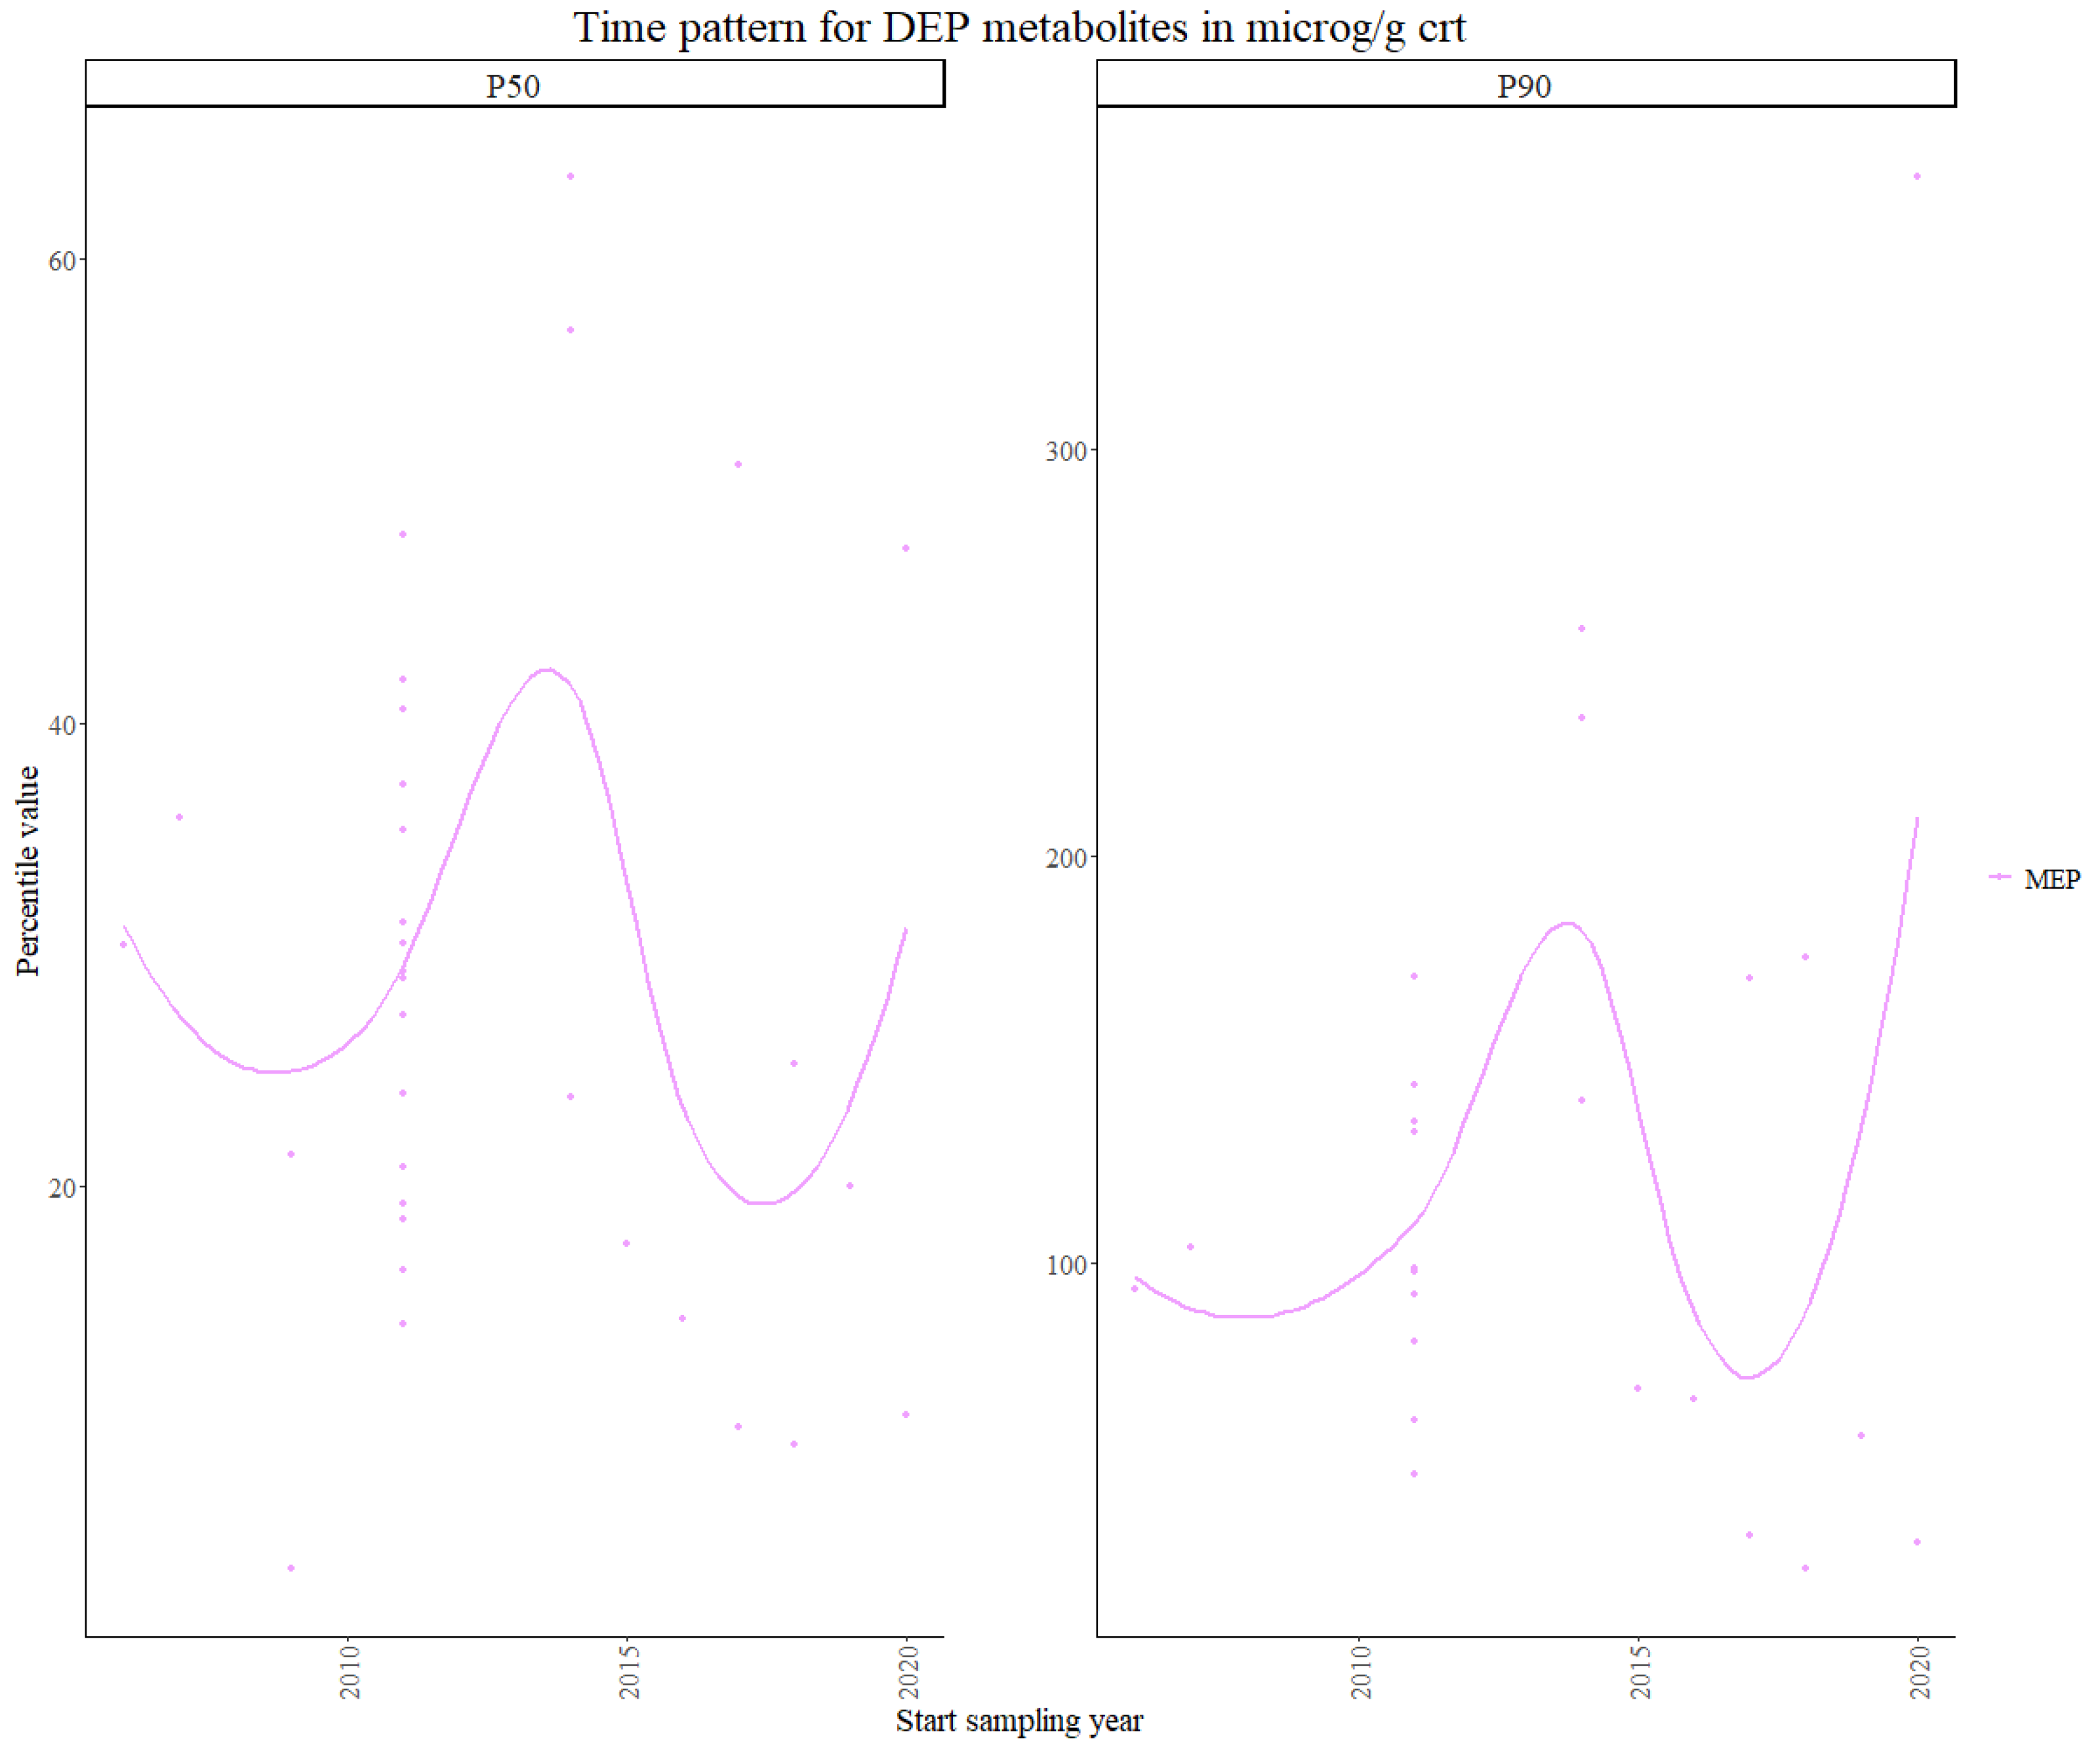
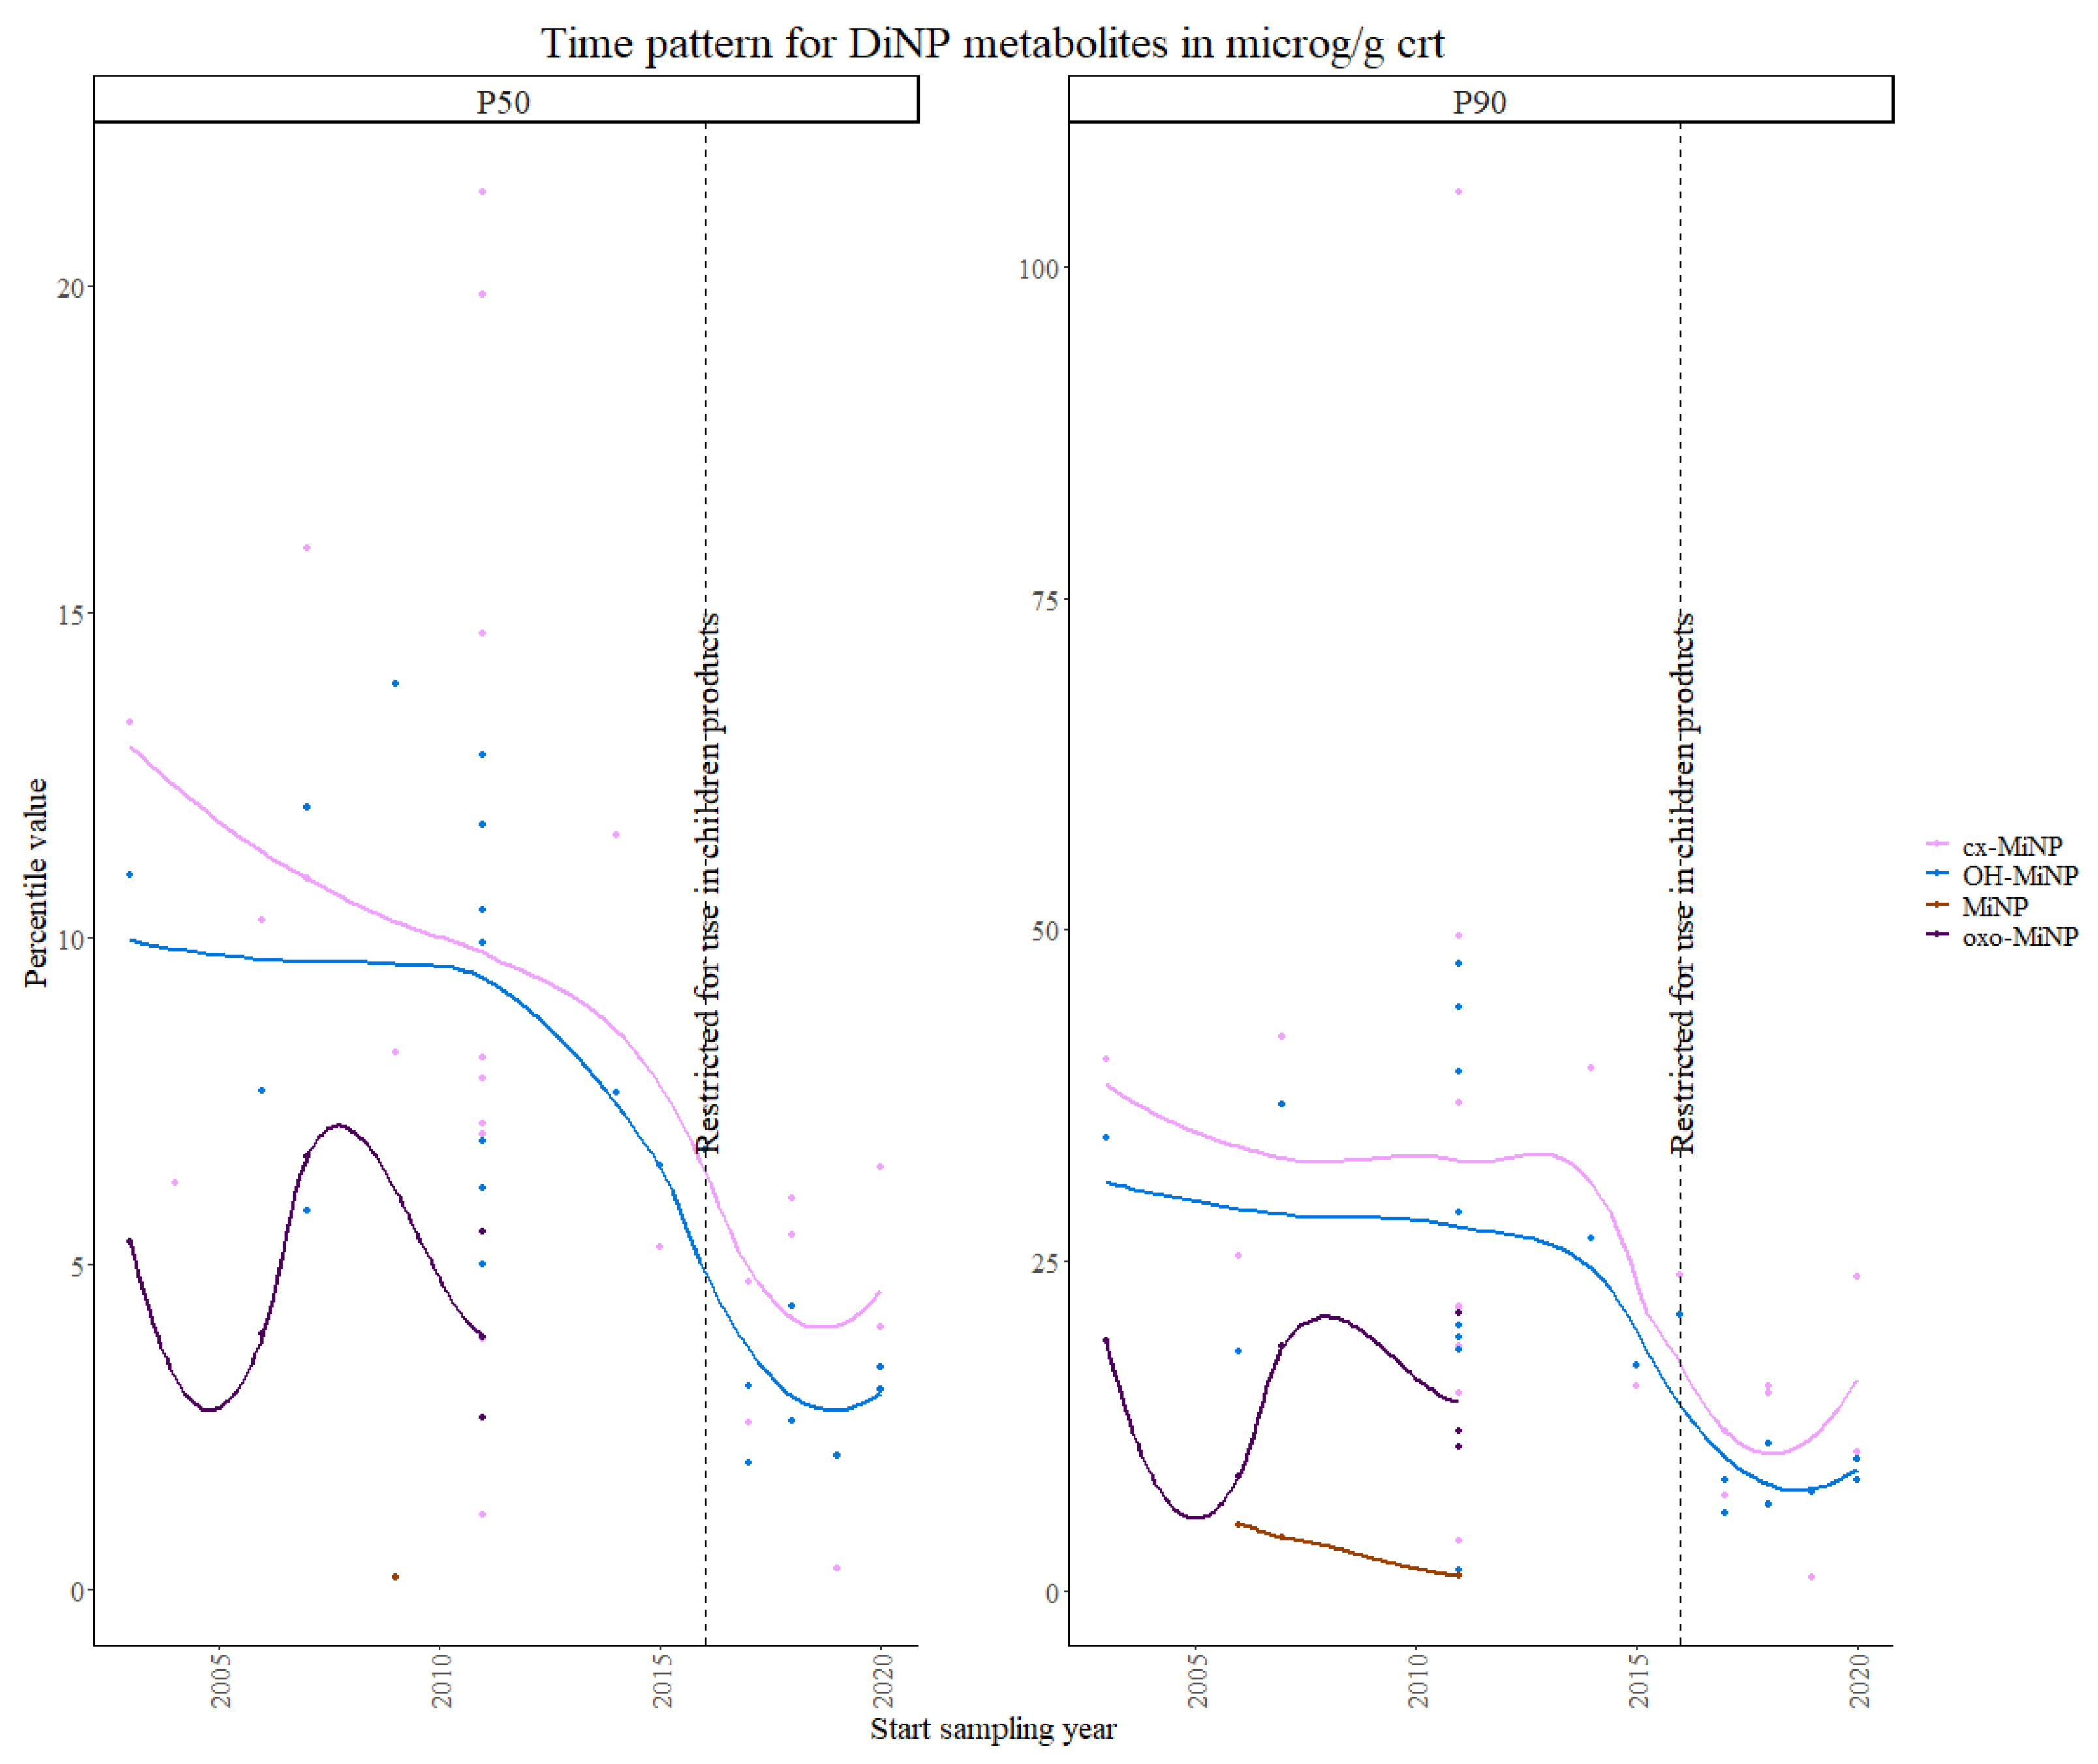
3.1.1. Phthalates and DINCH
3.1.2. OPFRs
3.2. Time Patterns Observed in Adult Women (24–52 Years) in Europe
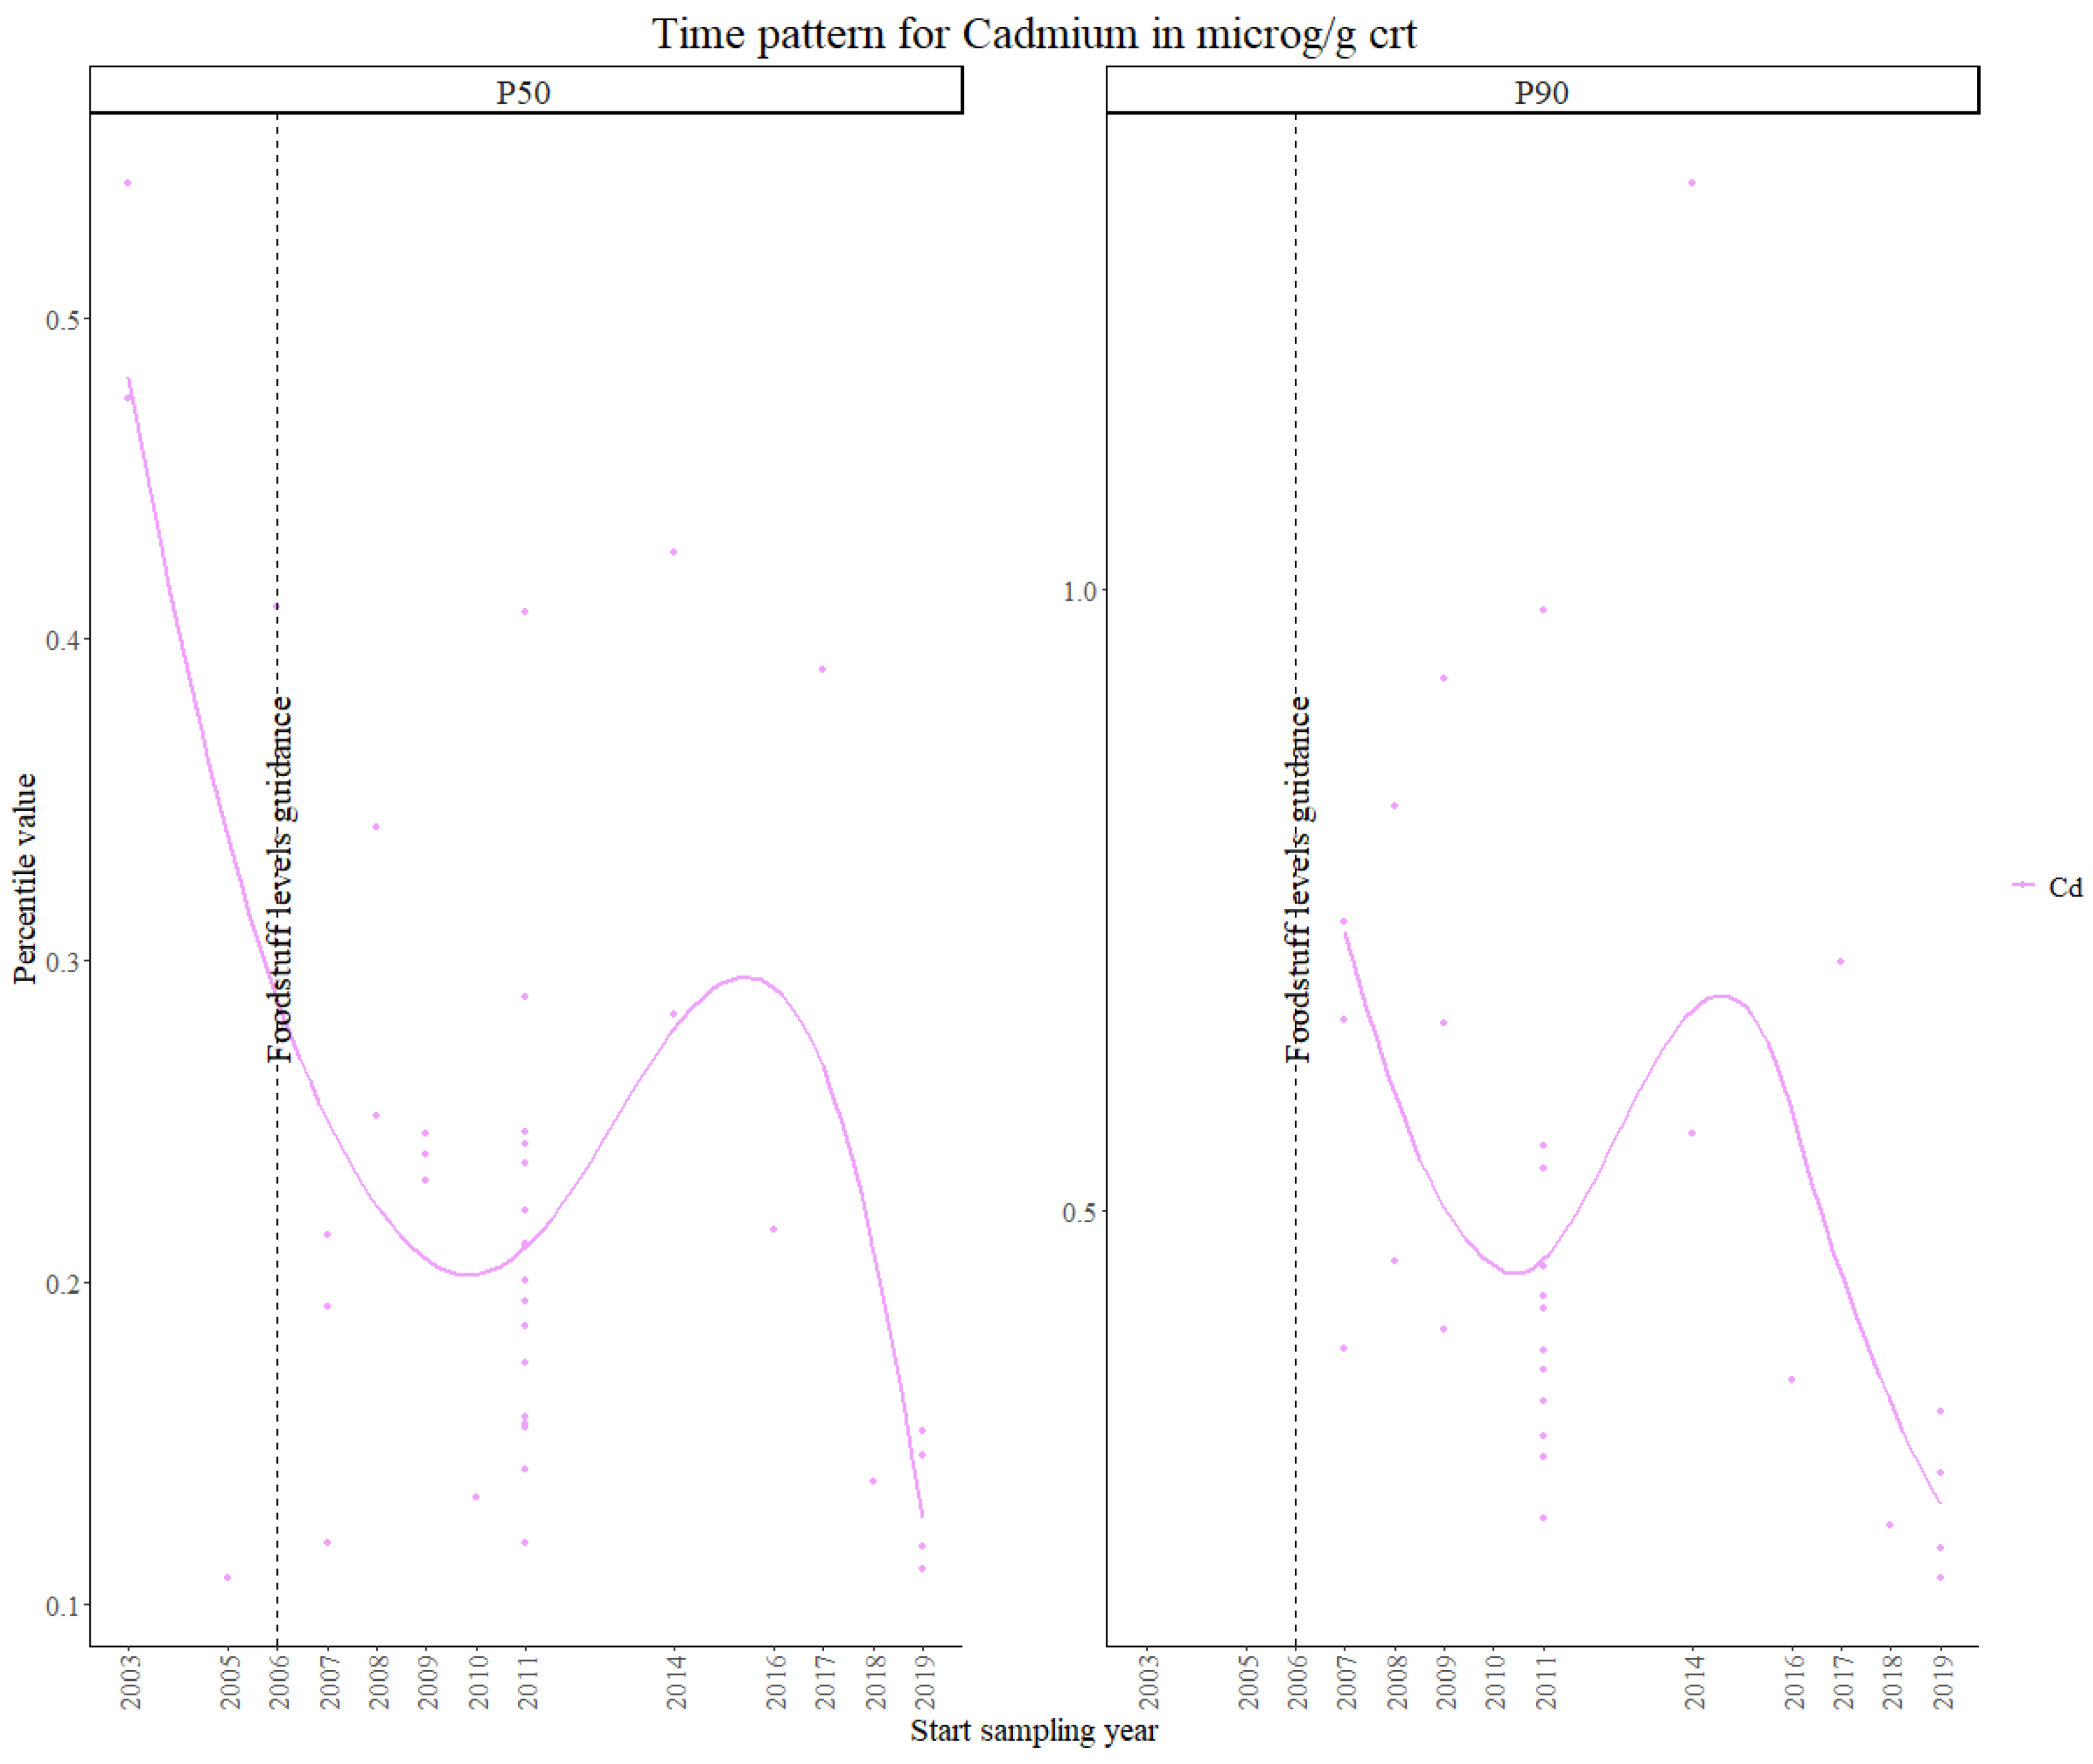
3.2.1. Cadmium
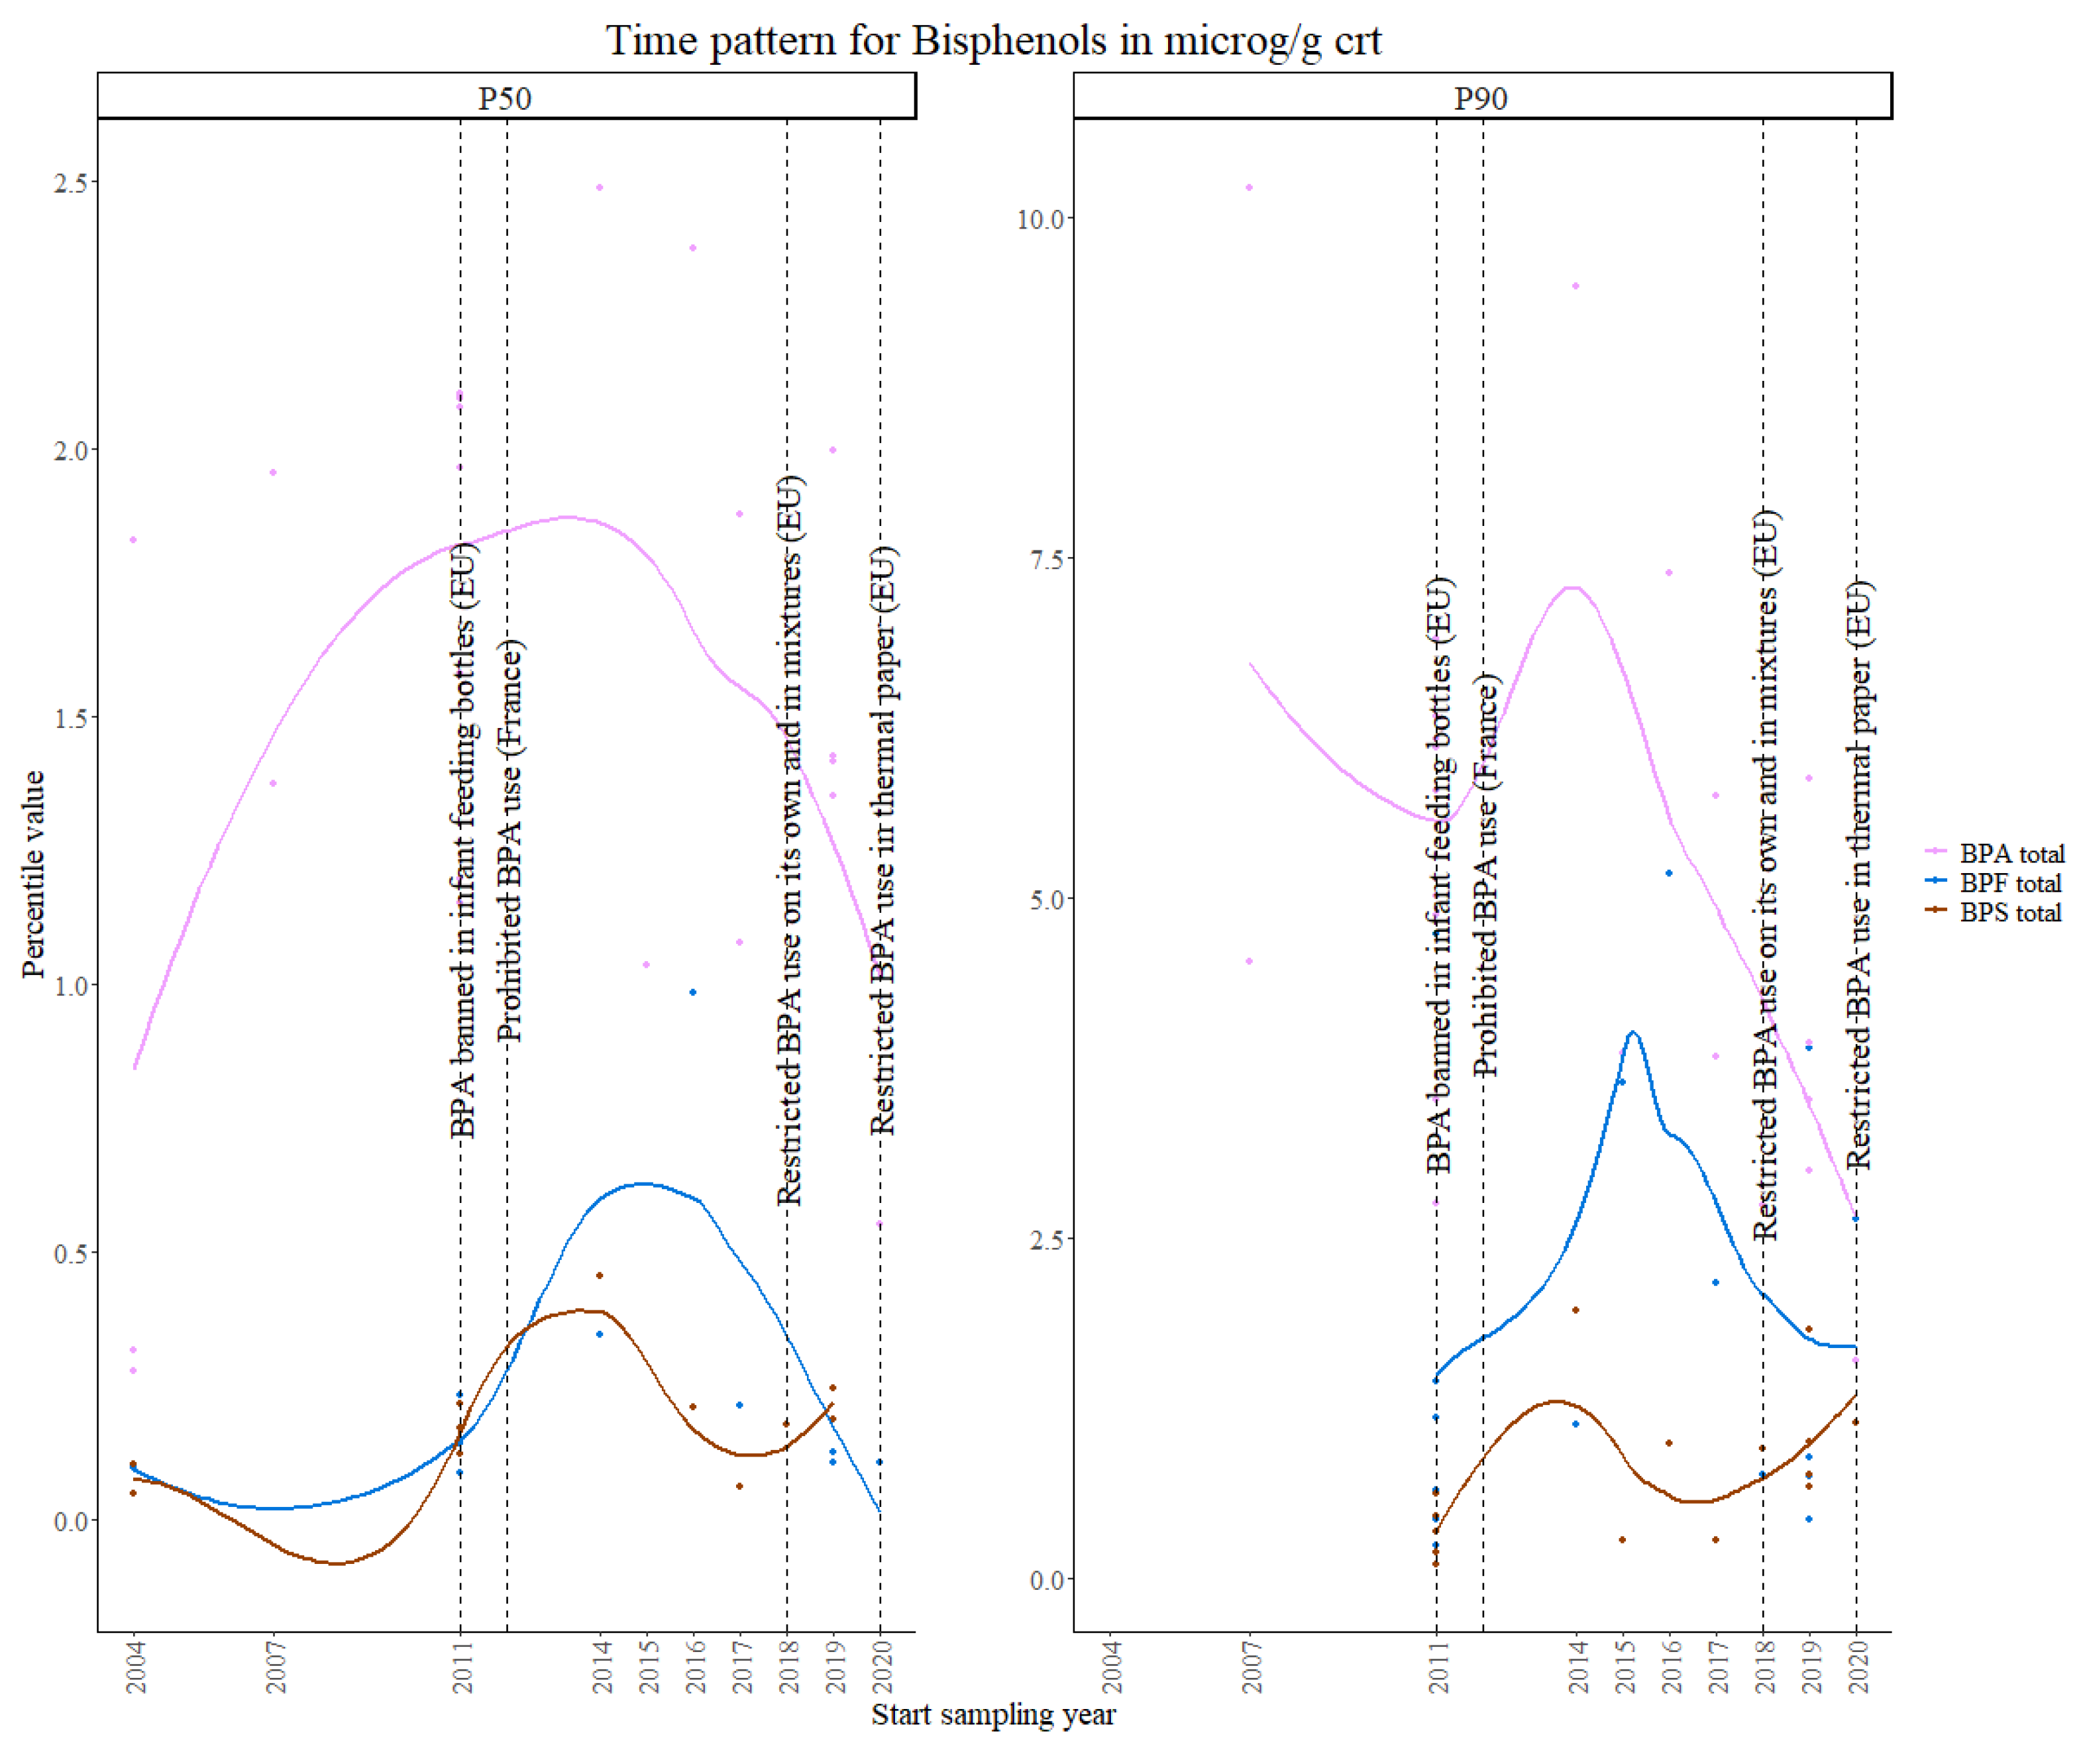
3.2.2. Bisphenols
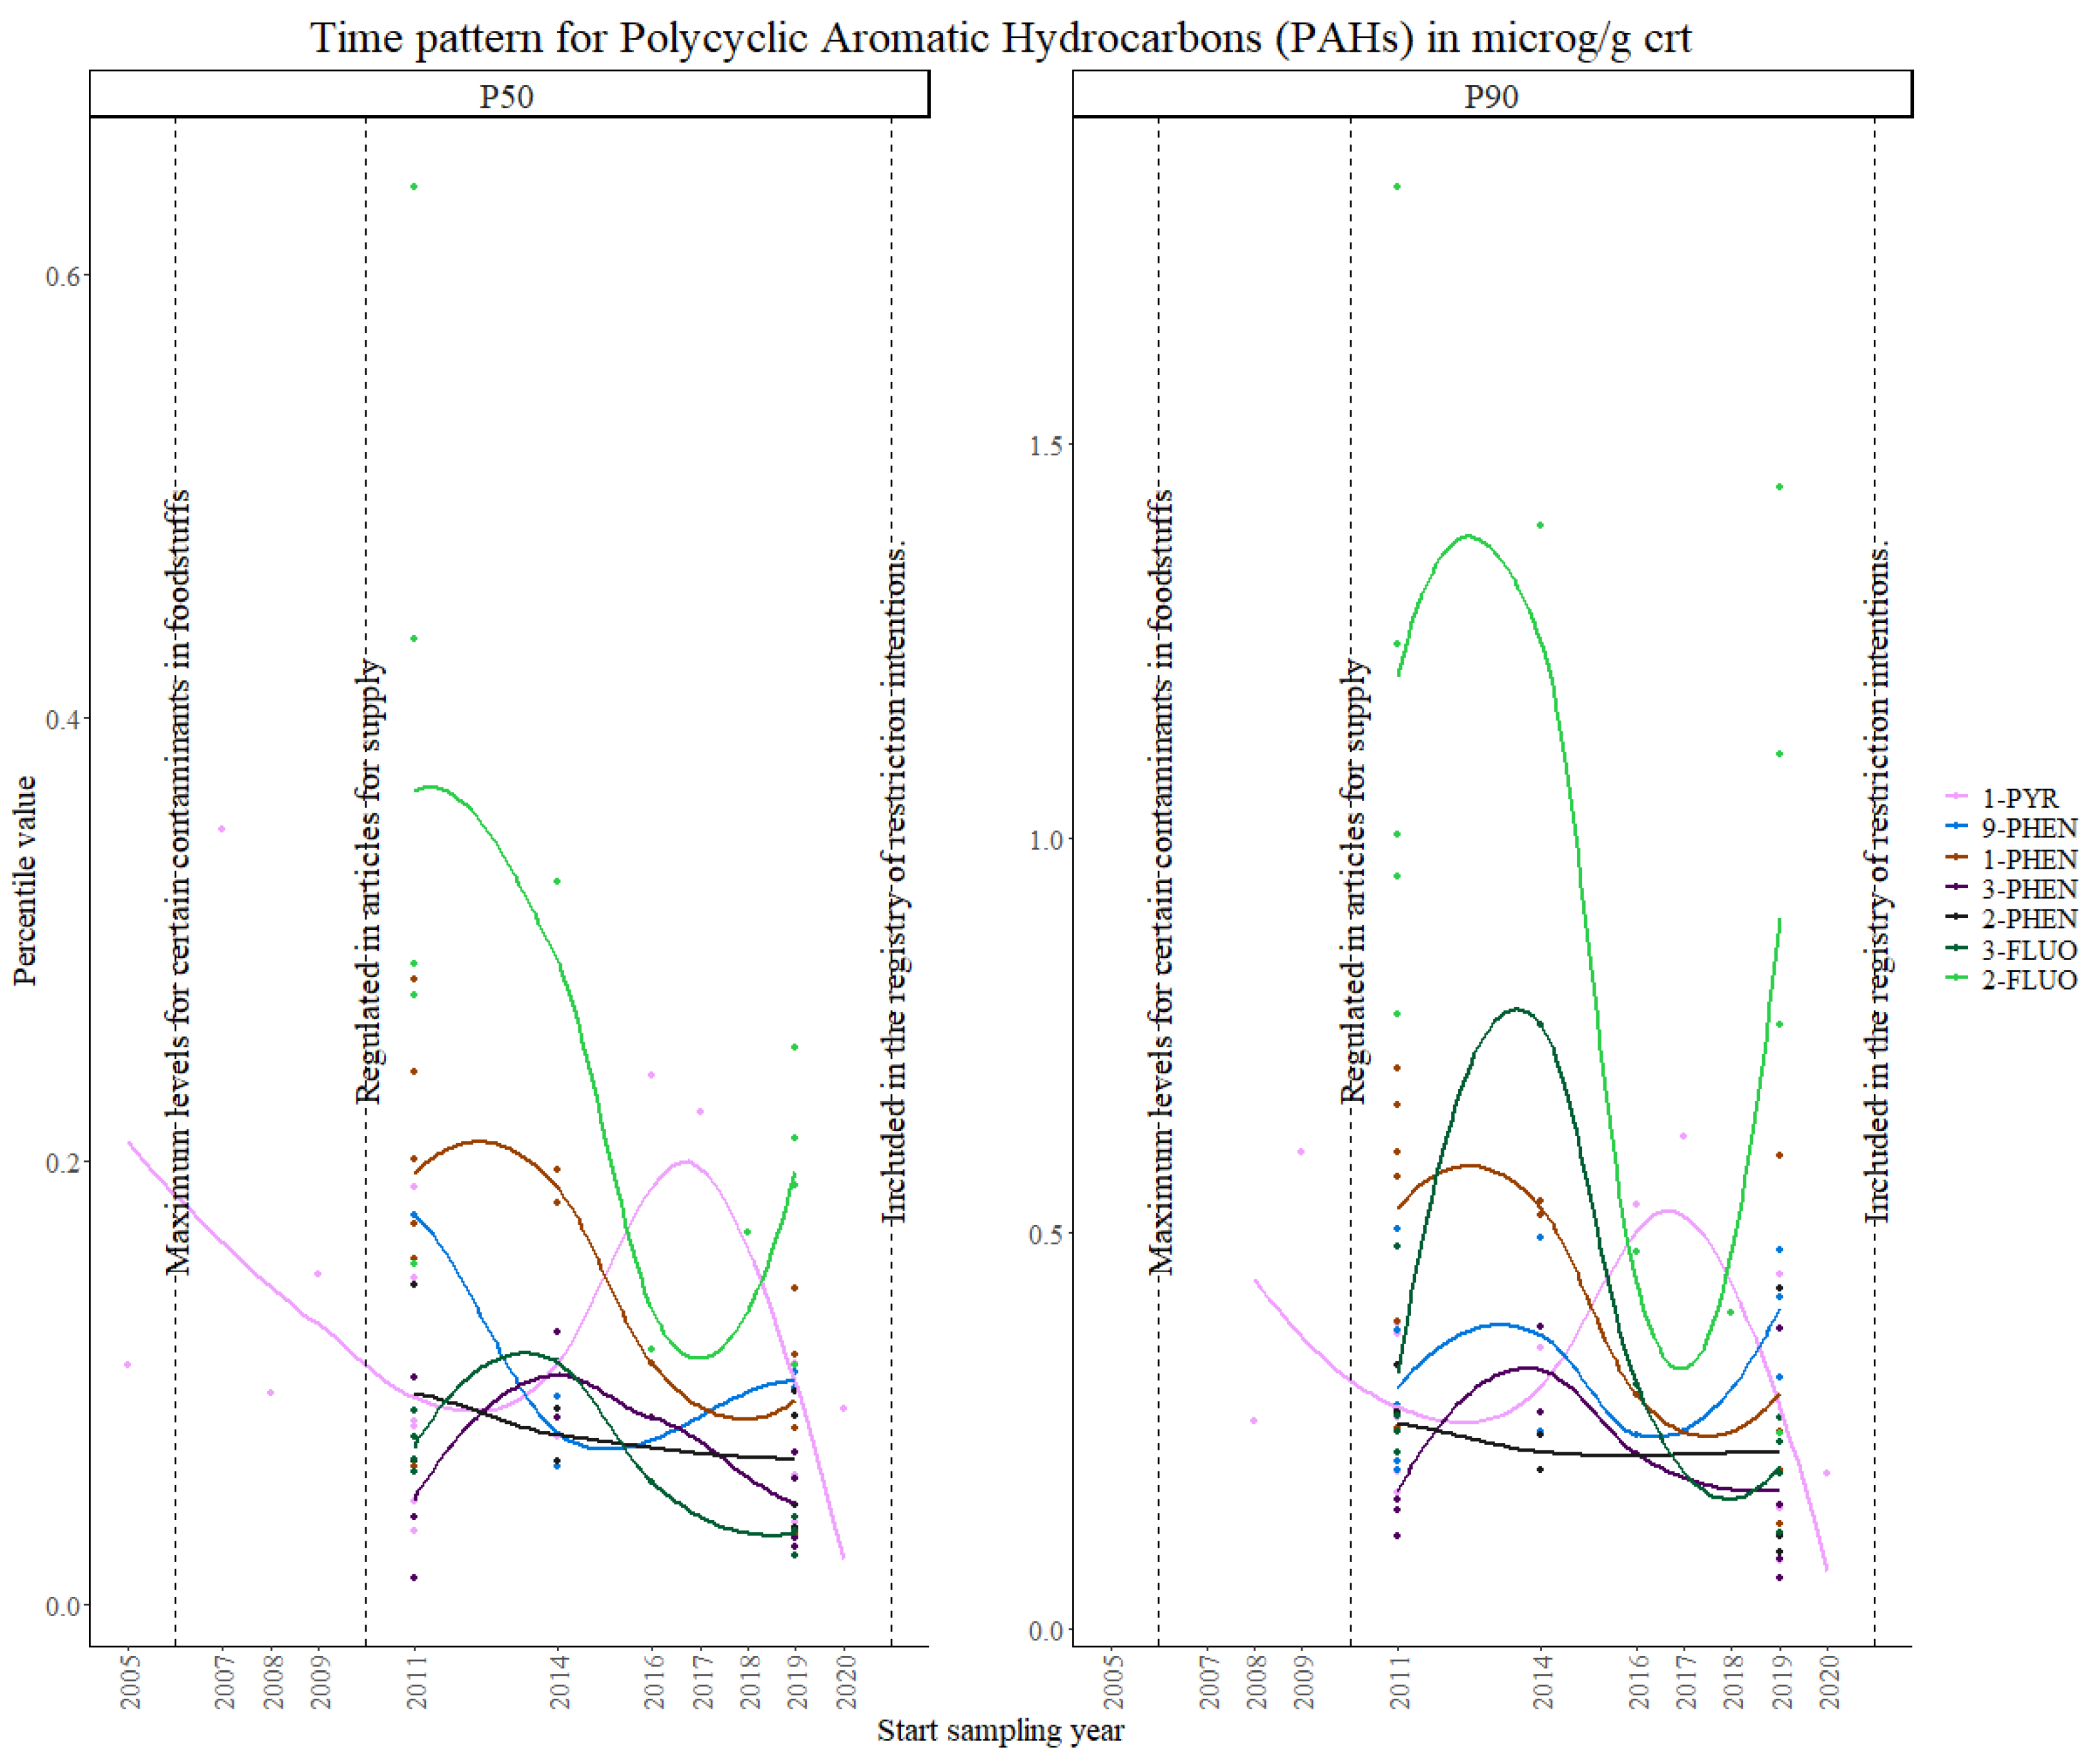
3.2.3. PAHs
3.2.4. Strengths and Limitations
4. Conclusions
Supplementary Materials
Author Contributions
Funding
Informed Consent Statement
Data Availability Statement
Acknowledgments
Conflicts of Interest
Abbreviations
| HBM4EU | European Human Biomonitoring Initiative |
| HBM | Human biomonitoring |
| OPFRs | Organophosphorus flame retardants |
| PAHs | Polycyclic aromatic hydrocarbons |
| DINCH | 1:2-Cyclohexane dicarboxylic acid diisononyl ester |
| Cd | Cadmium |
| PFAS | Per- and polyfluoroalkyl substances |
| FR | Flame retardants |
| ECHA | European Chemicals Agency |
| PBDEs | Polybrominated diphenyl ethers |
| OPFRs | Organophosphate flame retardants |
| IARC | International Agency for Research on Cancer |
| BPA | Bisphenol A |
| BPS | Bisphenol S |
| BPF | Bisphenol F |
| SOPs | Standard operating procedures |
| ICIs | Interlaboratory comparison investigations |
| EQUAS | External quality assessment schemes |
| DEHP | Di(2-ethylhexyl) phthalate |
| DnBP | Di-n-butyl phthalate |
| BBzP | Butylbenzyl phthalate |
| DINP | Di-isononyl phthalate |
| DIDP | Di-isodecyl phthalate |
| DNOP | Di-n-octyl-phthalate |
| DIBP | Di-isobutyl phthalate |
| DnPeP | Di-n-pentyl phthalate |
| MEHP | Mono(2-ethylhexyl) phthalate |
| 5OH-MEHP | Mono (2-ethyl-5-hydroxy- hexyl) phthalate |
| 5cx-MEPP | Mono (2-ethyl-5-carboxy- pentyl) phthalate |
| 5oxo-MEHP | Mono (2-ethyl-5-oxo-hexyl) phthalate |
| MEP | Mono-ethyl phthalate |
| MnBP | Mono-n-butyl phthalate |
| MiBP | Mono-isobutyl phthalate |
| Oxo-MiNP | 7-Oxo-(Mono-methyl-octyl) phthalate |
| MnOP | Mono-n-octyl phthalate |
| cx-MINCH | Cyclohexane-1:2-dicarboxylate-mono-(7-carboxylate-4-methyl) heptyl ester |
| OH-MINCH | Cyclohexane-1:2-dicarboxylate-mono-(7-hydroxy-4-methyl) octyl ester |
| ESB | Environmental Specimen Bank |
| SVHCs | Substance of very high concern |
References
- Ougier, E.; Ganzleben, C.; Lecoq, P.; Bessems, J.; David, M.; Schoeters, G.; Lange, R.; Meslin, M.; Uhl, M.; Kolossa-Gehring, M.; et al. Chemical prioritisation strategy in the European Human Biomonitoring Initiative (HBM4EU)—Development and results. Int. J. Hyg. Environ. Health 2021, 236, 113778. [Google Scholar] [CrossRef]
- Govarts, E.; Gilles, L.; Martin, L.R.; Santonen, T.; Apel, P.; Alvito, P.; Anastasi, E.; Andersen, H.R.; Andersson, A.M.; Andryskova, L.; et al. Harmonized human biomonitoring in European children, teenagers and adults: EU-wide exposure data of 11 chemical substance groups from the HBM4EU Aligned Studies (2014–2021). Int. J. Hyg. Environ. Health 2023, 249, 114119. [Google Scholar] [CrossRef] [PubMed]
- Vorkamp, K.; López, M.E.; Gilles, L.; Göen, T.; Govarts, E.; Hajeb, P.; Katsonouri, A.; Knudsen, L.E.; Kolossa-Gehring, M.; Lindh, C.; et al. Coordination of chemical analyses under the European Human Biomonitoring Initiative (HBM4EU): Concepts, procedures and lessons learnt. Int. J. Hyg. Environ. Health 2023, 251, 114183. [Google Scholar] [CrossRef]
- Hond, E.D.; Govarts, E.; Willems, H.; Smolders, R.; Casteleyn, L.; Kolossa-Gehring, M.; Schwedler, G.; Seiwert, M.; Fiddicke, U.; Castaño, A.; et al. First steps toward harmonized human biomonitoring in Europe: Demonstration project to perform human biomonitoring on a European scale. Environ. Health Perspect. 2015, 123, 255–263. [Google Scholar] [CrossRef] [PubMed]
- Latini, G. Monitoring phthalate exposure in humans. Clin. Chim. Acta 2005, 361, 20–29. [Google Scholar] [CrossRef] [PubMed]
- Tsatsakis, A.M.; Katsikantami, I.; Kalantzi, O.-I.; Sevim, Ç.; Tsarouhas, K.; Sarigiannis, D.; Tzatzarakis, M.N.; Rizos, A.K. Phthalates: Exposure and health effects. In Encyclopedia of Environmental Health; Elsevier: Amsterdam, The Netherlands, 2019; pp. 163–173. [Google Scholar] [CrossRef]
- Phthalates—ECHA. Available online: https://echa.europa.eu/hot-topics/phthalates (accessed on 1 August 2023).
- Braun, J.M.; Sathyanarayana, S.; Hauser, R. Phthalate exposure and children’s health. Curr. Opin. Pediatr. 2013, 25, 247–254. [Google Scholar] [CrossRef]
- Koch, H.M.; Schütze, A.; Pälmke, C.; Angerer, J.; Brüning, T. Metabolism of the plasticizer and phthalate substitute diisononyl- cyclohexane-1,2-dicarboxylate (DINCH®) in humans after single oral doses. Arch. Toxicol. 2013, 87, 799–806. [Google Scholar] [CrossRef]
- Campioli, E.; Lau, M.; Papadopoulos, V. Effect of subacute and prenatal DINCH plasticizer exposure on rat dams and male offspring hepatic function: The role of PPAR-α. Environ. Res. 2019, 179, 108773. [Google Scholar] [CrossRef]
- Gibson, E.A.; Stapleton, H.M.; Calero, L.; Holmes, D.; Burke, K.; Martinez, R.; Cortes, B.; Nematollahi, A.; Evans, D.; Anderson, K.A.; et al. Differential exposure to organophosphate flame retardants in mother-child pairs. Chemosphere 2019, 219, 567–573. [Google Scholar] [CrossRef]
- Stockholm Convention on Persistent Organic Pollutants. 2001. Available online: https://treaties.un.org/Pages/ViewDetails.aspx?src=IND&mtdsg_no=XXVII-15&chapter=27&clang=_en (accessed on 1 August 2023).
- Ospina, M.; Jayatilaka, N.K.; Wong, L.Y.; Restrepo, P.; Calafat, A.M. Exposure to organophosphate flame retardant chemicals in the U.S. general population: Data from the 2013–2014 National Health and Nutrition Examination Survey. Environ. Int. 2018, 110, 32–41. [Google Scholar] [CrossRef]
- Zhou, L.; Hiltscher, M.; Püttmann, W. Occurrence and human exposure assessment of organophosphate flame retardants in indoor dust from various microenvironments of the Rhine/Main region, Germany. Indoor Air 2017, 27, 1113–1127. [Google Scholar] [CrossRef]
- Lipscomb, S.T.; McClelland, M.M.; MacDonald, M.; Cardenas, A.; Anderson, K.A.; Kile, M.L. Cross-sectional study of social behaviors in preschool children and exposure to flame retardants. Environ. Health 2017, 16, 23. [Google Scholar] [CrossRef]
- Järup, L.; Åkesson, A. Current status of cadmium as an environmental health problem. Toxicol. Appl. Pharmacol. 2009, 238, 201–208. [Google Scholar] [CrossRef] [PubMed]
- Mikołajewska, K.; Stragierowicz, J.; Gromadzińska, J. Bisphenol A—Application, sources of exposure and potential risks in infants, children and pregnant women. Int. J. Occup. Med. Environ. Health 2015, 28, 209–241. [Google Scholar] [CrossRef] [PubMed]
- Peretz, J.; Vrooman, L.; Ricke, W.A.; Hunt, P.A.; Ehrlich, S.; Hauser, R.; Padmanabhan, V.; Taylor, H.S.; Swan, S.H.; VandeVoort, C.A.; et al. Bisphenol A and reproductive health: Update of experimental and human evidence, 2007–2013. Environ. Health Perspect. 2014, 122, 775–786. [Google Scholar] [CrossRef]
- EFSA Opinion on BPA. Available online: https://www.efsa.europa.eu/en/topics/topic/bisphenol (accessed on 1 August 2023).
- Registered Substances—ECHA. Available online: https://echa.europa.eu/information-on-chemicals/registered-substances (accessed on 1 August 2023).
- Hormann, A.M.; Vom Saal, F.S.; Nagel, S.C.; Stahlhut, R.W.; Moyer, C.L.; Ellersieck, M.R.; Welshons, W.V.; Toutain, P.-L.; Taylor, J.A. Holding Thermal Receipt Paper and Eating Food after Using Hand Sanitizer Results in High Serum Bioactive and Urine Total Levels of Bisphenol A (BPA). PLoS ONE 2014, 9, e110509. [Google Scholar] [CrossRef] [PubMed]
- Braver-Sewradj, S.P.D.; van Spronsen, R.; Hessel, E.V.S. Substitution of bisphenol A: A review of the carcinogenicity, reproductive toxicity, and endocrine disruption potential of alternative substances. Crit. Rev. Toxicol. 2020, 50, 128–147. [Google Scholar] [CrossRef]
- Polycyclic Aromatic Hydrocarbons (PAHs): What Health Effects Are Associated With PAH Exposure?|Environmental Medicine|ATSDR. Available online: https://www.atsdr.cdc.gov/csem/polycyclic-aromatic-hydrocarbons/health_effects.html (accessed on 1 August 2023).
- Gilles, L.; Govarts, E.; Rambaud, L.; Vogel, N.; Castaño, A.; López, M.E.; Martin, L.R.; Koppen, G.; Remy, S.; Vrijheid, M.; et al. HBM4EU combines and harmonises human biomonitoring data across the EU, building on existing capacity—The HBM4EU survey. Int. J. Hyg. Environ. Health 2021, 237, 113809. [Google Scholar] [CrossRef]
- Gilles, L.; Govarts, E.; Martin, L.R.; Andersson, A.-M.; Appenzeller, B.M.R.; Barbone, F.; Castaño, A.; Coertjens, D.; Hond, E.D.; Dzhedzheia, V.; et al. Harmonization of Human Biomonitoring Studies in Europe: Characteristics of the HBM4EU-Aligned Studies Participants. Int. J. Environ. Res. Public Health 2022, 19, 6787. [Google Scholar] [CrossRef]
- Flemish Institute of Technological Research (VITO), M.B. European Human Biomonitoring Dashboard for Visualization of Aggregated HBM Data. 2022. Available online: https://report.vito.be/t/EU-HBM/views/EuropeanHumanBioMonitoringData-ExposurePatternsRisk/EXPOSURE?:showAppBanner=false&:display_count=n&:showVizHome=n&:origin=viz_share_link&:isGuestRedirectFromVizportal=y&:embed=y (accessed on 1 August 2023).
- Mol, H.G.J.; Elbers, I.; Pälmke, C.; Bury, D.; Göen, T.; López, M.E.; Nübler, S.; Vaccher, V.; Antignac, J.-P.; Dvořáková, D.; et al. Proficiency and Interlaboratory Variability in the Determination of Phthalate and DINCH Biomarkers in Human Urine: Results from the HBM4EU Project. Toxics 2022, 10, 57. [Google Scholar] [CrossRef] [PubMed]
- Dvorakova, D.; Pulkrabova, J.; Gramblicka, T.; Polachova, A.; Buresova, M.; López, M.E.; Castaño, A.; Nübler, S.; Haji-Abbas-Zarrabi, K.; Klausner, N.; et al. Interlaboratory comparison investigations (ICIs) and external quality assurance schemes (EQUASs) for flame retardant analysis in biological matrices: Results from the HBM4EU project. Environ. Res. 2021, 202, 111705. [Google Scholar] [CrossRef]
- Vaccher, V.; Lopez, M.E.; Castaño, A.; Mol, H.; Haji-Abbas-Zarrabi, K.; Bury, D.; Koch, H.M.; Dvorakova, D.; Hajslova, J.; Nübler, S.; et al. European interlaboratory comparison investigations (ICI) and external quality assurance schemes (EQUAS) for the analysis of bisphenol A, S and F in human urine: Results from the HBM4EU project. Environ. Res. 2022, 210, 112933. [Google Scholar] [CrossRef] [PubMed]
- Covaci, A.; Hond, E.D.; Geens, T.; Govarts, E.; Koppen, G.; Frederiksen, H.; Knudsen, L.E.; Mørck, T.A.; Gutleb, A.C.; Guignard, C.; et al. Urinary BPA measurements in children and mothers from six European member states: Overall results and determinants of exposure. Environ. Res. 2015, 141, 77–85. [Google Scholar] [CrossRef] [PubMed]
- Schindler, B.K.; Esteban, M.; Koch, H.M.; Castano, A.; Koslitz, S.; Cañas, A.; Casteleyn, L.; Kolossa-Gehring, M.; Schwedler, G.; Schoeters, G.; et al. The European COPHES/DEMOCOPHES project: Towards transnational comparability and reliability of human biomonitoring results. Int. J. Hyg. Environ. Health 2014, 217, 653–661. [Google Scholar] [CrossRef]
- López, M.E.; Göen, T.; Mol, H.; Nübler, S.; Haji-Abbas-Zarrabi, K.; Koch, H.M.; Kasper-Sonnenberg, M.; Dvorakova, D.; Hajslova, J.; Antignac, J.-P.; et al. The European human biomonitoring platform—Design and implementation of a laboratory quality assurance/quality control (QA/QC) programme for selected priority chemicals. Int. J. Hyg. Environ. Health 2021, 234, 113740. [Google Scholar] [CrossRef]
- Nübler, S.; Esteban López, M.; Castaño, A.; Mol, H.G.J.; Haji-Abbas-Zarrabi, K.; Schäfer, M.; Müller, J.; Hajslova, J.; Dvorakova, D.; Antignac, J.P.; et al. Interlaboratory Comparison Investigations (ICI) and External Quality Assurance Schemes (EQUAS) for Human Biomonitoring of Perfluoroalkyl Substances (PFASs) in Serum as Part of the Quality Assurance Programme under HBM4EU. Available online: https://ssrn.com/abstract=4084662 (accessed on 1 August 2023).
- Nübler, S.; López, M.E.; Castaño, A.; Mol, H.G.; Müller, J.; Schäfer, M.; Haji-Abbas-Zarrabi, K.; Hajslova, J.; Pulkrabova, J.; Dvorakova, D.; et al. External Quality Assurance Schemes (EQUASs) and Inter-laboratory Comparison Investigations (ICIs) for human biomonitoring of polycyclic aromatic hydrocarbon (PAH) biomarkers in urine as part of the quality assurance programme under HBM4EU. Int. J. Hyg. Environ. Health 2023, 250, 114169. [Google Scholar] [CrossRef]
- The International Commission on Radiological Protection I. Basic anatomical and physiological data for use in radiological protection: Reference values. A report of age- and gender-related differences in the anatomical and physiological characteristics of reference individuals. Ann. ICRP 2002, 32, 5–265. [Google Scholar]
- Poulson, O.M.; Holst, E.; Christensen, J.M. Calculation and application of coverage intervals for biological reference values (Technical Report). Pure Appl. Chem. 1997, 69, 1601–1612. [Google Scholar] [CrossRef]
- Fontelles, J.; Clarke, C. Directive 2005/84/ec of the european parliament and of the council. Off. J. Eur. Union 2005, 48, 40–43. [Google Scholar]
- European Union. Regulation (EC) No 1223/2009 of the European Parliament and of the Council of 30 November 2009 on cosmetic products (recast) (Text with EEA relevance). Off. J. Eur. Union 2009, 342, 59. [Google Scholar]
- Göen, T.; Dobler, L.; Koschorreck, J.; Müller, J.; Wiesmüller, G.A.; Drexler, H.; Kolossa-Gehring, M. Trends of the internal phthalate exposure of young adults in Germany—Follow-up of a retrospective human biomonitoring study. Int. J. Hyg. Environ. Health 2011, 215, 36–45. [Google Scholar] [CrossRef]
- Koch, H.M.; Rüther, M.; Schütze, A.; Conrad, A.; Pälmke, C.; Apel, P.; Brüning, T.; Kolossa-Gehring, M. Phthalate metabolites in 24-h urine samples of the German Environmental Specimen Bank (ESB) from 1988 to 2015 and a comparison with US NHANES data from 1999 to 2012. Int. J. Hyg. Environ. Health 2017, 220, 130–141. [Google Scholar] [CrossRef]
- Domínguez-Romero, E.; Komprdová, K.; Kalina, J.; Bessems, J.; Karakitsios, S.; Sarigiannis, D.A.; Scheringer, M. Time-trends in human urinary concentrations of phthalates and substitutes DEHT and DINCH in Asian and North American countries (2009–2019). J. Expo. Sci. Environ. Epidemiol. 2023, 33, 244–254. [Google Scholar] [CrossRef]
- Vogel, N.; Frederiksen, H.; Lange, R.; Jørgensen, N.; Koch, H.M.; Weber, T.; Andersson, A.-M.; Kolossa-Gehring, M. Urinary excretion of phthalates and the substitutes DINCH and DEHTP in Danish young men and German young adults between 2000 and 2017—A time trend analysis. Int. J. Hyg. Environ. Health 2023, 248, 114080. [Google Scholar] [CrossRef]
- Bastiaensen, M.; Gys, C.; Colles, A.; Malarvannan, G.; Verheyen, V.; Koppen, G.; Govarts, E.; Bruckers, L.; Morrens, B.; Franken, C.; et al. Biomarkers of phthalates and alternative plasticizers in the Flemish Environment and Health Study (FLEHS IV): Time trends and exposure assessment. Environ. Pollut. 2021, 276, 116724. [Google Scholar] [CrossRef]
- Pagoni, A.; Arvaniti, O.S.; Kalantzi, O.-I. Exposure to phthalates from personal care products: Urinary levels and predictors of exposure. Environ. Res. 2022, 212, 113194. [Google Scholar] [CrossRef] [PubMed]
- Kasper-Sonnenberg, M.; Koch, H.M.; Apel, P.; Rüther, M.; Pälmke, C.; Brüning, T.; Kolossa-Gehring, M. Time trend of exposure to the phthalate plasticizer substitute DINCH in Germany from 1999 to 2017: Biomonitoring data on young adults from the Environmental Specimen Bank (ESB). Int. J. Hyg. Environ. Health 2019, 222, 1084–1092. [Google Scholar] [CrossRef] [PubMed]
- Hoffman, K.; Butt, C.M.; Webster, T.F.; Preston, E.V.; Hammel, S.C.; Makey, C.; Lorenzo, A.M.; Cooper, E.M.; Carignan, C.; Meeker, J.D.; et al. Temporal Trends in Exposure to Organophosphate Flame Retardants in the United States. Environ. Sci. Technol. Lett. 2017, 4, 112–118. [Google Scholar] [CrossRef]
- Bastiaensen, M.; Bamai, Y.A.; Araki, A.; Goudarzi, H.; Konno, S.; Ito, S.; Miyashita, C.; Yao, Y.; Kishi, R.; Covaci, A. Temporal trends and determinants of PFR exposure in the Hokkaido Study. Int. J. Hyg. Environ. Health 2020, 228, 113523. [Google Scholar] [CrossRef] [PubMed]
- Schmidtkunz, C.; Gries, W.; Weber, T.; Leng, G.; Kolossa-Gehring, M. Internal exposure of young German adults to di(2-propylheptyl) phthalate (DPHP): Trends in 24-h urine samples from the German Environmental Specimen Bank 1999–2017. Int. J. Hyg. Environ. Health 2019, 222, 419–424. [Google Scholar] [CrossRef] [PubMed]
- Blum, A.; Behl, M.; Birnbaum, L.S.; Diamond, M.L.; Phillips, A.; Singla, V.; Sipes, N.S.; Stapleton, H.M.; Venier, M. Organophosphate Ester Flame Retardants: Are They a Regrettable Substitution for Polybrominated Diphenyl Ethers? Environ. Sci. Technol. Lett. 2019, 6, 638–649. [Google Scholar] [CrossRef] [PubMed]
- European Food Safety Authority (EFSA). Cadmium in food—Scientific opinion of the Panel on Contaminants in the Food Chain on a request from the European Commission on cadmium in food. EFSA J. 2009, 980, 1–139. [Google Scholar] [CrossRef]
- Vogel, N.; Murawski, A.; Schmied-Tobies, M.I.; Rucic, E.; Doyle, U.; Kämpfe, A.; Hoera, C.; Hildebrand, J.; Schäfer, M.; Drexler, H.; et al. Lead, cadmium, mercury, and chromium in urine and blood of children and adolescents in Germany—Human biomonitoring results of the German Environmental Survey 2014–2017 (GerES V). Int. J. Hyg. Environ. Health 2021, 237, 113822. [Google Scholar] [CrossRef]
- Moon, C.-S.; Yang, H.-R.; Nakatsuka, H.; Ikeda, M. Time trend of cadmium intake in Korea. Environ. Health Prev. Med. 2016, 21, 118–128. [Google Scholar] [CrossRef]
- Schoeters, G.; Verheyen, V.; Colles, A.; Remy, S.; Martin, L.R.; Govarts, E.; Nelen, V.; Hond, E.D.; De Decker, A.; Franken, C.; et al. Internal exposure of Flemish teenagers to environmental pollutants: Results of the Flemish Environment and Health Study 2016–2020 (FLEHS IV). Int. J. Hyg. Environ. Health 2022, 242, 113972. [Google Scholar] [CrossRef]
- Wennberg, M.; Lundh, T.; Sommar, J.N.; Bergdahl, I.A. Time trends and exposure determinants of lead and cadmium in the adult population of northern Sweden 1990–2014. Environ. Res. 2017, 159, 111–117. [Google Scholar] [CrossRef] [PubMed]
- EU Commission. COMMISSION REGULATION (EU) 2018/213—Of 12 February 2018—On the use of bisphenol A in varnishes and coatings intended to come into contact with food and amending Regulation (EU) No 10/2011 as regards the use of that substance in plastic food contact materials. Off. J. Eur. Union. 2018, L41, 6–12. [Google Scholar]
- Koch, H.M.; Kolossa-Gehring, M.; Schröter-Kermani, C.; Angerer, J.; Brüning, T. Bisphenol A in 24 h urine and plasma samples of the German Environmental Specimen Bank from 1995 to 2009: A retrospective exposure evaluation. J. Expo. Sci. Environ. Epidemiol. 2012, 22, 610–616. [Google Scholar] [CrossRef]
- Huang, R.-P.; Liu, Z.-H.; Yin, H.; Dang, Z.; Wu, P.-X.; Zhu, N.-W.; Lin, Z. Bisphenol A concentrations in human urine, human intakes across six continents, and annual trends of average intakes in adult and child populations worldwide: A thorough literature review. Sci. Total. Environ. 2018, 626, 971–981. [Google Scholar] [CrossRef]
- Ye, X.; Wong, L.-Y.; Kramer, J.; Zhou, X.; Jia, T.; Calafat, A.M. Urinary Concentrations of Bisphenol A and Three Other Bisphenols in Convenience Samples of U.S. Adults during 2000–2014. Environ. Sci. Technol. 2015, 49, 11834–11839. [Google Scholar] [CrossRef]
- EU—REACH: Restriction of PAHs Extends to Consumer Products. 2014. Available online: https://www.intertek.com/consumer/insight-bulletins/restriction-of-pahs-to-consumer-products/ (accessed on 1 August 2023).
- Commission Regulation (EU) No 1272/2013 of 6 December 2013 Amending Annex XVII to Regulation (EC) No 1907/2006 of the European Parliament and of the Council on the Registration, Evaluation, Authorisation and Restriction of Chemicals (REACH) as Regards Polycyclic Aromatic Hydrocarbons (Text with EEA Relevance). Available online: https://eur-lex.europa.eu/LexUriServ/LexUriServ.do?uri=OJ:L:2013:328:0069:0071:en:PDF (accessed on 1 August 2023).
- Huang, X.; Deng, X.; Li, W.; Liu, S.; Chen, Y.; Yang, B.; Liu, Q. Internal exposure levels of polycyclic aromatic hydrocarbons in children and adolescents: A systematic review and meta-analysis. Environ. Health Prev. Med. 2019, 24, 50. [Google Scholar] [CrossRef]
- Burkhardt, T.; Scherer, M.; Scherer, G.; Pluym, N.; Weber, T.; Kolossa-Gehring, M. Time trend of exposure to secondhand tobacco smoke and polycyclic aromatic hydrocarbons between 1995 and 2019 in Germany—Showcases for successful European legislation. Environ. Res. 2023, 216, 114638. [Google Scholar] [CrossRef] [PubMed]
- Kim, H.-W.; Kam, S.; Lee, D.-H. Synergistic interaction between polycyclic aromatic hydrocarbons and environmental tobacco smoke on the risk of obesity in children and adolescents: The U.S. National Health and Nutrition Examination Survey 2003–2008. Environ. Res. 2014, 135, 354–360. [Google Scholar] [CrossRef]
- Huang, W.; Caudill, S.P.; Grainger, J.; Needham, L.L.; Patterson, D.G. Levels of 1-hydroxypyrene and other monohydroxy polycyclic aromatic hydrocarbons in children: A study based on U.S. reference range values. Toxicol. Lett. 2006, 163, 10–19. [Google Scholar] [CrossRef] [PubMed]
- Council Recommendation of 30 November 2009 on smoke-free environments (2009/C 296/02). Off. J. Eur. Union 2009, 4–14.
- Kolossa-Gehring, M.; Pack, L.K.; Hülck, K.; Gehring, T. HBM4EU from the Coordinator’s perspective: Lessons learnt from managing a large-scale EU project. Int. J. Hyg. Environ. Health 2023, 247, 114072. [Google Scholar] [CrossRef] [PubMed]


Disclaimer/Publisher’s Note: The statements, opinions and data contained in all publications are solely those of the individual author(s) and contributor(s) and not of MDPI and/or the editor(s). MDPI and/or the editor(s) disclaim responsibility for any injury to people or property resulting from any ideas, methods, instructions or products referred to in the content. |
© 2023 by the authors. Licensee MDPI, Basel, Switzerland. This article is an open access article distributed under the terms and conditions of the Creative Commons Attribution (CC BY) license (https://creativecommons.org/licenses/by/4.0/).
Share and Cite
Rodriguez Martin, L.; Gilles, L.; Helte, E.; Åkesson, A.; Tägt, J.; Covaci, A.; Sakhi, A.K.; Van Nieuwenhuyse, A.; Katsonouri, A.; Andersson, A.-M.; et al. Time Patterns in Internal Human Exposure Data to Bisphenols, Phthalates, DINCH, Organophosphate Flame Retardants, Cadmium and Polyaromatic Hydrocarbons in Europe. Toxics 2023, 11, 819. https://doi.org/10.3390/toxics11100819
Rodriguez Martin L, Gilles L, Helte E, Åkesson A, Tägt J, Covaci A, Sakhi AK, Van Nieuwenhuyse A, Katsonouri A, Andersson A-M, et al. Time Patterns in Internal Human Exposure Data to Bisphenols, Phthalates, DINCH, Organophosphate Flame Retardants, Cadmium and Polyaromatic Hydrocarbons in Europe. Toxics. 2023; 11(10):819. https://doi.org/10.3390/toxics11100819
Chicago/Turabian StyleRodriguez Martin, Laura, Liese Gilles, Emilie Helte, Agneta Åkesson, Jonas Tägt, Adrian Covaci, Amrit K. Sakhi, An Van Nieuwenhuyse, Andromachi Katsonouri, Anna-Maria Andersson, and et al. 2023. "Time Patterns in Internal Human Exposure Data to Bisphenols, Phthalates, DINCH, Organophosphate Flame Retardants, Cadmium and Polyaromatic Hydrocarbons in Europe" Toxics 11, no. 10: 819. https://doi.org/10.3390/toxics11100819
APA StyleRodriguez Martin, L., Gilles, L., Helte, E., Åkesson, A., Tägt, J., Covaci, A., Sakhi, A. K., Van Nieuwenhuyse, A., Katsonouri, A., Andersson, A.-M., Gutleb, A. C., Janasik, B., Appenzeller, B., Gabriel, C., Thomsen, C., Mazej, D., Sarigiannis, D., Anastasi, E., Barbone, F., ... Govarts, E. (2023). Time Patterns in Internal Human Exposure Data to Bisphenols, Phthalates, DINCH, Organophosphate Flame Retardants, Cadmium and Polyaromatic Hydrocarbons in Europe. Toxics, 11(10), 819. https://doi.org/10.3390/toxics11100819