
Evaluation of In Vitro Cytotoxic, Genotoxic, Apoptotic, and Cell Cycle Arrest Potential of Iron–Nickel Alloy Nanoparticles


Abstract
:1. Introduction
2. Materials and Methods
2.1. Chemical and Reagents
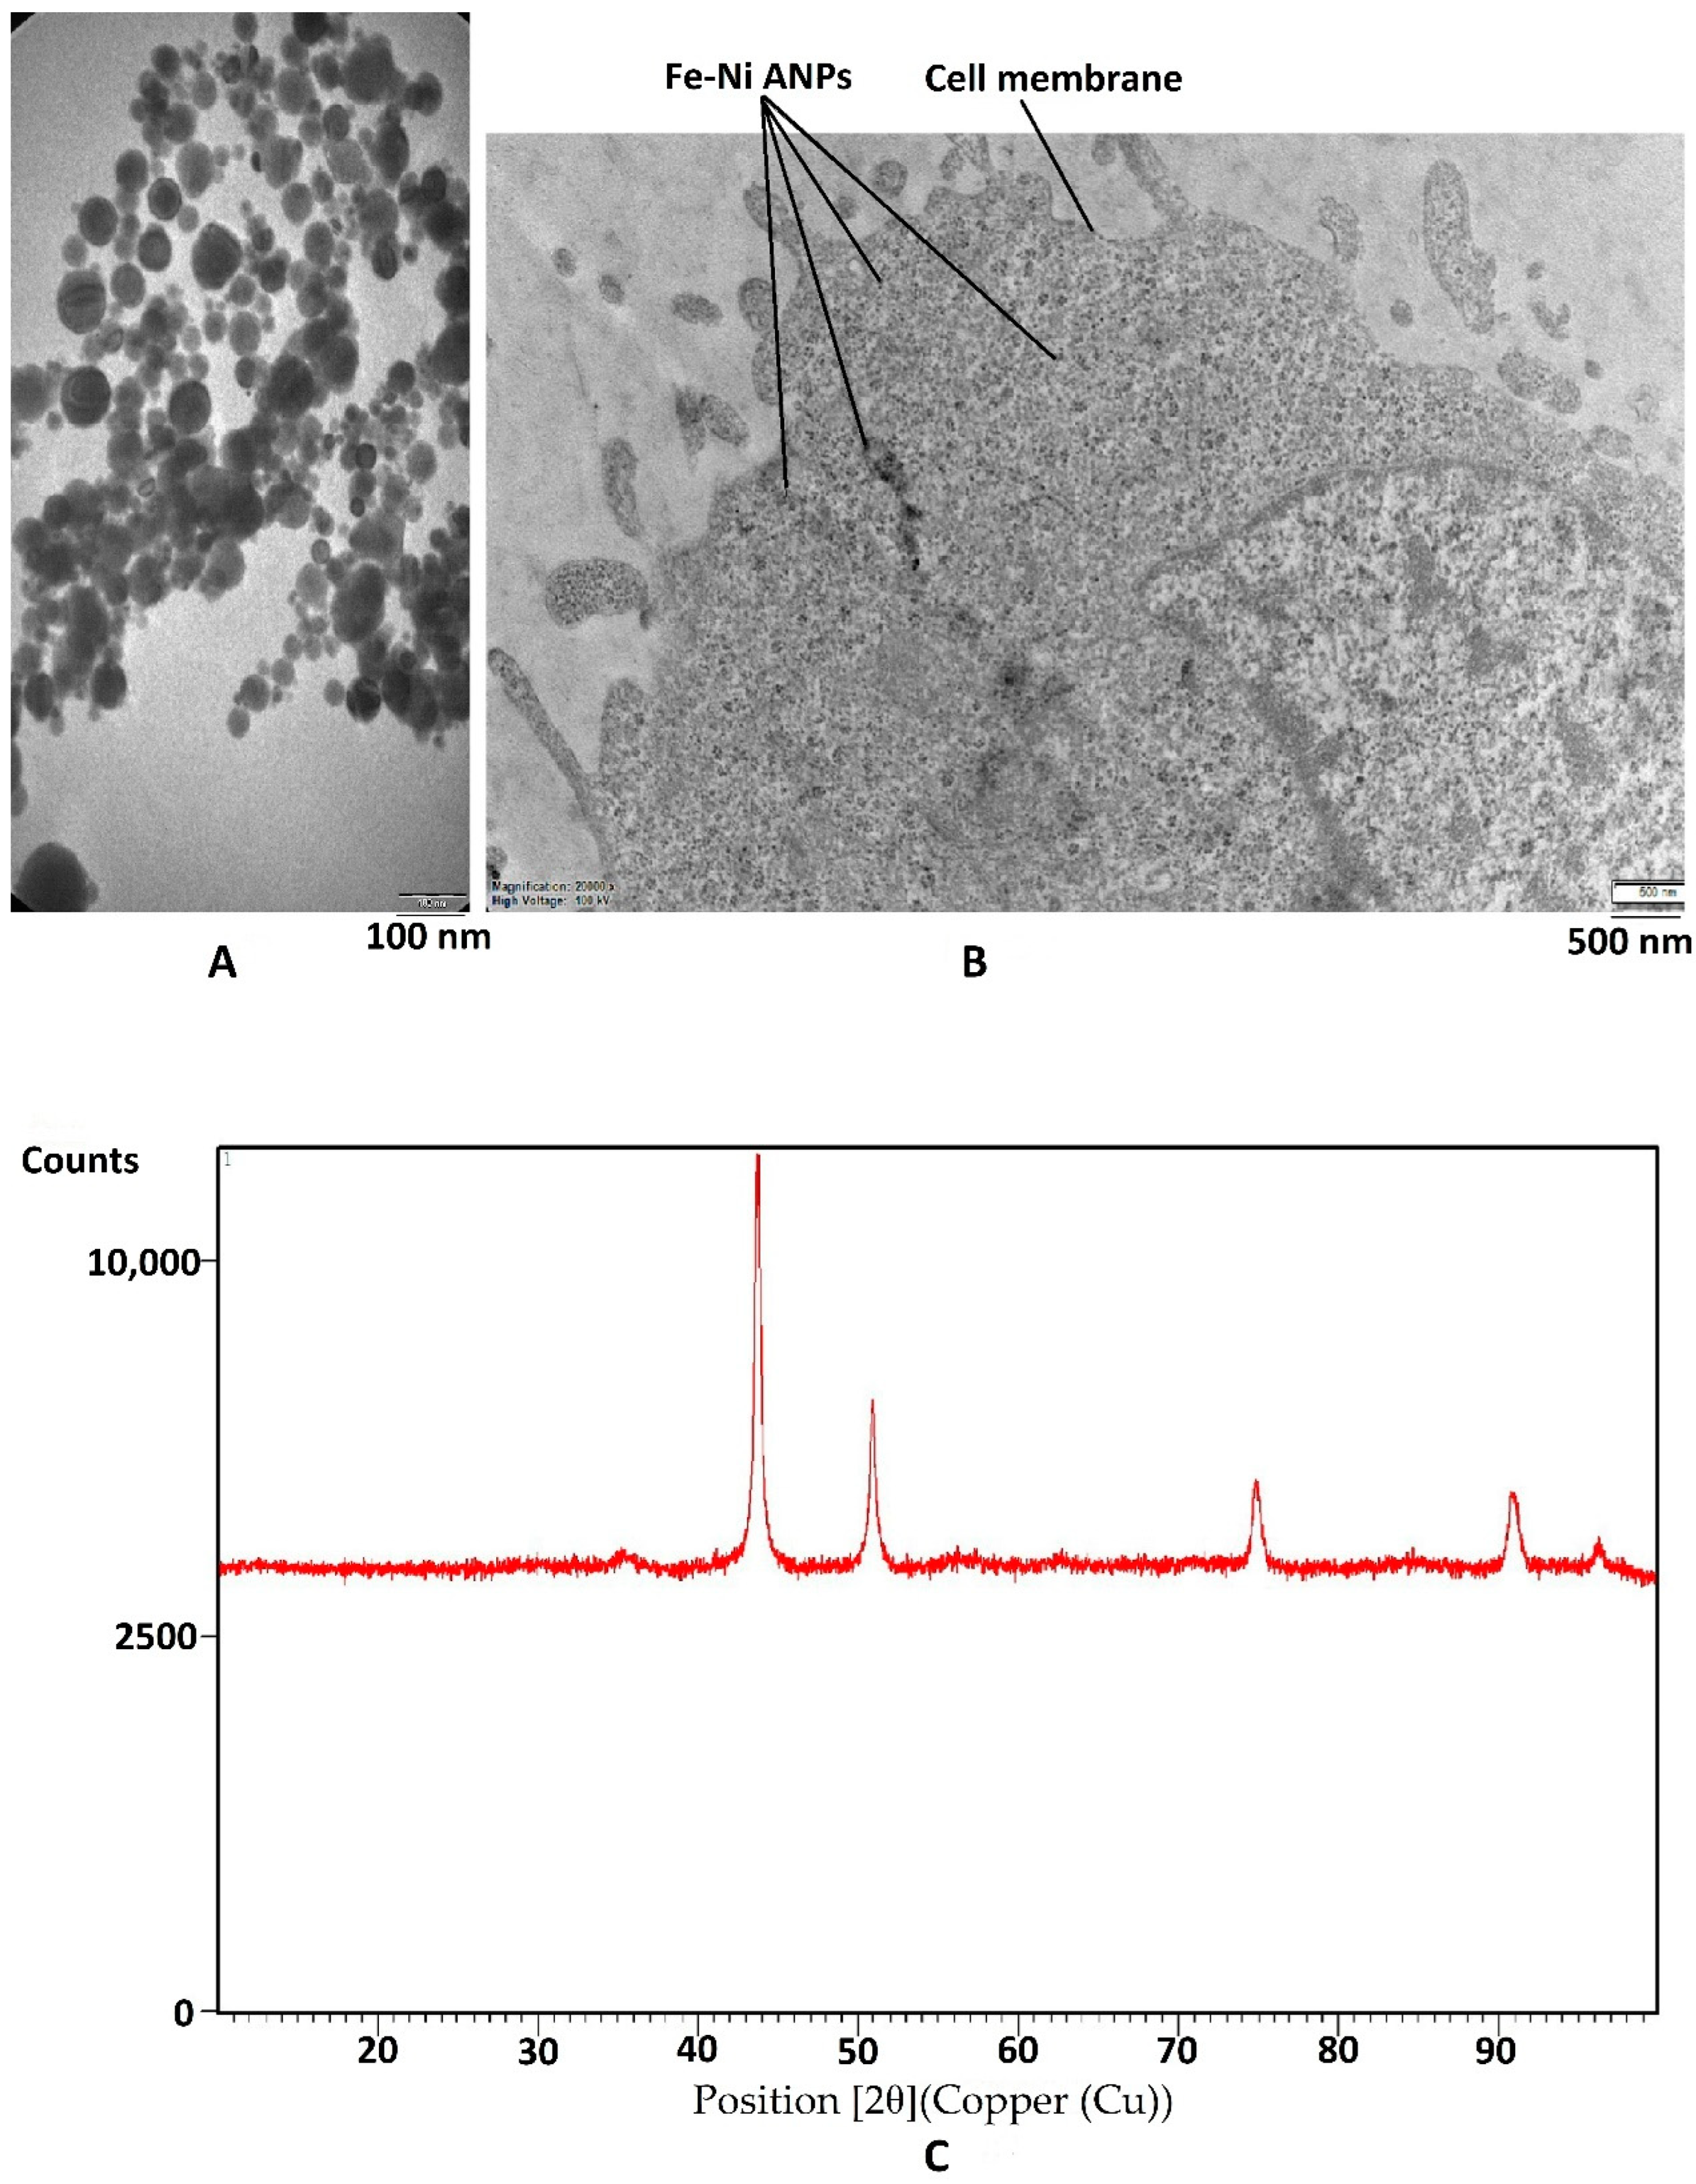
2.2. Characterization of Fe-Ni ANPs
2.3. Cell Culture
2.4. Cytotoxicity
2.4.1. XTT Assay
2.4.2. Clonogenic Assay
2.5. Genotoxicity
2.5.1. Comet Assay
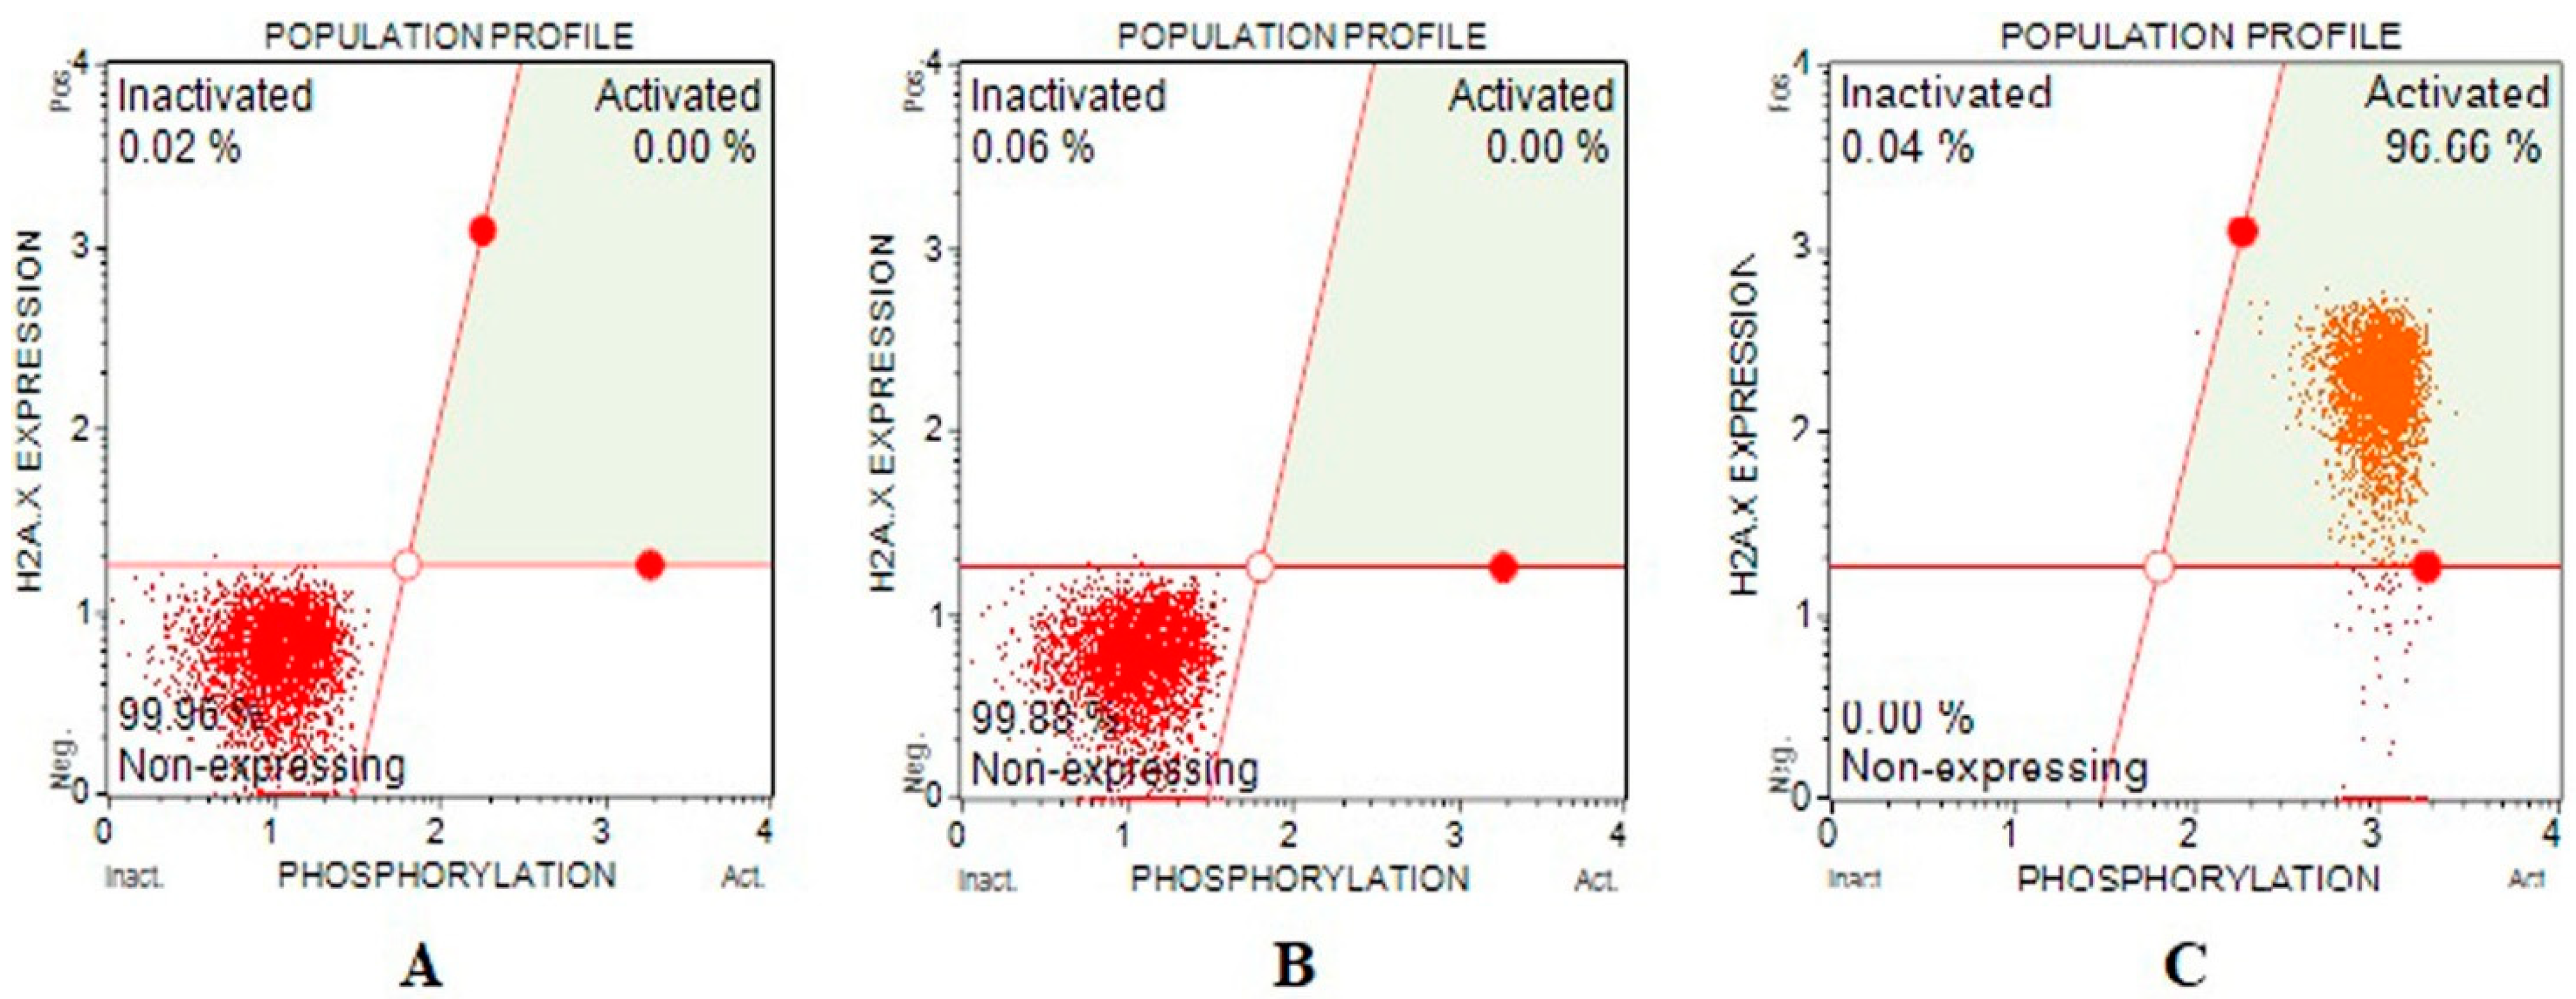
2.5.2. Gamma-H2AX Assay
2.6. Cell Death Mode
2.6.1. Annexin V Analysis
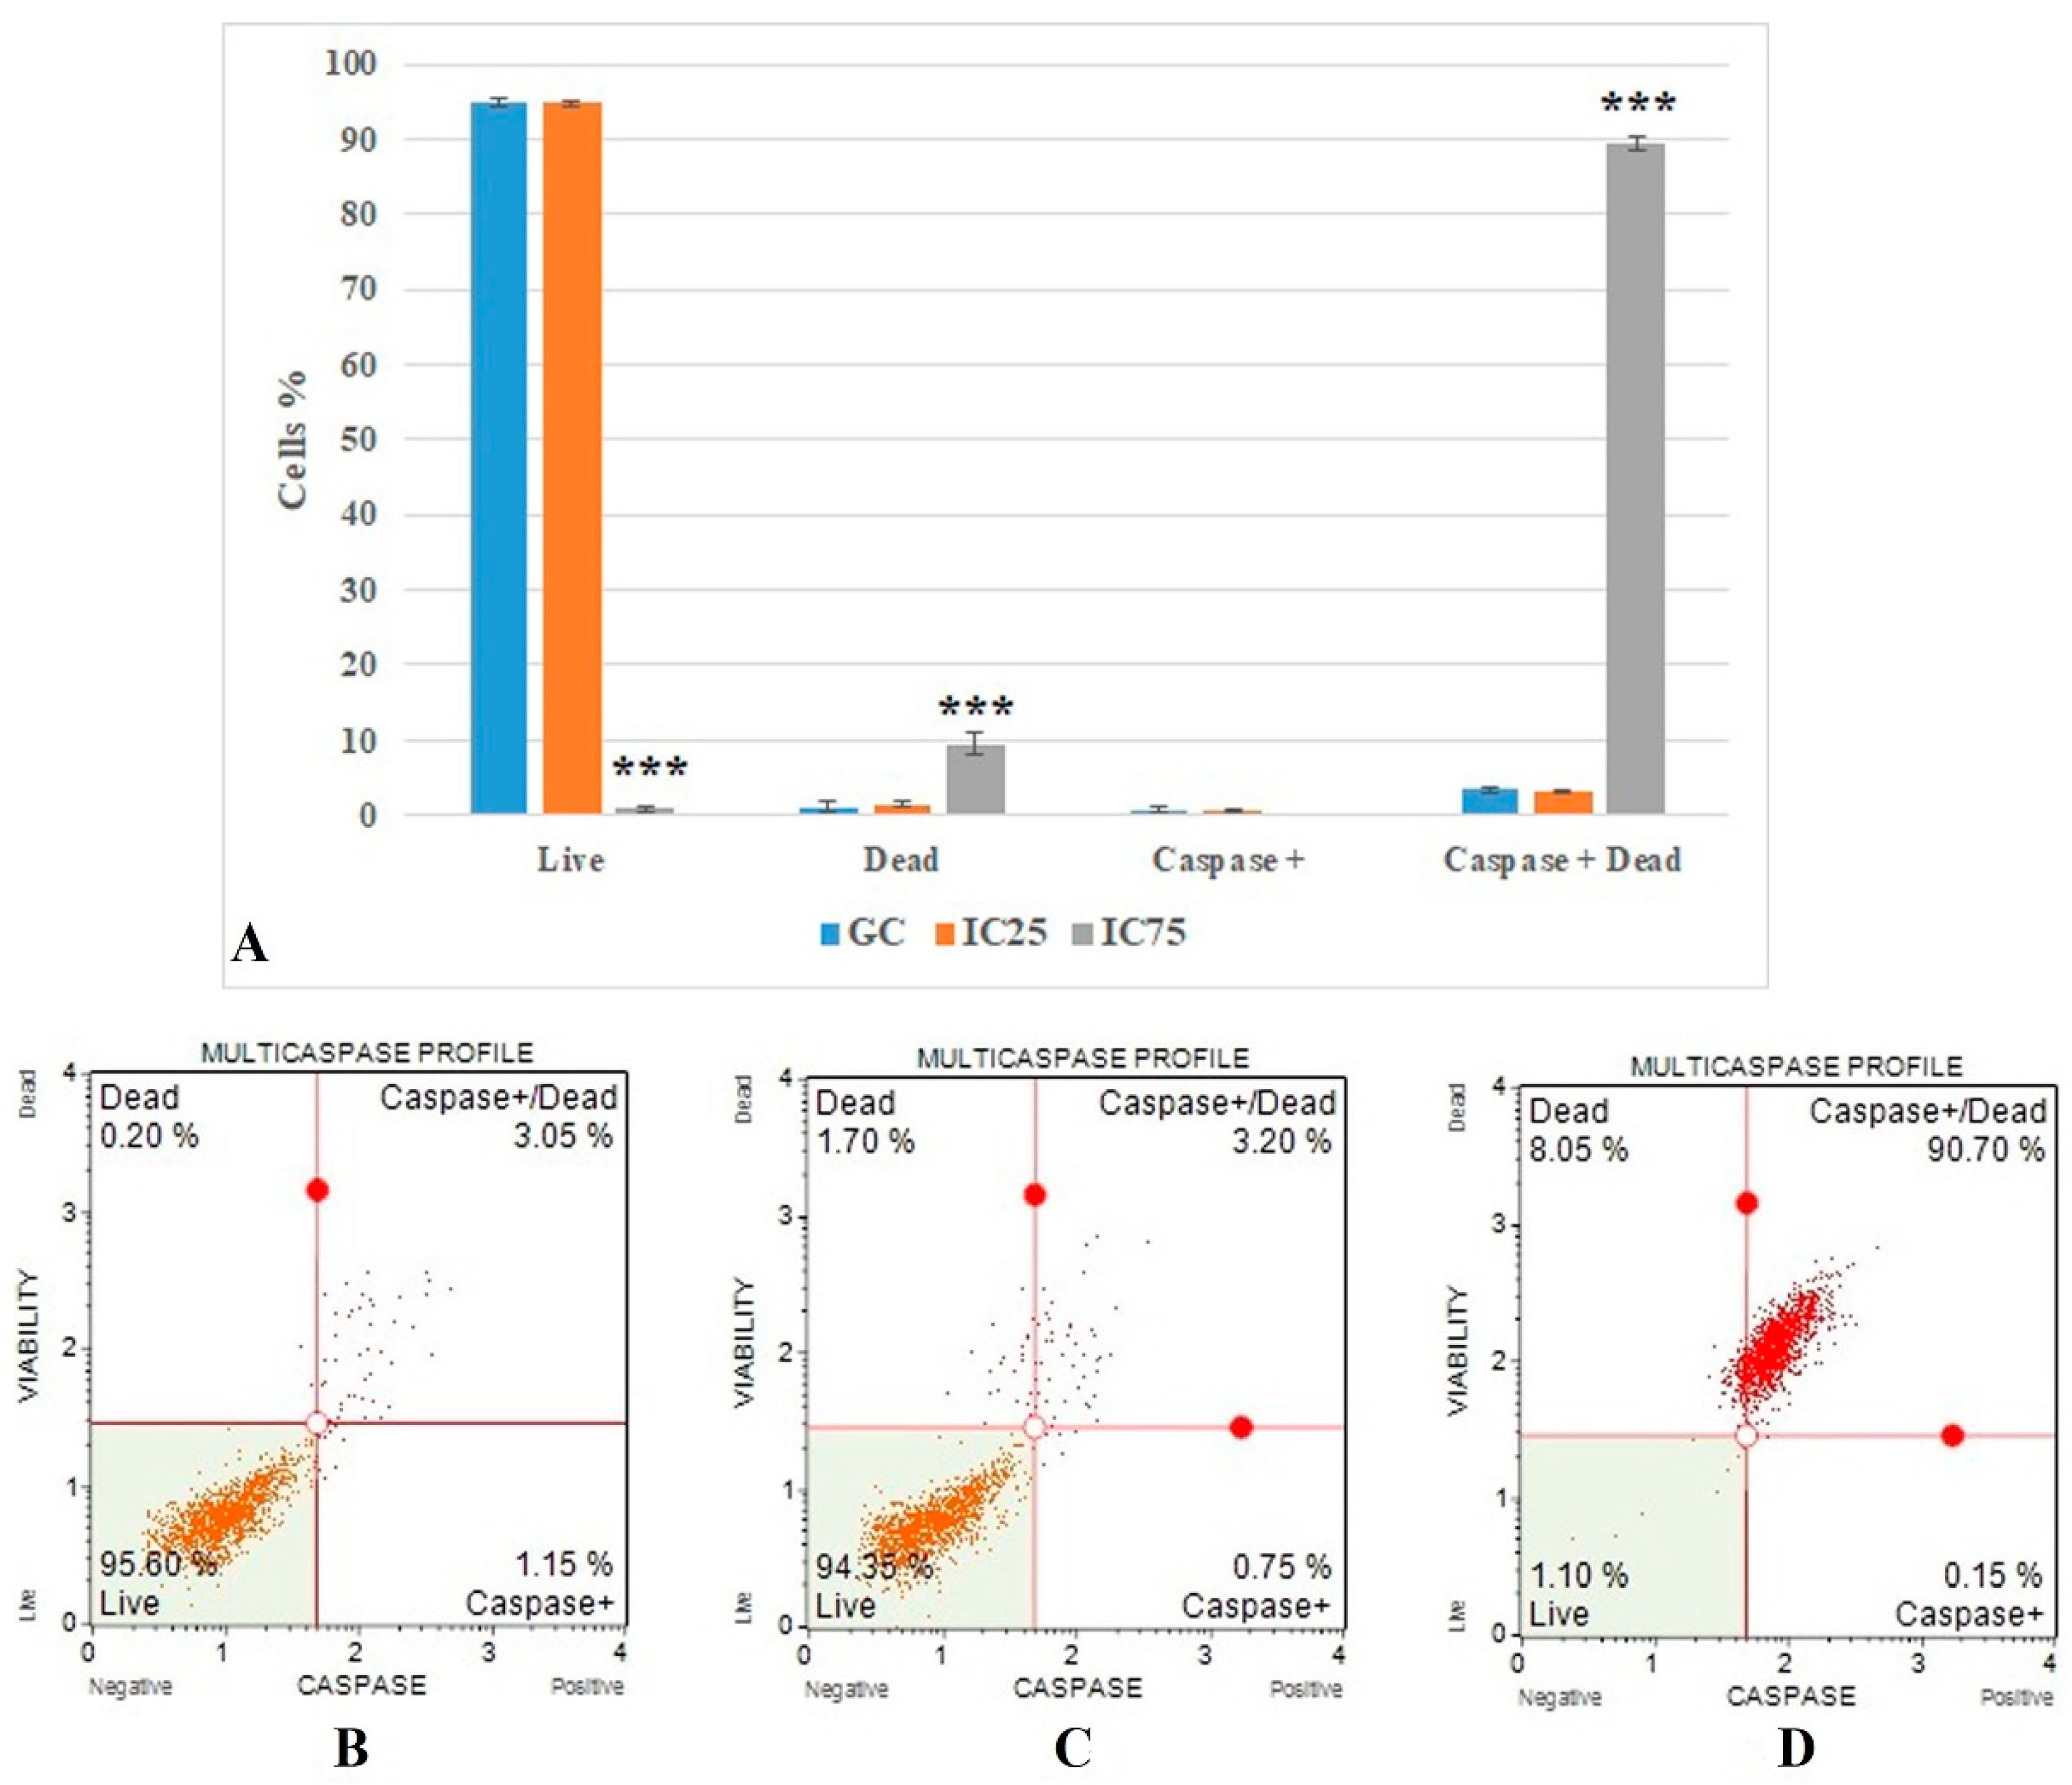
2.6.2. Multicaspase Analysis
2.7. Cell Cycle Arrested Analysis
2.8. Measurement of Intracellular ROS
2.9. Statistical Analyses
3. Results
3.1. Characterization of Nanoparticles
3.2. Cytotoxicity
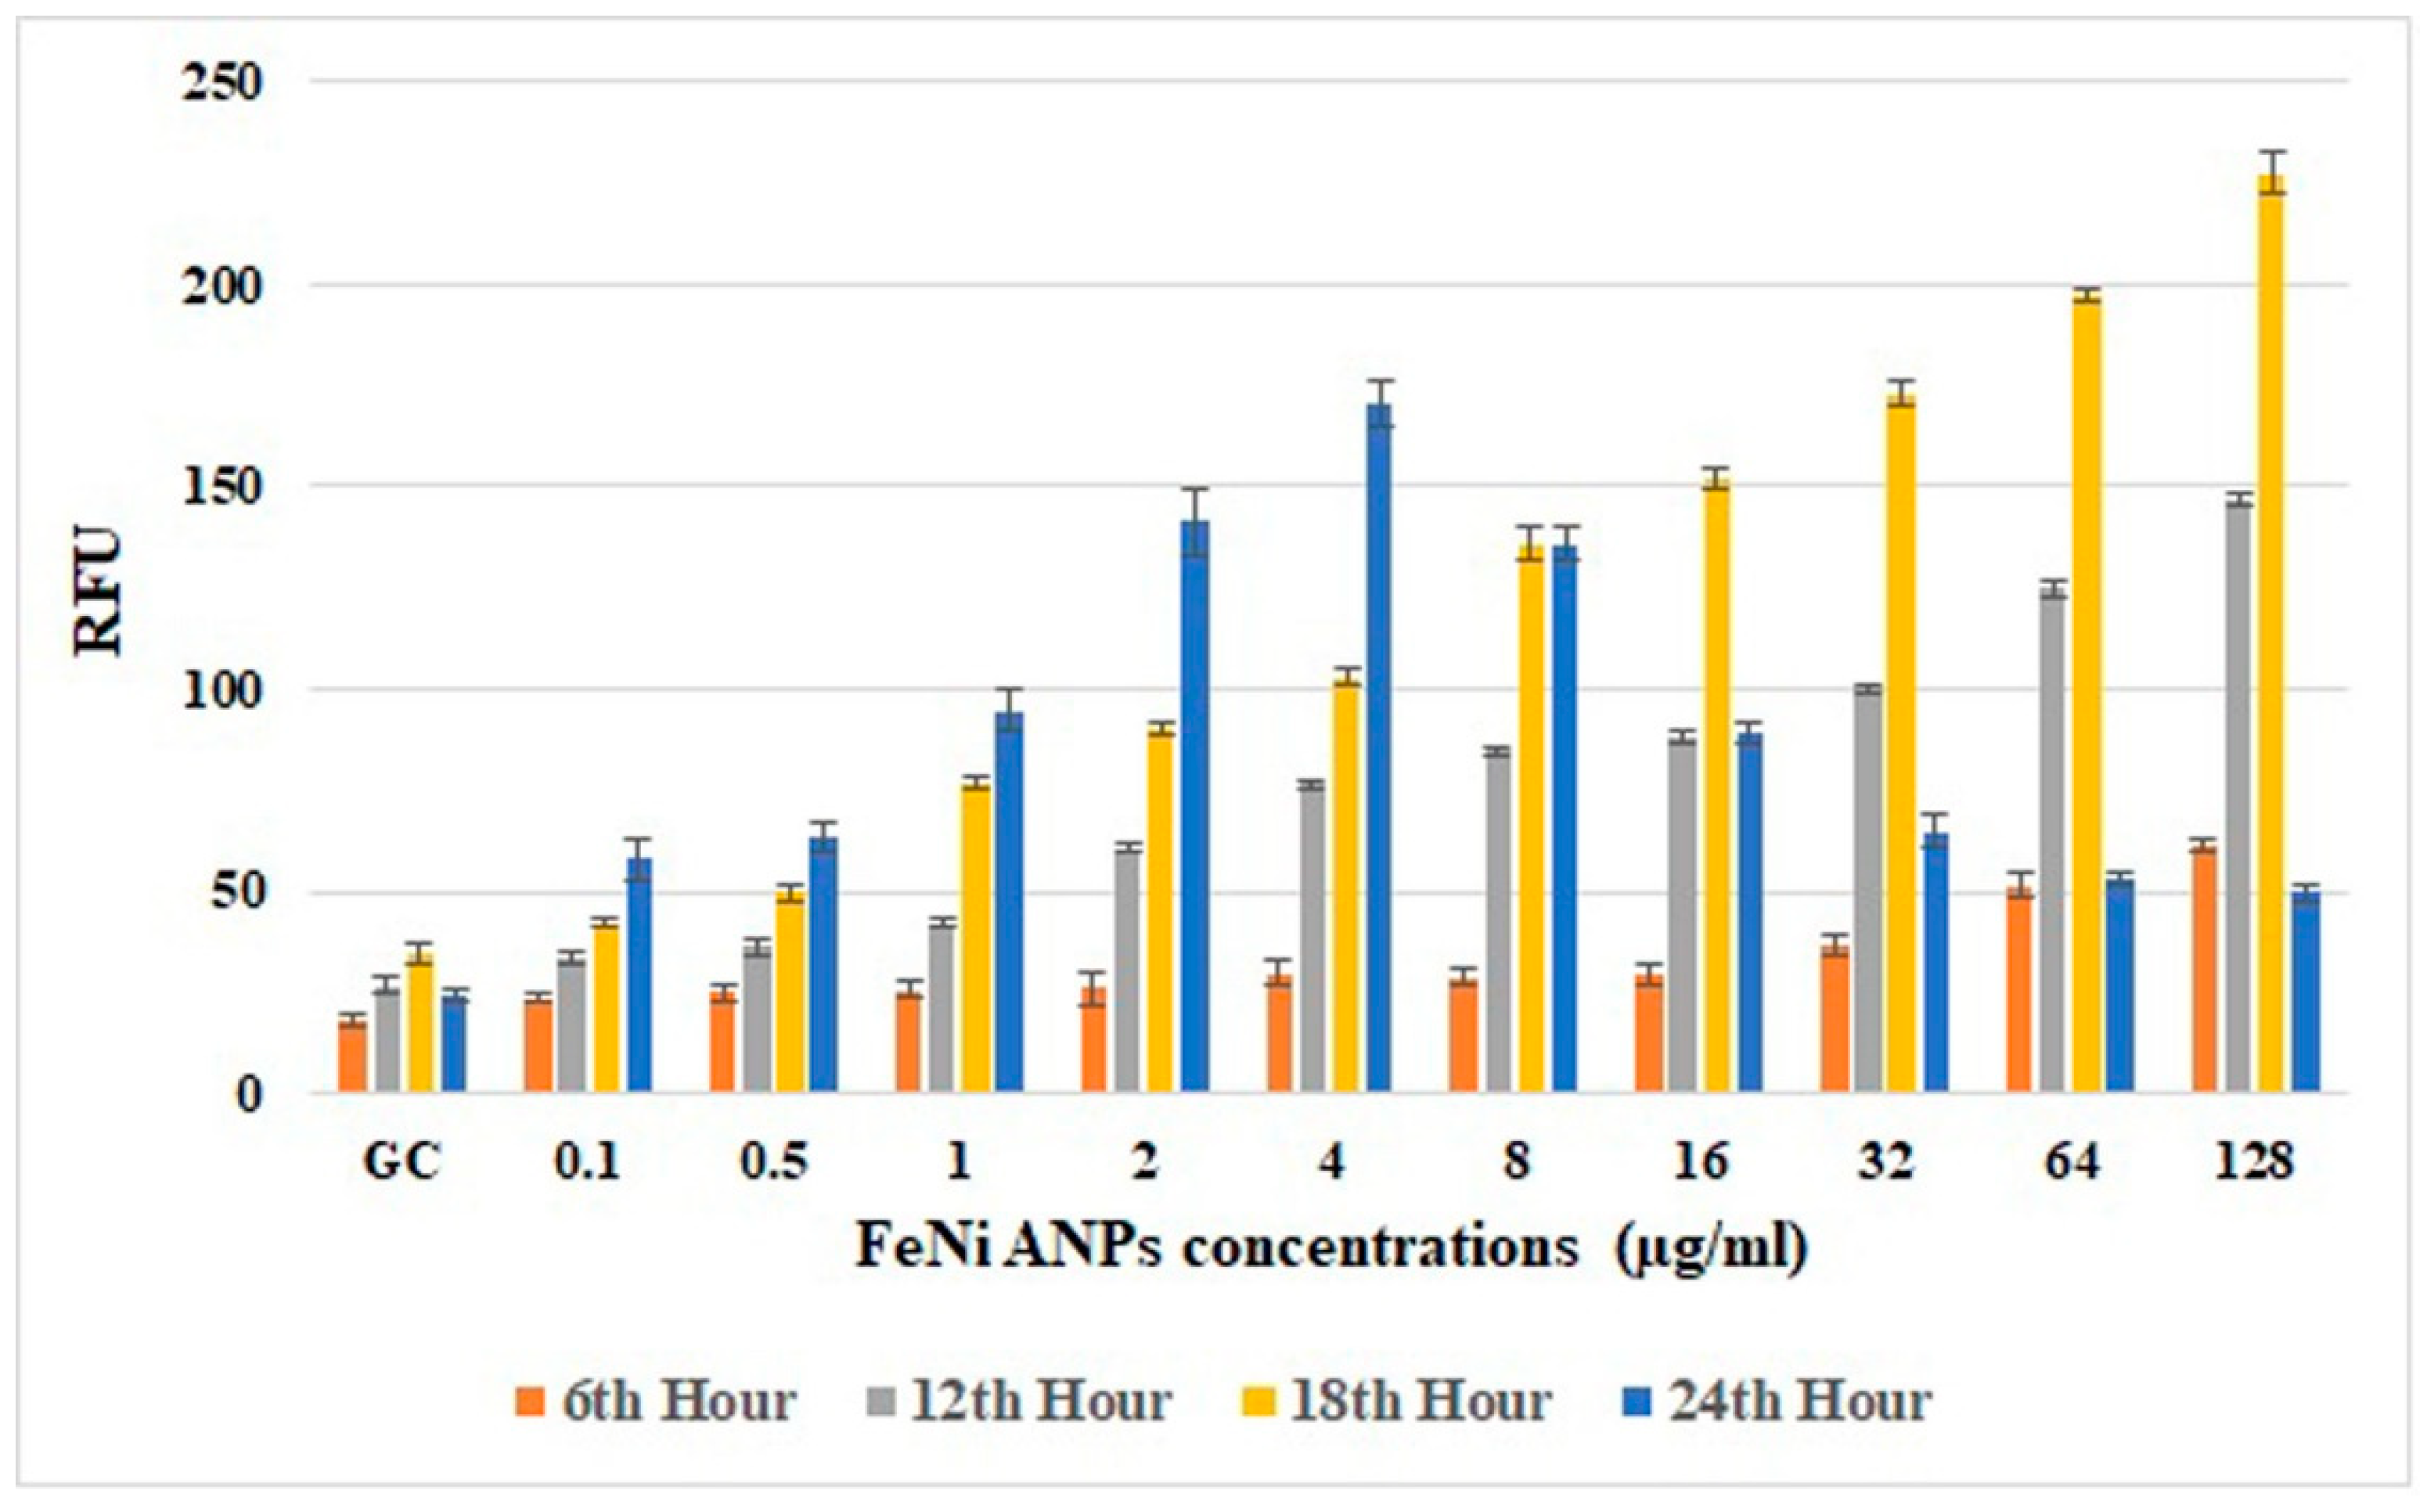
3.3. Genotoxicity
3.4. Cell Death Mode
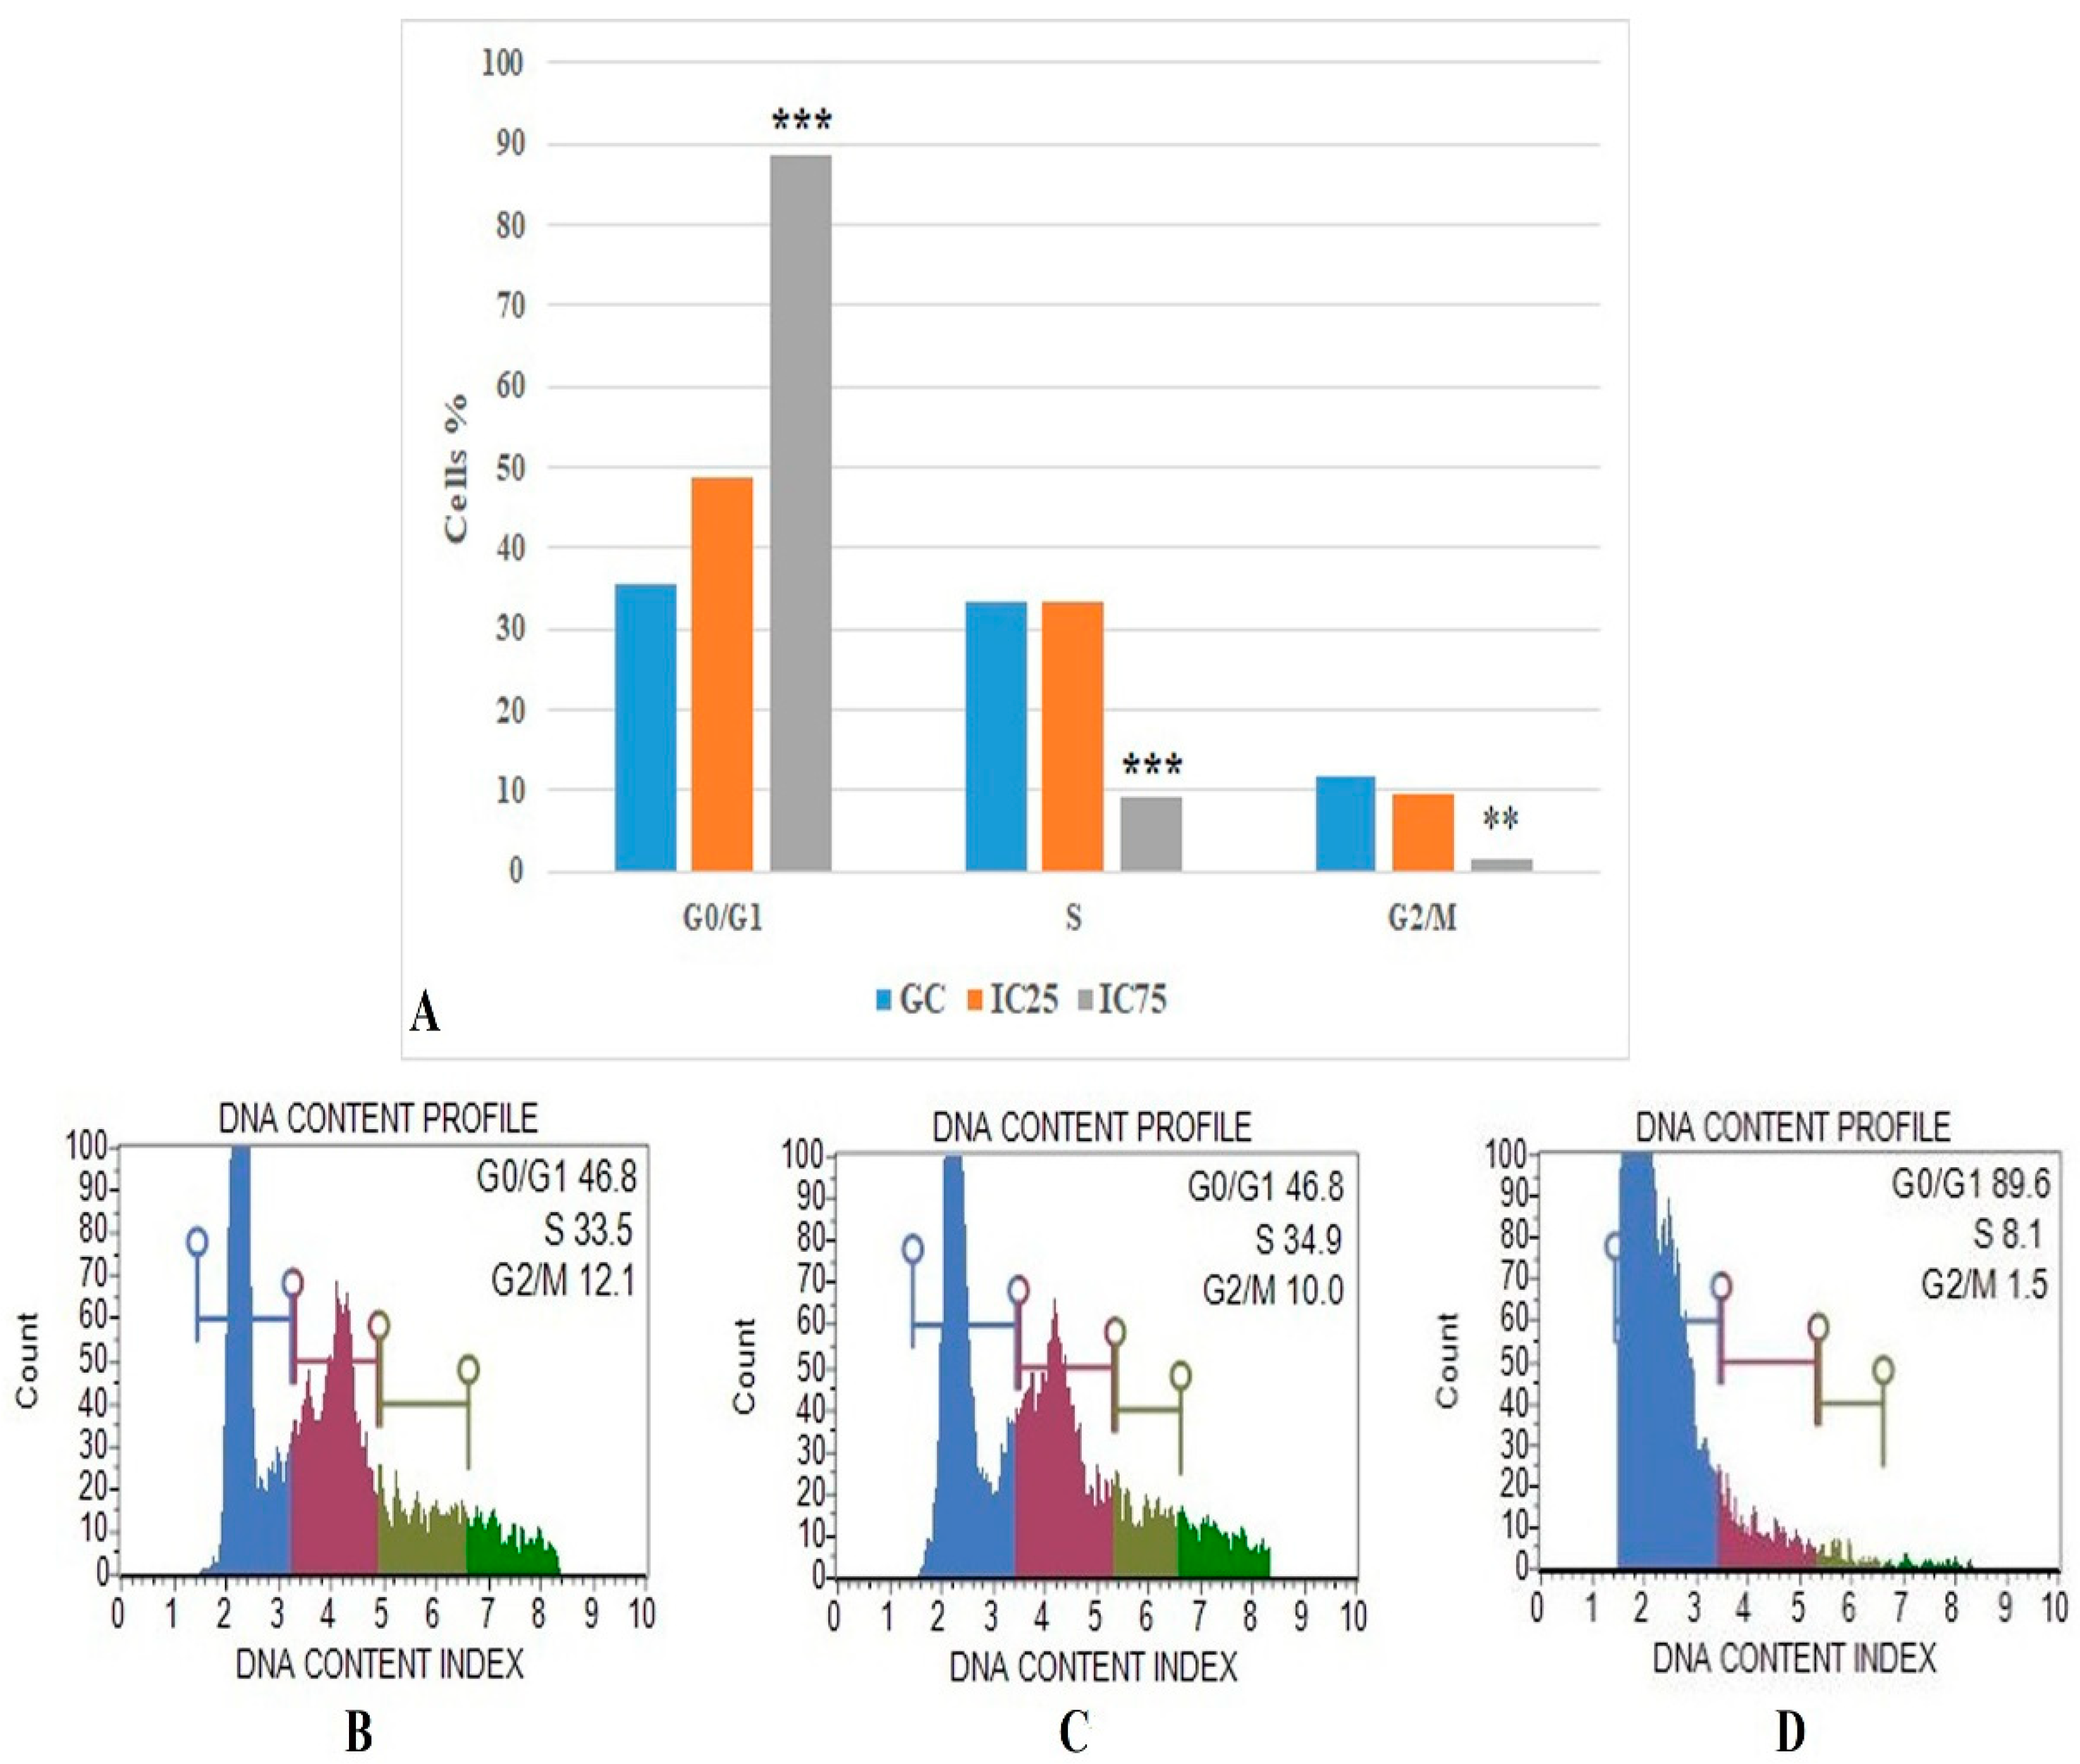
3.5. Cell Cycle Arrested Analysis
3.6. Amount of Intracellular ROS
4. Discussion
Funding
Institutional Review Board Statement
Informed Consent Statement
Data Availability Statement
Conflicts of Interest
References
- Davarpanah, A.M.; Mirzae, A.; Sargazi, M.; Feizi, M. Magnetic properties of Fe-Ni nanoparticles prepared by co-precipitation method. J. Phys. Conf. Ser. 2008, 126, 012065. [Google Scholar] [CrossRef]
- Khan, H.A.; Shanker, R. Toxicity of Nanomaterials. Biomed Res. Int. 2015, 2015, 521014. [Google Scholar] [CrossRef] [PubMed]
- Sun, C.; Lee, J.; Zhang, M. Magnetic nanoparticles in MR imaging and drug delivery. Adv. Drug Deliv. Rev. 2008, 60, 1252–1265. [Google Scholar] [CrossRef] [Green Version]
- Pankhurst, Q.A.; Connolly, J.; Jones, S.K.; Dobson, J. Applications of magnetic nanoparticles in biomedicine. J. Phys. D Appl. Phys. 2003, 36, R167–R181. [Google Scholar] [CrossRef] [Green Version]
- Corot, C.; Robert, P.; Idee, J.M.; Port, M. Recent advances in iron oxide nanocrystal technology for medical imaging. Adv. Drug Deliv. Rev. 2006, 58, 1471–1504. [Google Scholar] [CrossRef]
- Dobson, J. Magnetic nanoparticles for drug delivery. Drug Dev. Res. 2006, 67, 55–60. [Google Scholar] [CrossRef]
- Bhingardive, V.; Suwas, S.; Bose, S. New physical insights into the electromagnetic shielding efficiency in PVDF nanocomposites containing multiwall carbon nanotubes and magnetic nanoparticles. RSC Adv. 2015, 5, 79463–79472. [Google Scholar] [CrossRef]
- Cai, N.; Yang, H.P.; Zhang, X.; Xia, S.W.; Yao, D.D.; Bartocci, P.; Fantozzi, F.; Chen, Y.Q.; Chen, H.P.; Williams, P.T. Bimetallic carbon nanotube encapsulated Fe-Ni catalysts from fast pyrolysis of waste plastics and their oxygen reduction properties. Waste Manag. 2020, 109, 119–126. [Google Scholar] [CrossRef]
- Dijith, K.S.; Aiswarya, R.; Praveen, M.; Pillai, S.; Surendran, K.P. Polyol derived Ni and NiFe alloys for effective shielding of electromagnetic interference. Mater. Chem. Front. 2018, 2, 1829–1841. [Google Scholar] [CrossRef]
- Lu, X.G.; Liu, Q.R.; Huo, G.; Liang, G.Y.; Sun, Q.J.; Song, X.P. CTAB-mediated synthesis of iron-nickel alloy nanochains and their magnetic properties. Colloid Surf. A 2012, 407, 23–28. [Google Scholar] [CrossRef]
- Menon, A.V.; Madras, G.; Bose, S. Magnetic Alloy-MWNT Heterostructure as Efficient Electromagnetic Wave Suppressors in Soft Nanocomposites. ChemistrySelect 2017, 2, 7831–7844. [Google Scholar] [CrossRef]
- Nadarajah, R.; Tasdemir, L.; Thiel, C.; Salamon, S.; Semisalova, A.S.; Wende, H.; Farle, M.; Barcikowski, S.; Erni, D.; Gökce, B. Formation of Fe-Ni Nanoparticle Strands in Macroscopic Polymer Composites: Experiment and Simulation. Nanomaterials 2021, 11, 2095. [Google Scholar] [CrossRef]
- Akedo, K.; Ishizaki, T.; Yatsugi, K. Structural and magnetic properties of size-controlled Fe-Ni nanoparticles synthesized by diffusing Fe atoms into preformed Ni nanoparticles. J. Nanopart. Res. 2021, 23, 107. [Google Scholar] [CrossRef]
- Acharya, P.; Nelson, Z.J.; Benamara, M.; Manso, R.H.; Bakovic, S.I.P.; Abolhassani, M.; Lee, S.; Reinhart, B.; Jingyi Chen, J.; Greenlee, L.F. Chemical Structure of Fe-Ni Nanoparticles for Efficient Oxygen Evolution Reaction Electrocatalysis. ACS Omega 2019, 4, 17209–17222. [Google Scholar] [CrossRef] [PubMed] [Green Version]
- Huang, J.F.; Xie, W.Z. Pseudo-atomic-scale metals well-dispersed on nano-carbons as ultra-low metal loading oxygenevolving electrocatalysts. Chem. Sci. 2020, 11, 6012. [Google Scholar] [CrossRef]
- Wang, Q.; Song, Y.; Sun, D.; Zhang, L. MOF-Derived Fe-Doped Ni@NC Hierarchical Hollow Microspheres as an Efficient Electrocatalyst for Alkaline Oxygen Evolution Reaction. ACS Omega 2021, 6, 11077–11082. [Google Scholar] [CrossRef] [PubMed]
- Wang, F.G.; Bin Liu, B.; Wang, H.Y.; Lin, Z.Y.; Dong, Y.W.; Yu, N.; Luan, R.N.; Chai, Y.M.; Dong, B. Motivating borate doped FeNi layered double hydroxides by molten salt method toward efficient oxygen evolution. J. Colloid Interface Sci. 2022, 610, 173–181. [Google Scholar] [CrossRef]
- Wang, H.; Zhuang, M.; Shan, L.; Wu, J.; Quan, G.; Cui, L.; Zhang, Y.; Yan, J. Bimetallic FeNi nanoparticles immobilized by biomass-derived hierarchically porous carbon for efficient removal of Cr(VI) from aqueous solution. J. Hazard. Mater. 2022, 423, 127098. [Google Scholar] [CrossRef] [PubMed]
- Ren, G.; Shi, Y.; Cai, Y.; Yuan, L.; Wua, K.; Ouyanga, M.; Zhenga, K. Removal of triclosan from water by sepiolite supported bimetallic Fe/Ni nanoparticles. Environ. Technol. 2021, 15, 1–10. [Google Scholar] [CrossRef]
- Zhou, P. Polyacrylic acid-b-polyptyrene covered Ni/Fe nanoparticles to remove 1,1,1-trichloroethane in water. J. Environ. Sci. Health-Toxic/H 2021, 56, 928–936. [Google Scholar] [CrossRef]
- Zhang, T.; Jin, X.; Owens, G.; Chen, Z. Remediation of malachite green in wastewater by ZIF-8@Fe/Ni nanoparticles based on adsorption and reduction. J. Colloid Interface Sci. 2021, 594, 398–408. [Google Scholar] [CrossRef]
- Zhang, Z.; Hu, Y.B.; Ruan, W.; Ai, H.; Yuan, B.; Fu, M.L. Highly improved dechlorination of 2,4-dichlorophenol in aqueous solution by Fe/Ni nanoparticles supported by polystyrene resin. Chemosphere 2021, 266, 128976. [Google Scholar] [CrossRef] [PubMed]
- Valiyeva, G.G.; Bavasso, I.; Di Palma, L.; Hajiyeva, S.R.; Ramazanov, M.A.; Hajiyeva, F.V. Synthesis of Fe/Ni Bimetallic Nanoparticles and Application to the Catalytic Removal of Nitrates from Water. Nanomaterials 2019, 9, 1130. [Google Scholar] [CrossRef] [Green Version]
- Dong, H.; Cheng, Y.; Lu, Y.; Hou, K.; Zhang, L.; Li, L.; Wang, B.; Wang, Y.; Ning, Q.; Zeng, G. Comparison of toxicity of Fe/Ni and starch-stabilized Fe/Ni nanoparticles toward Escherichia coli. Sep. Purif. Technol. 2019, 210, 504–510. [Google Scholar] [CrossRef]
- Hassanein, A.; Keller, E.; Lansing, S. Effect of metal nanoparticles in anaerobic digestion production and plant uptake from effluent fertilizer. Bioresour. Technol. 2021, 321, 124455. [Google Scholar] [CrossRef] [PubMed]
- Souza, I.; Morozesk, M.; Siqueira, P.; Zini, E.; Galter, I.N.; Moraes, D.A.; Matsumoto, S.T.; Wunderlin, D.A.; Elliott, M.; Fernandes, M.N. Metallic nanoparticle contamination from environmental atmospheric particulate matter in the last slab of the trophic chain: Nanocrystallography, subcellular localization and toxicity effects. Sci. Total Environ. 2022, 814, 152685. [Google Scholar] [CrossRef]
- Lu, S.; Zhang, W.; Zhang, R.; Liu, P.; Wang, Q.; Shang, Y.; Wu, M.; Donaldson, K.; Wang, Q. Comparison of cellular toxicity caused by ambient ultrafine particles and engineered metal oxide nanoparticles. Part. Fibre Toxicol. 2015, 12, 5. [Google Scholar] [CrossRef] [Green Version]
- Machado, B.I.; Murr, L.E.; Suro, R.M.; Gaytan, S.M.; Ramirez, D.A.; Garza, K.M.; Schuster, B.E. Characterization and cytotoxic assessment of ballistic aerosol particulates for tungsten alloy penetrators into steel target plates. Int. J. Environ. Res. Public Health 2010, 7, 3313–3331. [Google Scholar] [CrossRef]
- Bhushan, M.; Kumar, Y.; Periyasamy, L.; Viswanath, A.K. Fabrication and a detailed study of antibacterial properties of α-Fe2O3/NiO nanocomposites along with their structural, optical, thermal, magnetic and cytotoxic features. Nanotechnology 2019, 30, 185101. [Google Scholar] [CrossRef]
- Jiang, C.; Liu, Y.; Chen, Z.; Megharaj, M.; Naidu, R. Impact of iron-based nanoparticles on microbial denitrification by Paracoccus sp. strain YF1. Aquat. Toxicol. 2013, 142–143, 329–335. [Google Scholar] [CrossRef]
- Pope, C.G. X-Ray Diffraction and the Bragg Equation. J. Chem. Educ. 1997, 74, 129. [Google Scholar] [CrossRef]
- Torres-Ramos, M.I.; Martín-Camacho, U.J.; González, J.L.; Yañez-Acosta, M.F.; Becerra-Solano, L.; Gutiérrez-Mercado, Y.K.; Macias-Carballo, M.; Gómez, C.M.; González-Vargas, O.A.; Rivera-Mayorga, J.A.; et al. A Study of Zn-Ca Nanocomposites and Their Antibacterial Properties. Int. J. Mol. Sci. 2022, 23, 7258. [Google Scholar] [CrossRef]
- Kumbıçak, U.; Cavaş, T.; Cinkılıç, N.; Kumbıçak, Z.; Vatan, O.; Yılmaz, D. Evaluation of in vitro cytotoxicity and genotoxicity of copper-zinc alloy nanoparticles in human lung epithelial cells. Food Chem. Toxicol. 2014, 73, 105–112. [Google Scholar] [CrossRef]
- Capasso, L.; Camatini, M.; Gualtieri, M. Nickel oxide nanoparticles induce inflammation and genotoxic effects in lung epithelial cells. Toxicol. Lett. 2014, 226, 28–34. [Google Scholar] [CrossRef]
- Kim, H.R.; Kim, M.J.; Lee, S.Y.; Oh, S.M.; Chung, K.H. Genotoxic effects of silver nanoparticles stimulated by oxidative stress in human normal bronchial epithelial (BEAS-2B) cells. Mutat. Res. 2011, 726, 129–135. [Google Scholar] [CrossRef]
- Berridge, M.V.; Herst, P.M.; Tan, A.S. Tetrazolium dyes as tools in cell biology: New insights into their cellular reduction. Biotechnol. Annu. Rev. 2005, 11, 127–152. [Google Scholar] [CrossRef]
- Stone, V.; Johnston, H.; Roel, P.F.; Schins, R.P.F. Development of in vitro systems for nanotoxicology: Methodological considerations. Crit. Rev. Toxicol. 2009, 39, 613–626. [Google Scholar] [CrossRef]
- İnci, D.; Aydın, R.; Vatan, O.; Zorlu, Y.; Çinkılıç, N. New binary copper (II) complexes containing intercalating ligands: DNA interactions, an unusual static quenching mechanism of BSA and cytotoxic activities. J. Biomol. Struct. Dyn. 2018, 36, 3878–3901. [Google Scholar] [CrossRef]
- Franken, N.; Rodermond, H.; Stap, J.; Haveman, J.; van Bree, C. Clonogenic assay of cells in vitro. Nat. Protoc. 2006, 1, 2315–2319. [Google Scholar] [CrossRef]
- Singh, N.P.; McCoy, M.T.; Tice, R.R.; Schneider, E.L. A simple technique for quantitation of low levels of DNA damage in individual cells. Exp. Cell Res. 1988, 175, 184–191. [Google Scholar] [CrossRef] [Green Version]
- Costa, S.; Coelho, P.; Costa, C.; Silva, S.; Mayan, O.; Santos, L.S.; Gaspar, J.; Teixeira, J.P. Genotoxic damage in pathology anatomy laboratory workers exposed to formaldehyde. Toxicology 2008, 252, 40–48. [Google Scholar] [CrossRef]
- Tanaka, T.; Huang, X.; Halicka, H.D.; Zhao, H.; Traganos, F.; Albino, A.P.; Dai, W.; Darzynkiewicz, Z. Cytometry of ATM Activation and Histone H2AX Phosphorylation to Estimate Extent of DNA Damage Induced by Exogenous Agents. Cytometry 2007, 71, 648–661. [Google Scholar] [CrossRef]
- Van Engeland, M.; Ramaekers, F.C.; Schutte, B.; Reutelingsperger, C.P. A novel assay to measure loss of plasma membrane asymetry during apoptosis of adherent cells in culture. Cytometry 1996, 24, 131–139. [Google Scholar] [CrossRef]
- Zembruski, N.C.L.; Stache, V.; Haefeli, W.E.; Weis, J. 7-Aminoactinomycin D for apoptosis staining in flow cytometry. Anal. Biochem. 2012, 429, 79–81. [Google Scholar] [CrossRef]
- Riedl, S.J.; Shi, Y. Molecular mechanisms of caspase regulation during apoptosis. Nat. Rev. Mol. Cell Biol. 2004, 5, 897–907. [Google Scholar] [CrossRef]
- Abraham, M.C.; Shaham, S. Death without caspases, caspases without death. Trends Cell Biol. 2004, 14, 184–193. [Google Scholar] [CrossRef]
- Pogue, A.I.; Jones, B.M.; Bhattacharjee, S.; Percy, M.E.; Zhao, Y.; Lukiw, W.J. Metal-Sulfate Induced Generation of ROS in Human Brain Cells: Detection Using an Isomeric Mixture of 5- and 6-Carboxy-2′,7′-Dichlorofluorescein Diacetate (Carboxy-DCFDA) as a Cell Permeant Tracer. Int. J. Mol. Sci. 2012, 13, 9615–9626. [Google Scholar] [CrossRef]
- Clift, M.J.D.; Gehr, P.; Rothen-Rutishauser, B. Nanotoxicology: A perspective and discussion of whether or not in vitro testing is a valid alternative. Arch. Toxicol. 2011, 85, 723–731. [Google Scholar] [CrossRef] [Green Version]
- Vila, L.; Rubio, L.; Annangi, B.; García-Rodríguez, A.; Marcos, R.; Hernández, A. Frozen dispersions of nanomaterials are a useful operational procedure in nanotoxicology. Nanotoxicology 2017, 11, 31–40. [Google Scholar] [CrossRef]
- Achawi, S.; Huot, L.; Nesslany, F.; Pourchez, J.; Simar, S.; Forest, V.; Feneon, B. Exploring graphene-based materials’ genotoxicity: Inputs of a screening method. Nanotoxicology 2021, 15, 1279–1294. [Google Scholar] [CrossRef]
- Barthel, H.; Darne, C.; Gaté, L.; Visvikis, A.; Seidel, C. Continuous Long-Term Exposure to Low Concentrations of MWCNTs Induces an Epithelial-Mesenchymal Transition in BEAS-2B Cells. Nanomaterials 2021, 11, 1742. [Google Scholar] [CrossRef]
- Morris, A.S.; Givens, B.E.; Silva, A.; Salem, A.K. Copper Oxide Nanoparticle Diameter Mediates Serum-Sensitive Toxicity in BEAS-2B Cells. Adv. NanoBiomed Res. 2021, 1, 2000062. [Google Scholar] [CrossRef]
- Cervena, T.; Rossnerova, A.; Zavodna, T.; Sikorova, J.; Vrbova, K.; Milcova, A.; Topinka, J.; Rossner, P., Jr. Testing Strategies of the In Vitro Micronucleus Assay for the Genotoxicity Assessment of Nanomaterials in BEAS-2B Cells. Nanomaterials 2021, 11, 1929. [Google Scholar] [CrossRef]
- Juarez Facio, A.T.; Yon, J.; Corbière, C.; Rogez-Florent, T.; Castilla, C.; Lavanant, H.; Mignot, M.; Devouge-Boyer, C.; Logie, C.; Chevalier, L.; et al. Toxicological impact of organic ultrafine particles (UFPs) in human bronchial epithelial BEAS-2B cells at air-liquid interface. Toxicol. Vitr. 2022, 78, 105258. [Google Scholar] [CrossRef]
- Zhang, J.; Shi, J.; Han, S.; Zheng, P.; Chen, Z.; Jia, G. Titanium dioxide nanoparticles induced reactive oxygen species (ROS) related changes of metabolomics signatures in human normal bronchial epithelial (BEAS-2B) cells. Toxicol. Appl. Pharmacol. 2022, 444, 116020. [Google Scholar] [CrossRef]
- Aimonen, K.; Imani, M.; Hartikainen, M.; Suhonen, S.; Vanhala, E.; Moreno, C.; Rojas, O.J.; Norppa, H.; Catalán, J. Surface functionalization and size modulate the formation of reactive oxygen species and genotoxic effects of cellulose nanofibrils. Part. Fibre Toxicol. 2022, 19, 19. [Google Scholar] [CrossRef]
- Haghani, A.; Johnson, R.; Safi, N.; Zhang, H.; Thorwald, M.; Mousavi, A.; Woodward, N.C.; Shirmohammadi, F.; Coussa, V.; Wise, J.P.; et al. Toxicity of urban air pollution particulate matter in developing and adult mouse brain: Comparison of total and filter-eluted nanoparticles. Environ. Int. 2020, 136, 105510. [Google Scholar] [CrossRef]
- Maher, B.A.; González-Maciel, A.; Reynoso-Robles, R.; Torres-Jardón, R.; Calderón-Garcidueñas, L. Iron-rich air pollution nanoparticles: An unrecognised environmental risk factor for myocardial mitochondrial dysfunction and cardiac oxidative stress. Environ. Res. 2020, 188, 109816. [Google Scholar] [CrossRef]
- Bhattacharjee, S. DLS and zeta potential-What they are and what they are not? J. Control. Release 2016, 235, 337–351. [Google Scholar] [CrossRef]
- Patel, V.R.; Agrawal, Y.K. Nanosuspension: An approach to enhance solubility of drugs. J. Adv. Pharm. Technol. Res. 2011, 2, 81–87. [Google Scholar] [CrossRef]
- Goodman, C.M.; McCusker, C.D.; Yilmaz, T.; Rotello, V.M. Toxicity of gold nanoparticles functionalized with cationic and anionic side chains. Bioconjug Chem. 2004, 15, 897–900. [Google Scholar] [CrossRef]
- Shao, X.R.; Wei, X.Q.; Song, X.; Hao, L.Y.; Cai, X.X.; Zhang, Z.R.; Peng, Q.; Lin, Y.F. Independent effect of polymeric nanoparticle zeta potential/surface charge, on their cytotoxicity and affinity to cells. Cell Prolif. 2015, 48, 465–474. [Google Scholar] [CrossRef]
- Zhang, Y.; Yang, M.; Portney, N.G.; Cui, D.; Budak, G.; Ozbay, E.; Ozkan, M.; Ozkan, C.S. Zeta potential: A surface electrical characteristic to probe the interaction of nanoparticles with normal and cancer human breast epithelial cells. Biomed. Microdevices 2008, 10, 321–328. [Google Scholar] [CrossRef]
- Toto, N.A.; Elhenawy, H.I.; Eltaweil, A.S.; El-Ashram, S.; El-Samad, L.M.; Moussian, B.; El Wakil, A. Musca domestica (Diptera: Muscidae) as a biological model for the assessment of magnetite nanoparticles toxicity. Sci. Total Environ. 2022, 806, 151483. [Google Scholar] [CrossRef]
- Gonçalves, J.M.; Sousa, V.S.; Teixeira, M.R.; Bebianno, M.J. Chronic toxicity of polystyrene nanoparticles in the marine mussel Mytilus galloprovinci alis. Chemosphere 2022, 287, 132356. [Google Scholar] [CrossRef]
- Skóra, B.; Piechowiak, T.; Szychowski, K.A. Epidermal Growth Factor-labeled liposomes as a way to target the toxicity of silver nanoparticles into EGFR-overexpressing cancer cells in vitro. Toxicol. Appl. Pharmacol. 2022, 443, 116009. [Google Scholar] [CrossRef]
- Lee, Y.L.; Shih, Y.S.; Chen, Z.Y.; Cheng, F.Y.; Lu, J.Y.; Wu, Y.H.; Wang, Y.J. Toxic Effects and Mechanisms of Silver and Zinc Oxide Nanoparticles on Zebrafish Embryos in Aquatic Ecosystems. Nanomaterials 2022, 12, 717. [Google Scholar] [CrossRef]
- Chau, J.L.H. Synthesis of Ni and bimetalic FeNi nanopowders by microwave plasma method. Mater. Lett. 2007, 61, 2753–2756. [Google Scholar] [CrossRef]
- Müller, K.H.; Motskin, M.; Philpott, A.J.; Routh, A.F.; Shanahan, C.M.; Duer, M.J.; Skepper, J.N. The effect of particle agglomeration on the formation of a surface-connected compartment induced by hydroxyapatite nanoparticles in human monocyte-derived macrophages. Biomaterials 2014, 35, 1074–1088. [Google Scholar] [CrossRef] [Green Version]
- Shalini, D.; Senthilkumar, S.; Rajaguru, P. Effect of size and shape on toxicity of zinc oxide (ZnO) nanomaterials in human peripheral blood lymphocytes. Toxicol. Mech. Methods 2018, 28, 87–94. [Google Scholar] [CrossRef]
- Won, H.; Kim, S.H.; Yang, J.Y.; Jung, K.; Jeong, J.; Oh, J.H.; Lee, J.H. Colony-Forming Efficiency Assay to Assess Nanotoxicity of Graphene Nanomaterials. Toxics 2022, 10, 236. [Google Scholar] [CrossRef]
- Ahamed, M. Toxic response of nickel nanoparticles in human lung epithelial A549 cells. Toxicol. Vitr. 2011, 25, 930–936. [Google Scholar] [CrossRef]
- Iqbal, S.; Jabeen, F.; Chaudhry, A.S.; Shah, M.A.; Batiha, G.E. Toxicity assessment of metallic nickel nanoparticles in various biological models: An interplay of reactive oxygen species, oxidative stress, and apoptosis. Toxicol. Ind. Health 2021, 37, 635–651. [Google Scholar] [CrossRef]
- Rajiv, S.; Jerobin, J.; Saranya, V.; Nainawat, M.; Sharma, A.; Makwana, P.; Gayathri, C.; Bharath, L.; Singh, M.; Kumar, M.; et al. Comparative cytotoxicity and genotoxicity of cobalt (II, III) oxide, iron (III) oxide, silicon dioxide, and aluminum oxide nanoparticles on human lymphocytes in vitro. Hum. Exp. Toxicol. 2016, 35, 170–183. [Google Scholar] [CrossRef]
- Dönmez Güngüneş, Ç.; Şeker, Ş.; Elçin, A.E.; Elçin, Y.M. A comparative study on the in vitro cytotoxic responses of two mammalian cell types to fullerenes, carbon nanotubes and iron oxide nanoparticles. Drug Chem. Toxicol. 2017, 40, 215–227. [Google Scholar] [CrossRef]
- Malhotra, N.; Lee, J.S.; Liman, R.; Ruallo, J.; Villaflores, O.B.; Ger, T.R.; Hsiao, C.D. Potential Toxicity of Iron Oxide Magnetic Nanoparticles: A Review. Molecules 2020, 25, 3159. [Google Scholar] [CrossRef]
- Valdiglesias, V.; Kiliç, G.; Costa, C.; Fernández-Bertólez, N.; Pásaro, E.; Teixeira, J.P.; Laffon, B. Effects of iron oxide nanoparticles: Cytotoxicity, genotoxicity, developmental toxicity, and neurotoxicity. Environ. Mol. Mutagen. 2015, 56, 125–148. [Google Scholar] [CrossRef]
- Mesárošová, M.; Kozics, K.; Bábelová, A.; Regendová, E.; Pastorek, M.; Vnuková, D.; Buliaková, B.; Rázga, F.; Gábelová, A. The role of reactive oxygen species in the genotoxicity of surface-modified magnetite nanoparticles. Toxicol. Lett. 2014, 226, 303–313. [Google Scholar] [CrossRef]
- Radeloff, K.; Ramos Tirado, M.; Haddad, D.; Breuer, K.; Müller, J.; Hochmuth, S.; Hackenberg, S.; Scherzad, A.; Kleinsasser, N.; Radeloff, A. Superparamagnetic Iron Oxide Particles (VSOPs) Show Genotoxic Effects but No Functional Impact on Human Adipose Tissue-Derived Stromal Cells (ASCs). Materials 2021, 14, 263. [Google Scholar] [CrossRef]
- Carmona, E.R.; García-Rodríguez, A.; Marcos, R. Genotoxicity of Copper and Nickel Nanoparticles in Somatic Cells of Drosophila melanogaster. J. Toxicol. 2018, 2018, 7278036. [Google Scholar] [CrossRef] [Green Version]
- Di Bucchianico, S.; Gliga, A.R.; Åkerlund, E.; Skoglund, S.; Wallinder, I.O.; Fadeel, B.; Karlsson, H.L. Calcium-dependent cyto- and genotoxicity of nickel metal and nickel oxide nanoparticles in human lung cells. Part. Fibre Toxicol. 2018, 15, 32. [Google Scholar] [CrossRef]
- Mo, Y.; Zhang, Y.; Zhang, Y.; Yuan, J.; Mo, L.; Zhang, Q. Nickel nanoparticle-induced cell transformation: Involvement of DNA damage and DNA repair defect through HIF-1α/miR-210/Rad52 pathway. J. Nanobiotechnol. 2021, 19, 370. [Google Scholar] [CrossRef] [PubMed]
- Rahmanian, N.; Shokrzadeh, M.; Eskandani, M. Recent advances in γH2AX biomarker-based genotoxicity assays: A marker of DNA damage and repair. DNA Repair 2021, 108, 103243. [Google Scholar] [CrossRef] [PubMed]
- Forest, V. Experimental and Computational Nanotoxicology-Complementary Approaches for Nanomaterial Hazard Assessment. Nanomaterials 2022, 12, 1346. [Google Scholar] [CrossRef]
- Matos, C.P.; Adiguzel, Z.; Yildizhan, Y.; Cevatemre, B.; Onder, T.B.; Cevik, O.; Nunes, P.; Ferreira, L.P.; Carvalho, M.D.; Campos, D.L.; et al. May iron(III) complexes containing phenanthroline derivatives as ligands be prospective anticancer agents? Eur. J. Med. Chem. 2019, 176, 492–512. [Google Scholar] [CrossRef]
- Mo, Q.; Deng, J.; Liu, Y.; Huang, G.; Li, Z.; Yu, P.; Gou, Y.; Yang, F. Mixed-ligand Cu(II) hydrazone complexes designed to enhance anticancer activity. Eur. J. Med. Chem. 2018, 156, 368–380. [Google Scholar] [CrossRef]
- Gou, Y.; Li, J.; Fan, B.; Xu, B.; Zhou, M.; Yang, F. Structure and biological properties of mixed-ligand Cu(II) Schiff base complexes as potential anticancer agents. Eur. J. Med. Chem. 2017, 134, 207–217. [Google Scholar] [CrossRef]
- Wu, Y.; Kong, L. Advance on toxicity of metal nickel nanoparticles. Environ. Geochem. Health 2020, 42, 2277–2286. [Google Scholar] [CrossRef]
- Zhu, M.T.; Wang, Y.; Feng, W.Y.; Wang, B.; Wang, M.; Ouyang, H.; Chai, Z.F. Oxidative stress and apoptosis induced by iron oxide nanoparticles in cultured human umbilical endothelial cells. J. Nanosci. Nanotechnol. 2010, 10, 8584–8590. [Google Scholar] [CrossRef]
- Park, E.J.; Choi, D.H.; Kim, Y.; Lee, E.W.; Song, J.; Cho, M.H.; Kim, J.H.; Kim, S.W. Magnetic iron oxide nanoparticles induce autophagy preceding apoptosis through mitochondrial damage and ER stress in RAW264.7 cells. Toxicol. Vitr. 2014, 28, 1402–1412. [Google Scholar] [CrossRef]
- Liu, Y.; Li, J.; Xu, K.; Gu, J.; Huang, L.; Zhang, L.; Liu, N.; Kong, J.; Xing, M.; Zhang, L.; et al. Characterization of superparamagnetic iron oxide nanoparticle-induced apoptosis in PC12 cells and mouse hippocampus and striatum. Toxicol. Let. 2018, 292, 151–161. [Google Scholar] [CrossRef] [PubMed]
- Paunovic, J.; Vucevic, D.; Radosavljevic, T.; Mandić-Rajčević, S.; Pantic, I. Iron-based nanoparticles and their potential toxicity: Focus on oxidative stress and apoptosis. Chem. Biol. Interact. 2020, 316, 108935. [Google Scholar] [CrossRef] [PubMed]
- Kong, L.; Gao, X.; Zhu, J.; Cheng, K.; Tang, M. Mechanisms involved in reproductive toxicity caused by nickel nanoparticle in female rats. Environ. Toxicol. 2016, 31, 1674–1683. [Google Scholar] [CrossRef] [PubMed]
- Gu, Y.; Wang, Y.; Zhou, Q.; Bowman, L.; Mao, G.; Zou, B.; Xu, J.; Liu, Y.; Liu, K.; Zhao, J.; et al. Inhibition of Nickel Nanoparticles-Induced Toxicity by Epigallocatechin-3-Gallate in JB6 Cells May Be through Down-Regulation of the MAPK Signaling Pathways. PLoS ONE 2016, 11, e0150954. [Google Scholar] [CrossRef]
- Wu, H.; Yin, J.J.; Wamer, W.G.; Zeng, M.; Lo, Y.M. Reactive oxygen species-related activities of nano-iron metal and nano-iron oxides. J. Food Drug Anal. 2014, 22, 86–94. [Google Scholar] [CrossRef] [Green Version]
- Mohamed, K.; Zine, K.; Fahima, K.; Abdelfattah, E.; Sharifudin, S.M.; Duduku, K. NiO nanoparticles induce cytotoxicity mediated through ROS generation and impairing the antioxidant defense in the human lung epithelial cells (A549): Preventive effect of Pistacia lentiscus essential oil. Toxicol. Rep. 2018, 5, 480–488. [Google Scholar] [CrossRef]


| The Definition Used | Concentrations µg/mL | The Definition Used | Concentrations µg/mL |
|---|---|---|---|
| IC12.5 | 9.512 | IC50 | 38.048 |
| IC25 | 19.024 | IC75 | 57.072 |
| Con. | Tail Length (µm) | Tail DNA % | OTM | ||||||
|---|---|---|---|---|---|---|---|---|---|
| Mean ± SD | Min. | Max. | Mean ± SD | Min. | Max. | Mean ± SD | Min. | Max. | |
| GC | 9.531 ± 2.632 | 3.987 | 21.964 | 9.953 ± 1.866 | 4.314 | 14.150 | 2.050 ± 0.725 | 0.372 | 4.004 |
| IC12.5 | 30.016 ± 6.270 *** | 15.967 | 54.021 | 31.704 ± 8.395 *** | 11.327 | 58.414 | 10.591 ± 2.885 *** | 2.380 | 20.445 |
| IC25 | 45.200 ± 6.879 *** | 32.678 | 80.324 | 44.183 ± 7.224 *** | 32.360 | 77.535 | 17.114 ± 3.788 *** | 10.387 | 34.115 |
| IC50 | 59.842 ± 4.032 *** | 46.657 | 66.546 | 62.833 ± 6.067 *** | 50.354 | 80.535 | 21.720 ± 3.451 *** | 15.106 | 32.214 |
| IC75 | 67.846 ± 3.976 *** | 55.967 | 73.657 | 63.833 ± 6.058 *** | 51.354 | 81.535 | 24.619 ± 3.645 *** | 17.460 | 35.875 |
| PC | 71.958 ± 6.137 | 55.478 | 95.331 | 73.519 ± 8.196 | 56.012 | 91.920 | 25.484 ± 4.060 | 15.594 | 47.137 |
| Cells % | |||
|---|---|---|---|
| Activated γH2AX | Inactivated γH2AX | Non-Expressing γH2AX | |
| GC | 0 | 0.006 ± 0.015 | 99.82 ± 0.192 |
| IC25 | 0 | 0.046 ± 0.015 | 99.853 ± 0.011 |
| IC75 | 96.493 ± 1.198 | 0.82 ± 1.368 | 0 |
Publisher’s Note: MDPI stays neutral with regard to jurisdictional claims in published maps and institutional affiliations. |
© 2022 by the author. Licensee MDPI, Basel, Switzerland. This article is an open access article distributed under the terms and conditions of the Creative Commons Attribution (CC BY) license (https://creativecommons.org/licenses/by/4.0/).
Share and Cite
Vatan, Ö. Evaluation of In Vitro Cytotoxic, Genotoxic, Apoptotic, and Cell Cycle Arrest Potential of Iron–Nickel Alloy Nanoparticles. Toxics 2022, 10, 492. https://doi.org/10.3390/toxics10090492
Vatan Ö. Evaluation of In Vitro Cytotoxic, Genotoxic, Apoptotic, and Cell Cycle Arrest Potential of Iron–Nickel Alloy Nanoparticles. Toxics. 2022; 10(9):492. https://doi.org/10.3390/toxics10090492
Chicago/Turabian StyleVatan, Özgür. 2022. "Evaluation of In Vitro Cytotoxic, Genotoxic, Apoptotic, and Cell Cycle Arrest Potential of Iron–Nickel Alloy Nanoparticles" Toxics 10, no. 9: 492. https://doi.org/10.3390/toxics10090492
APA StyleVatan, Ö. (2022). Evaluation of In Vitro Cytotoxic, Genotoxic, Apoptotic, and Cell Cycle Arrest Potential of Iron–Nickel Alloy Nanoparticles. Toxics, 10(9), 492. https://doi.org/10.3390/toxics10090492