1. Introduction
Air pollution is a significant cause of mortality and diseases, and is estimated to be responsible for more than 6.7 million deaths worldwide in 2019 [
1]. After years of research on the health effects of particulate matter, in 2000 the World Health Organization (WHO) first published the relative risk estimates for the effects of long-term particulate matter exposure on morbidity and mortality associated with a 10 µg/m
3 increase in PM
2.5 or PM
10 concentrations as air quality guidelines (AQG) [
2]. In 2005, the WHO published guideline values for the annual mean PM
2.5 or PM
10 concentration of 10 and 20 µg/m
3, accordingly [
2]. In 2021, new updated air quality guidelines were published, where much lower annual mean PM
2.5 concentrations were provided, and it was recommended to not exceed 5 µg/m
3, while 24 h average exposure should not exceed 15 µg/m
3. The corresponding PM
10 guideline values were calculated from the PM
2.5 values, multiplied by a factor of three (for the previous AQGs the factor was two). Despite growing awareness and concern, the proportion of the global population exposed to the annual mean PM
2.5 concentration of 10 µg/m
3 reached almost 92% in 2019. Globally, the current level of air pollution has already become a major problem, and is estimated to shorten life expectancy by 1.8–2.9 years [
1,
3]. According to the EEA report “Air quality in Europe 2021”, exposure to fine particulate matter caused 307,000 premature deaths in 2019 [
4]. Despite emission reductions, 97% of the urban population in the European Union was exposed to particulate matter levels above the latest WHO guideline values, and 71% of the urban population was exposed to a PM
10 annual WHO limit value (15 μg/m
3) in 2020 [
4].
No limit values for the PM
1 have been set by the WHO yet. The particles in the submicron size range have a low clearance rate in the alveolar region, which is the most sensitive area of the lung [
5]. The deposition of ultrafine particles in this region raises the possibility of these particles entering the bloodstream and being transported to the heart, which can lead to severe biological cell damage, cardiac dysfunction, such as cardiac arrest, and oxidative stress [
6]. In addition, ultrafine particles are associated with upper and lower respiratory tract damage and retardant lung growth [
7], thus, starting malignant growth and causing cancer of the lungs [
8].
In 2022, PM emissions from road traffic were one of the main emission sources in Europe. Compared to emissions from biomass burning for residential heating, emissions from transport significantly affect air quality in urban areas [
9]. Epidemiological studies suggest that traffic emissions have an adverse effect on health [
10], particularly among commuters (drivers and car passengers) and pedestrians [
11]. Commuting is one of the main reasons for daily trips. According to the statistical data for the EU, commuting accounts for between 27 and 47% of the total distance travelled in the EU (Eurostat, passenger mobility statistics, 2021). The most common mode of transport in the EU is the car (56%), with the share ranging from 30 to 90% depending on the country [
12]. In terms of direct transport emissions, it should be noted that road transport pollution is often higher than in other urban areas [
13,
14]. People only spend about 4–7% of their time daily in a transport microenvironment, although urban transportation accounts for a significant proportion of commuters’ daily integrated PM
2.5 exposure (up to 12%).
Indoor air quality was studied extensively in recent decades because, in addition to outdoor sources, a variety of indoor sources play a significant role in daily pollution exposure [
15]. During a typical workday, workers spend one-third of the day in the office. Modern office buildings are equipped with recuperative systems and some type of filtration. The operation of mechanical ventilation can reduce the infiltration of PM
2.5 into indoor air, although this depends on the filtration system used [
16]. In the FTMC office building equipped with the F1–F9 filtration system, the capture rate decreases with decreasing particle size, resulting in an average I/O ratio of 0.72 for particles with an aerodynamic diameter of 0.5 µm.
Knowledge of the concentrations to which individuals are exposed is critical for estimating the disease burden associated with particulate matter exposure. The health effects of the inhaled aerosol particles depend on the number of particles deposited and the region of deposition in the respiratory tract. Particle exposure and deposition in the lungs can be expressed using a variety of metrics. In addition to calculating lung deposition based on particle number or mass, it is also important to consider the deposition based on surface area, because particles interact directly with lung tissue through their surface [
17,
18].
The Environmental Protection Agency (EPA) maintains a sparse network of local air quality monitoring stations located in four fixed sites in Vilnius. Air quality modelling shows that air pollutant concentrations, PM
10 in this particular case, tend to exceed the established limit value in densely populated areas, i.e., in the city centre and in the outskirts. The daily PM
10 concentrations in the urban environment show a strong gradient over distances as short as 10 m, which is particularly evident along major roads [
19].
This study is a case study aimed at determining the exposure of an individual to PM mass concentrations during the working day in Vilnius, Lithuania, during the period when the PM1 urban background concentration is above the WHO limit values. The total deposition dose and particulate deposition fraction in different lung regions were evaluated. The analysed period of PM exposure included travel time by private vehicle and work time in the office, while particulate matter concentrations were measured both inside and outside the car and the office building. Another purpose of this work was to show that low-cost environmental monitoring sensors can be integrated into the MPPD model. Some model limitations were overcome by mathematical transformation of sensor data.
3. Results
3.1. Overview of Background Measurements during Study
The average daily temperature in March 2022 was 1.4 °C and the relative humidity (RH) was 59.7%. On 17 and 18 March, the highest air temperature values of 5.5 to 7.0 °C were reached at noon (2–5 p.m.), and the lowest values of −4.5 to −4.0 °C were reached in the early morning (6–7 a.m.). On these days, RH varied from 24 to 66% (
Figure 2). The average daily NO
x concentrations are 33.2 µg/m
3 and 32.1 µg/m
3 during the field test, while March monthly average is 33.3 µg/m
3. NO
x concentration shows that no pollution events (e.g., wildfires) occurred during the days of the field experiment on 17 and 18 March. The concentration peaks of NO
x correlate well with PM
1, PM
2.5, and PM
10 concentrations (0.72, 0.74, and 0.7, respectively) during the measurement campaign.
The maximum daily average particle number concentration during the experiment in the size range of 0.5–20 µm is 260 #/cm3, while the lowest daily average is 30 #/cm3. The aerosol particle number concentration varies between 5 and 500 #/cm3 during March, with a monthly mean total number concentration Ntotal (standard deviation) of 85 (80) #/cm3.
The mean PM concentrations during March are 4.7 (4.2), 7.5 (5.6), and 14.5 (10.4) μg/m
3 for PM
1, PM
2.5, and PM
10, respectively. During the experiment days, the mean daily PM
1, PM
2.5, and PM
10 concentrations are found to be 5.2 (2.9), 7.8 (4.0), and 15.8 (8.9) μg/m
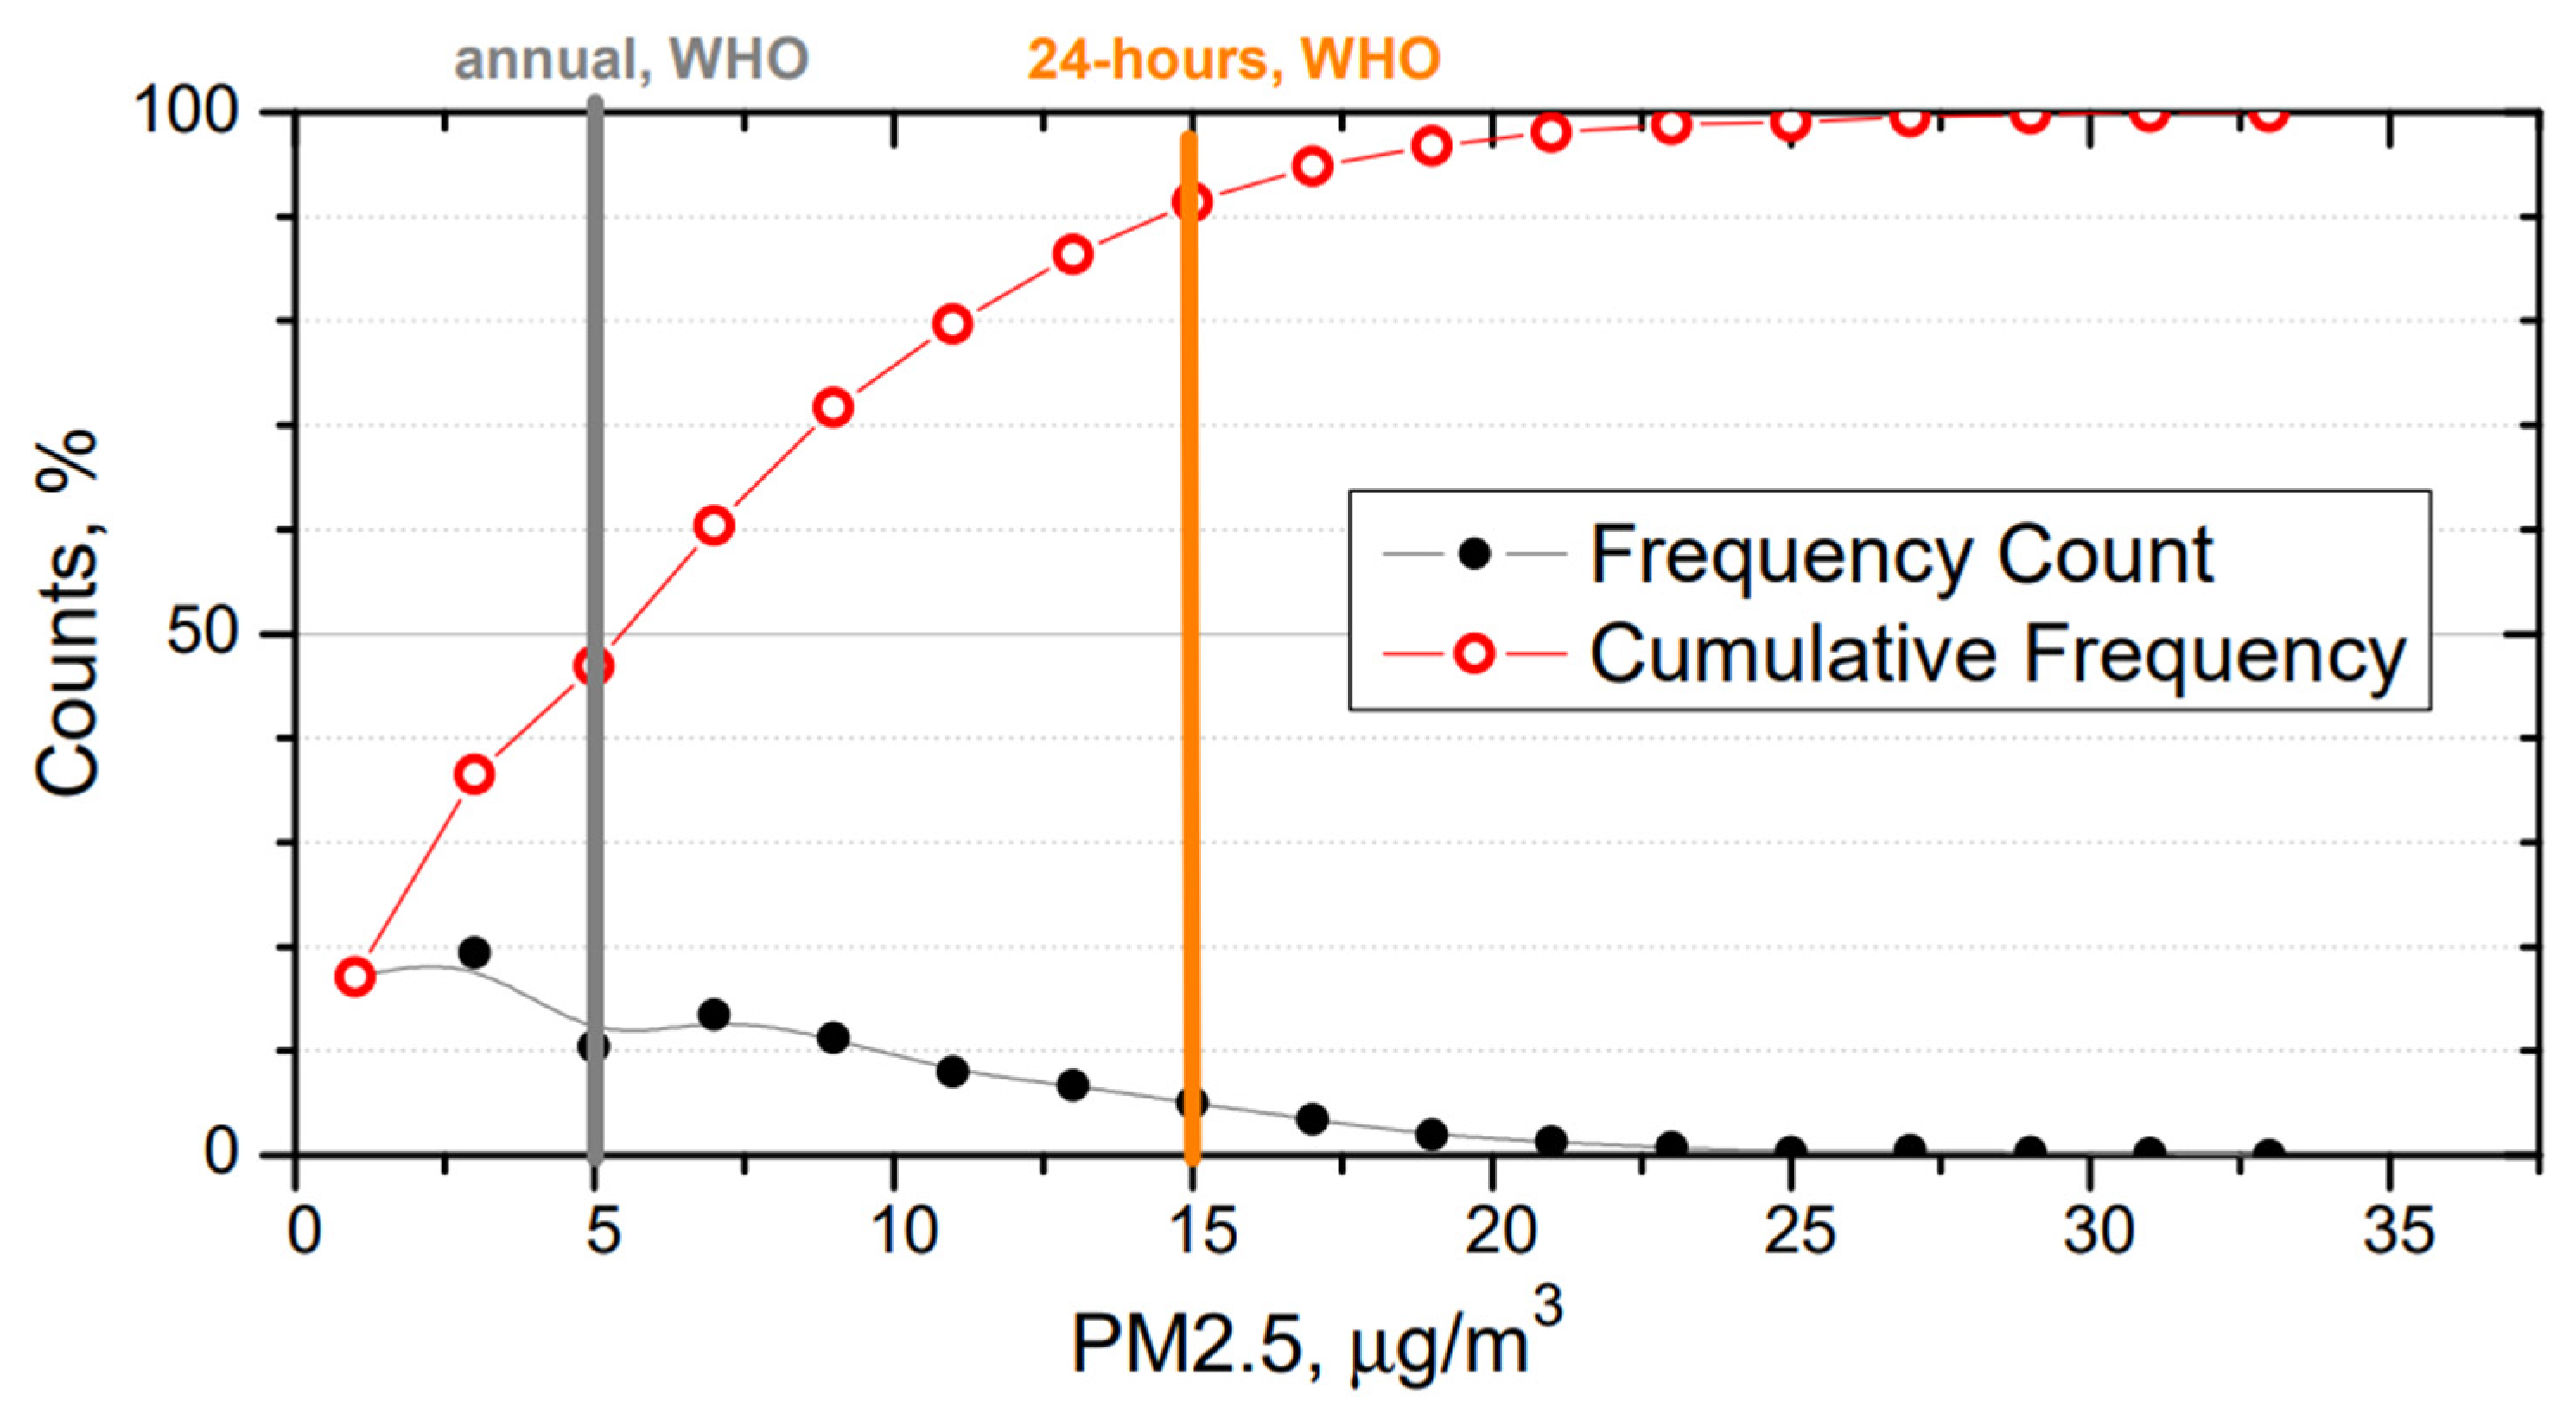
3, respectively. These results suggest that field experiment was conducted during days with a regular atmospheric condition, and no extreme pollution event had any effect on the field experiment. PM
2.5 mass concentration in the urban background reaches levels that are higher than the WHO annual limit of 5 μg/m
3 during ~50% of measurement campaign (
Figure 3). The 24 h limit (15 μg/m
3) set by the WHO is exceeded during ~10% of measurement campaign.
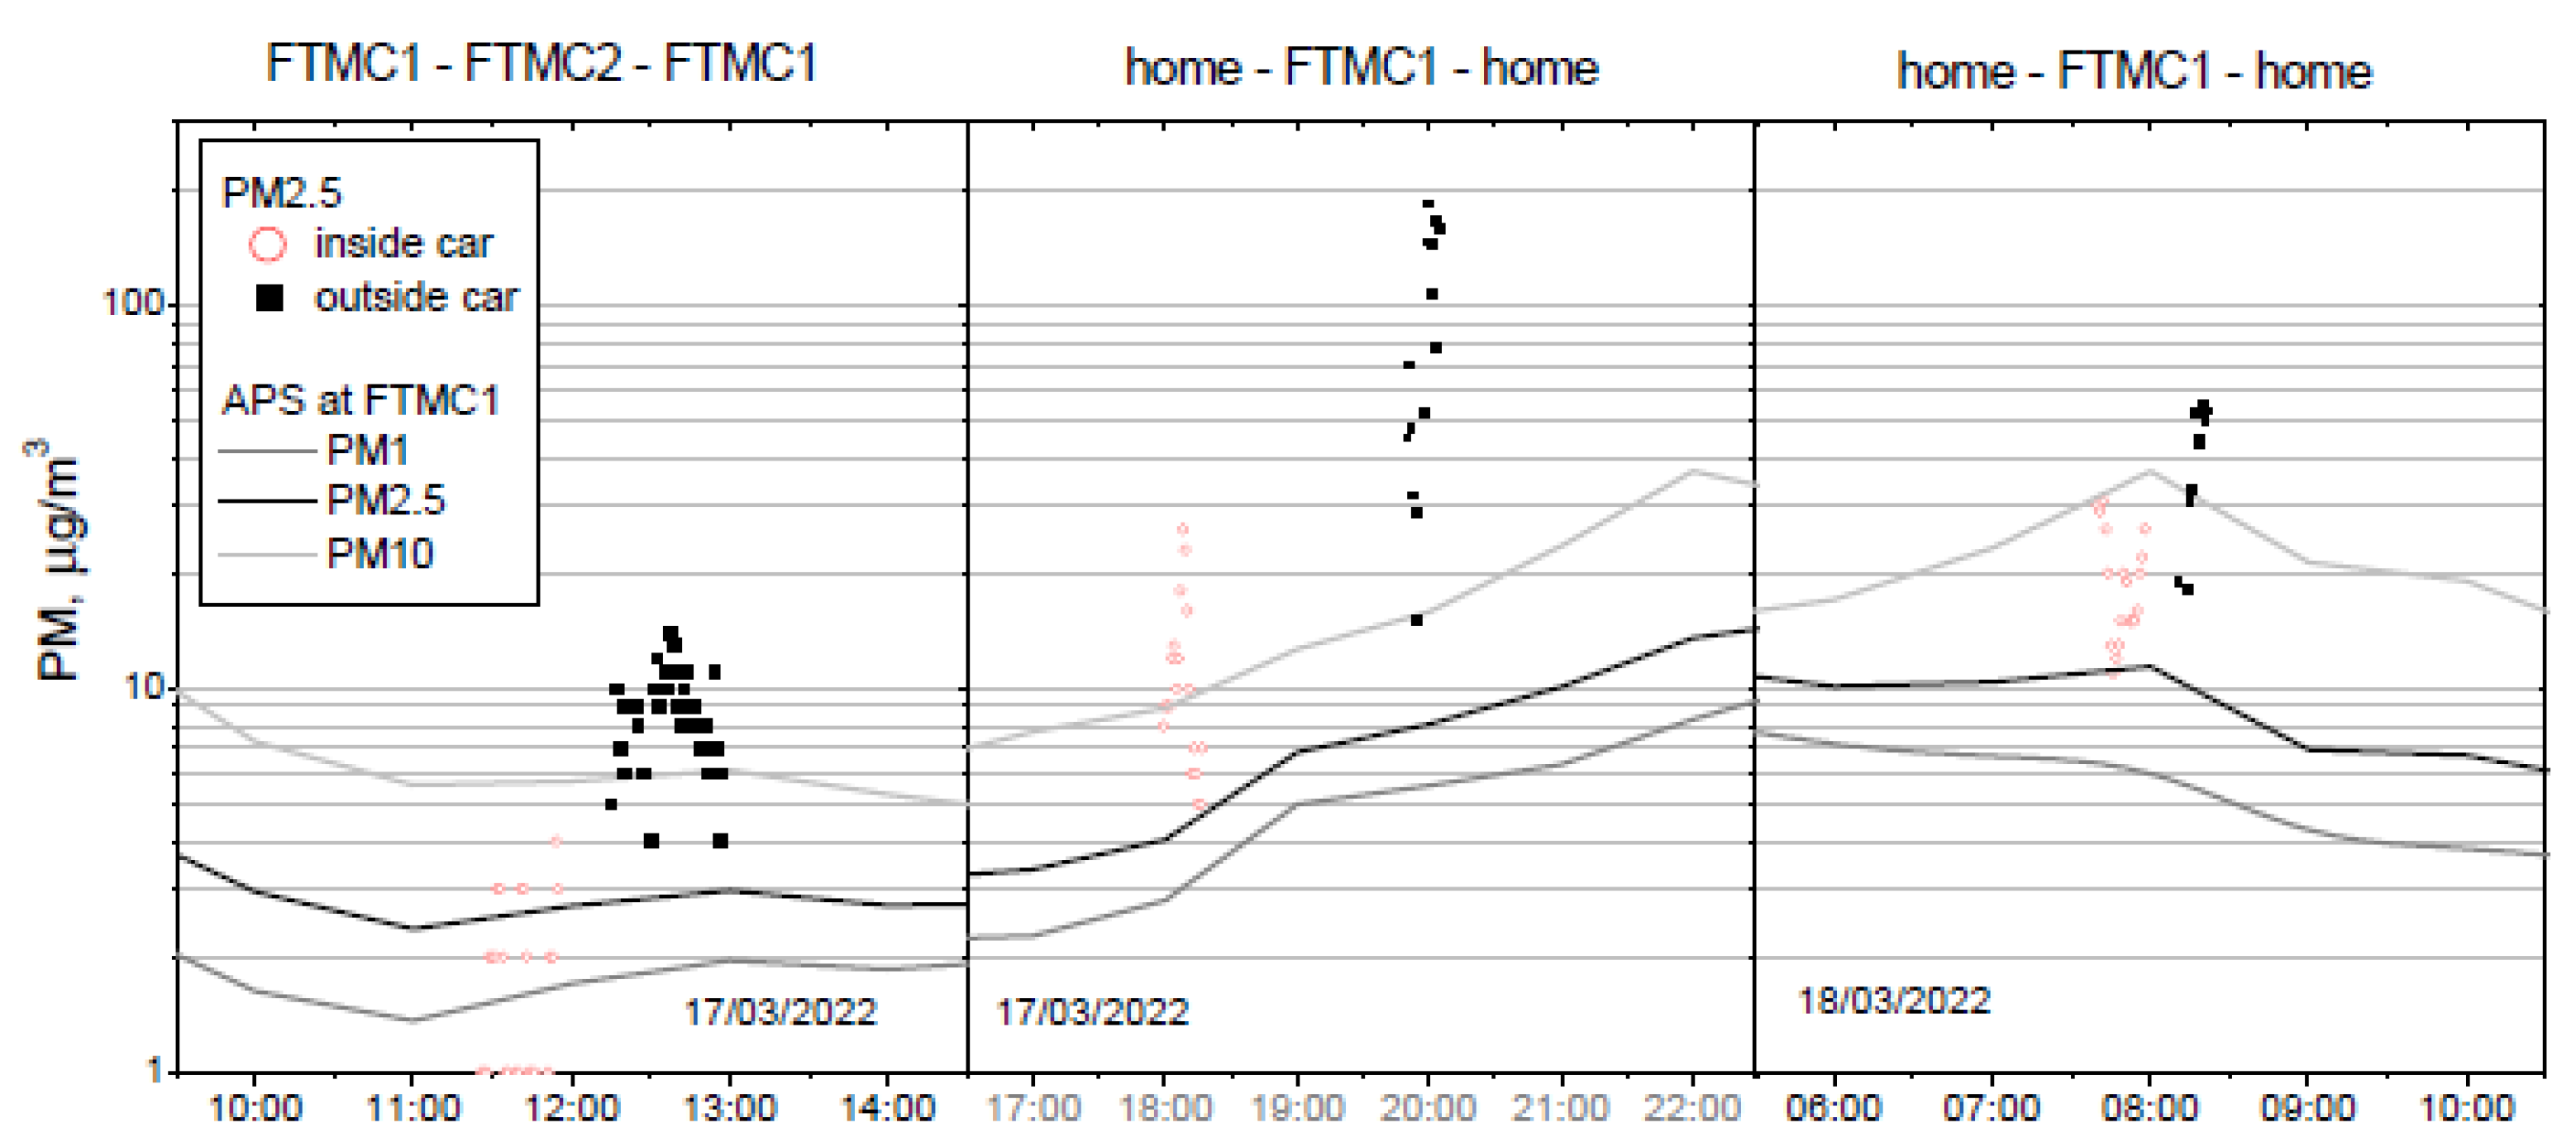
The three field experiments were performed at different times of the day, and at two different routes, to evaluate PM mass concentration inside and outside the vehicle. The first trip was made between FTMC main office (FTMC1) and laboratories (FTMC2), followed by two trips between home and FTMC1. PM
1, PM
2.5, and PM
10 mass concentrations were measured inside the car during the forward routes, and outside the car during the trips back (
Figure 4). The mean urban background PM mass concentrations during the mobile monitoring period are shown in
Table 2. The highest PM mass concentration is observed in the morning (PM
10 = 36.9 µg/m
3) due to rush hour, while the lowest PM mass concentration (PM
10 = 5.7 µg/m
3) is determined during the midday route (FTMC1–FTMC2–FTMC1).
For all the periods of the field experiment, the urban background level of PM
2.5–10 has the highest contribution (47 to 69%), followed by PM
1 (18 to 39%). Regarding PM mass ratios (
Table 1), PM
1/PM
2.5 ratios are found to range from 57.0 to 73.5%, with the highest value of 73.5 for the evening route (FTMC1–home). In addition, PM
1/PM
10 and PM
2.5/PM
10 mass ratios range from 17.6 to 39.4%, and from 30.9 to 53.5%, respectively. It clearly shows that fine particles <2.5 µm account for up to 50% of the PM
10 mass, except in the FTMC1–home route (30.9%). In general, fine particles (nucleation and Aitken mode particles) dominate in the urban environment due to the abundance of primary emission sources, but in the spring, the influence of winter road maintenance (sanding) could be important as the samples have a higher Si content.
Particle size distribution analysis (
Figure S1) shows that the lowest number concentration (30 ± 3 #/cm
3) of aerosol particles is observed during the FTMC1–FTMC2–FTMC1 route period, which is consistent with the observed lowest mass concentration. It is seen from
Figure S1, that the aerosol number concentration in the urban background during this route is almost three times lower than the integrated mean value during 17–18 March (100 ± 10 #/cm
3). The highest integrated aerosol particle number concentration (140 ± 10 #/cm
3) is observed during the home–FTMC1–home (morning) route, ranging from 90 #/cm
3 (0.5 µm) to 1 × 10
−5 #/cm
3 (20.0 µm). In addition, the values of integrated number concentration on the route home–FTMC1–home (evening) are similar to the mean values for the whole month of March and for mobile monitoring days: 100 ± 10 #/cm
3, 80 ± 10 #/cm
3, 100 ± 10 #/cm
3.
3.2. Overview of Mobile Monitoring Results
Regarding the PMs mass concentration, it is found that mass concentrations during the mobile monitoring are much higher than those found in the urban background site (
Figure 5) for most of the period.
The mean PM
2.5 mass concentration inside the vehicle is generally about 2–3 times higher than outside (
Figure 5). When background PM
2.5 concentrations are stable, the relationship between the mean indoor and outdoor concentrations measured during the field campaign on the road shows the influence of the vehicle’s ventilation system. This is the case for the first (midday) and the third (morning) series of measurements. In contrast, due to the time lag between the evening series of measurements, background PM
2.5 concentrations increases threfold between the series of measurements inside and outside the vehicle, resulting in the large difference (approximately nine-fold) between the in-vehicle and out-of-vehicle PM
2.5 concentrations. Therefore, to compare these measurement series, the change in urban background should be taken into account.
The PM concentration measured in the urban background corresponds to the minimum values for PM
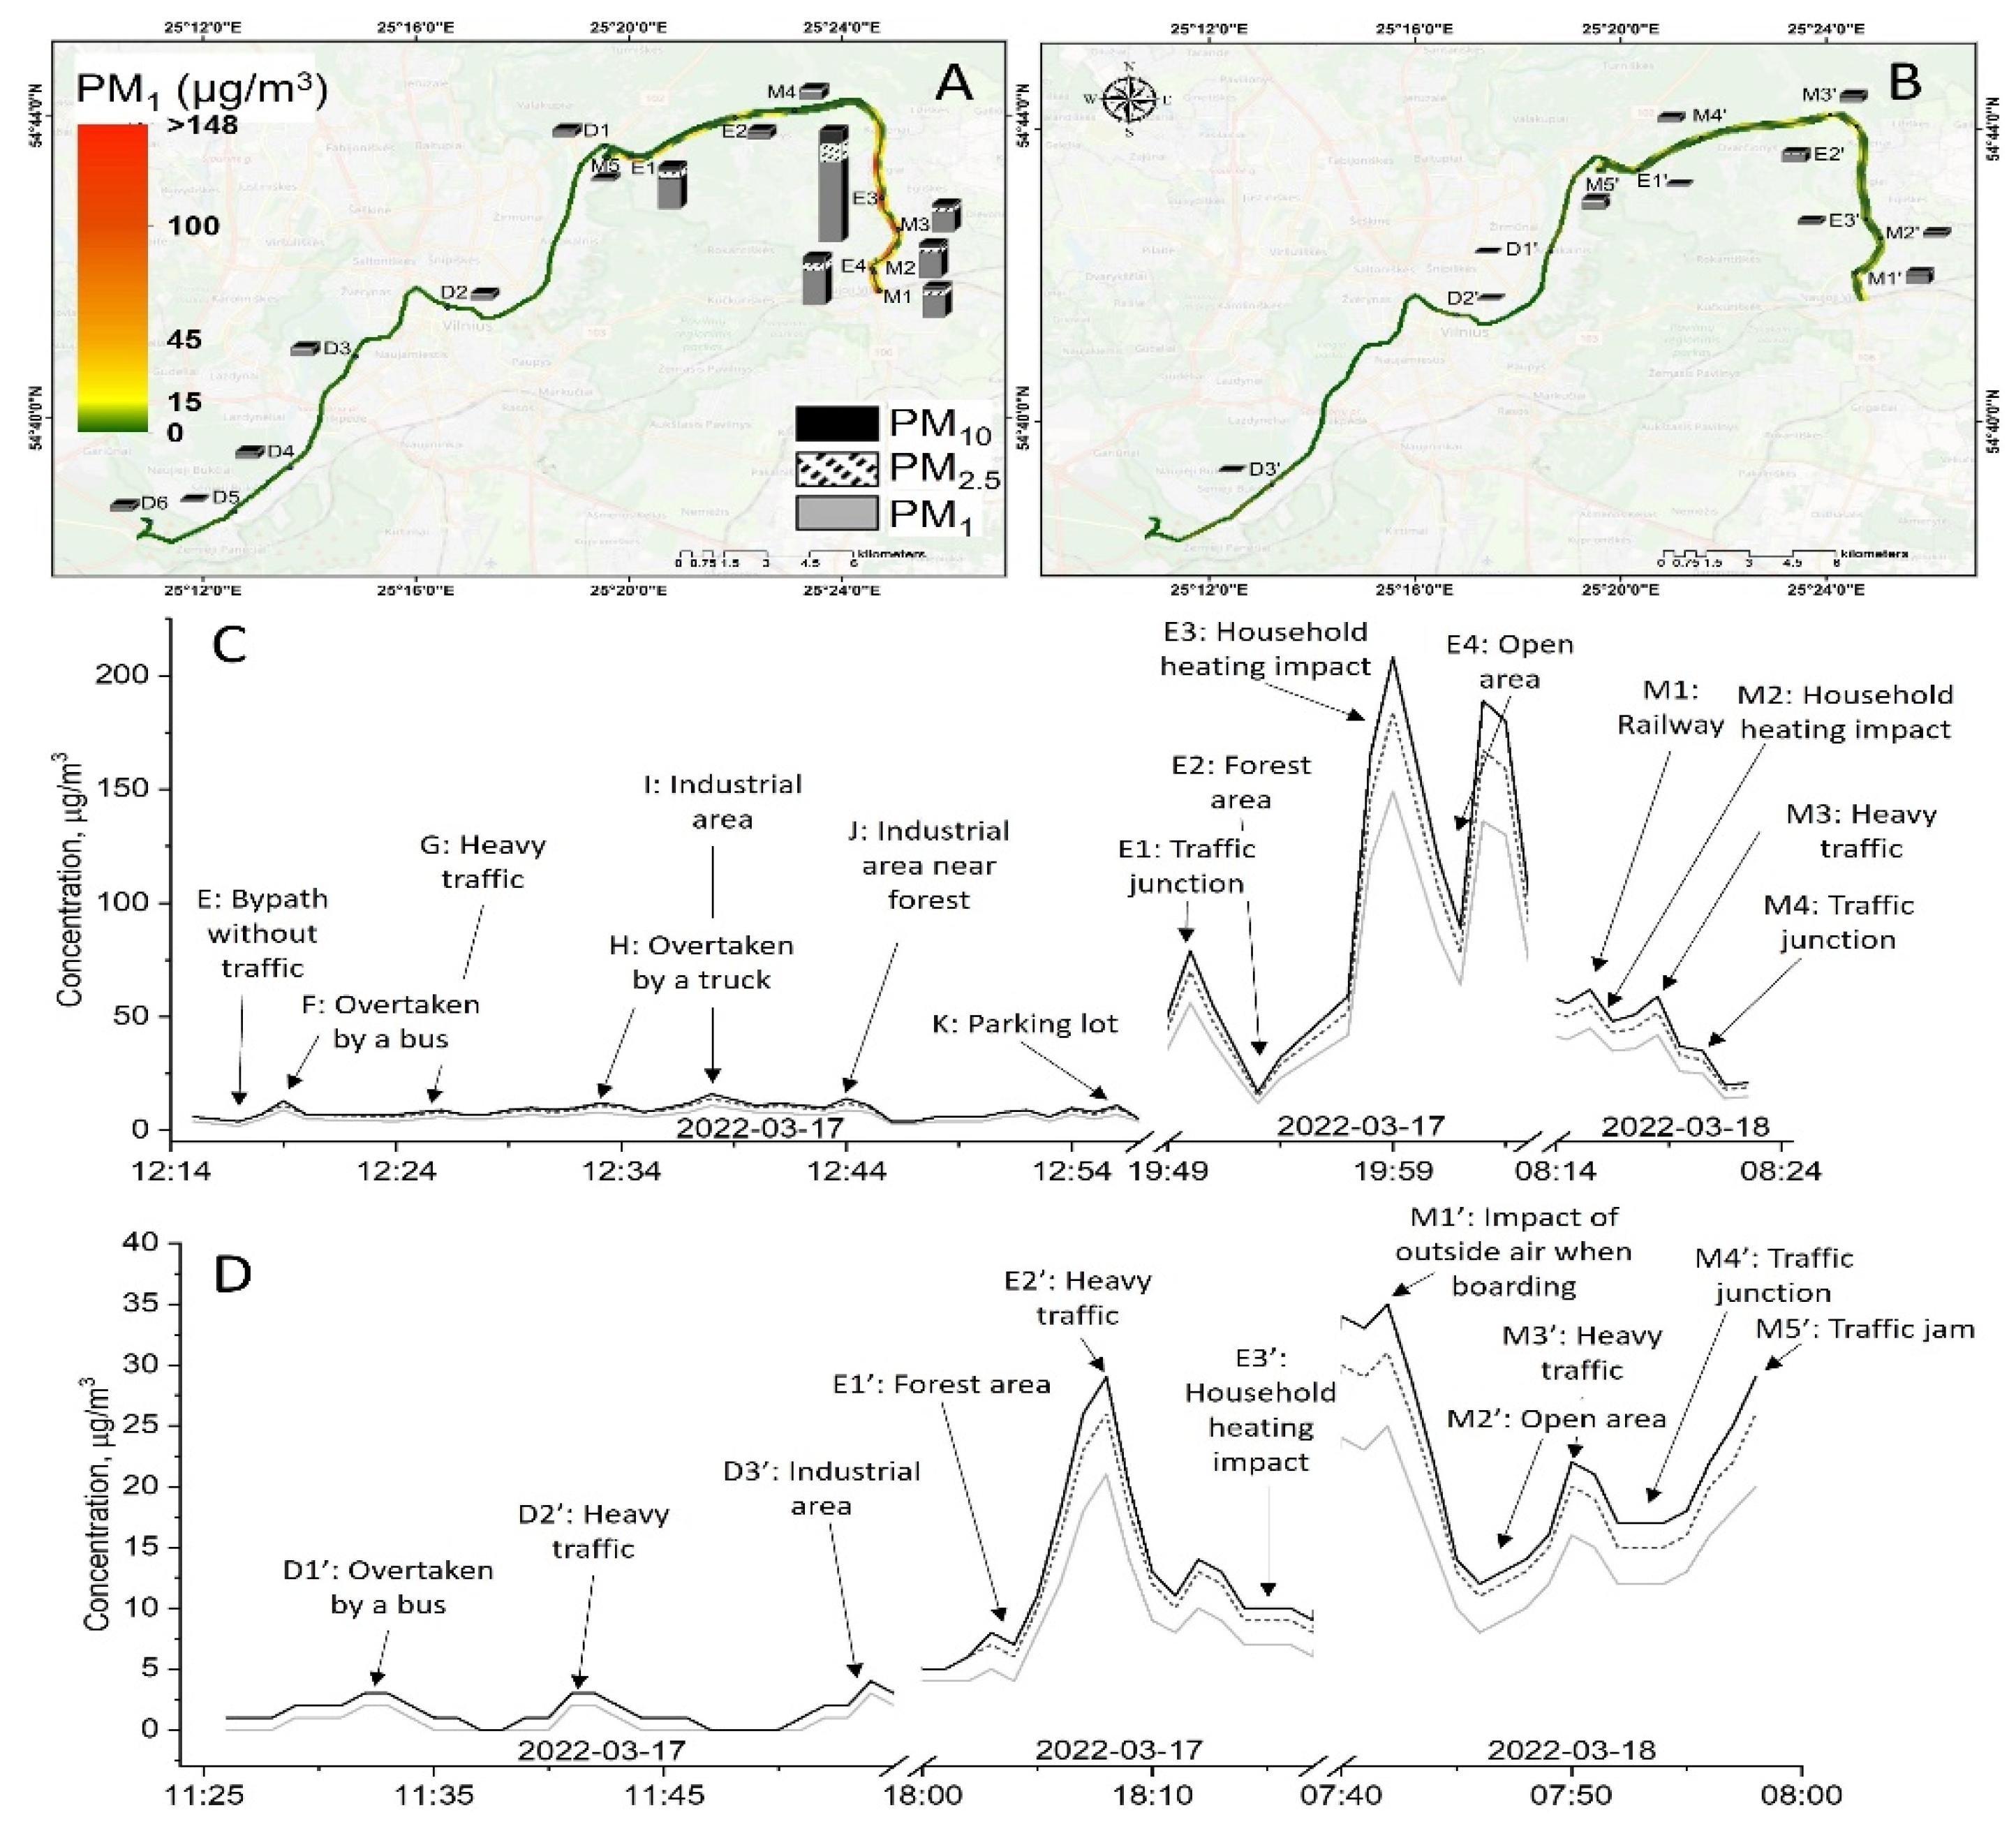
2.5 measured both on the road and in the car, except for the measurements during the first trip in the car, where the PM concentration is lower than the urban background concentrations. In this campaign, the background levels are also the lowest, compared to other measurement campaigns (
Figure 4). The lowest PM
2.5 concentration on the road is measured in the forest area on the way from FTMC1 to the residential area outside the city (
Figure 5).
PM2.5 concentrations measured on the road can exceed urban background levels many times over. For example, during evening driving, the PM2.5 concentration outside the vehicle increases up to 100 µg/m3 for about 3 min, and exceeds the background value by more than 10 times. At the same time, the PM2.5 concentration inside the vehicle is above 10 µg/m3 for about 6 min, and exceeds the background value for PM2.5 by a factor of five. The highest PM2.5 levels are measured on the road in the residential area with the most private houses. Compared to the PM mass concentration at the urban background station, the mean PM2.5 concentration at the road reaches values of 4 to 10 times higher, and inside the vehicle it reaches values of 2–3 times higher.
The PM
2.5 mass concentration limits set by the WHO are as follows: 5 μg/m
3 annual mean, 15 μg/m
3 24 h mean (WHO, 2021). The PM
2.5 mass concentration exceeds the annual mean limit for all trips, except for the midday in-cabin measurements when the urban background concentration is low (
Figure 4). In addition, the PM
2.5 concentration in the in-cabin measurements also exceed the WHO limit for the 24 h average PM
2.5 during the evening and morning trips (except for the evening in-cabin measurements).
According to the URAD measurements, the PM
1 fraction dominates the total PM concentration during the field campaign, both outside and inside the vehicle (
Figure 6). The ratios of PM
1/PM
2.5 and PM
2.5/PM
10 are about 0.80 and 0.9 for the evening and morning trips, respectively, indicating that the PM
2.5–10 fraction accounts for only about 10% of the total PM concentration. Comparison of these ratios with the urban background PM
1/PM
2.5 and PM
2.5/PM
10 (purple rings,
Figure 6) shows a different trend, as PM
2.5/PM
10 ratios are much lower compared to PM
1/PM
2.5, indicating that the PM
2.5/PM
10 fraction are large, or of comparable size to PM
1. The contribution of PM
10 particles varies between 50 and 70%. This difference between mobile and fixed measurements could be due to the fact that the mobile measurements were performed on the road, i.e., close to the sources of generation of the new particles. Another reason could be that the lack of isokinetic sampling inlet for URAD during the driving results in losses of larger particles in the PM
2.5/PM
10 fraction compared to the measurements at the urban background station.
The ratios PM
1/PM
2.5 and PM
2.5/PM
10 in a modern office are higher than obtained for other environments in the same period due to the peculiarities of the filtering system, in which the smallest particles are filtered less effectively [
27].
3.3. Total and Regional PM Deposition Dose in Human Airways
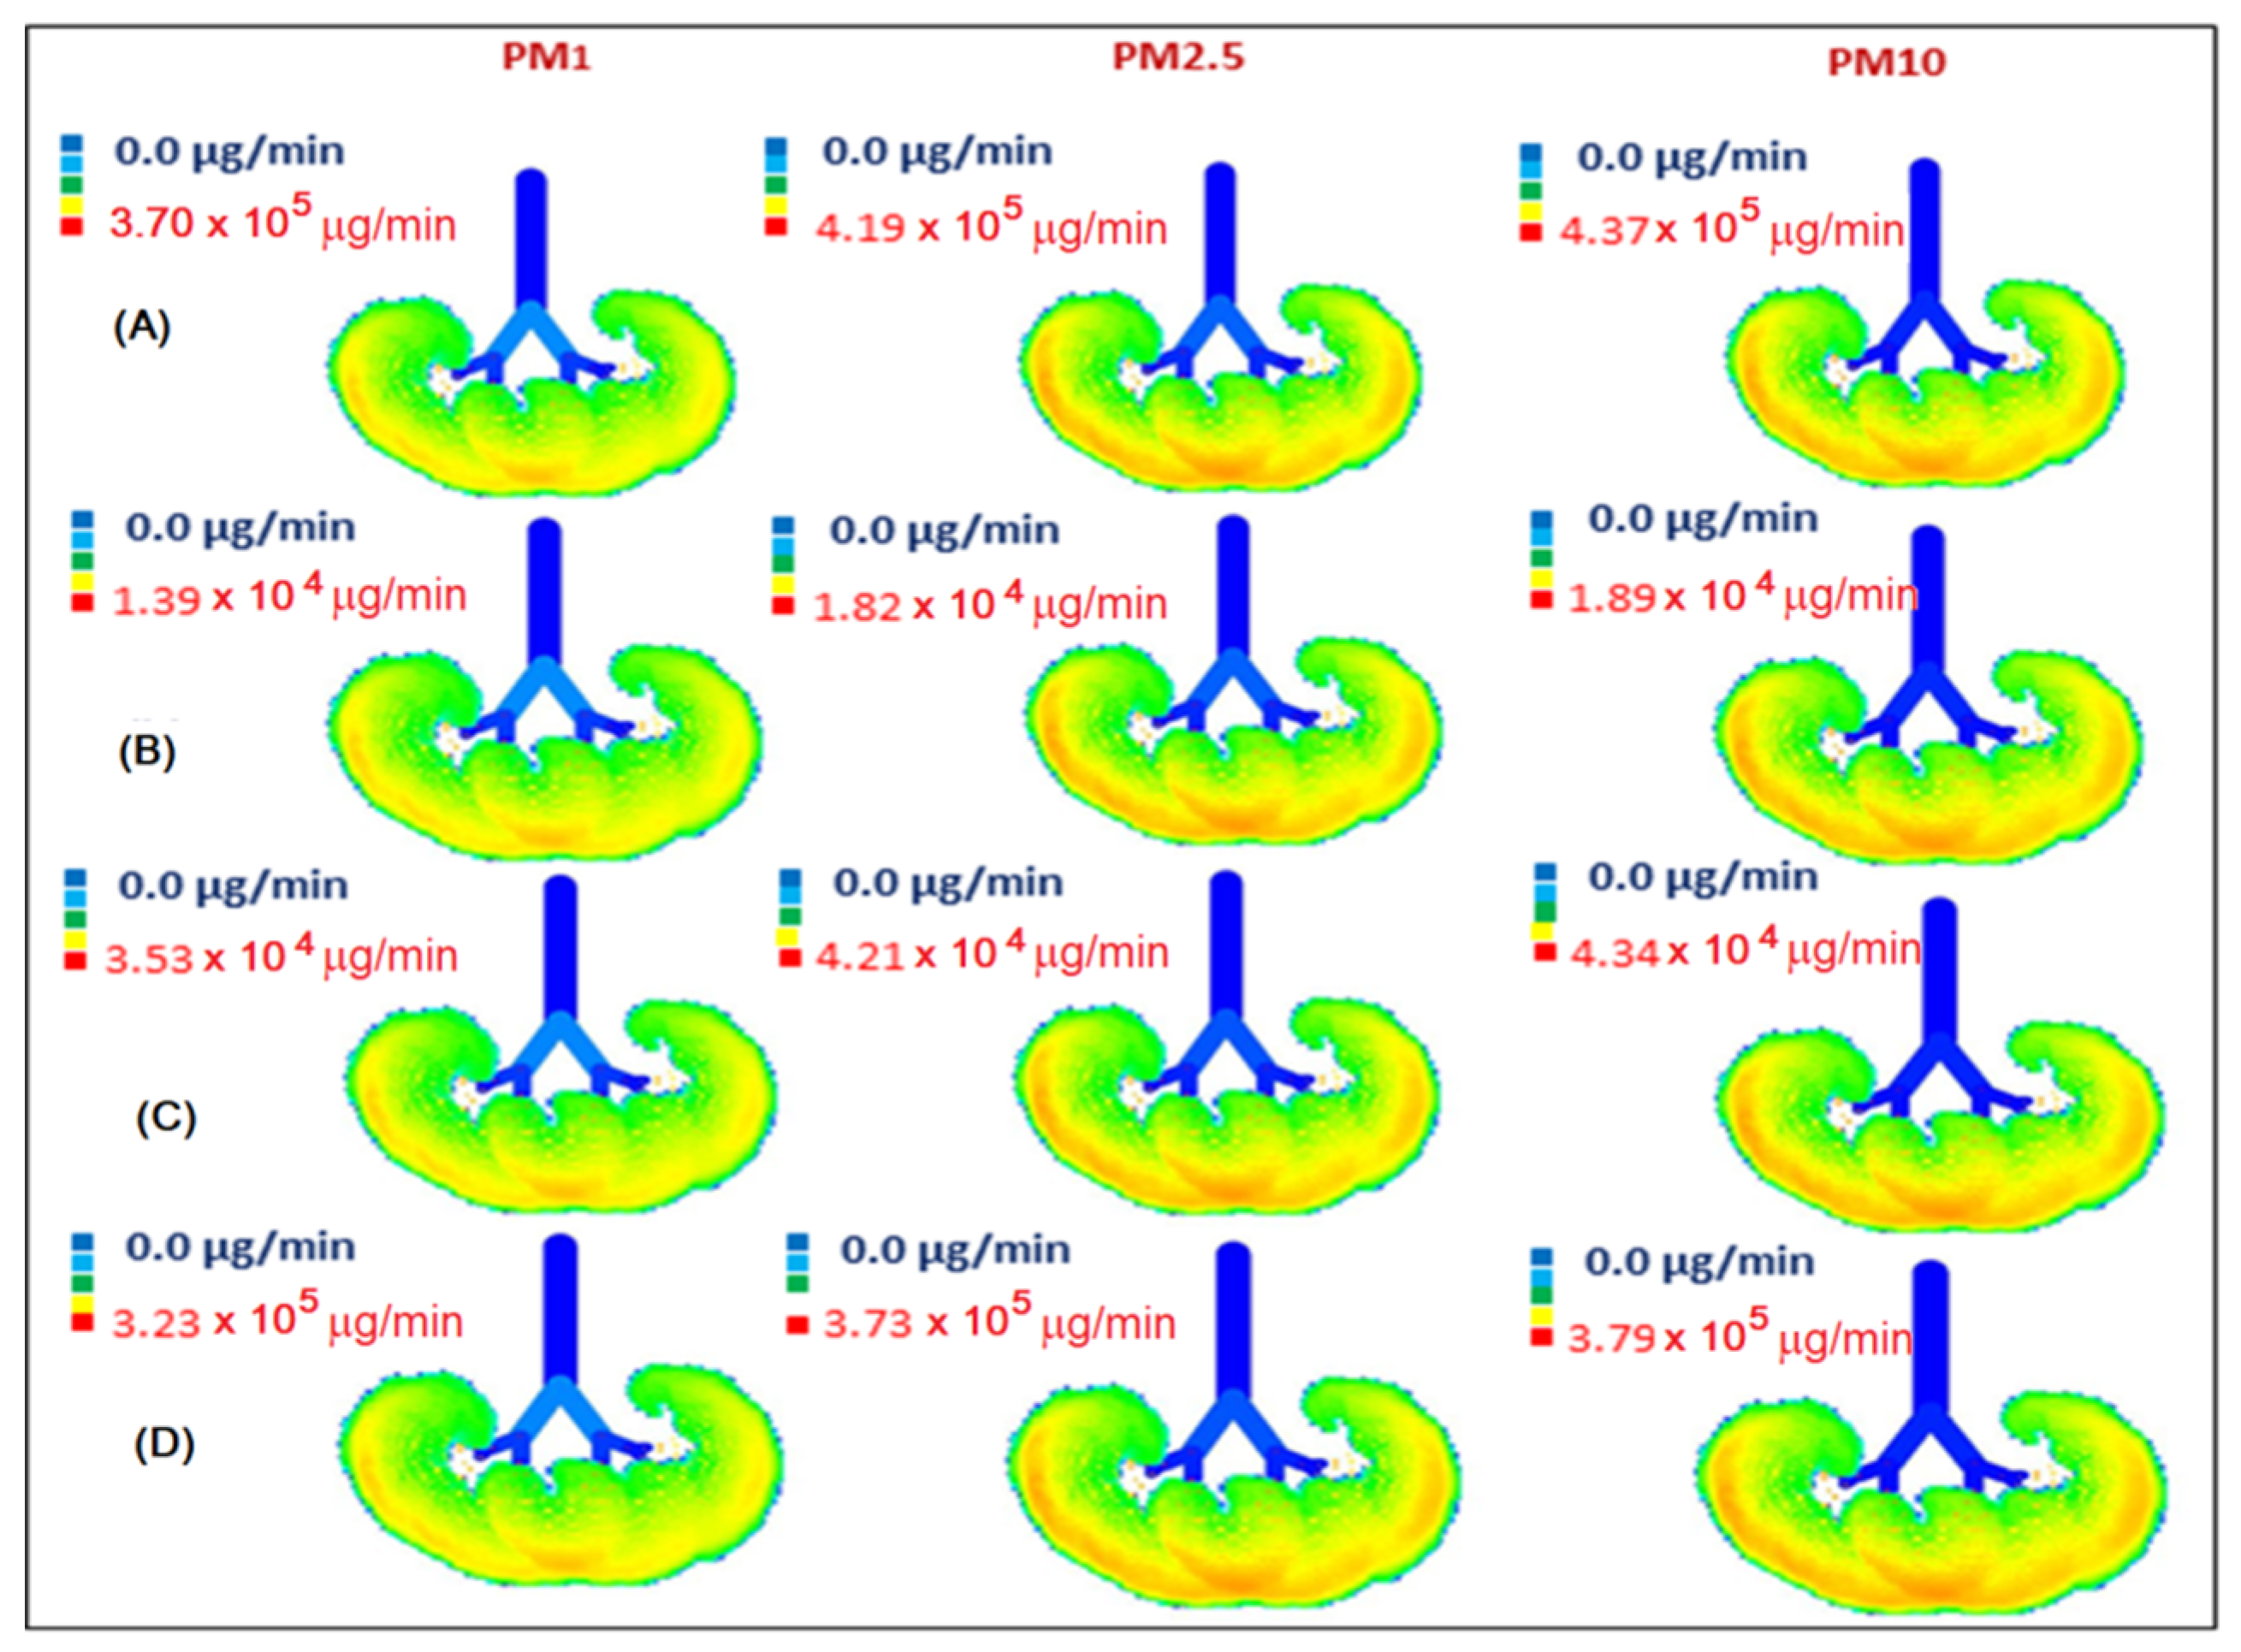
The calculated inhaled deposited mass of PM during working hours in the office and during driving on all routes, as well as the minute deposition dose in the respiratory geometry, are shown in
Figure 7 and
Figure 8. According to the model, the applied DF depends on the aerodynamic size of particles, but not on the concentration of aerosols. Therefore, the DF values for PM in the office and in the car are the same for the same aerodynamic diameter, regardless of the difference in concentration. The total DF for PM fractions PM
<1, PM
1–2.5, PM
2.5–10 are 38%, 90%, and 98%, respectively (
Figure S2). The largest PM are predominantly deposited in the upper respiratory tract (head), while the finer PM fractions dominate in the lower airways. The total DF for PM
1, PM
2.5, and PM
10 (calculated using formulas 1 and 2 shown above) is approximately 38%, 56%, and 65%, respectively, with a small standard deviation (3%) between the measurement series. The lowest MDDs are obtained for the midday commute when the person travels from FTMC1 to FTMC2 and the PM urban background concentrations are the lowest of the analysed period. In contrast to the rush hour, this could also be influenced by a combination of the height of the mixed layer during the day and the lower traffic intensity.
It is important to note that in our study we used normal respiratory parameters and the nasal route to estimate the deposition fraction, which may vary depending on the respiratory scenario. As shown in a study conducted in Hungary, the PM
1 deposition fraction in the extra-thoracic region (head) decreases monotonically from 26% (for sleeping) to 9.4% (for heavy exercise) with a parallel increase in the alveolar region from 14.7% (for sleeping) to 34% (for heavy exercise) [
28]. It is found that particle deposition differs significantly depending on the subject’s gender (male vs. female) and age (17–45% in adults vs. 10–23% in children; two times greater in adults) [
29]. In our case, the PM1 value for a seated middle-aged man is found to be 26% in the head region and 8% in the alveolar region. It is lower in the alveolar region compared to the specimen study (14.7%), but this could be due to differences in particle size distribution. The deposition fraction of PM
1 could also be underestimated in our results, since it was evaluated only for a diameter of 1 μm, i.e., not for a range.
Significant differences are found between indoor (office) and road deposition doses. Indoor PM concentrations are close to those found for drivers during midday at low urban background concentrations, and are about 8 (for PM1) to 14 (for PM10) times lower than deposition doses for drivers during rush hour. As a result of a better ventilation system ensuring air quality in FTMC1 (office buildings), a comparatively lower PM dose is deposited in the lungs of office workers than during on-road driving. Taking into account the time spent driving (40 min on average for driving from office to home) and in the office (8 h), the deposition doses (MDD multiplied by the time spent on a given activity) of total inhaled PM1 are in a comparable range: office/road = (0.006 × 8) / (0.072 + 0.039) × 1/3) ≈ 48/37 ≈ 1.3. This means that the fraction of daily PM1 exposure in the office may be higher than the fraction obtained on the road, depending on the time spent driving. During the workday, when driving takes less than 10% of the time considered (commuting plus working), PM1 exposure while driving accounts for about 80% of the PM1 exposure caused by office PM1 concentrations.
The MDD for the driver is about 14 times higher for PM1 and PM10 during the rush hour than in the office when the urban background concentration of PM2.5 is up to 10 µg/m3. During the low urban background concentration period, the in-vehicle PM concentration is lower than the background concentration by a factor of two. This may be due to the limitations of the mobile measurement device used.
The visualization of the size-segregated PM mass deposition rate in the human respiratory tract on the road and in the office (
Figure 8) shows the large differences in MDD distribution within the portion of the respiratory tract shown. It is also important to note that MDD is dominated by the PM
1 fraction, and exerts the greatest influence on the lowest part of the respiratory tract, the alveolar region.
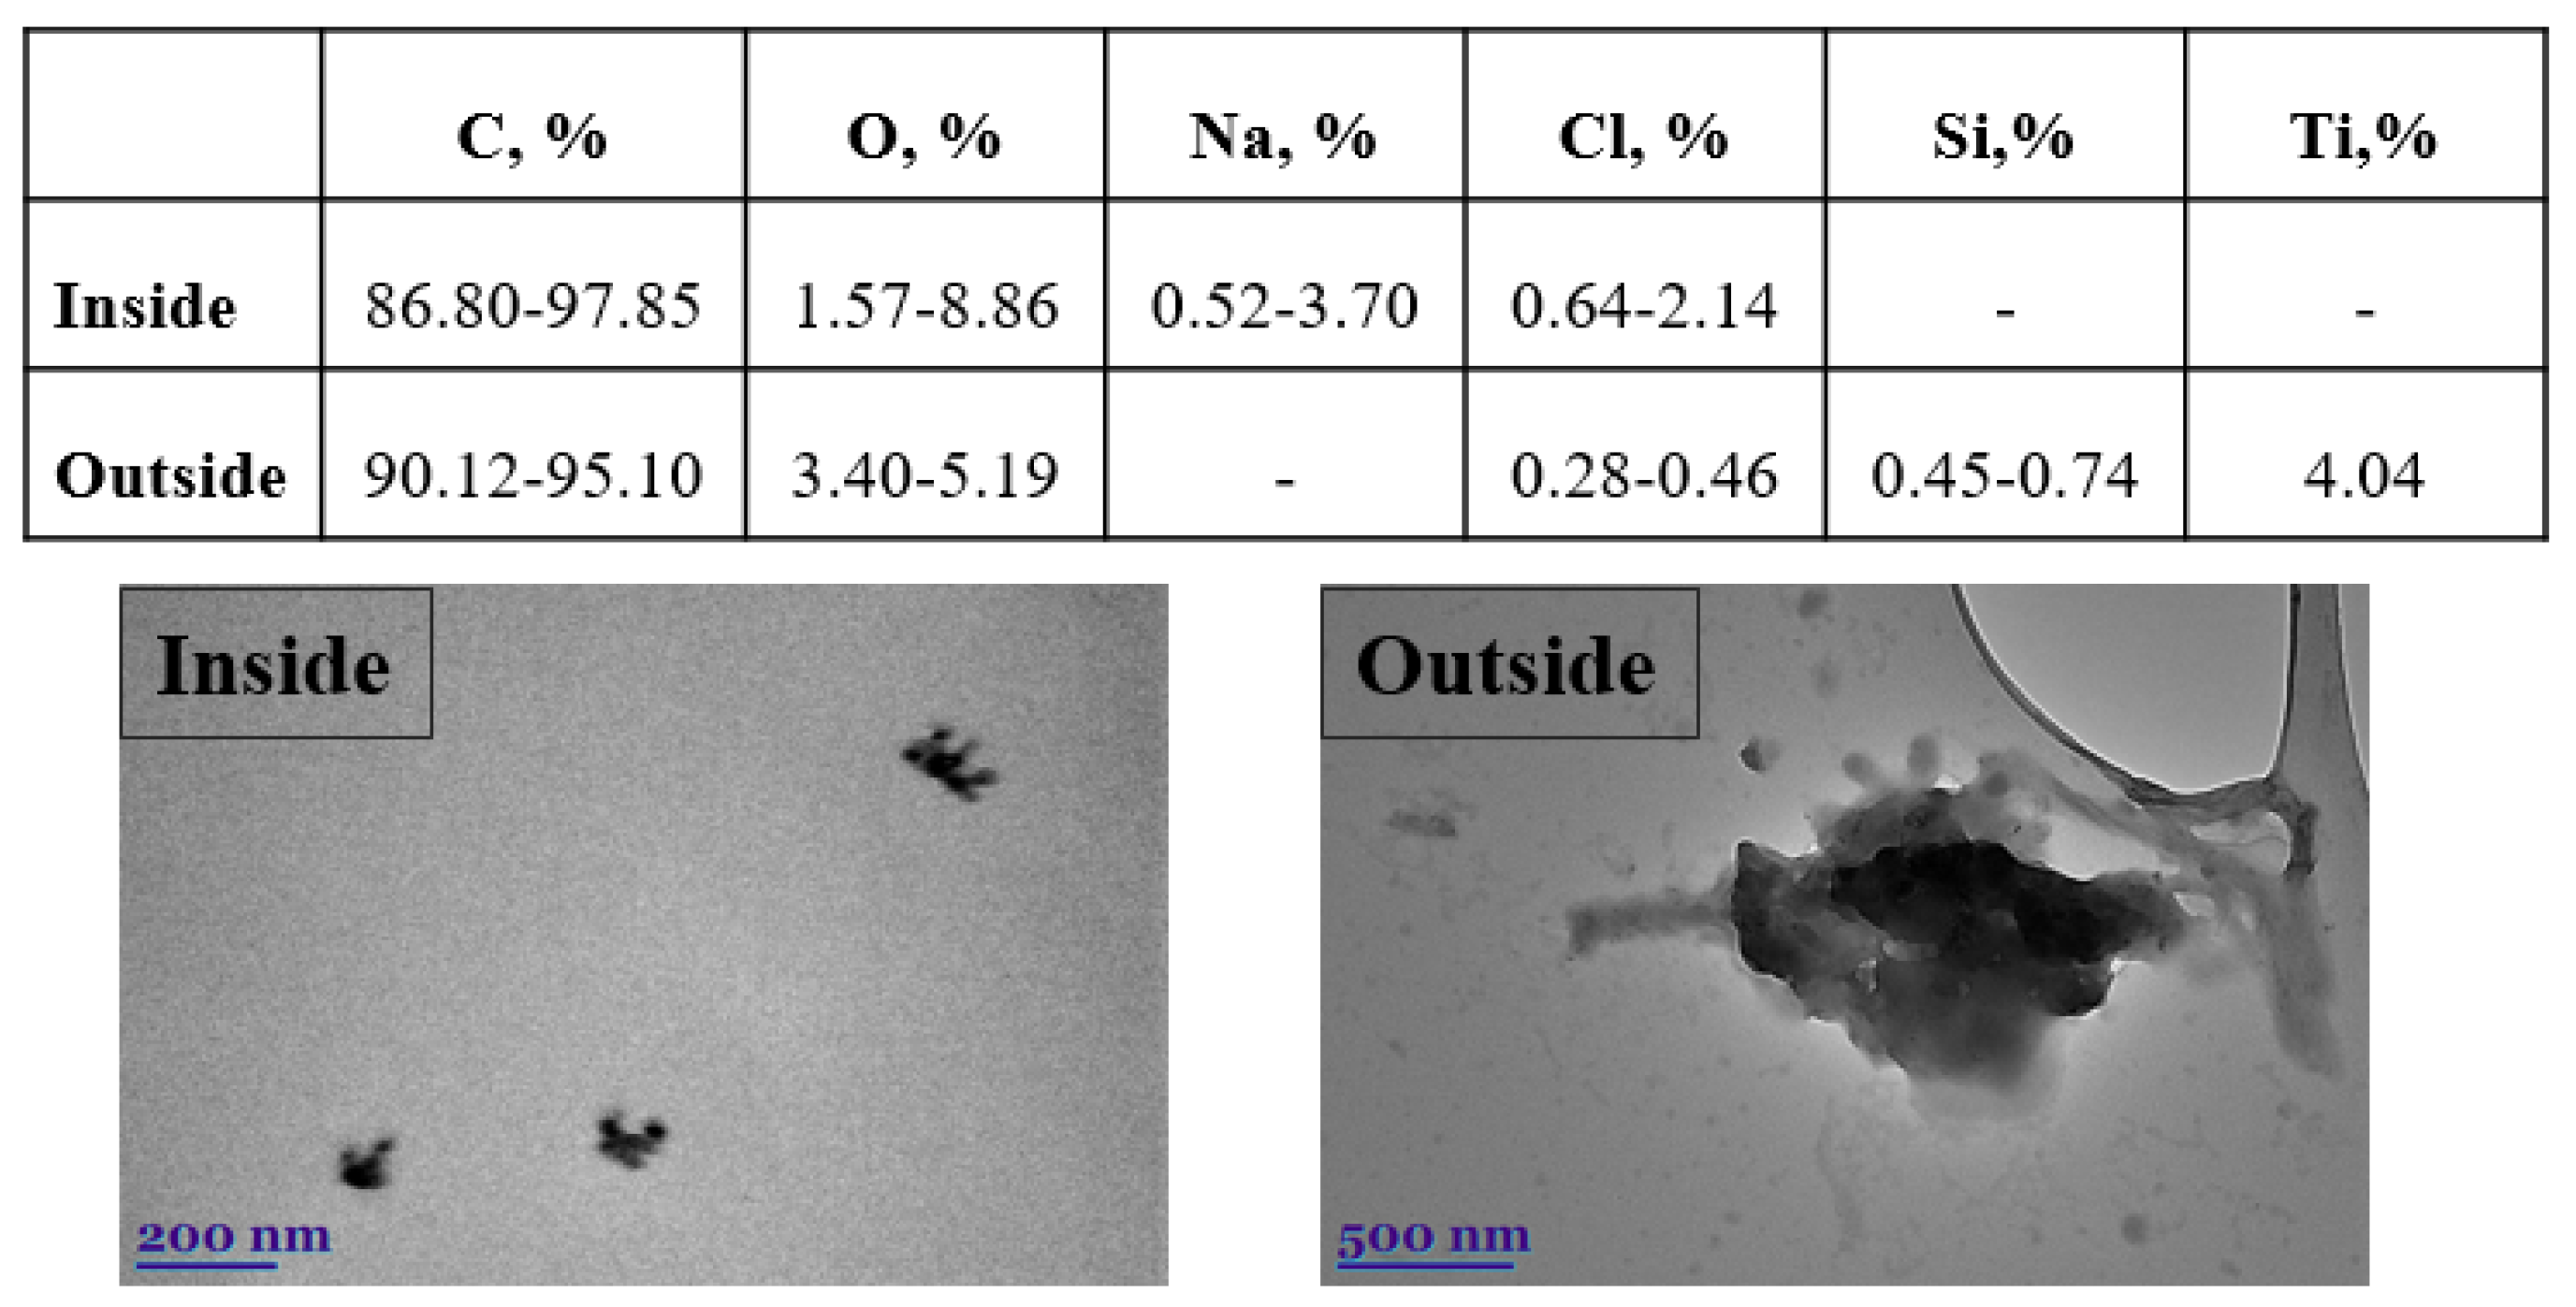
The morphological characteristics of the particular matter (PM
1 and PM
2.5) were studied using transmission electron microscopy (TEM), while the elemental composition was determined using EDX spectra (
Figure 9). The majority of the particles in the inside sample are aggregates of smaller, round-shaped nanoparticles. The smallest particles have a length of about 40 nm, and only a small number are longer than 200–300 nm. Compared with the inside, the outside sample contains more irregular particles larger than 1 µm. The smaller particles also form large ones with diameters of approximately 2.5 μm (i.e., PM
2.5). Elemental analysis of particulate matter reveals the presence of mostly elemental/organic carbon and oxygen (
Figure 9). Metals and inorganic salts are also discovered. The minor constituent elements sodium, chloride, silicon, and titanium contribute from 0.28% to 4.04%, to the total weight of the particles.
It is observed that the major constituent of the outside sample is silica (Si), which confirmed our above statement that, in addition to traffic emissions, the road dust is one of the major sources of exposure outside. Being inside a vehicle does not protect you from the emissions outside or small particles (
Figure 9). Both PM
1 and PM
2.5 have the potential to cause significant cytotoxicity and genotoxicity in cells. The toxic effects of PM
1 are stronger than those of PM
2.5. PM
1 contains more toxic and carcinogenic compounds than fine and coarse particles, and can penetrate deeper into the respiratory tract. The combined effects of size and chemical composition may be responsible for the stronger cytotoxic effects, whereas chemical species may be primarily responsible for the genotoxic effects of PM
1 [
30]. The most important protection for humans against outdoor air pollution in vehicles is ventilation, air conditioning, modern filters, and recirculation systems. Studies show that particle filters without activated carbon in cars reduce particulate matter by 46%, while using filters with activated carbon reduces it by 74%, compared to unfiltered air [
31]. Transmission electron microscope analysis (TEM) confirms that the outdoor sample is dominated by a large number of particles with a wide size range (PM
1, PM
2.5, and PM
10). In contrast, the sample measured inside the vehicle shows that filters remove larger particles, leaving almost only particles whose size falls within the range describing PM
1.
4. Discussion
Urban air pollution varies widely both spatially and temporally, and commuter exposure can vary substantially depending on the daily distance travelled between home and work. PM2.5 concentrations measured on the road can exceed background levels by many times. Of the two analysed routes, the time of the day when drivers and passengers could be exposed to the maximum PM concentrations was the morning hours. Urban background PM2.5 concentrations ranges from 5 to 10 µg/m3 during the morning and evening commutes. PM2.5 concentrations at the road are above the 24 h limit value (WHO) during these measurement sessions. Compared to the PM mass concentration at the urban background station, the mean PM2.5 concentration at the road reaches values of 4 to 10 times higher, and inside the vehicle it reaches values 2–3 times higher. Office PM concentrations are below the urban background concentration and the WHO limits for PM2.5.
Due to its high toxicity, the smallest PM fraction, PM1, attracts the most attention and is an important subject of study. The PM1 dominates in both environments, i.e., in the on-road vehicle and in the modern office, but mass concentrations differ significantly due to differences in infiltration. The MDD for the driver is about 14 times higher for PM1 (and PM10) during the rush hour than in the office when the urban background concentration of PM2.5 is up to 10 µg/m3. During the low urban background concentration period, the in-vehicle PM concentration is underestimated, due to the limitations of the mobile measurement device used.
During the workday, when driving takes less than 10% of the time considered (commuting plus working), PM1 exposure during driving comprises about 80% of the PM1 exposure caused by PM1 concentration in the office.
This study was the first attempt to evaluate PM pollution on Vilnius roads and in the driver’s cabin, and to compare it with measurements of the urban background. The analysed measurement series are not very extensive, as some measurement series were discarded when the measurements of the whole set of instruments were not available. It is shown that low-cost environmental monitoring sensors can be used together with the MPPD model to assess PM deposition on the road, but with some limitations in the case of low urban background concentrations.


 ,
, 


