
Short-Term Associations between PM10 and Respiratory Health Effects in Visby, Sweden


Abstract
:1. Introduction
2. Materials and Methods
3. Results
4. Discussion
4.1. Differences in Relative Risks during Winter/Spring and Summer/Autumn
4.2. The Formation Processes and Chemical Compositions of PM10 in Visby
4.3. Policy Implications
4.4. Strengths and Limitations of This Study
5. Conclusions
Author Contributions
Funding
Institutional Review Board Statement
Informed Consent Statement
Data Availability Statement
Acknowledgments
Conflicts of Interest
References
- Liu, C.; Chen, R.; Sera, F.; Vicedo-Cabrera, A.M.; Guo, Y.; Tong, S.; Coelho, M.S.Z.S.; Saldiva, P.H.N.; Lavigne, E.; Matus, P.; et al. Ambient Particulate Air Pollution and Daily Mortality in 652 Cities. N. Engl. J. Med. 2019, 381, 705–715. [Google Scholar] [CrossRef] [PubMed]
- Orellano, P.; Reynoso, J.; Quaranta, N.; Bardach, A.; Ciapponi, A. Short-term exposure to particulate matter (PM10 and PM2.5), nitrogen dioxide (NO2), and ozone (O3) and all-cause and cause-specific mortality: Systematic review and meta-analysis. Environ. Int. 2020, 142, 105876. [Google Scholar] [CrossRef] [PubMed]
- Yee, J.; Cho, Y.A.; Yoo, H.J.; Yun, H.; Gwak, H.S. Short-term exposure to air pollution and hospital admission for pneumonia: A systematic review and meta-analysis. Environ. Health 2021, 20, 6. [Google Scholar] [CrossRef] [PubMed]
- Zheng, X.Y.; Ding, H.; Jiang, L.N.; Chen, S.W.; Zheng, J.P.; Qiu, M.; Zhou, Y.X.; Chen, Q.; Guan, W.J. Association between Air Pollutants and Asthma Emergency Room Visits and Hospital Admissions in Time Series Studies: A Systematic Review and Meta-Analysis. PLoS ONE 2015, 10, e0138146. [Google Scholar]
- Canova, C.; Dunster, C.; Kelly, F.J.; Minelli, C.; Shah, P.L.; Caneja, C.; Tumilty, M.K.; Burney, P. PM10-induced hospital admissions for asthma and chronic obstructive pulmonary disease: The modifying effect of individual characteristics. Epidemiology 2012, 23, 607–615. [Google Scholar] [CrossRef] [PubMed]
- Wang, X.; Bi, X.; Sheng, G.; Fu, J. Chemical composition and sources of PM10 and PM2.5 aerosols in Guangzhou, China. Environ. Monit. Assess. 2006, 119, 425–439. [Google Scholar] [CrossRef]
- Ramírez, O.; Sánchez de la Campa, A.M.; Amato, F.; Catacolí, R.A.; Rojas, N.Y.; de la Rosa, J. Chemical composition and source apportionment of PM10 at an urban background site in a high-altitude Latin American megacity (Bogota, Colombia). Environ. Pollut. 2018, 233, 142–155. [Google Scholar] [CrossRef]
- Hama, S.M.L.; Cordell, R.L.; Staelens, J.; Mooibroek, D.; Monks, P.S. Chemical composition and source identification of PM10 in five North Western European cities. Atmos. Res. 2018, 214, 135–149. [Google Scholar] [CrossRef] [Green Version]
- Perrino, C.; Catrambone, M.; Canepari, S. Chemical Composition of PM10 in 16 Urban, Industrial and Background Sites in Italy. Atmosphere 2020, 11, 479. [Google Scholar] [CrossRef]
- Janssen, N.A.H.; Hoek, G.; Simic-Lawson, M.; Fischer, P.; van Bree, L.; ten Brink, H.; Keuken, M.; Atkinson, R.W.; Anderson, H.R.; Brunekreef, B.; et al. Black Carbon as an Additional Indicator of the Adverse Health Effects of Airborne Particles Compared with PM10 and PM2.5. Environ. Health Perspect. 2011, 119, 1691–1699. [Google Scholar] [CrossRef] [Green Version]
- Grahame, T.J.; Klemm, R.; Schlesinger, R.B. Public health and components of particulate matter: The changing assessment of black carbon. J. Air Waste Manag. Assoc. 2014, 64, 620–660. [Google Scholar] [CrossRef] [PubMed]
- Keuken, M.; Zandveld, P.; van den Elshout, S.; Janssen, N.A.H.; Hoek, G. Air quality and health impact of PM10 and EC in the city of Rotterdam, the Netherlands in 1985–2008. Atmos. Environ. 2011, 45, 5294–5301. [Google Scholar] [CrossRef]
- Bell, M.L.; Ebisu, E.; Peng, R.D.; Samet, J.M.; Dominici, F. Hospital admission and chemical composition of fine particle air pollution. Am. J. Resp. Crit. Care Med. 2009, 179, 1115–1120. [Google Scholar] [CrossRef] [PubMed] [Green Version]
- Olstrup, H.; Johansson, C.; Forsberg, B. The Use of Carbonaceous Particle Exposure Metrics in Health Impact Calculations. Int. J. Environ. Res. Public Health 2016, 13, 249. [Google Scholar] [CrossRef] [Green Version]
- Lippmann, M.; Chen, L.C.; Gordon, T.; Ito, K.; Thurston, G.D. National Particle Component Toxicity (NPACT) Initiative: Integrated epidemiologic and toxicologic studies of the health effects of particulate matter components. Res. Rep. Health Eff. Inst. 2013, 177, 5–13. [Google Scholar]
- Park, M.; Joo, H.S.; Lee, K.; Jang, M.; Kim, S.D.; Kim, I.; Borlaza, L.J.S.; Lim, H.; Shin, H.; Chung, K.H.; et al. Differential toxicities of fine particulate matters from various sources. Sci. Rep. 2018, 8, 17007. [Google Scholar] [CrossRef]
- Achilleos, S.; Kioumourtzoglou, M.A.; Wu, C.D.; Schwartz, J.D.; Koutrakis, P.; Papatheodorou, S.I. Acute effects of fine particulate matter constituents on mortality: A systematic review and meta-regression analysis. Environ. Int. 2017, 109, 89–100. [Google Scholar] [CrossRef] [PubMed]
- Yang, Y.; Ruan, Z.; Wang, X.; Yang, Y.; Mason, T.G.; Lin, H.; Tian, L. Short-term and long-term exposures to fine particulate matter constituents and health: A systematic review and meta-analysis. Environ. Pollut. 2019, 247, 874–882. [Google Scholar] [CrossRef]
- Brunekreef, B.; Forsberg, B. Epidemiological evidence of effects of coarse airborne particles on health. Eur. Respir. J. 2005, 26, 309–318. [Google Scholar] [CrossRef]
- Khan, R.K.; Strand, M.A. Road dust and its effect on human health: A literature review. Epidemiol. Health 2018, 40, e2018013. [Google Scholar] [CrossRef]
- Meister, K.; Johansson, C.; Forsberg, J. Estimated short-term effects of coarse particles on daily mortality in Stockholm, Sweden. Environ. Health Perspect. 2012, 120, 431–436. [Google Scholar] [CrossRef] [PubMed] [Green Version]
- Olstrup, H.; Johansson, C.; Forsberg, B.; Åström, C. Association between Mortality and Short-Term Exposure to Particles, Ozone and Nitrogen Dioxide in Stockholm, Sweden. Int. J. Environ. Res. Public Health 2019, 16, 1028. [Google Scholar] [CrossRef] [PubMed] [Green Version]
- Olstrup, H.; Johansson, C.; Forsberg, B.; Åström, C.; Orru, H. Seasonal Variations in the Daily Mortality Associated with Exposure to Particles, Nitrogen Dioxide, and Ozone in Stockholm, Sweden, from 2000 to 2016. Atmosphere 2021, 12, 1481. [Google Scholar] [CrossRef]
- Johansson, C.; Norman, M.; Gidhagen, L. Spatial & temporal variations of PM10 and particle number concentrations in urban air. Environ. Monit. Assess. 2007, 127, 477–487. [Google Scholar] [PubMed]
- Olstrup, H.; Johansson, C.; Forsberg, B.; Tornevi, A.; Ekebom, A.; Meister, K. A Multi-Pollutant Air Quality Health Index (AQHI) Based on Short-Term Respiratory Effects in Stockholm, Sweden. Int. J. Environ. Res. Public Health 2019, 16, 105. [Google Scholar] [CrossRef] [Green Version]
- Candeias, C.; Vicente, E.; Tomé, M.; Rocha, F.; Ávila, P.; Célia, A. Geochemical, Mineralogical and Morphological Characterisation of Road Dust and Associated Health Risks. Int. J. Environ. Res. Public Health 2020, 17, 1563. [Google Scholar] [CrossRef] [Green Version]
- Stafoggia, M.; Zauli-Sajani, S.; Pey, J.; Samoli, E.; Alessandrini, E.; Basagaña, X.; Cernigliaro, A.; Chiusolo, M.; Demaria, M.; Díaz, J.; et al. Desert dust outbreaks in Southern Europe: Contribution to daily PM10 concentrations and short-term associations with mortality and hospital admissions. Environ. Health Perspect. 2016, 124, 413–419. [Google Scholar] [CrossRef] [Green Version]
- Renzi, M.; Stafoggia, M.; Cernigliaro, A.; Calzolari, R.; Madonia, G.; Scondotto, S.; Forastiere, F. Effetti sanitari delle sabbie sahariane in Sicilia [Health effects of Saharan dust in Sicily Region (Southern Italy)]. Epidemiol. Prev. 2017, 41, 46–53. [Google Scholar]
- Kandler, K.; Scheuvens, D. Asian and Saharan dust from a chemical/mineralogical point of view: Differences and similarities from bulk and single particle measurements. In Proceedings of the E3S Web Conferences, Central Asian Dust Conference (CADUC 2019), Darmstadt, Germany, 18 June 2019; Volume 99. [Google Scholar]
- Cook, A.G.; Weinstein, P.; Centeno, J.A. Health effects of natural dust: Role of trace elements and compounds. Biol. Trace. Elem. Res. 2005, 103, 1–15. [Google Scholar] [CrossRef]
- Khaliullin, T.O.; Kisin, E.R.; Yanamala, N.; Guppi, S.; Harper, M.; Lee, T.; Shvedova, A.A. Comparative cytotoxicity of respirable surface-treated/untreated calcium carbonate rock dust particles in vitro. Toxicol. Appl. Pharmacol. 2019, 362, 67–76. [Google Scholar] [CrossRef]
- Suherdin, S.; Dwi Mulya, K.; Dian Kurniawati, R. Dust Exposure to the Lung Function Capacity of Limestone Industry Workers in West Bandung Regency. J. Ilmu Kesehat. Masy. 2019, 10, 172–183. [Google Scholar] [CrossRef]
- Grytting, V.S.; Refsnes, M.; Øvrevik, J.; Halle, M.S.; Schönenberger, J.; van der Lelij, R.; Snilsberg, B.; Skuland, T.; Blom, R.; Låg, M. Respirable stone particles differ in their ability to induce cytotoxicity and pro-inflammatory responses in cell models of the human airways. Part. Fibre Toxicol. 2021, 18, 18. [Google Scholar] [CrossRef]
- Åtgärdsprogram för Minskning av Skadliga Partiklar (PM10) i Visby. Region Gotland. MBNV 2019-2745 (MHN 2015/434). Available online: https//:www.naturvardsverket.se/globalassets/vagledning/luft-och-klimat/mkn-utomhusluft/atgardsprogram-for-minskning-av-skadliga-partiklar-i-visby.pdf (accessed on 7 June 2022).
- Swedish Meteorological and Hydrological Institute (SMHI). Data Host for Air Quality. Available online: https://www.smhi.se/data/miljo/luftmiljodata (accessed on 7 June 2022).
- Ostro, B.; Roth, L.; Malig, B.; Marty, M. The effects of fine particle components on respiratory hospital admissions in children. Environ. Health. Perspect. 2009, 117, 475–480. [Google Scholar] [CrossRef] [PubMed] [Green Version]
- Khan, M.S.; Coulibaly, S.; Matsumoto, T.; Yano, Y.; Miura, M.; Nagasaka, Y.; Shima, M.; Yamagishi, N.; Wakabayashi, K.; Watanabe, T. Association of airborne particles, protein, and endotoxin with emergency department visits for asthma in Kyoto, Japan. Environ. Health Prev. Med. 2018, 23, 41. [Google Scholar] [CrossRef] [PubMed]
- Schwarze, P.E.; Øvrevik, J.; Hetland, R.B.; Becher, R.; Cassee, F.R.; Låg, M.; Løvik, M.; Dybing, E.; Refsnes, M. Importance of size and composition of particles for effects on cells in vitro. Inhal. Toxicol. 2007, 19, 17–22. [Google Scholar] [CrossRef] [PubMed]


| Healthcare Unit | All Respiratory (ICD-10: J00–J99) | Upper Airways (ICD-10: J0, J3) | Lower Airways (ICD-10: J1, J4) | Asthma (ICD-10: J45, J46) |
|---|---|---|---|---|
| Visby hospital (acute care visits at specialist clinics) | 37,736 | 14,751 | 16,636 | 9297 |
| Primary healthcare on-call unit and hospital emergency department (ERD) | 10,886 | 5347 | 3390 | 1076 |
| Primary healthcare centers | 29,389 | 19,420 | 7888 | 3090 |
| Min. | 25th Percentile | Median | Mean | 75th Percentile | Max. | SD | N | |
|---|---|---|---|---|---|---|---|---|
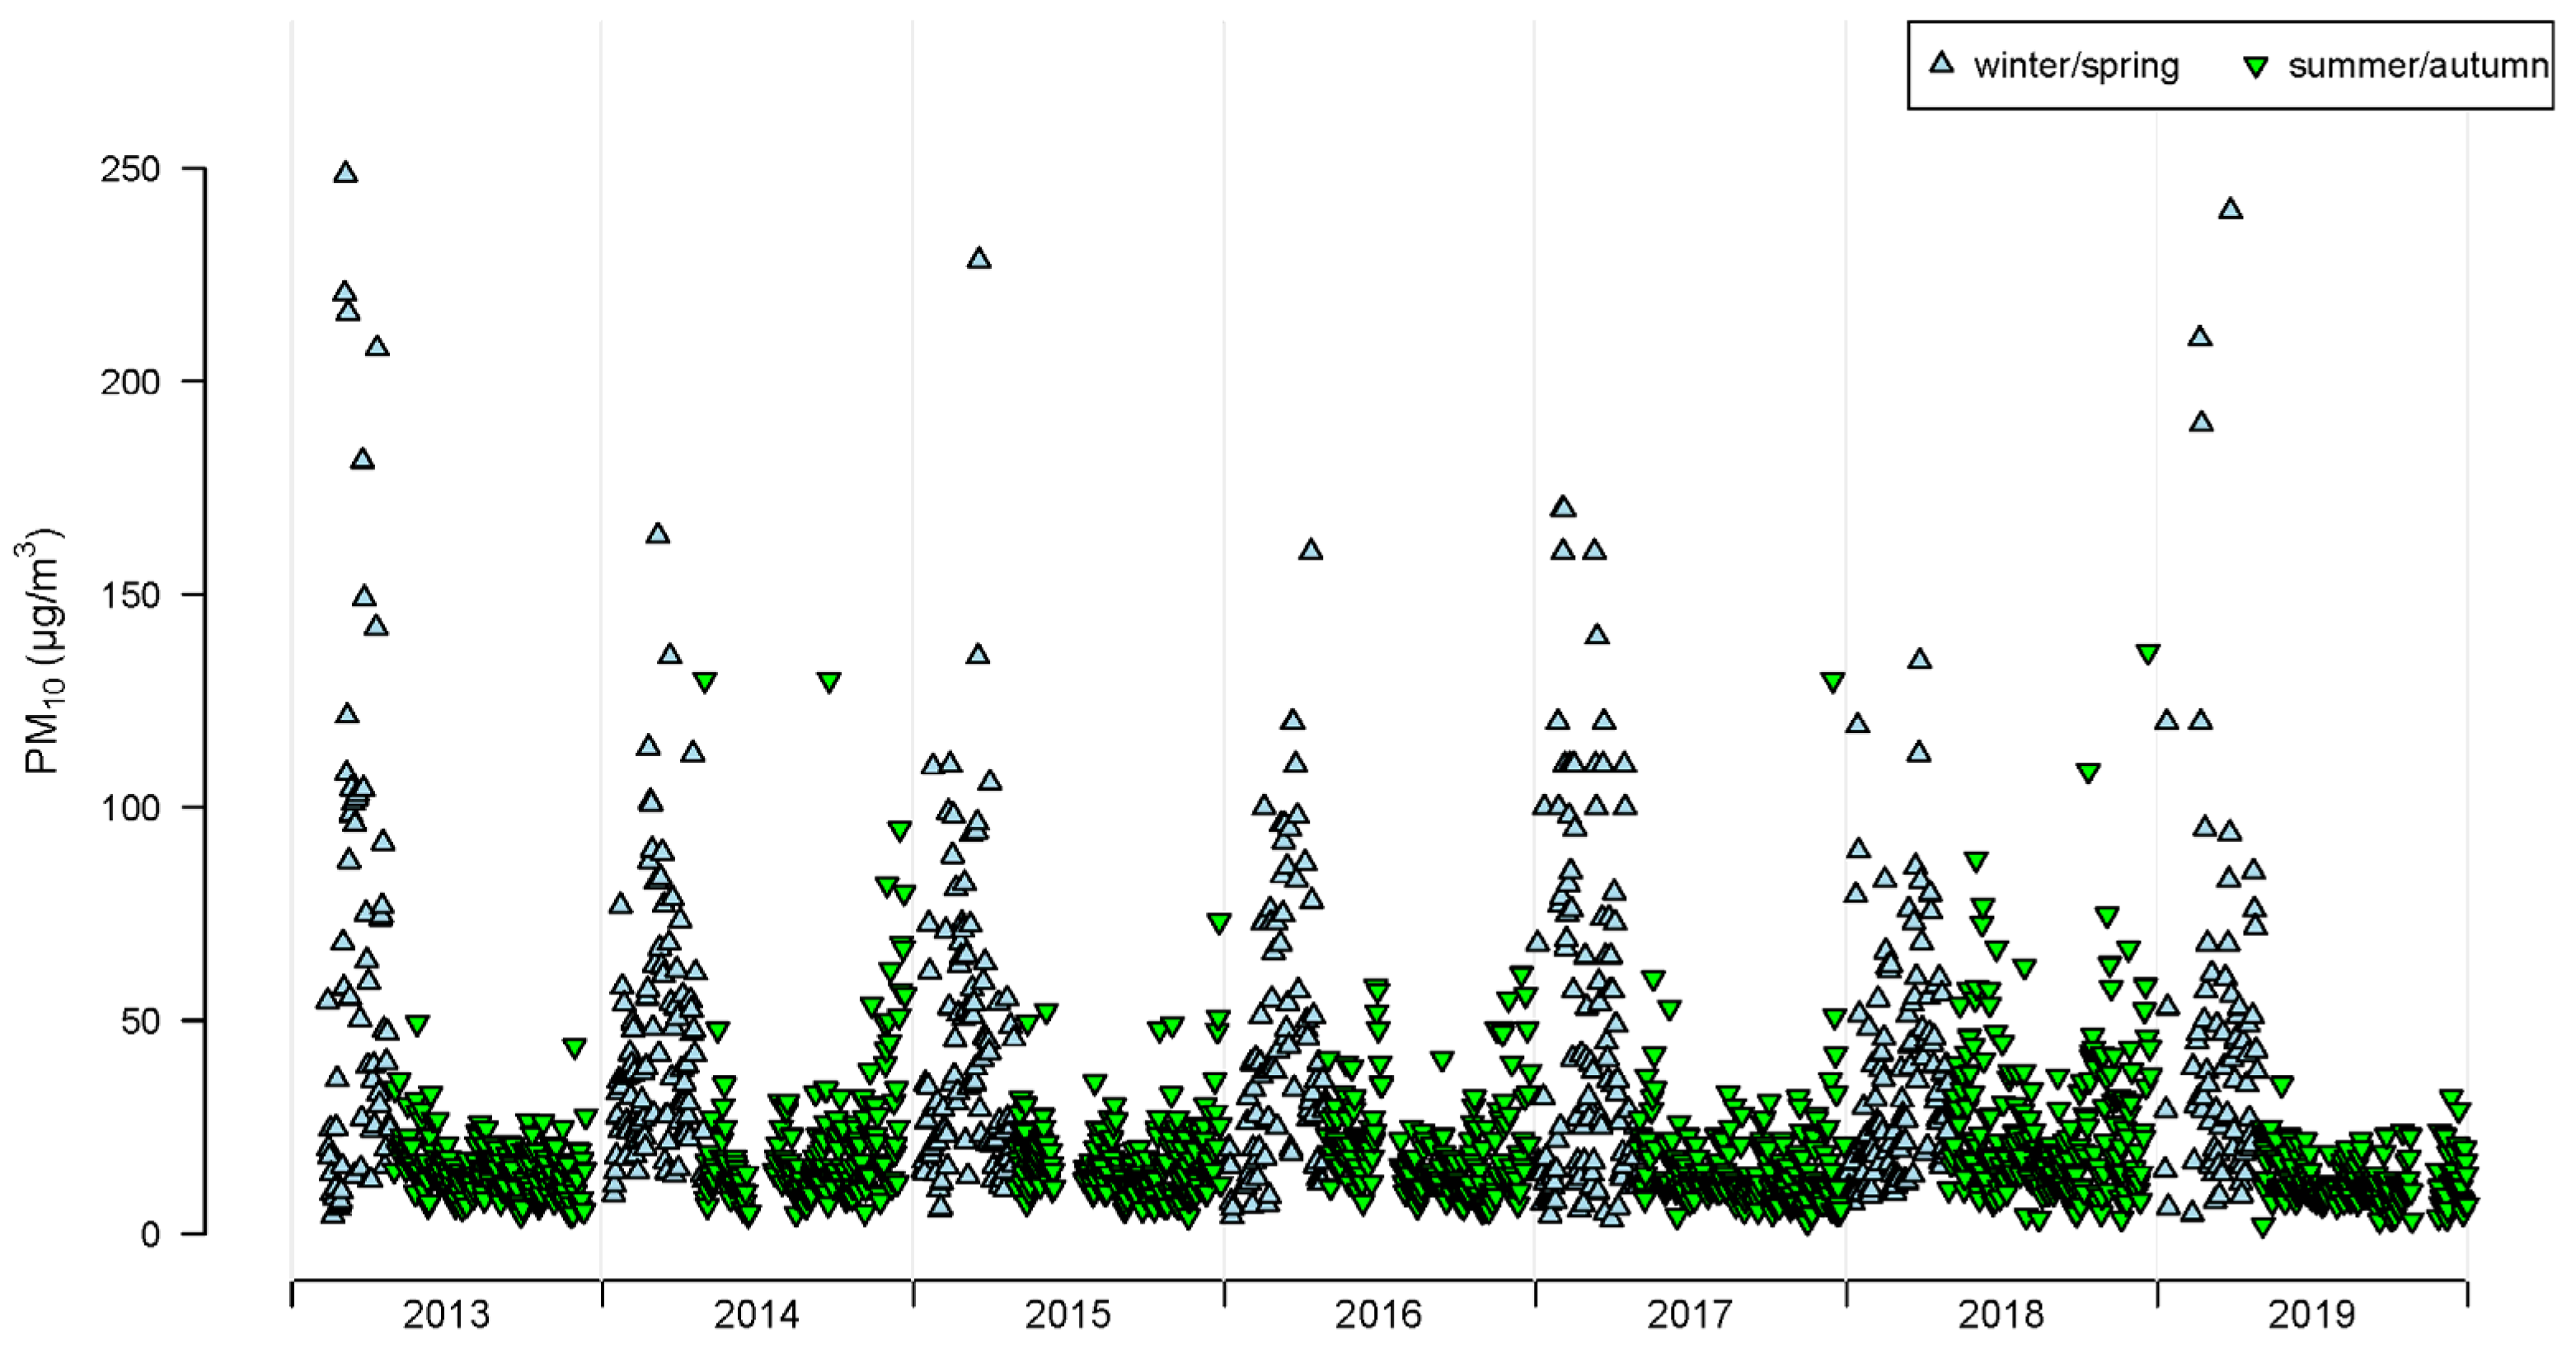
| PM10 (whole year) (µg m−3) | 2.2 | 11.8 | 17 | 26.1 | 29 | 248.6 | 26.1 | 2140 |
| PM10 (winter/spring) (µg m−3) | 3.5 | 18.3 | 34 | 45 | 59.1 | 248.6 | 37.5 | 657 |
| PM10 (summer/autumn) (µg m−3) | 2.2 | 10.5 | 14.8 | 18 | 21 | 136.6 | 13 | 1483 |
| Temperature (whole year) (°C) | −10.4 | 2.9 | 7.2 | 8.2 | 14.2 | 25.8 | 6.8 | 2702 |
| Relative humidity (whole year) (%) | 46.7 | 76.7 | 85.2 | 83.9 | 92.6 | 100 | 10.7 | 2674 |
| Diagnose Group | Age Group | Relative Risk [95% CI] Winter/Spring | Relative Risk [95% CI] Summer/Autumn |
|---|---|---|---|
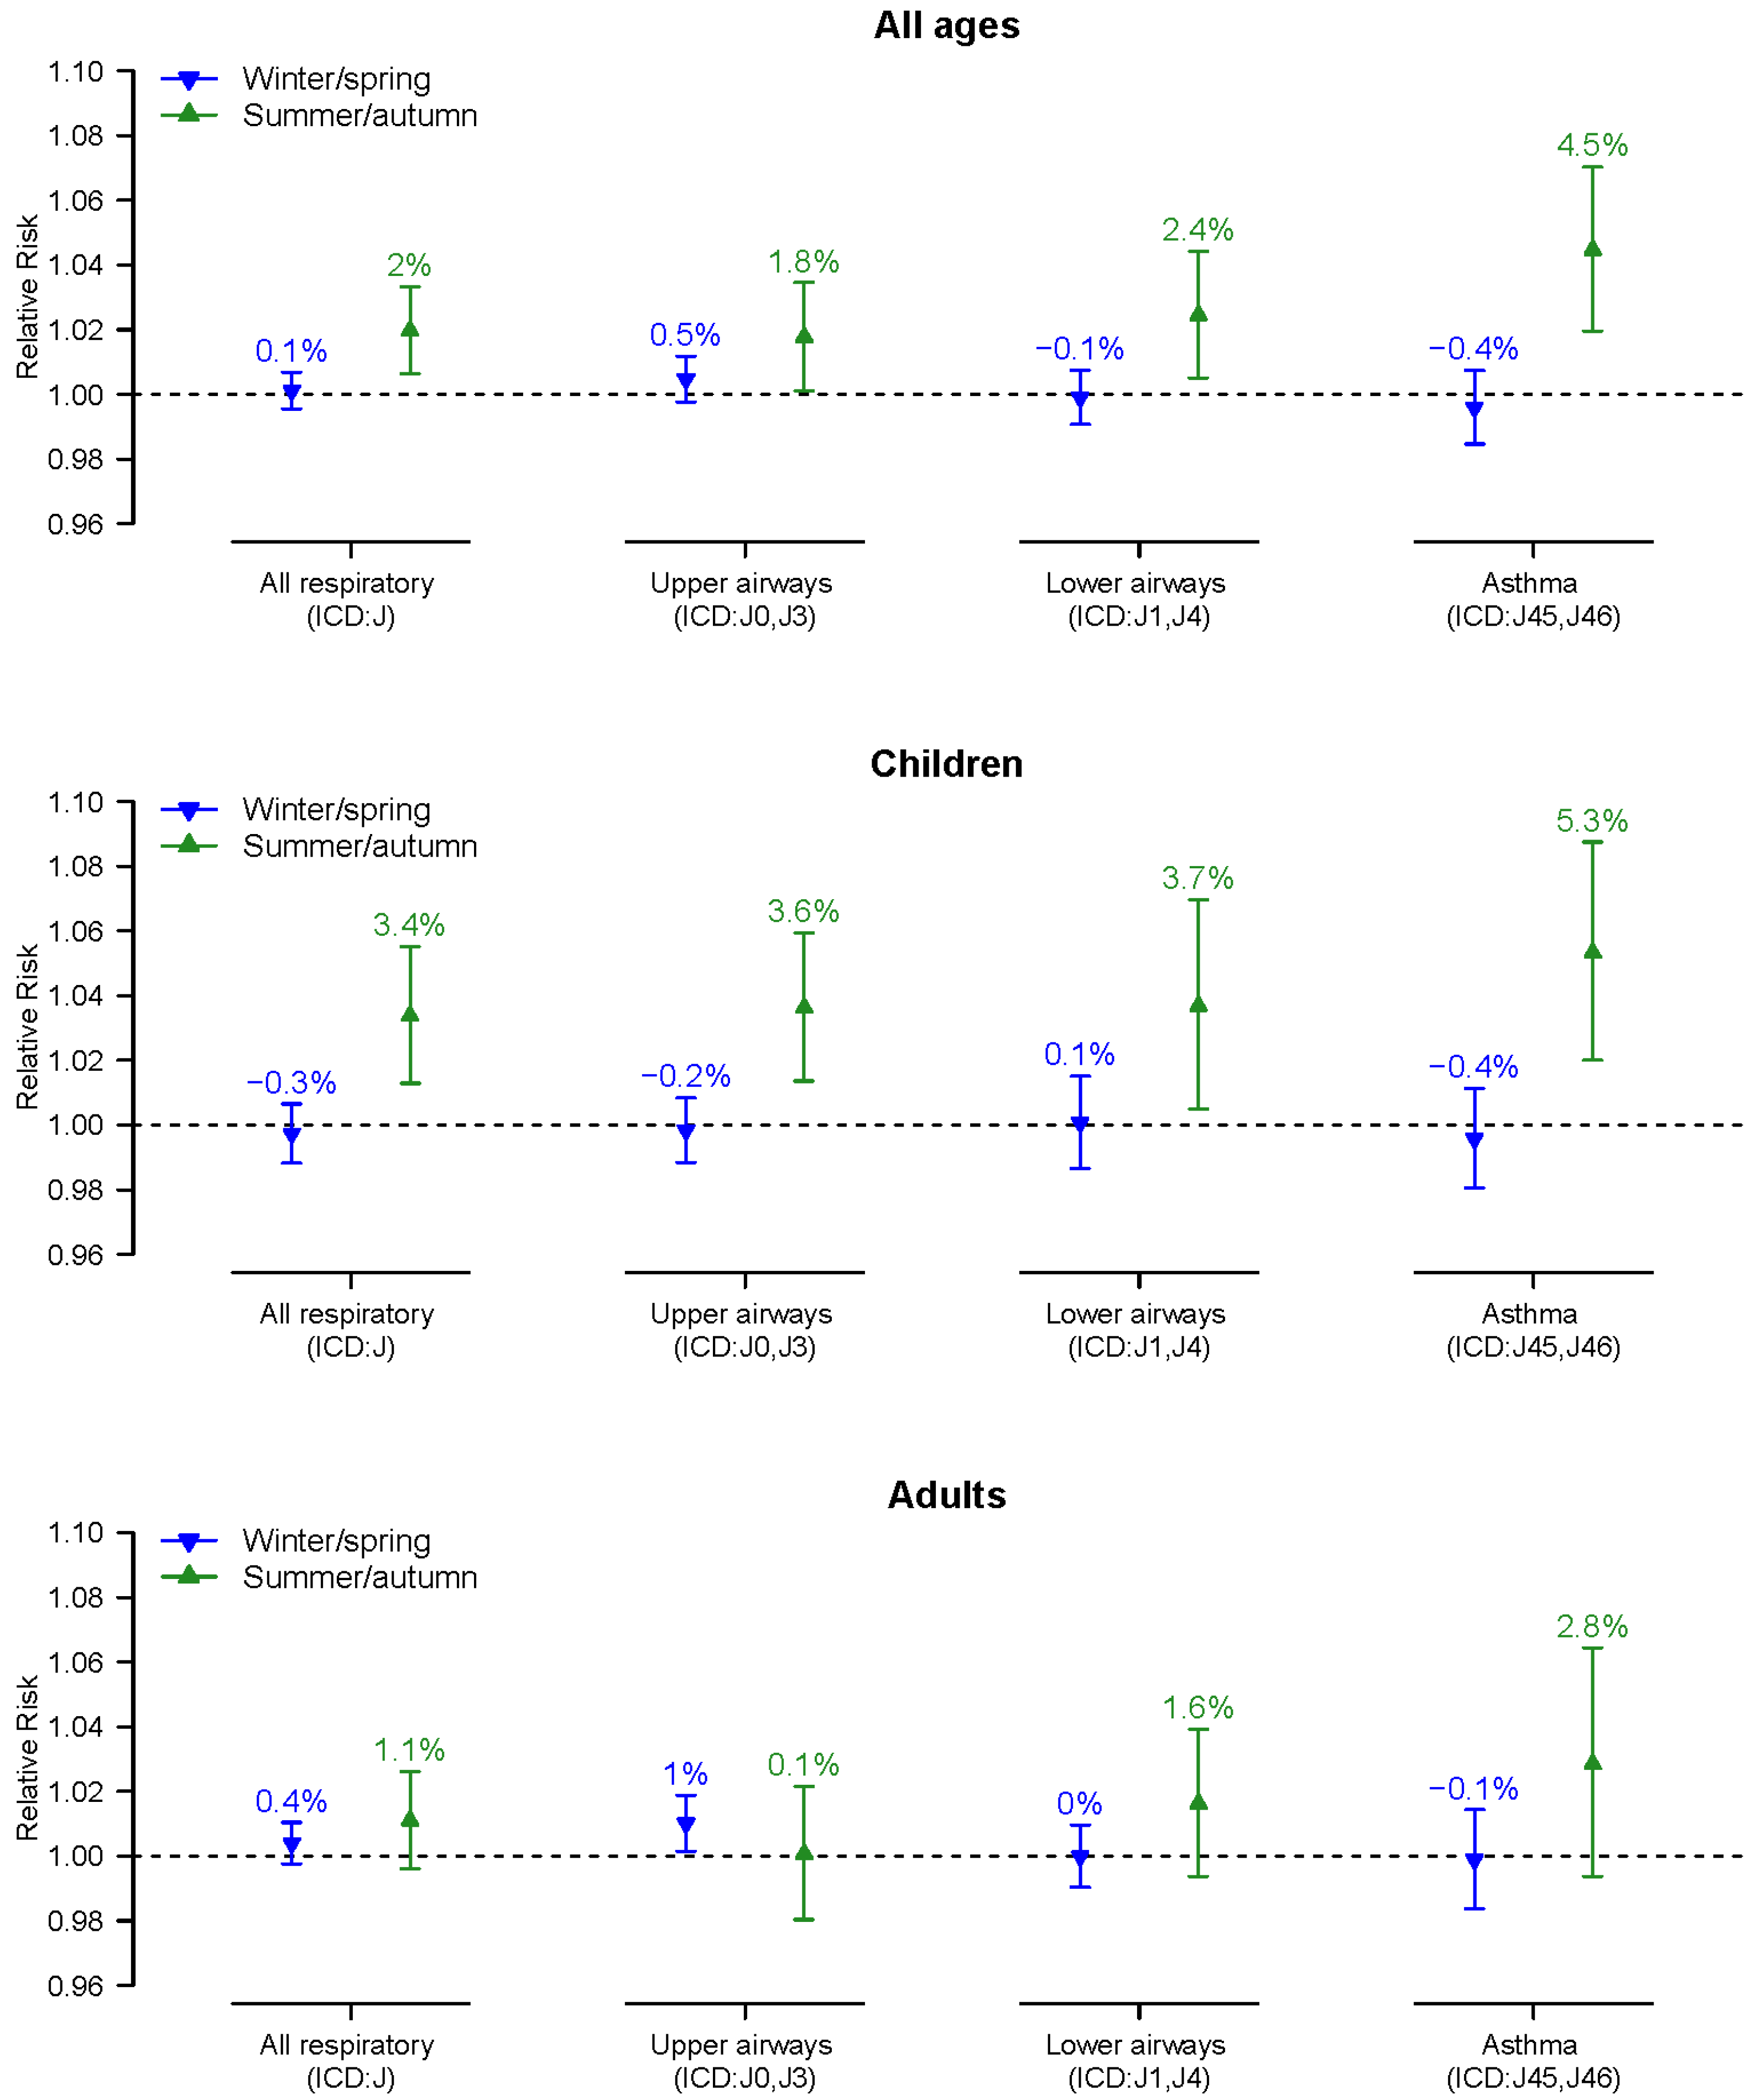
| All respiratory (ICD-10: J) | All ages | 1.001 [0.996–1.007] | 1.020 [1.006–1.033] |
| All respiratory (ICD-10: J) | Children (0–17 yr) | 0.997 [0.988–1.007] | 1.034 [1.013–1.055] |
| All respiratory (ICD-10: J) | Adults (>17 yr) | 1.004 [0.998–1.010] | 1.011 [0.996–1.026] |
| Upper airways (ICD-10: J0, J3) | All ages | 1.005 [0.998–1.012] | 1.018 [1.001–1.035] |
| Upper airways (ICD-10: J0, J3) | Children (0–17 yr) | 0.998 [0.988–1.008] | 1.036 [1.014–1.059] |
| Upper airways (ICD-10: J0, J3) | Adults (>17 yr) | 1.010 [1.001–1.019] | 1.001 [0.980–1.021] |
| Lower airways (ICD-10: J1, J4) | All ages | 0.999 [0.991–1.007] | 1.024 [1.005–1.044] |
| Lower airways (ICD-10: J1, J4) | Children (0–17 yr) | 1.001 [0.987–1.015] | 1.037 [1.005–1.070] |
| Lower airways (ICD-10: J1, J4) | Adults (>17 yr) | 1.000 [0.990–1.010] | 1.016 [0.994–1.039] |
| Asthma (ICD-10: J45, J46) | All ages | 0.996 [0.985–1.007] | 1.045 [1.020–1.070] |
| Asthma (ICD-10: J45, J46) | Children (0–17 yr) | 0.996 [0.980–1.011] | 1.053 [1.020–1.087] |
| Asthma (ICD-10: J45, J46) | Adults (>17 yr) | 0.999 [0.984–1.014] | 1.028 [0.994–1.064] |
Publisher’s Note: MDPI stays neutral with regard to jurisdictional claims in published maps and institutional affiliations. |
© 2022 by the authors. Licensee MDPI, Basel, Switzerland. This article is an open access article distributed under the terms and conditions of the Creative Commons Attribution (CC BY) license (https://creativecommons.org/licenses/by/4.0/).
Share and Cite
Tornevi, A.; Olstrup, H.; Forsberg, B. Short-Term Associations between PM10 and Respiratory Health Effects in Visby, Sweden. Toxics 2022, 10, 333. https://doi.org/10.3390/toxics10060333
Tornevi A, Olstrup H, Forsberg B. Short-Term Associations between PM10 and Respiratory Health Effects in Visby, Sweden. Toxics. 2022; 10(6):333. https://doi.org/10.3390/toxics10060333
Chicago/Turabian StyleTornevi, Andreas, Henrik Olstrup, and Bertil Forsberg. 2022. "Short-Term Associations between PM10 and Respiratory Health Effects in Visby, Sweden" Toxics 10, no. 6: 333. https://doi.org/10.3390/toxics10060333
APA StyleTornevi, A., Olstrup, H., & Forsberg, B. (2022). Short-Term Associations between PM10 and Respiratory Health Effects in Visby, Sweden. Toxics, 10(6), 333. https://doi.org/10.3390/toxics10060333