Environmental Geochemistry and Fractionation of Cadmium Metal in Surficial Bottom Sediments and Water of the Nile River, Egypt
Abstract
1. Introduction
2. Materials and Methods
2.1. Study Area
2.2. Sampling and Geochemical Analysis
2.3. Sequential Extraction Fraction Method
2.4. The Pollution Level Estimation
2.4.1. Enrichment Factor (EF)
2.4.2. Contamination Factor (CF)
2.4.3. Index of Geo-Accumulation (Igeo)
2.4.4. Ecological Risk Index (Er)
3. Results
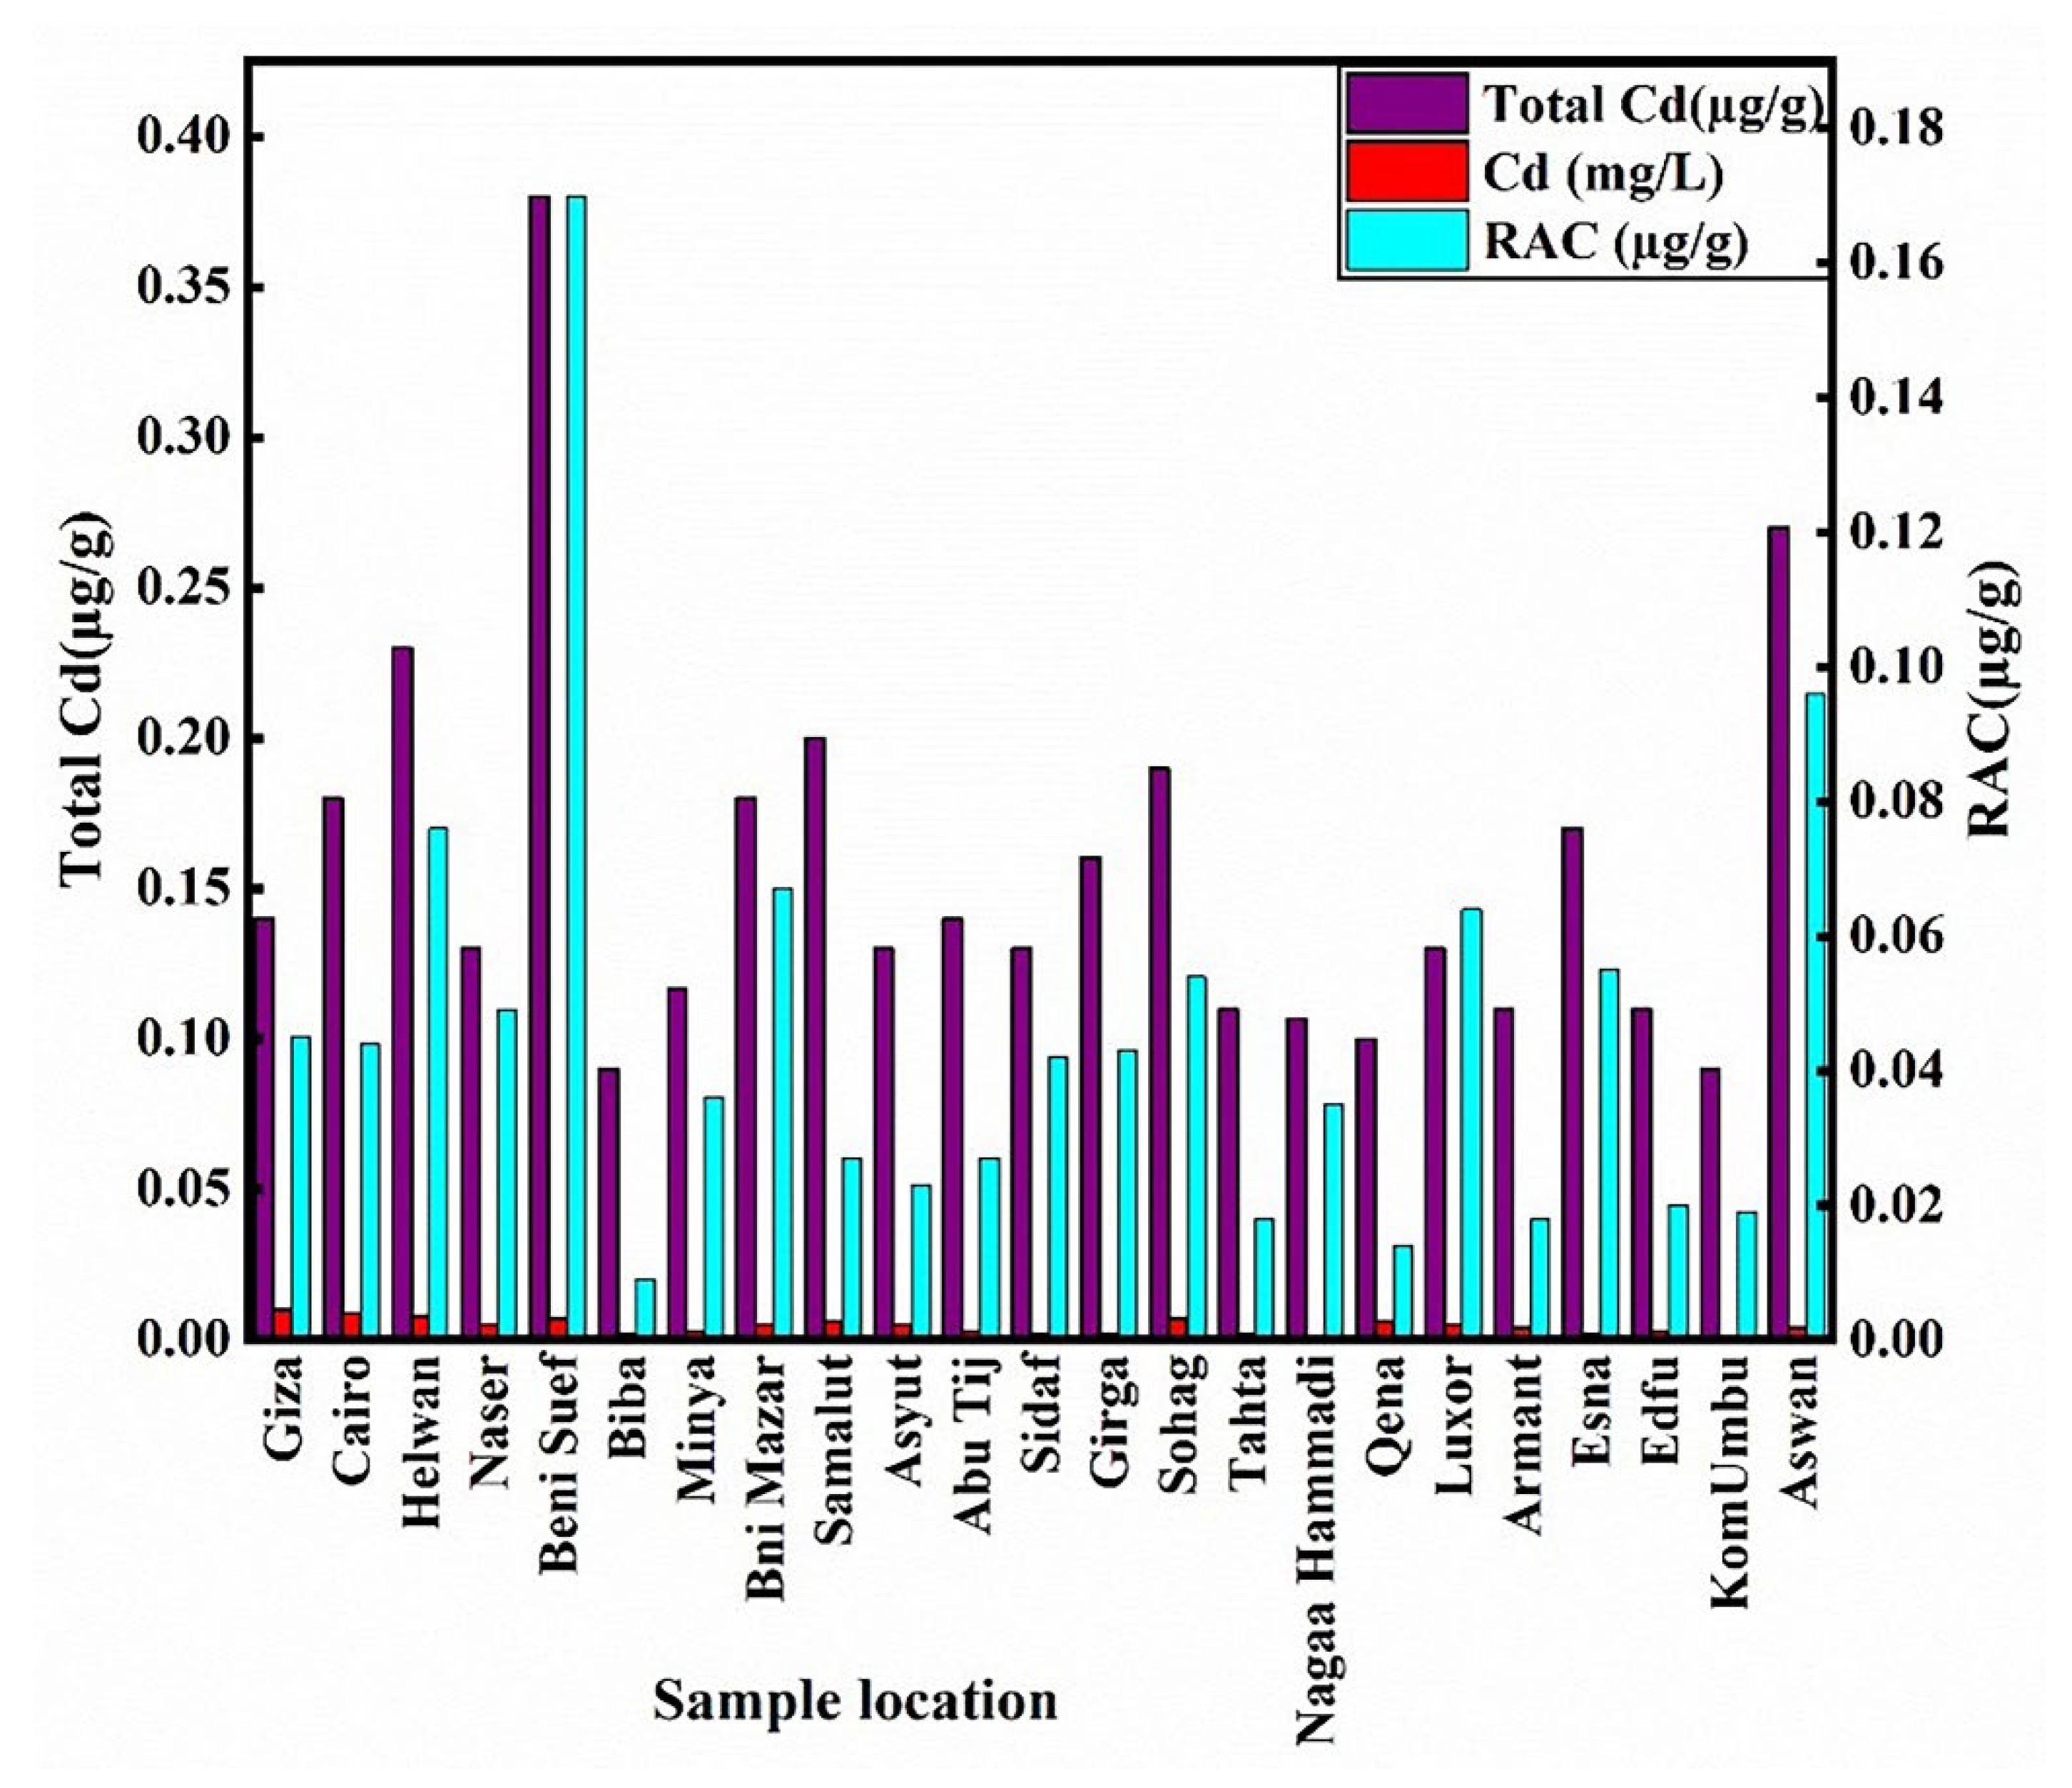
3.1. Cd Distribution in Sediments
3.2. Pollution Level
3.3. Sequential Extraction Fractions of Cadmium
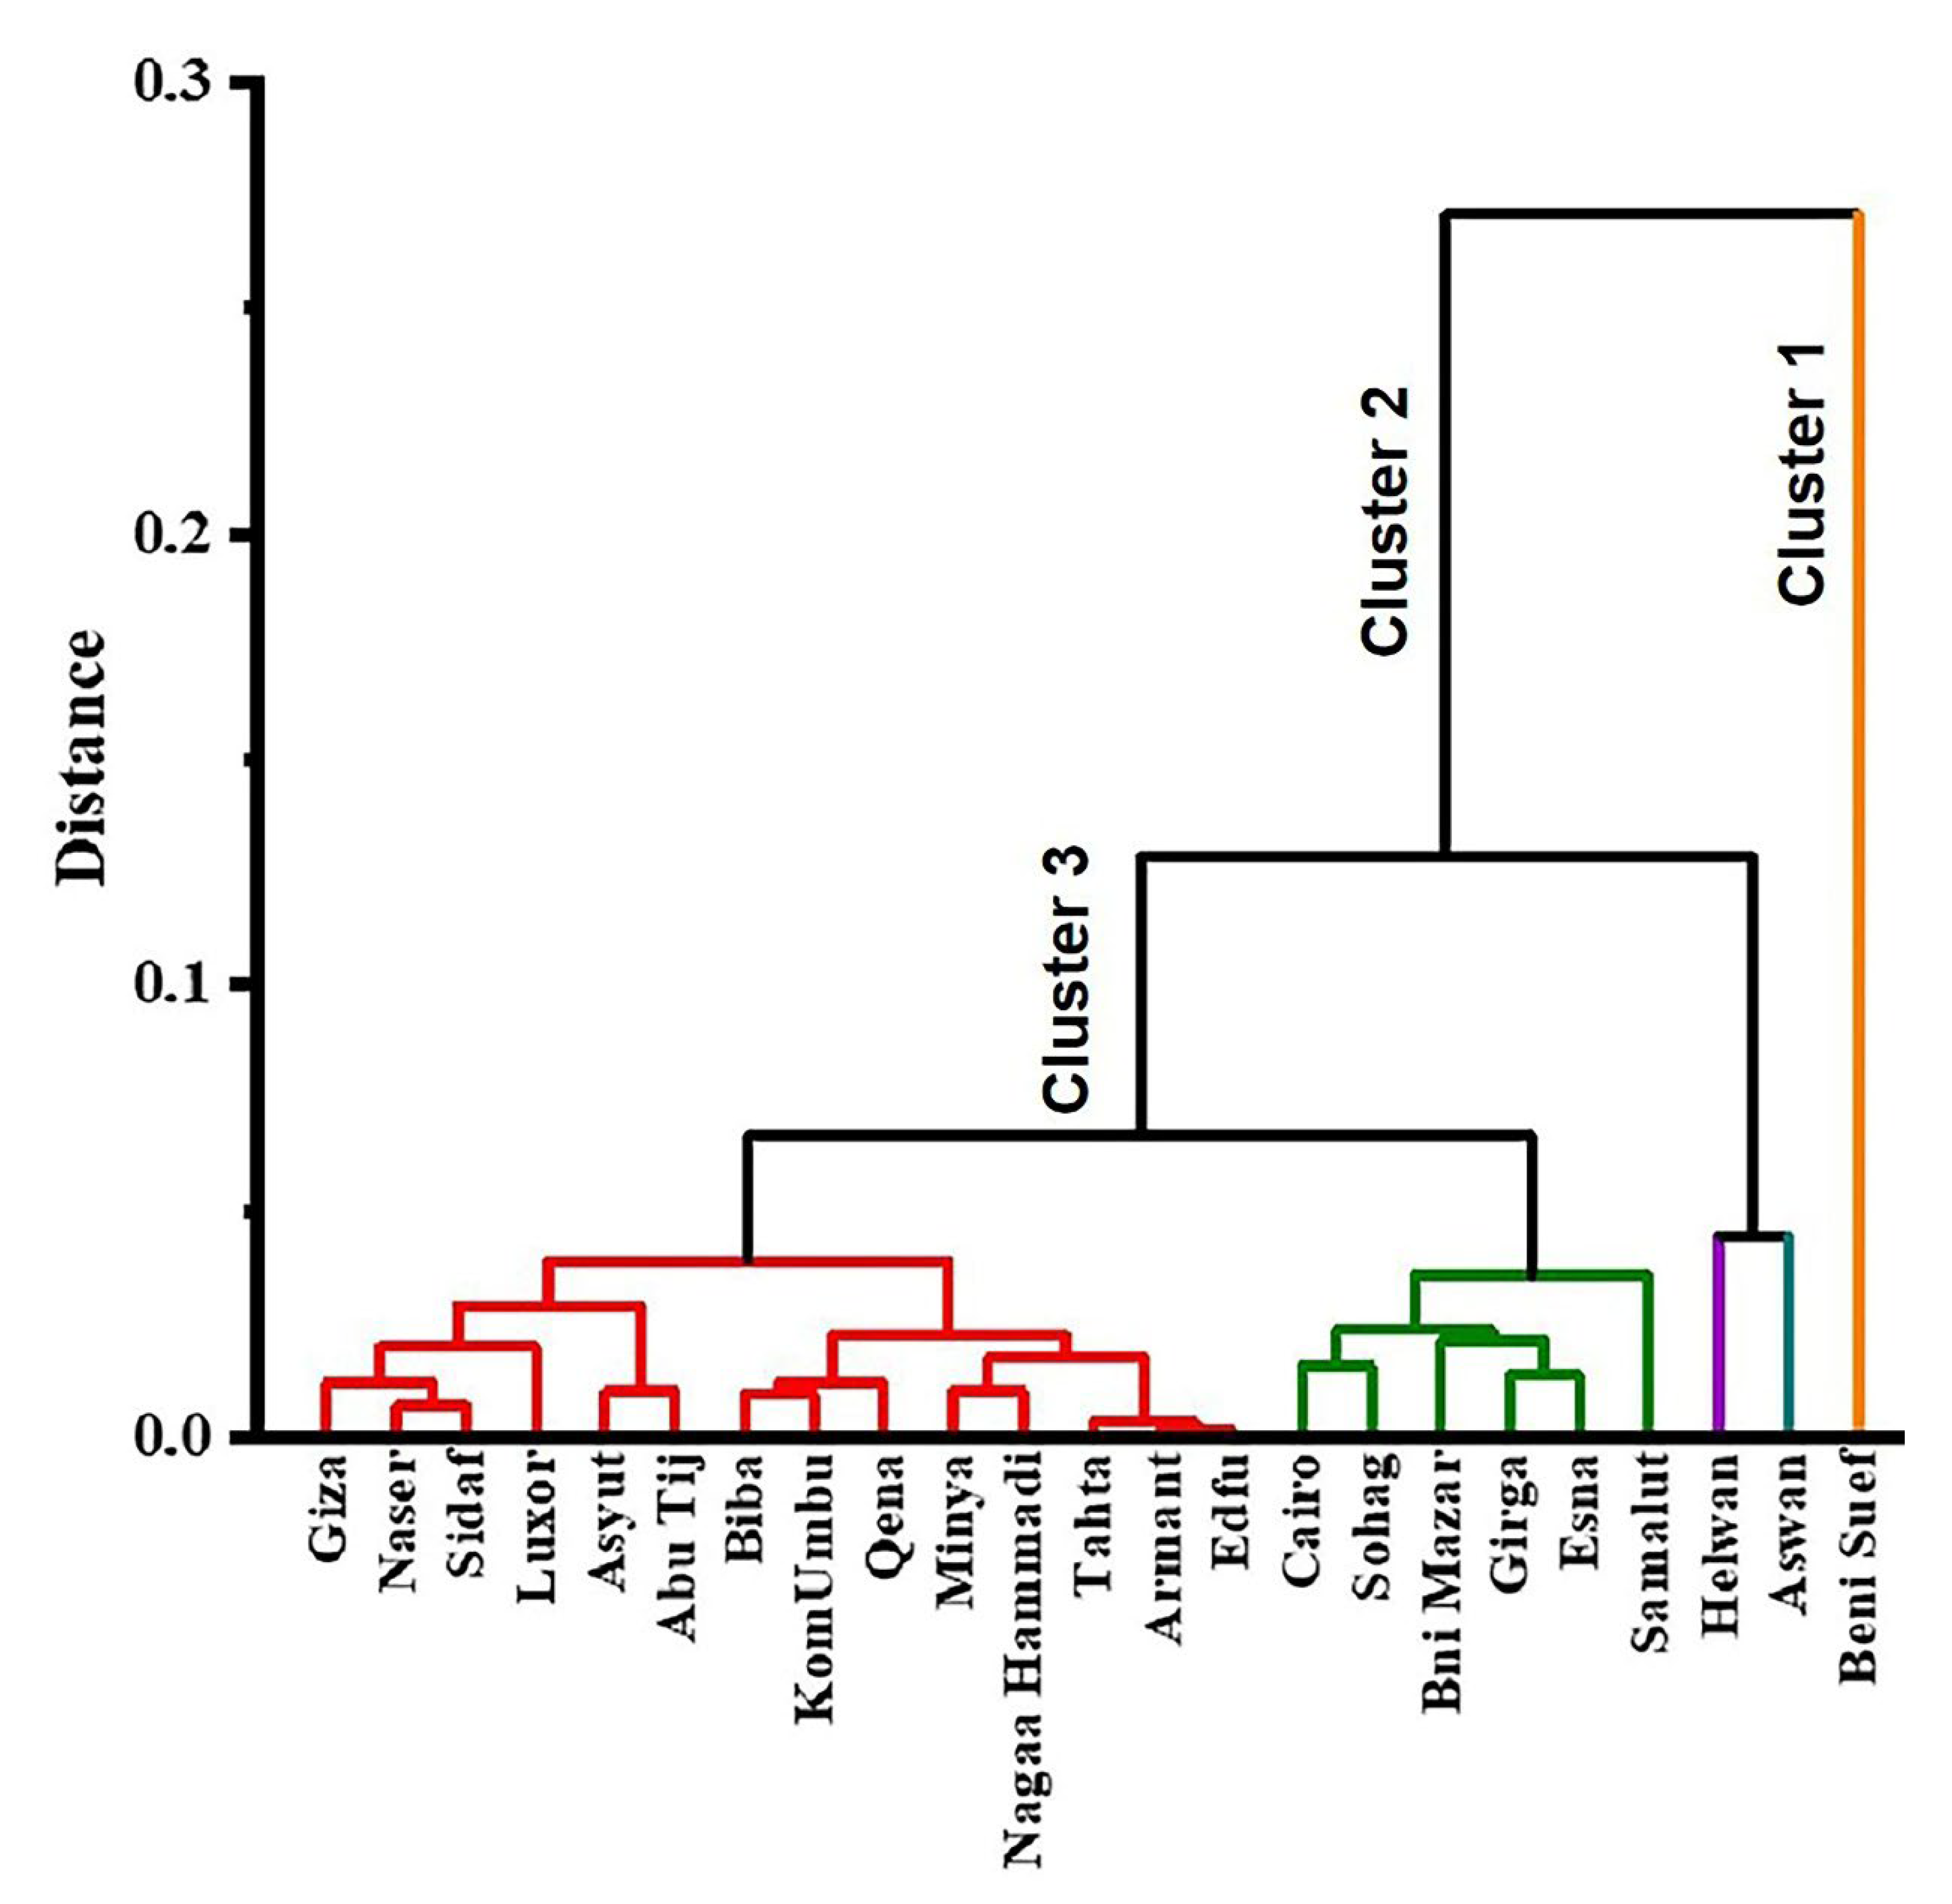
3.4. Multivariate Statistical Analysis (Cluster Analysis)
3.5. Analysis of Cadmium Concentrations in Water
4. Discussion
5. Conclusions
Author Contributions
Funding
Data Availability Statement
Acknowledgments
Conflicts of Interest
Correction Statement
Abbreviations
| ICP-MS | Inductively Coupled Plasma Mass Spectrometry |
| ICP-AES | Inductively Coupled Plasma Atomic Emission Spectroscopy |
| TDS | Total Dissolved Solids. |
| ORP | Oxidation-Reduction Potential. |
| BCR | European Community Bureau of Reference |
| WHO | World Health Organization. |
| USEPA | United States Environmental Protection Agency. |
| CCME | Canadian Council of Ministers of Environment |
| ATSDR | Agency for Toxic Substances and Disease Registry, USA |
References
- Elias, M.S.; Ibrahim, S.; Samuding, K.; Rahman, S.A.; Wo, Y.M.; Daung, J.A.D. Multivariate Analysis for Source Identification of Pollution in Sediment of Linggi River, Malaysia. Environ. Monit. Assess. 2018, 190, 257. [Google Scholar] [CrossRef] [PubMed]
- Salman, S.A.; Asmoay, A.A.; El-Gohary, A.; Sabet, H. Evaluation of Human Risks of Surface Water and Groundwater Contaminated with Cd and Pb in the Southern El-Minya Governorate, Egypt. Drink. Water Eng. Sci. 2019, 12, 23–30. [Google Scholar] [CrossRef]
- Zeid, S.A.M.; Seleem, E.M.; Salman, S.A.; Abdel-Hafiz, M.A. Water Quality Index of Shallow Groundwater and Assessment for Different Usages in El-Obour City. Available online: https://www.scopus.com/record/display.uri?eid=2-s2.0-85061319004&origin=inward (accessed on 8 October 2021).
- Yilmaz, A.B.; Sangün, M.K.; Yaǧlioǧlu, D.; Turan, C. Metals (Major, Essential to Non-Essential) Composition of the Different Tissues of Three Demersal Fish Species from İskenderun Bay, Turkey. Food Chem. 2010, 123, 410–415. [Google Scholar] [CrossRef]
- Calabrese, S.; Aiuppa, A.; Allard, P.; Bagnato, E.; Bellomo, S.; Brusca, L.; D’Alessandro, W.; Parello, F. Atmospheric Sources and Sinks of Volcanogenic Elements in a Basaltic Volcano (Etna, Italy). Geochim. Et Cosmochim. Acta 2011, 75, 7401–7425. [Google Scholar] [CrossRef]
- Quezada-Hinojosa, R.P.; Föllmi, K.B.; Verrecchia, E.; Adatte, T.; Matera, V. Speciation and Multivariable Analyses of Geogenic Cadmium in Soils at Le Gurnigel, Swiss Jura Mountains. CATENA 2015, 125, 10–32. [Google Scholar] [CrossRef]
- Korte, F. Ecotoxicology of Cadmium: General Overview. Ecotoxicol. Environ. Saf. 1983, 7, 3–8. [Google Scholar] [CrossRef]
- WHO Nordic Council of Ministers. Cadmium Review; WHO Nordic Council of Ministers: Copenhagen, Denmark, 2003. [Google Scholar]
- Pinto, A.P.; Mota, A.M.; de Varennes, A.; Pinto, F.C. Influence of Organic Matter on the Uptake of Cadmium, Zinc, Copper, and Iron by Sorghum Plants. Sci. Total Environ. 2004, 326, 239–247. [Google Scholar] [CrossRef]
- World Health Organization. Environmental Health Criteria 134, Cadmium; WHO: Geneva, Switzerland, 1992. [Google Scholar]
- Lado, L.R.; Hengl, T.; Reuter, H.I. Heavy Metals in European Soils: A Geostatistical Analysis of the FOREGS Geochemical Database. Geoderma 2008, 148, 189–199. [Google Scholar] [CrossRef]
- Satarug, S.; Baker, J.R.; Urbenjapol, S.; Haswell-Elkins, M.; Reilly, P.E.B.; Williams, D.J.; Moore, M.R. A Global Perspective on Cadmium Pollution and Toxicity in Non-Occupationally Exposed Population. Toxicol. Lett. 2003, 137, 65–83. [Google Scholar] [CrossRef]
- Bandow, N.; Simon, F.G. Significance of Cadmium from Artists’ Paints to Agricultural Soil and the Food Chain. Environ. Sci. Eur. 2016, 28, 16. [Google Scholar] [CrossRef]
- Kramarz, S. Cadmium in Lebensmitteln; Bundesinstitut Für Risikobewertung: Berlin, Germany, 2009. [Google Scholar]
- Page, A.; Chang, A.; El-Amamy, M. Chapter 10: Cadmium Levels in Soils and Crops in the Cadmium Levels in Soils and Crops in the United States. In Lead, Mercury, Cadmium and Arsenic in the Environment; Hutchinson, T.C., Meema, K.M., Eds.; Wiley: New York, NY, USA, 1987. [Google Scholar]
- Perera, P.A.C.T.; Kodithuwakku, S.P.; Sundarabarathy, T.V.; Edirisingh, U. Bioaccumulation of Cadmium in Freshwater Fish: An Environmental Perspective. Insight Ecol. 2015, 4, 1–12. [Google Scholar] [CrossRef]
- Fielding, L.; Najman, Y.; Millar, I.; Butterworth, P.; Garzanti, E.; Vezzoli, G.; Barfod, D.; Kneller, B. The Initiation and Evolution of the River Nile. Earth Planet. Sci. Lett. 2018, 489, 166–178. [Google Scholar] [CrossRef]
- Padoan, M.; Garzanti, E.; Harlavan, Y.; Villa, I.M. Tracing Nile Sediment Sources by Sr and Nd Isotope Signatures (Uganda, Ethiopia, Sudan). Geochim. Et Cosmochim. Acta 2011, 75, 3627–3644. [Google Scholar] [CrossRef]
- Stanley, D.J.; Wingerath, J.G. Nile Sediment Dispersal Altered by the Aswan High Dam: The Kaolinite Trace. Mar. Geol. 1996, 133, 1–9. [Google Scholar] [CrossRef]
- Omar, M.; Ahmed, M. Water Management in Egypt for Facing the Future Challenges. J. Adv. Res. 2016, 7, 403–412. [Google Scholar] [CrossRef]
- El-Kammar, A.; Ali, B.H.; El-Badry, A. Environmental Geochemistry of River Nile Bottom Sediments Between Aswan and Isna, Upper Egypt. J. Appl. Sci. Res. 2009, 5, 585–594. [Google Scholar]
- Darwish, M.A.G. Geochemistry of the High Dam Lake Sediments, South Egypt: Implications for Environmental Significance. Int. J. Sediment Res. 2013, 28, 544–559. [Google Scholar] [CrossRef]
- Abou El-Anwar, E.; Salman, S.; Asmoay, A.; Elnazer, A. Geochemical, Mineralogical and Pollution Assessment of River Nile Sediments at Assiut Governorate, Egypt. J. Afr. Earth Sci. 2021, 180, 104227. [Google Scholar] [CrossRef]
- El Baz, S.M.; Khalil, M.M. Assessment of Trace Metals Contamination in the Coastal Sediments of the Egyptian Mediterranean Coast. J. Afr. Earth Sci. 2018, 143, 195–200. [Google Scholar] [CrossRef]
- Osman, A.G.M.; Kloas, W. Water Quality and Heavy Metal Monitoring in Water, Sediments, and Tissues of the African Catfish Clarias Gariepinus (Burchell, 1822) from the River Nile, Egypt. J. Environ. Prot. 2010, 1, 389–400. [Google Scholar] [CrossRef]
- Abdou, K.A.; Khadiga, I.A.; Mahmoud, A.S.; Housen, M.S. Distributions of Metals (Cadmium, Lead, Iron, Manganese, Zinc and Copper) in Water, Aquatic Plant and Fish. Available online: https://www.researchgate.net/publication/304673812_Distributions_of_metals_cadmium_lead_iron_manganese_zinc_and_copper_in_water_aquatic_plant_and_fish (accessed on 14 September 2021).
- Alm-Eldeen, A.A.; Donia, T.; Alzahaby, S. Comparative Study on the Toxic Effects of Some Heavy Metals on the Nile Tilapia, Oreochromis Niloticus, in the Middle Delta, Egypt. Environ. Sci. Pollut. Res. 2018, 25, 14636–14646. [Google Scholar] [CrossRef] [PubMed]
- Dahshan, H.; Abd-Elall, A.M.; Megahed, A.M. Trace Metal Levels in Water, Fish, and Sediment from River Nile, Egypt: Potential Health Risks Assessment. J. Toxicol. Environ. Health A 2013, 76, 1183–1187. [Google Scholar] [CrossRef] [PubMed]
- Omar, W.A.; Mikhail, W.Z.; Abdo, H.M.; Abou El Defan, T.A.; Poraas, M.M. Ecological Risk Assessment of Metal Pollution along Greater Cairo Sector of the River Nile, Egypt, Using Nile Tilapia, Oreochromis Niloticus, as Bioindicator. J. Toxicol. 2015, 2015, 167319. [Google Scholar] [CrossRef] [PubMed]
- Abdelhafiz, M.A.; Elnazer, A.A.; Seleem, E.-M.M.; Mostafa, A.; Al-Gamal, A.G.; Salman, S.A.; Feng, X. Chemical and Bacterial Quality Monitoring of the Nile River Water and Associated Health Risks in Qena–Sohag Sector, Egypt. Environ. Geochem. Health 2021, 43, 4089–4104. [Google Scholar] [CrossRef]
- APHA (American Public Health Association). Standard Methods for Examination of Water and Waste Water, 23rd ed.; APHA: Washington, DC, USA, 2002. [Google Scholar]
- Schulte, P.; Lehmkuhl, F.; Steininger, F.; Loibl, D.; Lockot, G.; Protze, J.; Fischer, P.; Stauch, G. Influence of HCl Pretreatment and Organo-Mineral Complexes on Laser Diffraction Measurement of Loess–Paleosol-Sequences. CATENA 2016, 137, 392–405. [Google Scholar] [CrossRef]
- Antoine, P.; Rousseau, D.D.; Moine, O.; Kunesch, S.; Hatté, C.; Lang, A.; Tissoux, H.; Zöller, L. Rapid and Cyclic Aeolian Deposition during the Last Glacial in European Loess: A High-Resolution Record from Nussloch, Germany. Quat. Sci. Rev. 2009, 28, 2955–2973. [Google Scholar] [CrossRef]
- Bittelli, M.; Pellegrini, S.; Olmi, R.; Andrenelli, M.C.; Simonetti, G.; Borrelli, E.; Morari, F. Experimental Evidence of Laser Diffraction Accuracy for Particle Size Analysis. Geoderma 2022, 409, 115627. [Google Scholar] [CrossRef]
- Schulte, P.; Lehmkuhl, F. The Difference of Two Laser Diffraction Patterns as an Indicator for Post-Depositional Grain Size Reduction in Loess-Paleosol Sequences. Palaeogeogr. Palaeoclimatol. Palaeoecol. 2018, 509, 126–136. [Google Scholar] [CrossRef]
- Sahuquillo, A.; Rigol, A.; Rauret, G. Overview of the Use of Leaching/Extraction Tests for Risk Assessment of Trace Metals in Contaminated Soils and Sediments. TrAC Trends Anal. Chem. 2003, 22, 152–159. [Google Scholar] [CrossRef]
- Salomons, W. Adoption of Common Schemes for Single and Sequential Extractions of Trace Metal in Soils and Sediments. Int. J. Environ. Anal. Chem. 2006, 51, 3–4. [Google Scholar] [CrossRef]
- Rao, C.R.M.; Sahuquillo, A.; Lopez Sanchez, J.F. A Review of the Different Methods Applied in Environmental Geochemistry for Single and Sequential Extraction of Trace Elements in Soils and Related Materials. Water Air Soil Pollut. 2007, 189, 291–333. [Google Scholar] [CrossRef]
- Tessier, A.; Campbell, P.G.C.; Bisson, M. Sequential Extraction Procedure for the Speciation of Particulate Trace Metals. Anal. Chem. 1979, 51, 844–851. [Google Scholar] [CrossRef]
- Rauret, G. Extraction Procedures for the Determination of Heavy Metals in Contaminated Soil and Sediment. Talanta 1998, 46, 449–455. [Google Scholar] [CrossRef]
- Campanella, L.; D’Orazio, D.; Petronio, B.M.; Pietrantonio, E. Proposal for a Metal Speciation Study in Sediments. Anal. Chim. Acta 1995, 309, 387–393. [Google Scholar] [CrossRef]
- Salazar, G.J.P.; Alfaro-De la Torre, M.C.; Aguirre, R.N.J.; Briones-Gallardo, R.; Cedeño, C.J.; Peñuela, M.G.A. Geochemical Fractionation of Manganese in the Riogrande II Reservoir, Antioquia, Colombia. Environ. Earth Sci. 2013, 69, 197–208. [Google Scholar] [CrossRef]
- Ure, A.; Muntau, P.H.; Quevauviller, P.; Griepink, B. Speciation of Heavy Metals in Soils and Sediments an Account of the Improvement and Harmonization of Extraction Techniques Undertaken under the Auspices of the Bcr of the Commission of the European Communities. Int. J. Environ. Anal. Chem. 1993, 51, 135–151. [Google Scholar] [CrossRef]
- Rauret, G.; López-Sánchez, J.F. New Sediment and Soil CRMs for Extractable Trace Metal Content. Int. J. Environ. Anal. Chem. 2006, 79, 81–95. [Google Scholar] [CrossRef]
- Usero, J.; Gamero, M.; Morillo, J.; Gracia, I. Comparative Study of Three Sequential Extraction Procedures for Metals in Marine Sediments. Environ. Int. 1998, 24, 487–496. [Google Scholar] [CrossRef]
- Fiedler, H.D.; López-Sánchez, J.F.; Rubio, R.; Rauret, G.; Quevauviller, P.; Ure, A.M.; Muntau, H. Study of the Stability of Extractable Trace Metal Contents in a River Sediment Using Sequential Extraction. Analyst 1994, 119, 1109–1114. [Google Scholar] [CrossRef]
- Zimmerman, A.J.; Weindorf, D.C. Heavy Metal and Trace Metal Analysis in Soil by Sequential Extraction: A Review of Procedures. Int. J. Anal. Chem. 2010, 2010, 387803. [Google Scholar] [CrossRef]
- Pueyo, M.; Mateu, J.; Rigol, A.; Vidal, M.; López-Sánchez, J.F.; Rauret, G. Use of the Modified BCR Three-Step Sequential Extraction Procedure for the Study of Trace Element Dynamics in Contaminated Soils. Environ. Pollut. 2008, 152, 330–341. [Google Scholar] [CrossRef] [PubMed]
- Fernández-Ondoño, E.; Bacchetta, G.; Lallena, A.M.; Navarro, F.B.; Ortiz, I.; Jiménez, M.N. Use of BCR Sequential Extraction Procedures for Soils and Plant Metal Transfer Predictions in Contaminated Mine Tailings in Sardinia. J. Geochem. Explor. 2017, 172, 133–141. [Google Scholar] [CrossRef]
- Davutluoglu, O.I.; Seckin, G.; Ersu, C.B.; Yilmaz, T.; Sari, B. Heavy Metal Content and Distribution in Surface Sediments of the Seyhan River, Turkey. J. Environ. Manag. 2011, 92, 2250–2259. [Google Scholar] [CrossRef] [PubMed]
- Khalifa, M.; Elsaadani, Z.; Qi, W.M. Spatial Distribution and Extent of Environmental Risks of Strontium Metal Concentration in Water and Bottom Sediments of Nile River, Egypt. Preprint. 2022. [Google Scholar] [CrossRef]
- Bai, J.; Cui, B.; Chen, B.; Zhang, K.; Deng, W.; Gao, H.; Xiao, R. Spatial Distribution and Ecological Risk Assessment of Heavy Metals in Surface Sediments from a Typical Plateau Lake Wetland, China. Ecol. Model. 2011, 222, 301–306. [Google Scholar] [CrossRef]
- Venkatramanan, S.; Ramkumar, T.; Anithamary, I.; Vasudevan, S. Heavy Metal Distribution in Surface Sediments of the Tirumalairajan River Estuary and the Surrounding Coastal Area, East Coast of India. Arab. J. Geosci. 2014, 7, 123–130. [Google Scholar] [CrossRef]
- Adelopo, A.O.; Haris, P.I.; Alo, B.I.; Huddersman, K.; Jenkins, R.O. Multivariate Analysis of the Effects of Age, Particle Size and Landfill Depth on Heavy Metals Pollution Content of Closed and Active Landfill Precursors. Waste Manag. 2018, 78, 227–237. [Google Scholar] [CrossRef]
- McLennan, S.M. Relationships between the Trace Element Composition of Sedimentary Rocks and Upper Continental Crust. Geochem. Geophys. Geosystems 2001, 2, 1021–1024. [Google Scholar] [CrossRef]
- Chatterjee, M.; Silva Filho, E.V.; Sarkar, S.K.; Sella, S.M.; Bhattacharya, A.; Satpathy, K.K.; Prasad, M.V.R.; Chakraborty, S.; Bhattacharya, B.D. Distribution and Possible Source of Trace Elements in the Sediment Cores of a Tropical Macrotidal Estuary and Their Ecotoxicological Significance. Environ. Int. 2007, 33, 346–356. [Google Scholar] [CrossRef]
- da SilveiraPereira, W.V.; Ramos, S.J.; Melo, L.C.A.; de Souza Braz, A.M.; Dias, Y.N.; de Almeida, G.V.; Fernandes, A.R. Levels and Environmental Risks of Rare Earth Elements in a Gold Mining Area in the Amazon. Environ. Res. 2022, 211, 113090. [Google Scholar] [CrossRef]
- Loska, K.; Cebula, J.; Pelczar, J.; Wiechuła, D.; Kwapuliński, J. Use of Enrichment and Contamination Factors Together with Geoaccumulation Indexes to Evaluate the Content of Cd, Cu, and Ni in the Rybnik Water Reservoir in Poland. Water Air Soil Pollut. 1997, 93, 347–365. [Google Scholar] [CrossRef]
- Hakanson, L. Stress Testing and the New Technetium-99m Cardiac Imaging Agents. Am. J. Card. Imaging 1979, 5, 32–36. [Google Scholar]
- Muller, G. Index of Geo-Accumulation in Sediments of the Rhine River. J. Geol. 1969, 2, 108–118. [Google Scholar]
- Sylvie Désirée, N.T.; Armel Zacharie, E.B.; Thérèse Raïssa, M.; Vincent Laurent, O.; Paul-Désiré, N. Risk Assessment of Trace Metals in Mefou River Sediments, West-Africa. Heliyon 2021, 7, e08606. [Google Scholar] [CrossRef]
- Vu, C.T.; Lin, C.; Shern, C.C.; Yeh, G.; Le, V.G.; Tran, H.T. Contamination, Ecological Risk and Source Apportionment of Heavy Metals in Sediments and Water of a Contaminated River in Taiwan. Ecol. Indic. 2017, 82, 32–42. [Google Scholar] [CrossRef]
- Doabi, S.A.; Afyuni, M.; Karami, M. Multivariate Statistical Analysis of Heavy Metals Contamination in Atmospheric Dust of Kermanshah Province, Western Iran, during the Spring and Summer 2013. J. Geochem. Explor. 2017, 180, 61–70. [Google Scholar] [CrossRef]
- Abou El-Anwar, E.A.; Samy, Y.M.; Salman, S.A. Heavy Metals Hazard in Rosetta Branch Sediments, Egypt. Available online: https://www.researchgate.net/publication/326468677_Heavy_metals_hazard_in_Rosetta_Branch_sediments_Egypt (accessed on 9 October 2021).
- Mostafa, A.; Salman, S.A.; Seleem, E.M.; Elnazer, A.A.; Gamal, A.; Al-Gamal, A.; El-Taher, A.; Mansour, H. Quality Assessment of River Nile Sediment Between Qena and Sohag Cities, Egypt. J. Environ. Sci. Technol. 2019, 12, 117–124. [Google Scholar] [CrossRef]
- Omar, W.; Hamada, M. Risk Assessment of Polychlorinated Biphenyls (PCBs) and Trace Metals in River Nile up- and Downstream of a Densely Populated Area. Environ. Geochem. Health 2016, 39, 125–137. [Google Scholar] [CrossRef]
- Goher, M.E.; Farhat, H.I.; Abdo, M.H.; Salem, S.G. Metal Pollution Assessment in the Surface Sediment of Lake Nasser, Egypt. Egypt. J. Aquat. Res. 2014, 40, 213–224. [Google Scholar] [CrossRef]
- Martin, J.M.; Meybeck, M. Elemental Mass-Balance of Material Carried by Major World Rivers. Mar. Chem. 1979, 7, 173–206. [Google Scholar] [CrossRef]
- USEPA US Environmental Protection Agency. Screening Level Ecological Risk Assessment Protocol for Hazardous Waste Combustion Facilities. 1999; Volume 3. Available online: https://www.epa.gov/chemical-research (accessed on 9 October 2021).
- Bam, E.K.P.; Akiti, T.T.; Osae, S.D.; Ganyaglo, S.Y.; Gibrilla, A. Multivariate Cluster Analysis of Some Major and Trace Elements Distribution in an Unsaturated Zone Profile, Densu River Basin, Ghana. Available online: https://www.researchgate.net/publication/279659108_Multivariate_cluster_analysis_of_some_major_and_trace_elements_distribution_in_an_unsaturated_zone_profile_Densu_river_basin_Ghana (accessed on 9 October 2021).
- Mekky, H.S.; El-Anwar, E.A.A.; Salman, S.A.; Elnazer, A.A.; Wahab, W.A.; Asmoay, A.S. Evaluation of Heavy Metals Pollution by Using Pollution Indices in the Soil of Assiut District, Egypt. Egypt. J. Chem. 2019, 62, 1673–1683. [Google Scholar] [CrossRef]
- Wang, J.; Liu, R.; Zhang, P.; Yu, W.; Shen, Z.; Feng, C. Spatial Variation, Environmental Assessment and Source Identification of Heavy Metals in Sediments of the Yangtze River Estuary. Mar. Pollut. Bull. 2014, 87, 364–373. [Google Scholar] [CrossRef] [PubMed]
- Saha, P.; Hossain, M. Assessment of Heavy Metal Contamination and Sediment Quality in the Buriganga River, Bangladesh. In Proceedings of the 2011 2nd International Conference on Environmental Science and Technology, Singapore, 26–28 February 2011. [Google Scholar]
- Silva, F.B.V.; Nascimento, C.W.A.; Alvarez, A.M.; Araújo, P.R.M. Inputs of Rare Earth Elements in Brazilian Agricultural Soils via P-Containing Fertilizers and Soil Correctives. J. Environ. Manag. 2019, 232, 90–96. [Google Scholar] [CrossRef] [PubMed]
- Singh, H.; Pandey, R.; Singh, S.K.; Shukla, D.N. Assessment of Heavy Metal Contamination in the Sediment of the River Ghaghara, a Major Tributary of the River Ganga in Northern India. Appl. Water Sci. 2017, 7, 4133–4149. [Google Scholar] [CrossRef]
- McLennan, S.M.; Taylor, S.R. Earth’s Continental Crust. In Encyclopedia of Geochemistry; Marshall, C.P., Fairbridge, R.W., Eds.; Kluwer Academic Publishers: Dordrecht, The Netherlands, 1999; pp. 145–151. [Google Scholar]
- Dobaradaran, S.; Naddafi, K.; Nazmara, S.; Ghaedi, H. Heavy Metals (Cd, Cu, Ni and Pb) Content in Two Fish Species of Persian Gulf in Bushehr Port, Iran. Afr. J. Biotechnol. 2010, 9, 6191–6193. [Google Scholar] [CrossRef]
- Johri, N.; Jacquillet, G.; Unwin, R. Heavy Metal Poisoning: The Effects of Cadmium on the Kidney. Biometals 2010, 23, 783–792. [Google Scholar] [CrossRef]
- Järup, L.; Berglund, M.; Elinder, C.G.; Nordberg, G.; Vahter, M. Health Effects of Cadmium Exposure a Review of the Literature and a Risk Estimate. Scand. J. Work Environ. Health 1998, 25, 1–51. [Google Scholar]
- Morrison, G.M.P. Trace Element Speciation and Its Relation to Bioavailability and Toxicity in Natural Water; CRC Press: Boca Raton, FL, USA, 1989; pp. 25–41. [Google Scholar]
- Ma, X.; Zuo, H.; Tian, M.; Zhang, L.; Meng, J.; Zhou, X.; Min, N.; Chang, X.; Liu, Y. Assessment of Heavy Metals Contamination in Sediments from Three Adjacent Regions of the Yellow River Using Metal Chemical Fractions and Multivariate Analysis Techniques. Chemosphere 2016, 144, 264–272. [Google Scholar] [CrossRef]
- Zhang, P.; Qin, C.; Hong, X.; Kang, G.; Qin, M.; Yang, D.; Pang, B.; Li, Y.; He, J.; Dick, R.P. Risk Assessment and Source Analysis of Soil Heavy Metal Pollution from Lower Reaches of Yellow River Irrigation in China. Sci. Total Environ. 2018, 633, 1136–1147. [Google Scholar] [CrossRef]
- Li, H.; Qian, X.; Hu, W.; Wang, Y.; Gao, H. Chemical Speciation and Human Health Risk of Trace Metals in Urban Street Dusts from a Metropolitan City, Nanjing, SE China. Sci. Total Environ. 2013, 456–457, 212–221. [Google Scholar] [CrossRef]
- Karatas, M.; Dursun, S.; Guler, E.; Ozdemir, C.; Emin, A.M. Heavy Metal Accumulation in Wheat Plants Irrigated by Waste Water. Available online: https://www.researchgate.net/publication/285020941_Heavy_metal_accumulation_in_wheat_plants_irrigated_by_waste_water (accessed on 13 October 2021).
- Sungur, A.; Soylak, M.; Yilmaz, S.; Özcan, H. Determination of Heavy Metals in Sediments of the Ergene River by BCR Sequential Extraction Method. Environ. Earth Sci. 2014, 72, 3293–3305. [Google Scholar] [CrossRef]
- Jain, C.K. Metal Fractionation Study on Bed Sediments of River Yamuna, India. Water Res. 2004, 38, 569–578. [Google Scholar] [CrossRef]
- Wang, H.; You, T.; Gomez, M.A.; Wang, Y.; Li, S.; Jia, Y.; Shi, Z. Chemical Speciation and Ecological Risk Assessment of Cd, Pb and As in Sediments: A Case Study in the Xijiang River Basin, China. Environ. Earth Sci. 2021, 80, 437. [Google Scholar] [CrossRef]
- Singh, K.; Mohan, D.; Singh, V.K.; Malik, A. Studies on Distribution and Fractionation of Heavy Metals in Gomti River Sediments a Tributary of the Ganges, India. J. Hydrol. 2005, 312, 14–27. [Google Scholar] [CrossRef]
- Grażyna, G.; Tadeusz, S.; Leonard, B.; Katarzyna, B.; Jerzy, S. Fractionation of Some Heavy Metals in Bottom Sediments from the Middle Odra River (Germany/Poland). Available online: https://www.researchgate.net/publication/254748663_Fractionation_of_Some_Heavy_Metals_in_Bottom_Sediments_from_the_Middle_Odra_River_GermanyPoland (accessed on 3 February 2022).
- Morillo, J.; Usero, J.; Gracia, I. Partitioning of Metals in Sediments from the Odiel River (Spain). Environ. Int. 2002, 28, 263–271. [Google Scholar] [CrossRef]
- Hasaballah, A.F.; Hegazy, T.A.; Ibrahim, M.S.; El-Emam, D.A. Assessment of Water and Sediment Quality of the River Nile, Damietta Branch, Egypt. Egypt. J. Aquat. Biol. Fish. 2019, 23, 55–65. [Google Scholar] [CrossRef][Green Version]
- Wang, N.; Choi, Y. Challenges for Sustainable Water Use in the Urban Industry of Korea Based on the Global Non-Radial Directional Distance Function Model. Sustainability 2019, 11, 3895. [Google Scholar] [CrossRef]
- Badr, E.-S.; El-Sonbati, M.; Nassef, H. Water Quality Assessment in the Nile River, Damietta Branch, Egypt. Catrina Int. J. Environ. Sci. 2013, 8, 41–50. [Google Scholar] [CrossRef]
- ATSDR Agency for Toxic Substances and Disease Registry (ATSDR). Toxicological Profile for Cadmium; Draft for Public Comment; Public Comment Period Ends on 26 February, 2008. Available online: https://www.atsdr.cdc.gov/ (accessed on 9 October 2021).
- WHO World Health Organization. Guidelines for Drinking-Water Quality, 4th ed.; WHO World Health Organization: Geneva, Switzerland, 2011. [Google Scholar]
- Nordberg, G.; Nogawa, K.; Nordberg, M.; Friberg, L. Cadmium. In Handbook on the Toxicology of Metals; Nordberg, G.F., Fowler, G.F., Nordberg, M., Friberg, L., Eds.; Elsevier: Amsterdam, The Netherlands, 2007. [Google Scholar]
- Water US Environmental Protection Agency. EPA Edition of the Drinking Water Standards and Health Advisories; Office of Water US Environmental Protection Agency Washington: Washington, DC, USA, 2018. [Google Scholar]
- Canadian Council of Ministers of the Environment (CCME). Canadian Water Quality Guidelines: Cadmium. Scientific Criteria Document; Canadian Council of Ministers of the Environment: Winnipeg, MB, Canada, 2014; ISBN 978-1-77202-000-7. [Google Scholar]
- Ali, M.M.; Soltan, M.E. Heavy Metals in Aquatic Macrophytes, Water and Hydrosoils from the River Nile, Egypt. Available online: https://www.researchgate.net/publication/310833722_Heavy_metals_in_aquatic_macrophytes_water_and_hydrosoils_from_the_River_Nile_Egypt (accessed on 9 October 2021).
- Abdel-Satar, A.M.; Ali, M.H.; Goher, M.E. Indices of Water Quality and Metal Pollution of Nile River, Egypt. Egypt. J. Aquat. Res. 2017, 43, 21–29. [Google Scholar] [CrossRef]
- EPA PH in Water: Monitoring and Assessment, Water Quality Condition; The United States Environmental Protection Agency: Washington, DC, USA, 2012; Volume 5.
- Niyogi, S.; Kent, R.; Wood, C.M. Effects of Water Chemistry Variables on Gill Binding and Acute Toxicity of Cadmium in Rainbow Trout (Oncorhynchus Mykiss): A Biotic Ligand Model (BLM) Approach. Comp. Biochem. Physiol. Part C Toxicol. Pharmacol. 2008, 148, 305–314. [Google Scholar] [CrossRef]
- Hiller, E.; Jurkovič, Ľ.; Šutriepka, M. Metals in the Surface Sediments of Selected Water Reservoirs, Slovakia. Bull. Environ. Contam. Toxicol. 2010, 84, 635–640. [Google Scholar] [CrossRef]
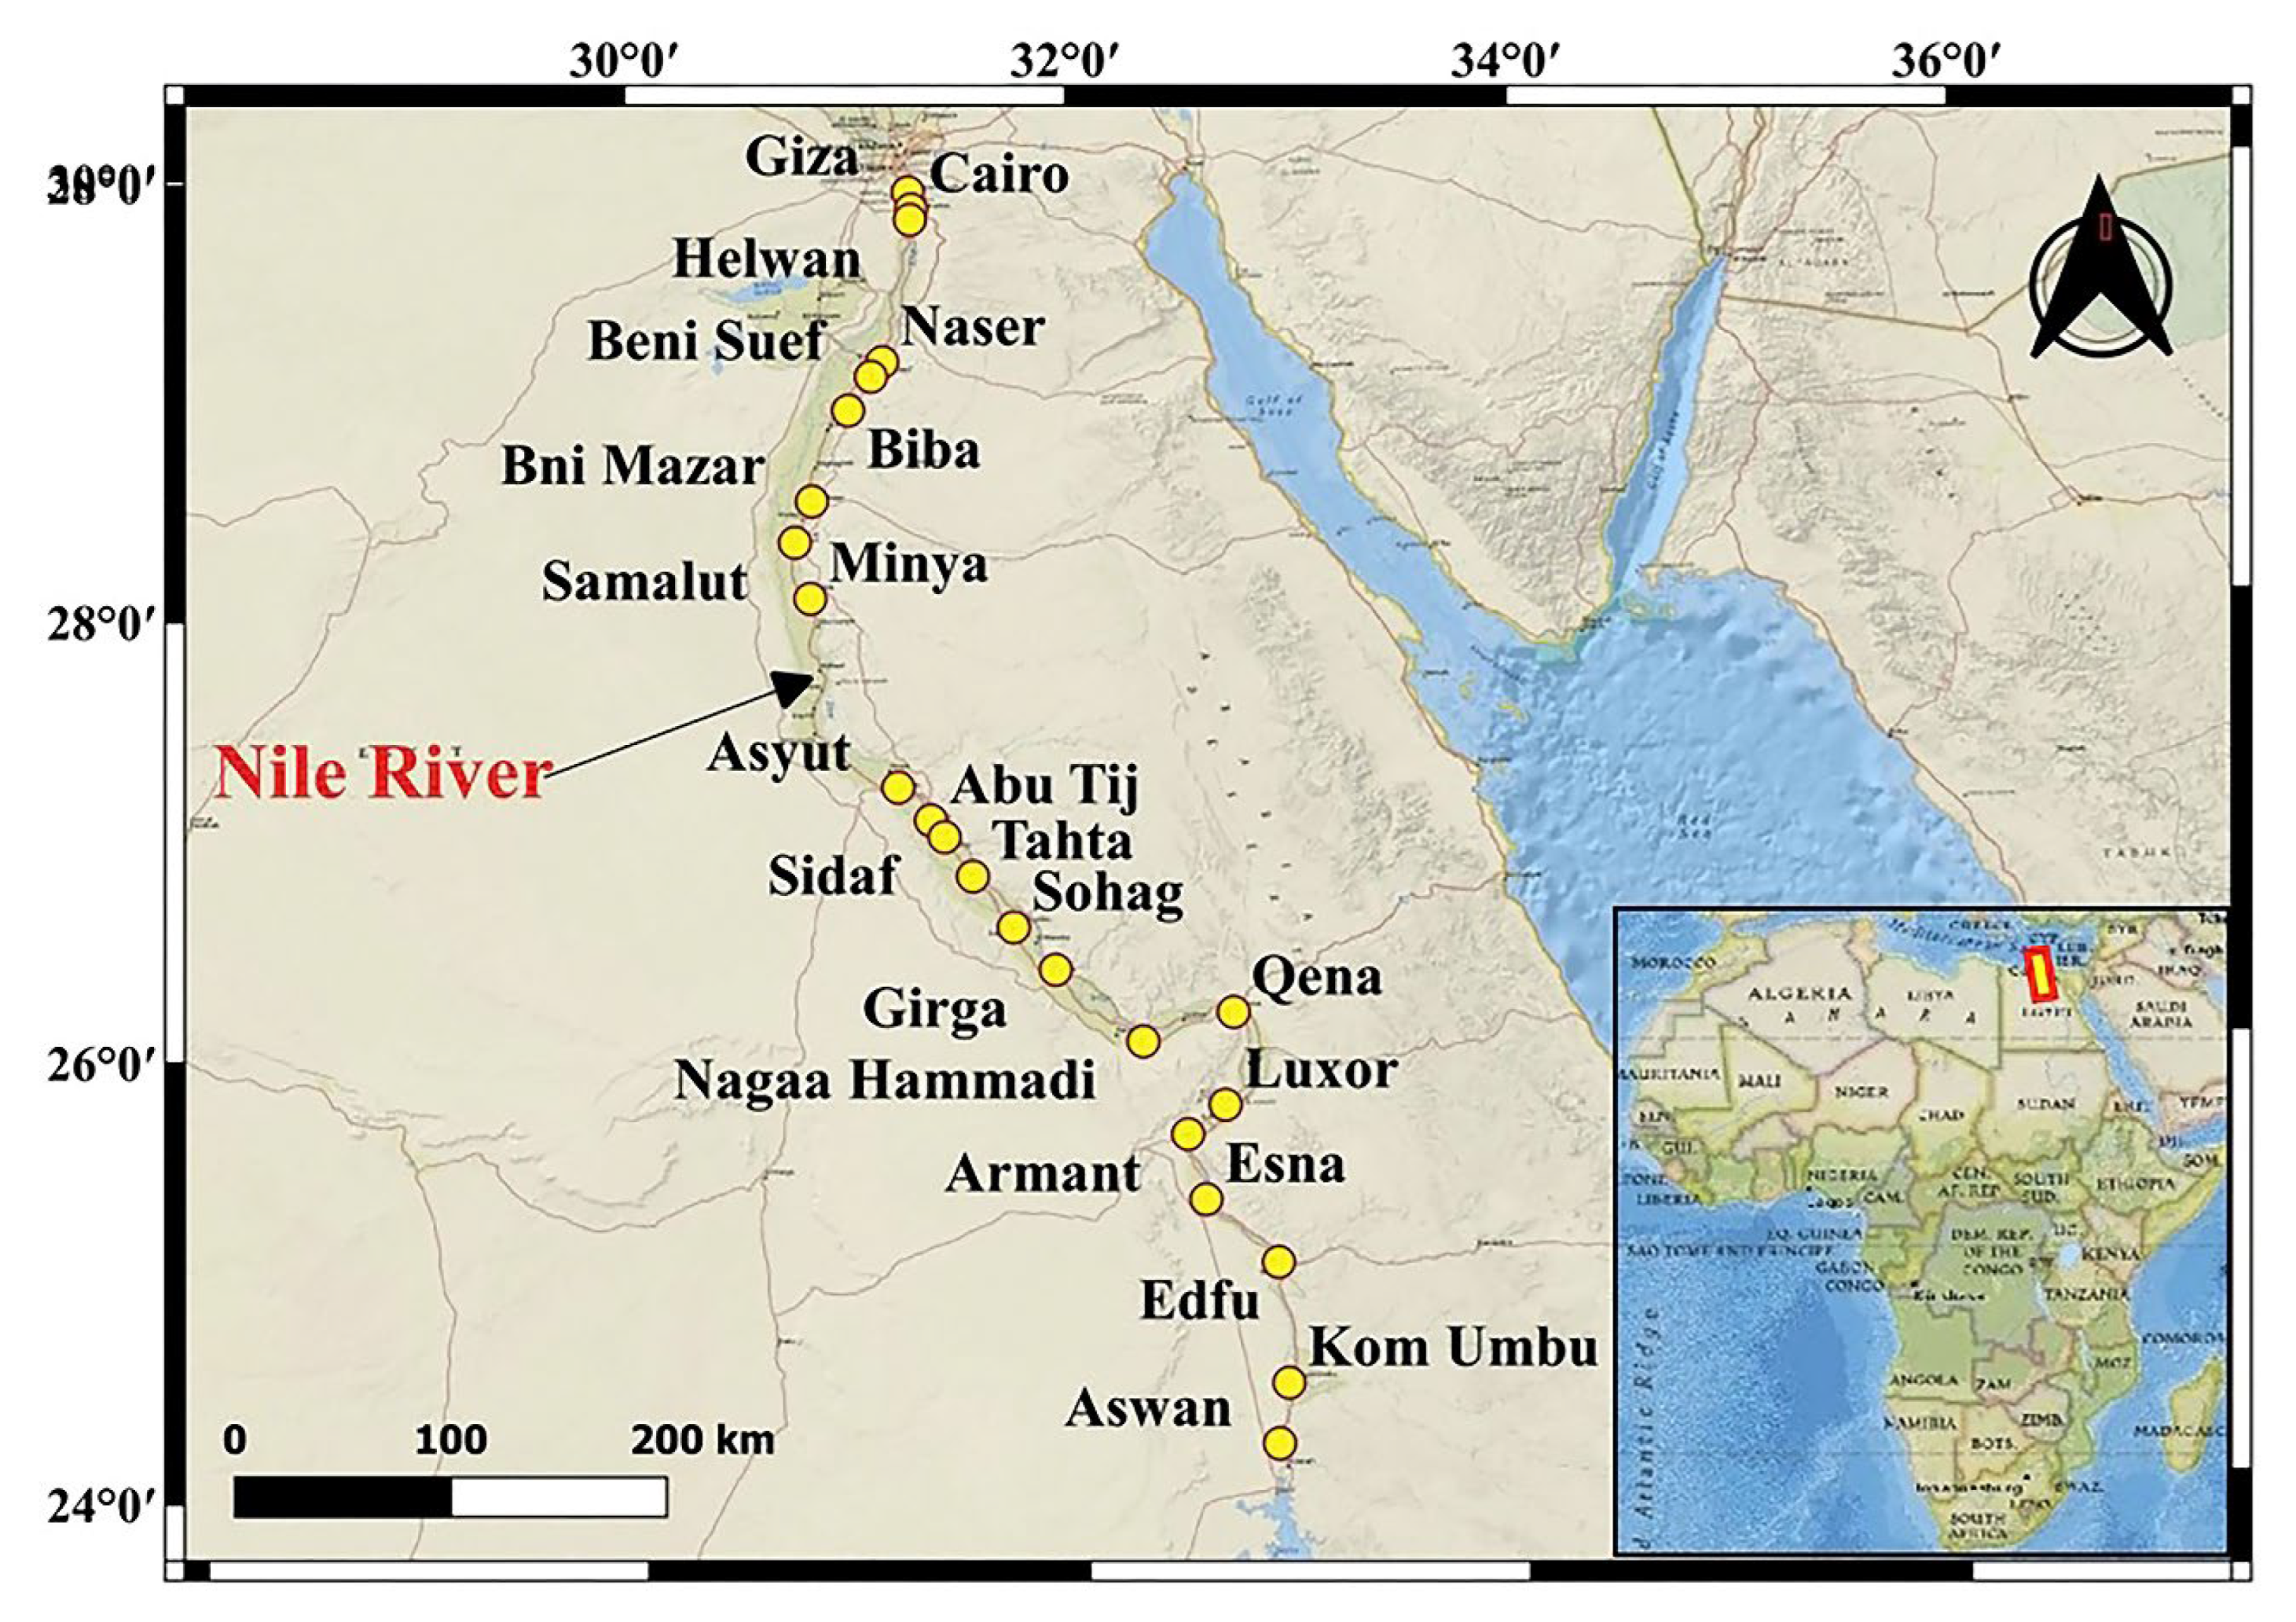
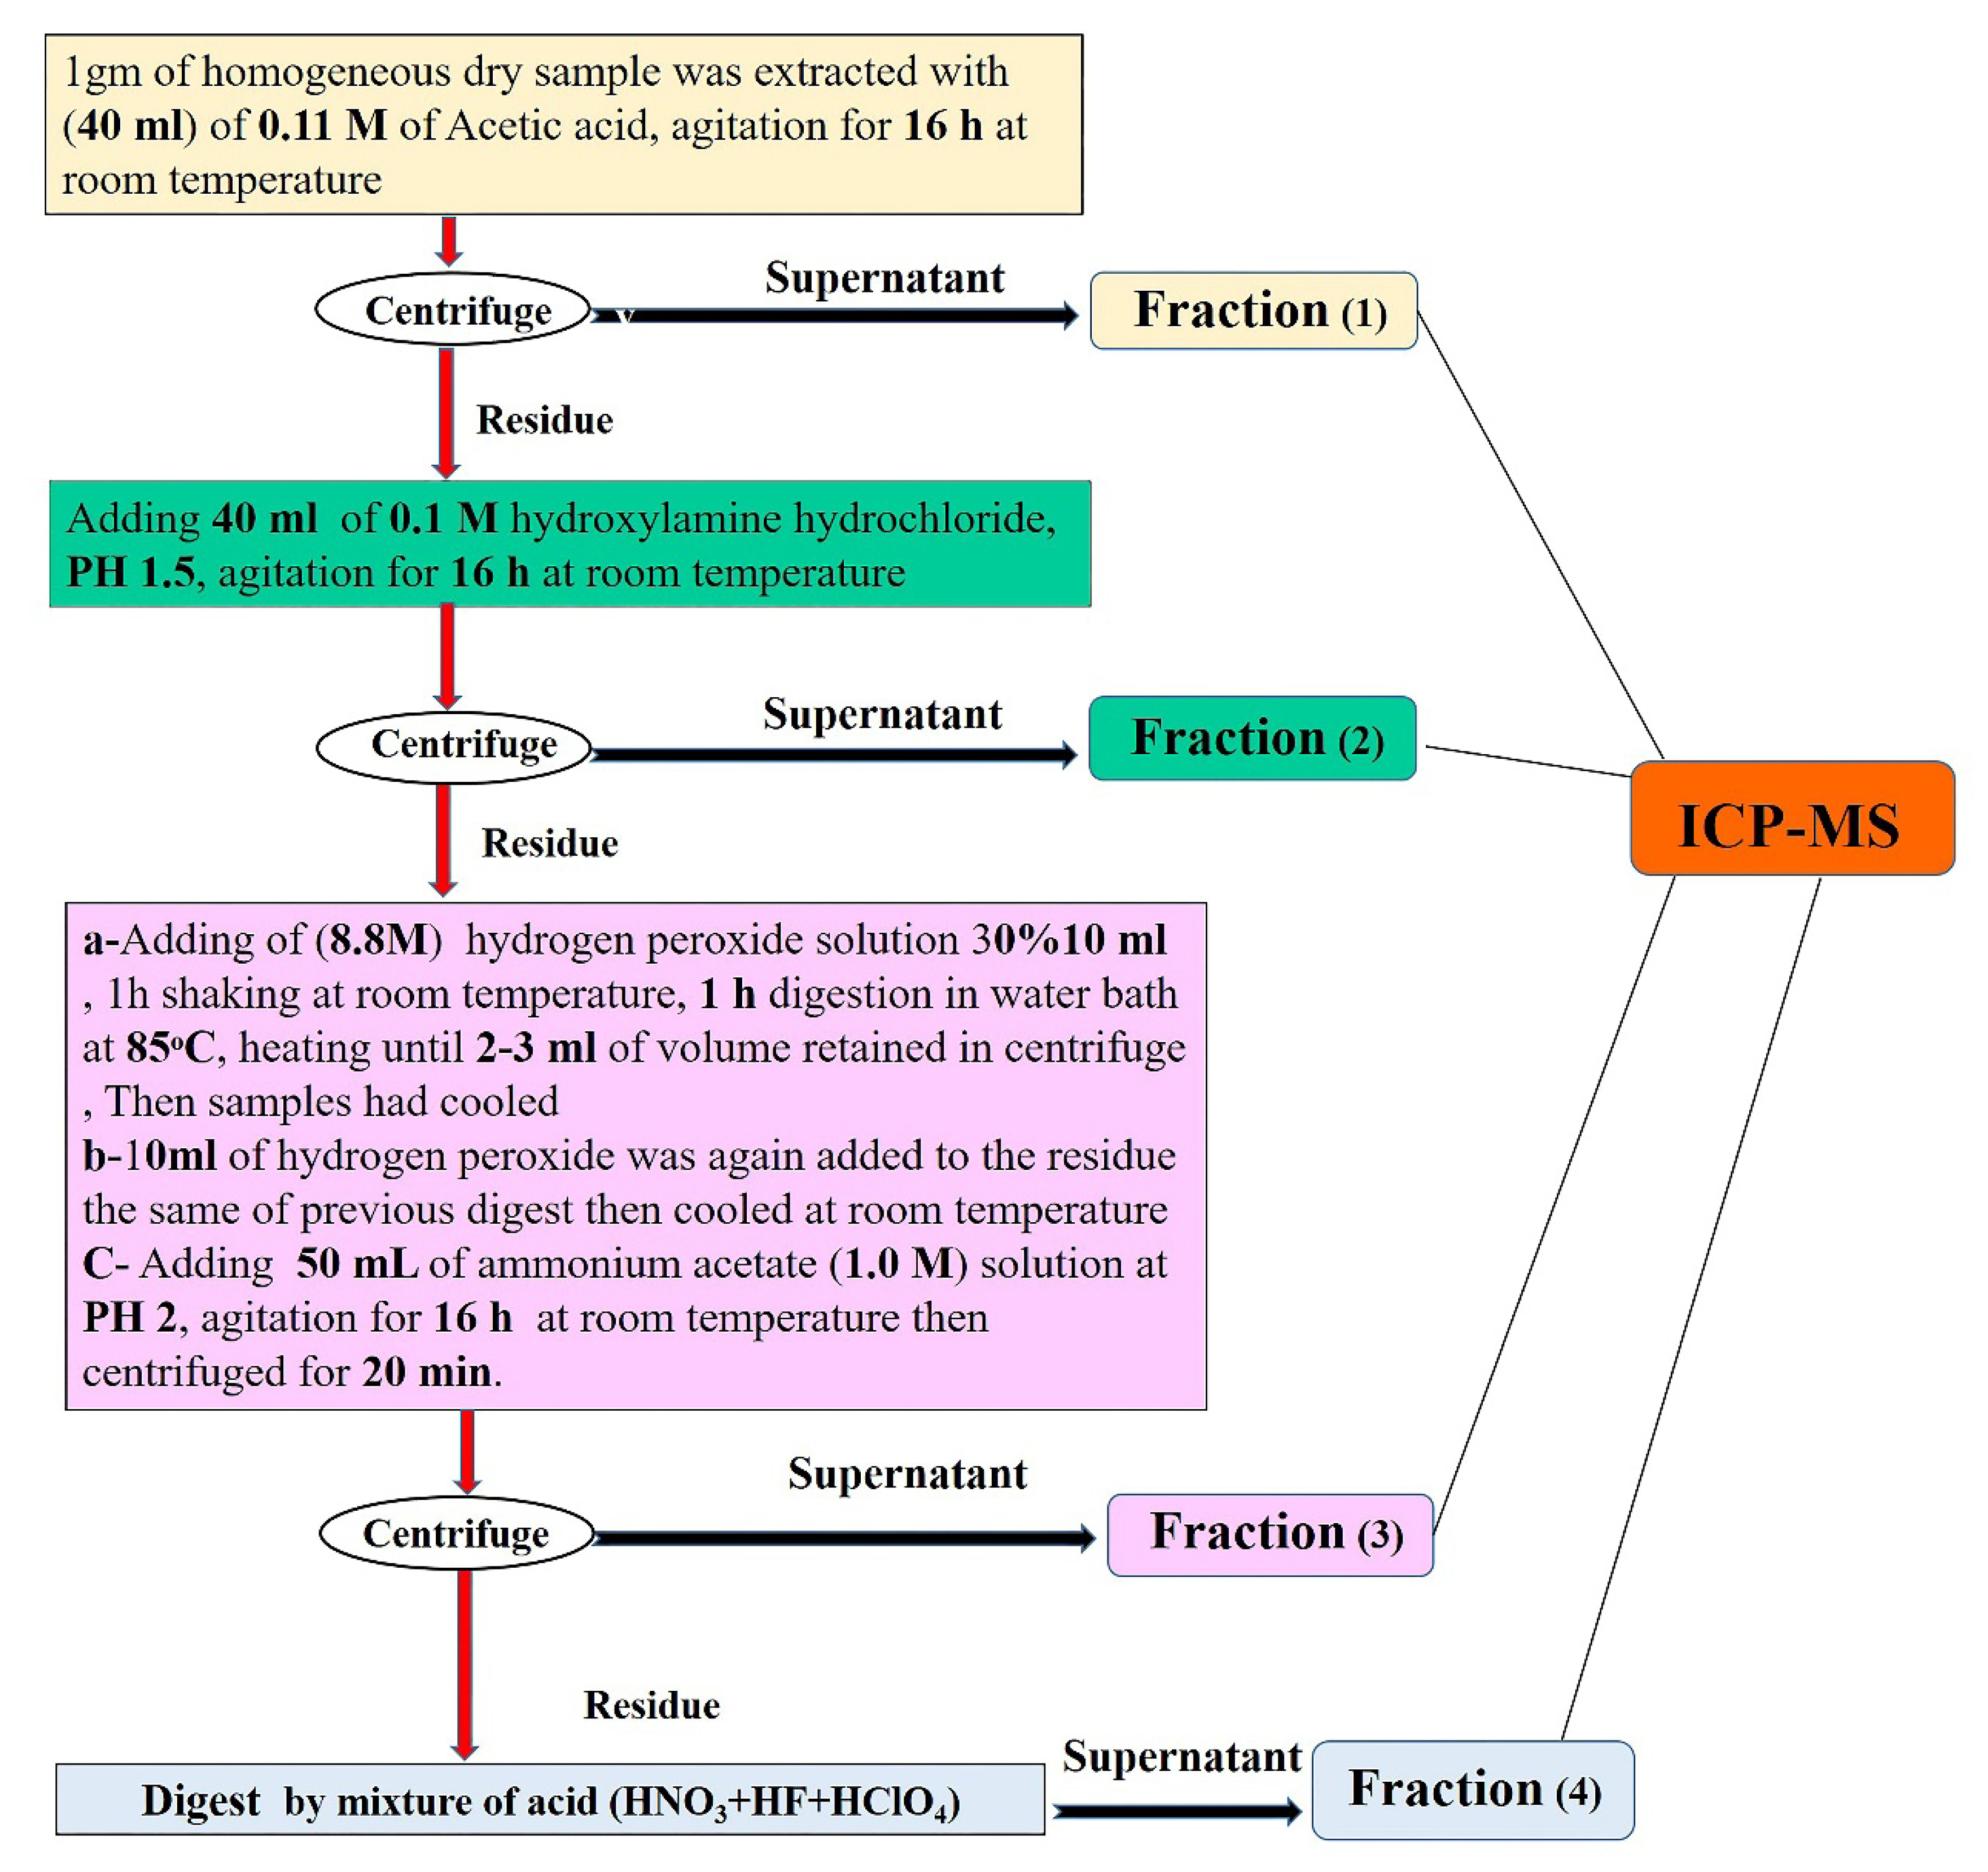

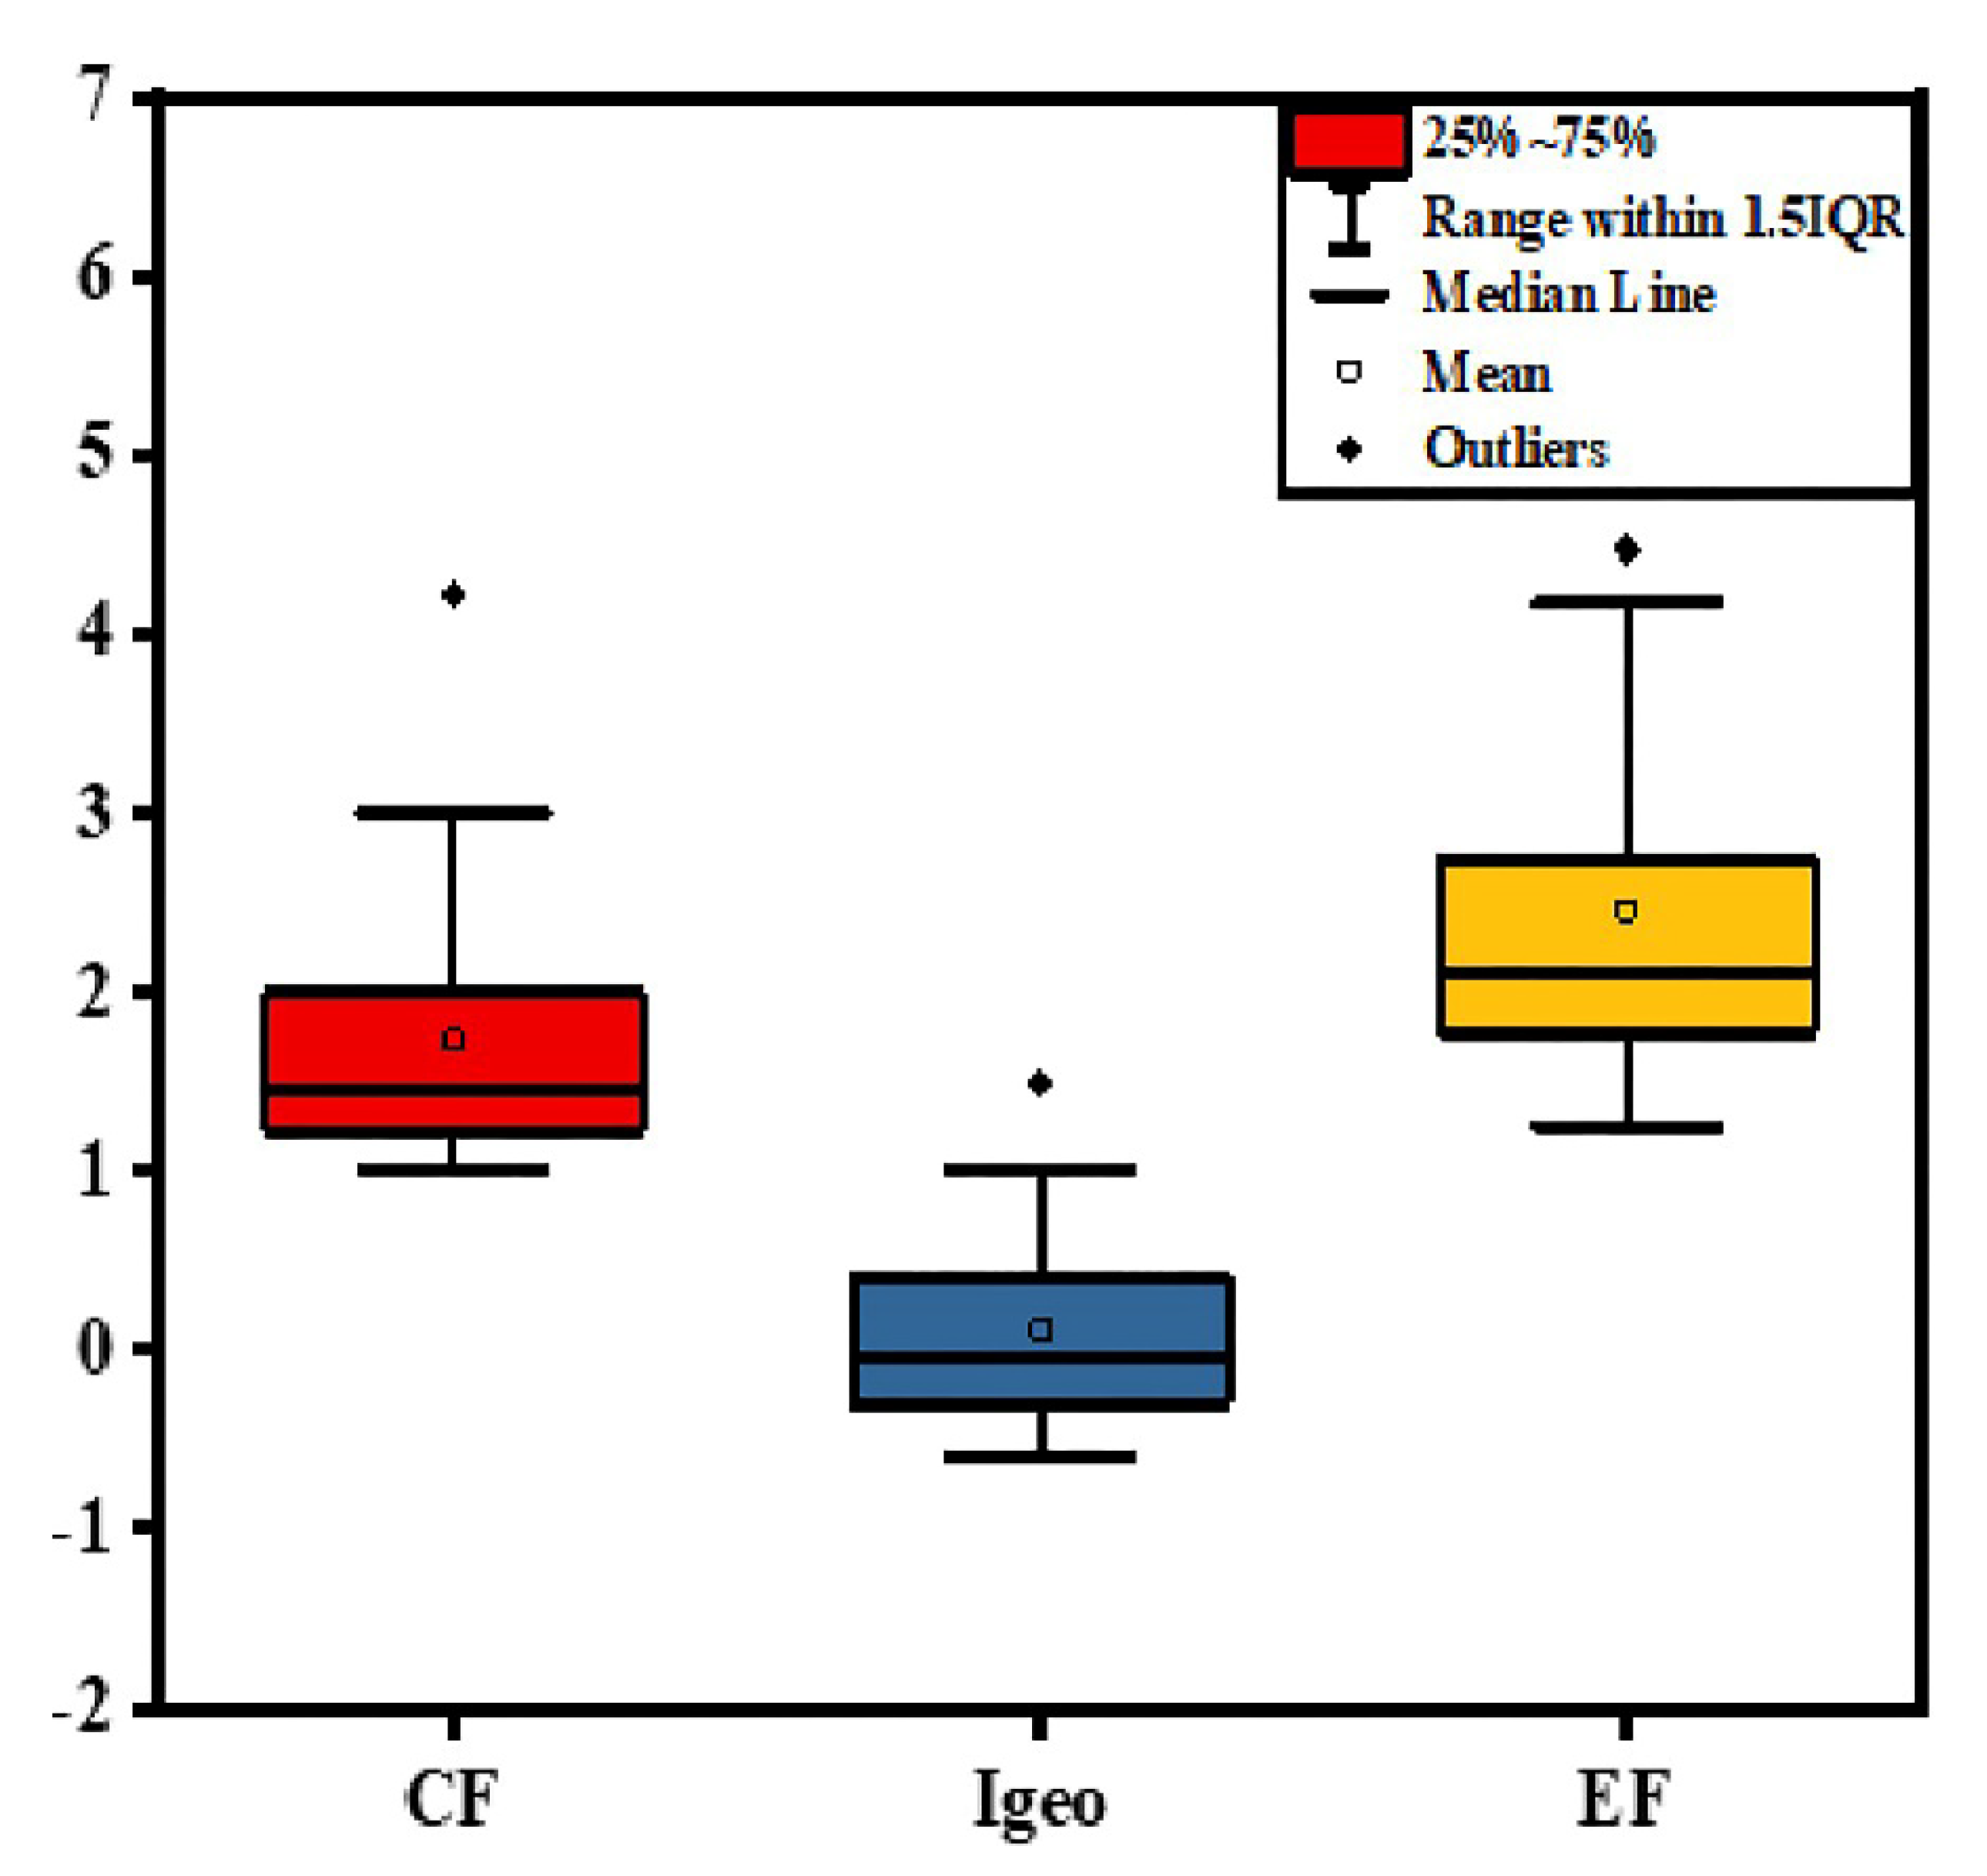


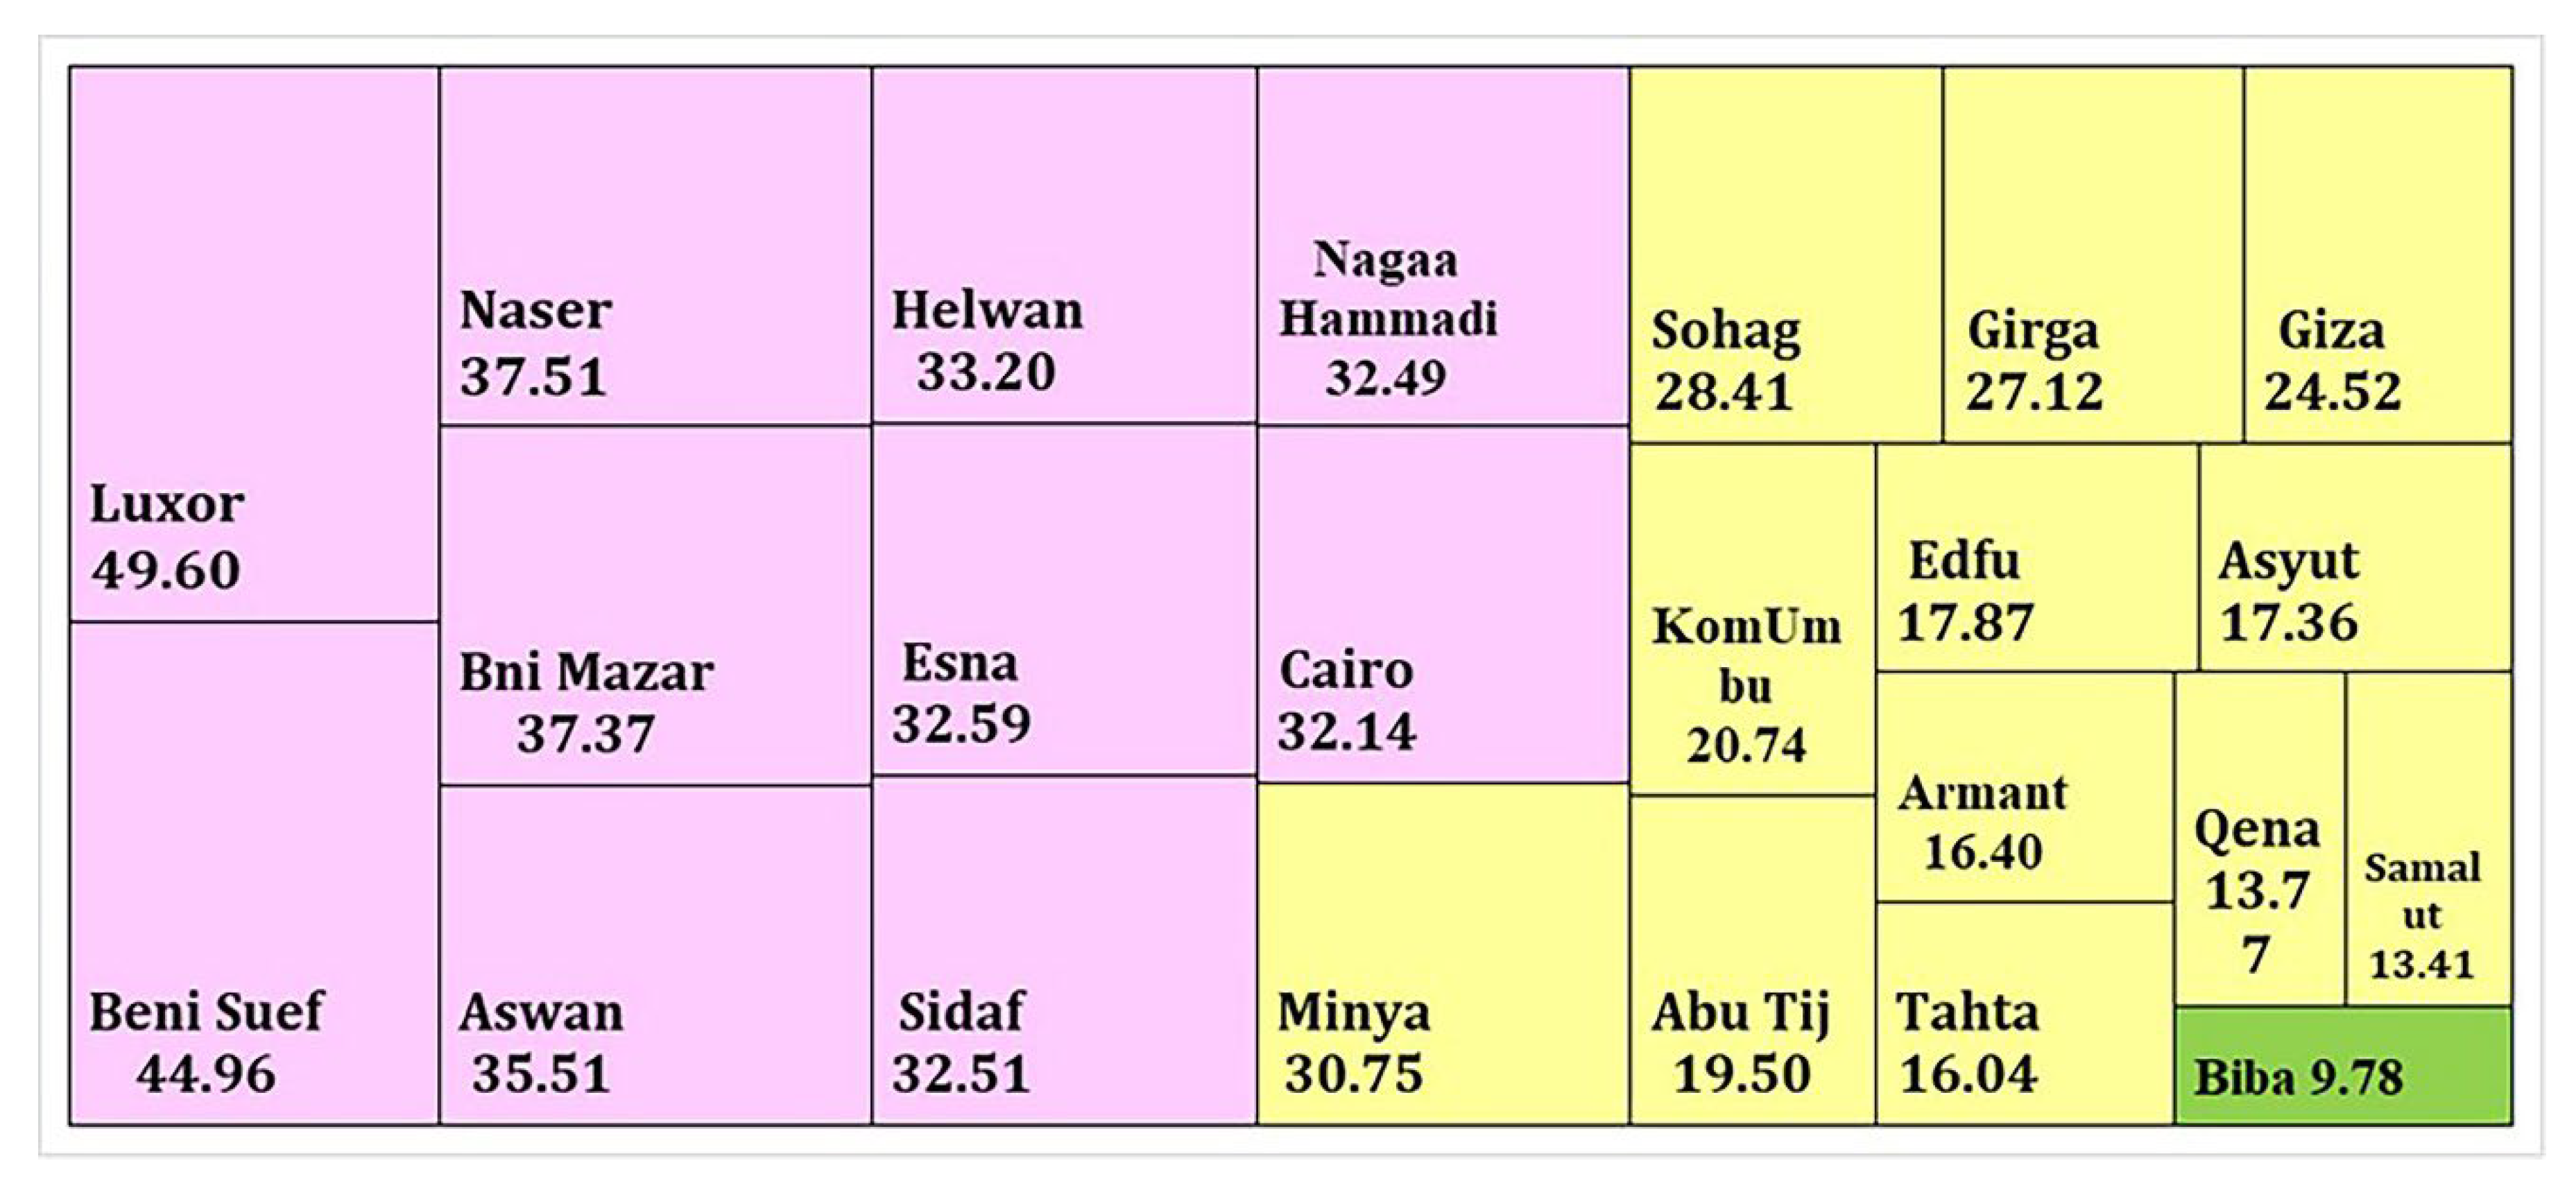
| Fractions at Sediments % | ||||||||||||
|---|---|---|---|---|---|---|---|---|---|---|---|---|
| Sample Location | Cd | CF | Er | Igeo | EF | Sand% | Silt% | Clay% | (F1) | (F2) | (F3) | (F4) |
| Giza | 0.14 | 1.56 | 46.67 | 0.05 | 2.17 | 85.6 | 12.1 | 2.3 | 32.14 | 3.73 | 2.37 | 61.76 |
| Cairo | 0.18 | 2.00 | 60.00 | 0.42 | 2.76 | 85.6 | 13.2 | 1.2 | 24.52 | 10.59 | 4.80 | 60.09 |
| Helwan | 0.23 | 2.56 | 76.67 | 0.77 | 3.78 | 53.4 | 41.1 | 5.5 | 33.20 | 14.20 | 3.88 | 48.72 |
| Naser | 0.13 | 1.44 | 43.33 | −0.05 | 1.96 | 96.4 | 3.3 | 0.3 | 37.51 | 11.85 | 2.65 | 47.99 |
| Beni Suef | 0.38 | 4.22 | 126.67 | 1.49 | 5.88 | 67.9 | 28.9 | 3.2 | 44.96 | 12.95 | 3.34 | 38.74 |
| Biba | 0.09 | 1.00 | 30.00 | −0.58 | 1.44 | 94.4 | 5.3 | 0.3 | 9.78 | 6.86 | 1.65 | 81.72 |
| Minya | 0.12 | 1.33 | 40.00 | −0.17 | 1.88 | 81.8 | 15.7 | 2.5 | 30.75 | 15.56 | 1.92 | 51.77 |
| Bni Mazar | 0.18 | 2.00 | 60.00 | 0.42 | 2.48 | 51.6 | 45.2 | 3.2 | 37.37 | 17.90 | 4.37 | 40.36 |
| Samalut | 0.20 | 2.22 | 66.67 | 0.57 | 4.17 | 95.9 | 3.8 | 0.3 | 13.41 | 8.97 | 1.60 | 76.02 |
| Asyut | 0.13 | 1.44 | 43.33 | −0.05 | 2.18 | 85.1 | 13.1 | 1.8 | 17.36 | 12.04 | 2.08 | 68.52 |
| Abu Tij | 0.14 | 1.56 | 46.67 | 0.05 | 2.04 | 95.8 | 3.8 | 0.4 | 19.50 | 12.13 | 2.44 | 65.94 |
| Sidaf | 0.13 | 1.44 | 43.33 | −0.05 | 1.71 | 40.1 | 51.7 | 8.2 | 32.51 | 22.37 | 9.96 | 35.15 |
| Girga | 0.16 | 1.78 | 53.33 | 0.25 | 2.11 | 68.5 | 28.3 | 3.2 | 27.12 | 13.23 | 3.02 | 56.64 |
| Sohag | 0.19 | 2.11 | 63.33 | 0.49 | 2.75 | 74.7 | 21.9 | 3.4 | 28.41 | 13.79 | 3.85 | 53.95 |
| Tahta | 0.11 | 1.22 | 36.67 | −0.30 | 1.78 | 71.5 | 25.3 | 3.2 | 16.04 | 5.97 | 3.68 | 74.31 |
| Nagaa Hammadi | 0.11 | 1.22 | 36.67 | −0.30 | 1.87 | 83.3 | 14.6 | 2.1 | 32.49 | 11.49 | 1.32 | 54.70 |
| Qena | 0.10 | 1.11 | 33.33 | −0.43 | 1.54 | 98.1 | 1.6 | 0.3 | 13.77 | 6.17 | 1.60 | 78.46 |
| Luxor | 0.13 | 1.44 | 43.33 | −0.05 | 1.96 | 90.6 | 7.8 | 1.6 | 49.60 | 15.36 | 5.15 | 29.89 |
| Armant | 0.11 | 1.22 | 36.67 | −0.30 | 1.68 | 88.6 | 8.8 | 2.6 | 16.40 | 8.82 | 6.01 | 68.78 |
| Esna | 0.17 | 1.89 | 56.67 | 0.33 | 2.22 | 98.7 | 1.1 | 0.2 | 32.59 | 17.40 | 0.21 | 49.80 |
| Edfu | 0.11 | 1.22 | 36.67 | −0.30 | 2.43 | 89.6 | 1.3 | 9.1 | 17.87 | 5.70 | 1.74 | 74.69 |
| KomUmbu | 0.09 | 1.00 | 30.00 | −0.58 | 1.25 | 93.3 | 6.1 | 0.6 | 20.74 | 9.92 | 1.14 | 68.19 |
| Aswan | 0.27 | 3.00 | 90.00 | 1.00 | 4.47 | 85 | 13.6 | 1.4 | 35.51 | 15.28 | 3.39 | 45.82 |
| Average | 0.16 | 1.74 | 52.17 | 0.12 | 2.46 | 81.54 | 15.98 | 2.47 | 27.11 | 11.84 | 3.14 | 57.91 |
| Maximum | 0.38 | 4.22 | 126.67 | 1.49 | 5.88 | 98.70 | 51.70 | 9.10 | 49.60 | 22.37 | 9.96 | 81.72 |
| Minimum | 0.09 | 1.00 | 30.00 | −0.58 | 1.25 | 40.10 | 1.10 | 0.20 | 9.78 | 3.73 | 0.21 | 29.89 |
| River | Country | Cd | Reference |
|---|---|---|---|
| Present study | Egypt | 0.16 | Present study |
| Yangtze River | China | 0.98 | [72] |
| Buriganga River | Bangladesh | 0.8 | [73] |
| Ipojuca River | Brazil | 0.16 | [74] |
| Ghaghara River | India | 0.28 | [75] |
| Nile River | Egypt | 0.06 | [66] |
| World average | 1.4 | [68] | |
| UCC | 0.09 | [54] | |
| USEPA | 0.61 | [69] | |
| UCC | 0.5 | [76] | |
| Cd (mg kg−1) | Cd (mg L−1) | PH | TDS | ORP | Temp | F1 | F2 | F3 | F4 | Sand | Silt | Clay | |
|---|---|---|---|---|---|---|---|---|---|---|---|---|---|
| Cd (mg kg−1) | 1.00 | ||||||||||||
| Cd (mg L−1) | 0.45 | 1.00 | |||||||||||
| PH | −0.16 | −0.35 | 1.00 | ||||||||||
| TDS | 0.18 | 0.67 | −0.62 | 1.00 | |||||||||
| ORP | 0.39 | 0.13 | −0.02 | 0.07 | 1.00 | ||||||||
| Temp. | 0.04 | 0.69 | −0.19 | 0.64 | −0.13 | 1.00 | |||||||
| (F1) | 0.50 | 0.22 | −0.08 | 0.08 | 0.13 | 0.22 | 1.00 | ||||||
| (F2) | 0.31 | −0.19 | 0.06 | −0.25 | 0.31 | −0.25 | 0.60 | 1.00 | |||||
| (F3) | 0.10 | 0.12 | −0.10 | 0.09 | −0.08 | 0.23 | 0.28 | 0.47 | 1.00 | ||||
| (F4) | −0.47 | −0.12 | 0.06 | 0.01 | −0.18 | −0.11 | −0.95 | −0.81 | −0.49 | 1.00 | |||
| Zr | −0.15 | −0.35 | 0.19 | −0.18 | 0.39 | −0.20 | −0.05 | 0.12 | 0.07 | −0.01 | |||
| Sand | −0.32 | −0.07 | 0.07 | −0.17 | −0.36 | −0.02 | −0.36 | −0.54 | −0.67 | 0.52 | 1.00 | ||
| Silt | 0.34 | 0.08 | −0.06 | 0.18 | 0.39 | 0.05 | 0.38 | 0.56 | 0.65 | −0.54 | −0.99 | 1.00 | |
| Clay | 0.06 | −0.04 | −0.08 | 0.03 | 0.00 | −0.14 | 0.12 | 0.20 | 0.51 | −0.22 | −0.67 | 0.57 | 1.00 |
| River | Country | Cd Fraction (%) | Fraction | Method | Reference |
|---|---|---|---|---|---|
| Ergen River | Turkey | 25% | Acid soluble | BCR modification | [85] |
| Yamuna | India | (>70%) | Exchangeable + Carbonate | Tiesser et al., 1979 | [86] |
| Xijing River | China | 44.80% | Acid soluble | BCR modification | [87] |
| Gomti River | India | (17–28)% | Exchangeable + Carbonate | Tiesser et al., 1979 | [88] |
| Odra River | Germany/poland | (23–39)% | Exchangeable + Carbonate | Tiesser et al., 1979 | [89] |
| Odiel River | Spain | (15–70)% | Acid soluble | BCR modification | [90] |
| Present study | Egypt | 27.11% | Acid soluble | BCR |
| Sample Location | Cd (mg/L) | PH | TDS | ORP | Temp (°C) |
|---|---|---|---|---|---|
| Giza | 0.01 | 8 | 188 | 313 | 31.3 |
| Cairo | 0.009 | 7.96 | 186 | 352 | 30 |
| Helwan | 0.008 | 7.9 | 181 | 372 | 29.8 |
| Naser | 0.005 | 8.28 | 162 | 362 | 28.6 |
| Beni Suef | 0.007 | 8.61 | 157 | 372 | 28.7 |
| Biba | 0.002 | 8.44 | 149 | 352 | 28.5 |
| Minya | 0.003 | 8.54 | 151 | 435 | 28 |
| Bni Mazar | 0.005 | 8.66 | 158 | 441 | 28 |
| Samalut | 0.006 | 8.7 | 162 | 356 | 27.8 |
| Asyut | 0.005 | 8.43 | 153 | 331 | 27 |
| Abu Tij | 0.003 | 8.4 | 156 | 322 | 27.7 |
| Sidaf | 0.002 | 8.5 | 154 | 328 | 27.3 |
| Girga | 0.002 | 8.6 | 154 | 330 | 27.1 |
| Sohag | 0.007 | 8.43 | 150 | 391 | 27.5 |
| Tahta | 0.002 | 8.41 | 166 | 342 | 27.4 |
| Nagaa Hammadi | 0.001 | 8.65 | 158 | 352 | 28 |
| Qena | 0.006 | 9 | 152 | 335 | 29 |
| Luxor | 0.005 | 8.68 | 148 | 239 | 30 |
| Armant | 0.004 | 8.36 | 155 | 300 | 29.5° |
| Esna | 0.002 | 8.37 | 157 | 340 | 26.5° |
| Edfu | 0.003 | 8.43 | 151 | 308 | 26.1° |
| KomUmbu | 0.001 | 8.3 | 146 | 290 | 26° |
| Aswan | 0.004 | 8.1 | 149 | 392 | 26° |
| Average | 0.004 | 8.42 | 158.39 | 345.87 | 8.42 |
| Maximum | 0.01 | 9 | 188 | 441 | 9 |
| Minimum | 0.001 | 7.90 | 146 | 239 | 7.9 |
Publisher’s Note: MDPI stays neutral with regard to jurisdictional claims in published maps and institutional affiliations. |
© 2022 by the authors. Licensee MDPI, Basel, Switzerland. This article is an open access article distributed under the terms and conditions of the Creative Commons Attribution (CC BY) license (https://creativecommons.org/licenses/by/4.0/).
Share and Cite
El-Saadani, Z.; Mingqi, W.; He, Z.; Hamukwaya, S.L.; Abdel Wahed, M.S.M.; Abu Khatita, A. Environmental Geochemistry and Fractionation of Cadmium Metal in Surficial Bottom Sediments and Water of the Nile River, Egypt. Toxics 2022, 10, 221. https://doi.org/10.3390/toxics10050221
El-Saadani Z, Mingqi W, He Z, Hamukwaya SL, Abdel Wahed MSM, Abu Khatita A. Environmental Geochemistry and Fractionation of Cadmium Metal in Surficial Bottom Sediments and Water of the Nile River, Egypt. Toxics. 2022; 10(5):221. https://doi.org/10.3390/toxics10050221
Chicago/Turabian StyleEl-Saadani, Zozo, Wang Mingqi, Zhang He, Shindume Lomboleni Hamukwaya, Mahmoud S. M. Abdel Wahed, and Atef Abu Khatita. 2022. "Environmental Geochemistry and Fractionation of Cadmium Metal in Surficial Bottom Sediments and Water of the Nile River, Egypt" Toxics 10, no. 5: 221. https://doi.org/10.3390/toxics10050221
APA StyleEl-Saadani, Z., Mingqi, W., He, Z., Hamukwaya, S. L., Abdel Wahed, M. S. M., & Abu Khatita, A. (2022). Environmental Geochemistry and Fractionation of Cadmium Metal in Surficial Bottom Sediments and Water of the Nile River, Egypt. Toxics, 10(5), 221. https://doi.org/10.3390/toxics10050221


