Article

Interspecies-Extrapolated Biotic Ligand Model to Predict Arsenate Toxicity to Terrestrial Plants with Consideration of Cell Membrane Surface Electrical Potential

Department of Biological and Environmental Engineering, Semyung University, 65 Semyung-ro, Jecheon-si 27136, Korea
Toxics 2022, 10(2), 78; https://doi.org/10.3390/toxics10020078
Submission received: 5 December 2021 / Revised: 23 January 2022 / Accepted: 1 February 2022 / Published: 8 February 2022
(This article belongs to the Section Ecotoxicology)

Abstract

:
Arsenic is a metalloid that is highly toxic to living organisms in the environment. In this study, toxicity caused by inorganic arsenate (As(V)) to terrestrial plants, such as barley Hordeum vulgare and wheat Triticum aestivum, was predicted using the existing biotic ligand model (BLM) for bioluminescent Aliivibrio fischeri via interspecies extrapolation. Concurrently, the concept of cell plasma membrane electrical potential (Ψ0) was incorporated into the extrapolated BLM to improve the model predictability in the presence of major cations such as Ca2+. The 50% effective As(V) toxicity (EC50{HAsO42−}) to H. vulgare decreased from 45.1 ± 4.34 to 15.0 ± 2.60 µM as Ca2+ concentration increased from 0.2 to 20 mM owing to the accumulation of H2AsO4 and HAsO42− on the cell membrane surface. The extrapolated BLM, which only considered inherent sensitivity, explained well the alteration of As(V) toxicity to H. vulgare and T. aestivum by Ca2+ with in an order of magnitude, when considering a linear relationship between Ψ0 and EC50{HAsO42−}.

1. Introduction

Arsenic (As) accumulates in environmental media via both natural and anthropogenic sources and can cause severe adverse effects on human health as well as ecosystems [1,2,3,4,5]. Because the total As concentration in the environmental media cannot accurately indicate bioavailability or ecotoxicity, it is important to rationally assess the ecotoxicity of As using suitable bioassays [6]. The ecotoxicity of As varies greatly depending on environmental factors (e.g., phosphate concentration) based on which the bioassay is performed [7,8] and on the sensitivity of the species tested [9]. The environmental factors can be considered using the biotic ligand model (BLM), which is a semi-mathematical and equilibrium model that predicts site-specific toxicity of cationic metals such as Cd, Cu, Ni, Pb, and Zn [10,11,12,13]. An et al. [14] recently developed a BLM for inorganic arsenate (As(V)), which is a predominant species in surface water and surface soil porewater. This BLM can effectively predict As(V) toxicity to the bioluminescence of Aliivibrio fischeri considering phosphate competition (toxicity alleviation) and As species alteration by pH. The sensitivity of the species tested can be considered using species sensitivity distribution (SSD), which is the cumulative distribution of toxicity of a single compound to a set of species that constitutes a community [15]. SSD can estimate the 5% hazardous concentration (HC5), which can be defined as the total dissolved concentration of the contaminant that protects 95% of the species in the ecosystem.
To simultaneously overcome site-specificity and species-specificity while assessing ecotoxicity, thereby deriving a safe concentration (e.g., HC5) in the ecosystem by combining BLM and SSD, the full SSD bioavailability normalization approach [16,17,18,19] can be used. In this approach, HC5 is estimated using an SSD obtained from the entire normalized (i.e., site-specific physicochemical properties that can affect the toxicity of metals or metalloids determined using the BLM) ecotoxicity data set. This approach also assumes that some species likely share the BLM parameters, that is, conditional binding constants between free metal ions or major cations and active binding sites (ABSs; i.e., biotic ligand) at the cell membrane surface of the organism [19]. This assumption has been supported by the fact that BLMs for Cu, Ni, and Zn can be extrapolated across species [16,17,18,20].
To the best of our knowledge, the BLM for As(V) only considers the effect of phosphate competition on A. fischeri, as suggested in a previous study [14], and not on individual species. Moreover, evidence supporting extrapolation with respect to the BLM for As(V) is still scarce. Therefore, in this study, the feasibility of interspecies extrapolation was tested to extend the BLM for As(V) to terrestrial plants.
The phenomenon through which major cations alleviate metal toxicity can be explained in terms of BLM, as well as the concept of cell plasma membrane (PM) electrical potential (Ψ0) [21,22,23]. The root cell PM surface, which is negatively charged, attracts cations in the bulk-phase medium. The addition of major cations, such as Ca2+, to the solution increases Ψ0 and decreases the cationic free metal ions moving to the cell PM surface via electrostatic attraction [21]. In contrast, As(V), which is normally present as H2AsO4 and HAsO42−, can accumulate on the PM surface. Wang et al. [22] revealed a significant increase in As(V) toxicity to wheat (Triticum aestivum) with increasing Ca2+ activity in the bulk solution. This was because the increase in Ca2+ activity from 0.2 to 2.5 mM in the solution increased Ψ0 from −40 to −20 mV, resulting in an increased accumulation of H2AsO4 and HAsO42− on the root cell PM surface of T. aestivum. However, such an increase in As(V) toxicity cannot be explained using the current BLM for As(V) [14].
The aim of this study was to confirm that the BLM for As(V), which was originally developed using A. fischeri, can predict As(V) toxicity to terrestrial plant species (i.e., Hordeum vulgare and T. aestivum) by optimizing the inherent sensitivity (IS). In this regard, the feasibility of interspecies extrapolation of BLM for As(V) was evaluated, and the predicted and measured 50% effective As(V) activities (EC50{HAsO42−}) were compared to assess the predictability of BLM for As(V) after adjusting for the inherent sensitivity (IS) of plants. Furthermore, a methodology was established to incorporate the concept of Ψ0 into the extrapolated BLM for As(V) for considering the increased toxicity of As(V) by Ca2+.

2. Materials and Methods

2.1. Toxicity Test

The root growth inhibition test using barley H. vulgare was performed according to ISO guideline 11269-1 [24] with some modifications. Seeds were sterilized in a 5% NaOCl solution (Daejung, Korea) for 10 min and rinsed three times with deionized (DI) water, with a resistance of 18.2 MΩ cm (Milli-Q, Millipore, Bedford, MA, USA). The seeds were then germinated on filter paper moistened with DI water for 36 h at room temperature (25 °C) in complete darkness. Each germinated seed was fixed on a polyethylene sheet that floated on the medium surface. For each medium, a toxicity test was conducted, comprising seven treatments (control + six different concentrations of As(V)). Each treatment was performed using six germinated seeds in a polyethylene beaker filled with 500 mL of the test medium as a hydroponic culture. All test media were incubated for 5 days at 20 °C with a light:dark cycle of 16:8 in a growth chamber (E15, Conviron, Winnipeg, Canada). The toxicity of As(V), measured as the relative root elongation (RRE), after exposure to a given concentration of As(V) was calculated [25] as follows:
RRE = 100 × L f , t L i , t L f , c L i , c
where RRE is the relative root elongation (%), Lf,t is the average root length (mm) of each treatment after 5 days of exposure, Li,t is the average root length (mm) of each treatment at the initial time (t = 0), Lf,c is the average root length (mm) of the control after 5 days of exposure, and Li,c is the average root length (mm) of the control at the initial time.
The changes in the RRE in response to the changes in As(V) concentrations or activities were fitted to a sigmoidal dose–response curve (Equation (2)) to calculate the 50% effective concentration (EC50).
y = y 0 + a 1 + e x x 0 b
where y is the observed RRE; x is the natural logarithm of the exposed As(V) concentration or activity; a, b, x0, and y0 are the fitting parameters that determine the shape of the dose–response curve.

2.2. Effect of Ca2+ Concentration on Arsenate Toxicity to H. vulgare

All reagents used in this study were of analytical grade. DI water was used throughout. A stock solution of As(V) (10 mM) was prepared by dissolving Na2HAsO4·7H2O (98.0–102%, Sigma–Aldrich) in DI water and stored in the dark at 4 °C prior to use. The As(V) concentrations in each test medium (i.e., in direct contact with H. vulgare) were 0, 0.5, 2, 10, 50, 200, and 1000 μM. The pH of each test medium was adjusted to 7 ± 0.05 using 3.6 mM 3-[N-morpholino] propanesulfonic acid (MOPS, >99.5%, Sigma–Aldrich), by adding 1 M NaOH or 1 M HCl. Background concentrations of major cations and anions in each test medium were as follows: Ca2+ = 0.2 mM, Mg2+ = 0.05 mM, K+ = 0.2 mM, Na+ = 1 mM, PO43− = 0.05 mM, SO42− = 0.05 mM, and NO3 = 0.2 mM. The independent effect of Ca2+ on As(V) toxicity to H. vulgare was assessed at pH 7 in 3.6 mM MOPS buffer. Each set comprised a series of solutions with five different Ca2+ concentrations (i.e., 0.2, 1, 5, 10, and 20 mM).

2.3. Chemical Analysis

The concentrations of major cations and total As were determined via inductively coupled plasma atomic emission spectrometry (ICP-AES) (ICAP 7400 DUO, Thermo Scientific, Waltham, MA, USA). The concentrations of the major anions were determined via ion chromatography (DX500, Dionex, Sunnyvale, CA, USA). Preliminary tests revealed that the measured concentrations did not differ significantly from their nominal values within 5% variability. Since the salt of pentavalent arsenate (i.e., Na2HAsO4·7H2O) was dissolved in DI water to prepare As(V) stock solution in this study, the total As concentration determined using ICP-AES was considered as the concentration of As(V). In order to validate this assumption, the test medium containing 50 μM As was stored 5 days, and then analyzed using high performance liquid chromatography (1260 In-finity LC system, Agilent Technologies, Santa Clara, CA, USA) linked to inductively coupled plasma mass spectrometry (7700x, Agilent Technologies, Santa Clara, CA, USA). It was confirmed that As(V) species did not alter significantly within 5% varia-bility.
Visual MINTEQ 3.1 [26] was used to calculate As(V) activities (H2AsO4 and HAsO42−) and the major cations/anions in the tested solution. Temperature, pH, ion concentrations, and partial pressure of CO2 (PCO2 = 0.00038 atm) were the input data.
The analysis of variance (ANOVA) was performed using Microsoft Excel 2010 Analysis ToolPak to evaluate whether Ca2+ significantly (p < 0.05) affected As(V) toxicity.

2.4. Calculation of the Electrical Potential of Root Cell PM Surface

To calculate Ψ0 and the corresponding ion activities at the PM surface, the Gouy–Chapman–Stern (GCS) model [27] was used. The GCS model comprises two parts: (i) electrostatic theory (Gouy–Chapman theory) and (ii) interaction between ions and the PM surface (Stern portion). The calculation process is described as follows:
First, the actual PM surface charge density (σ, unit: C/m2) can be described using Equation (3):
σ 2 = 2 ε r ε 0 RT i I z b ( exp [ Z i F Ψ 0 RT ] 1 )  
where 2 ε r ε 0 RT = 0.00345, when the concentrations are expressed in units of mol/L at 25 °C; εr is the dielectric constant of water; ε0 is the permittivity of vacuum; F, R, and T are the Faraday constant, gas constant, and absolute temperature, respectively; [IZ]b is the free ion concentration in the bulk solution; Zi is the charge of the ith ion.
Second, if the PM surface binding sites comprising negatively charged sites (R) and neutral sites (P0) are occupied by ions (IZ), the PM surface species and their equilibrium reactions can be represented as Equations (4) and (5):
K RI = RI Z 1 R I Z 0
K PI = PI Z R 0 I Z 0
where [R], [P0], [RIZ−1], and [PIZ] denote the PM surface densities expressed in mol/m2; and [IZ]0 denotes the concentration of the unbound IZ ion at the PM surface.
Finally, σ in the Graham equation (Equation (3)) can be expressed by Equation (6) as follows:
σ = R + i Z i 1 RI Z 1 + i Z i PI Z F
To calculate the values of [IZ]0, the Boltzmann equation (Equation (7)) can be used:
I z 0 = I z b exp Z i F Ψ 0 RT
To determine Ψ0, the trial values were assigned to Ψ0 in Equations (3)–(7) until the values of σ computed in Equations (3)–(6) converge. The equilibrium constants and total surface densities of the binding sites R and P in Equations (4) and (5) were previously determined and are available from Kopittke et al. [27].

2.5. Interspecies Extrapolation of BLM

The BLM for predicting As(V) toxicity to A. fischeri [14] is presented in Equation (8):
EC 50 HAsO 4 2 = f mix 50 % 1 + K XH 2 PO 4 H 2 PO 4 + K XHPO 4 HPO 4 2 1 f mix 50 % K XH 2 AsO 4 K As H + + K XHAsO 4
where KXA is the conditional binding constant for As(V) or phosphate bound to the ABS (L/mol); {An−} is the activity of As(V) or phosphate (mol/L) in the bulk solution; KAs is the acid dissociation constant of As(V) (pKAs = 6.76); fmix50% is the ABS required to be occupied by As(V) (both H2AsO4 and HAsO42−) for inducing 50% toxicity [14]. The BLM parameters, including the conditional binding constants and fmix50%, are presented in Table 1a.
EC 50 site = IS × EM site
IS = EC 50 test EM test = f mix 50 % 1 f mix 50 %
EM = 1 + K XH 2 PO 4 H 2 PO 4 + K XHPO 4 HPO 4 2 K XH 2 AsO 4 K As H + + K XHAsO 4
The site-specific EC50 of H. vulgare was calculated by multiplying the IS of the tested species and the environmental modulator (EM) [19]. IS was derived from the measured EC50 and chemical analysis data of the media (i.e., phosphate activities and pH) in toxicity tests. Hence, to determine the IS (corresponding f50%mix value), a single EC50 of H. vulgare for As(V) obtained from the toxicity test was required.

3. Results and Discussion

3.1. Effect of Increasing Ca2+ Concentrations on As(V) Toxicity

The changes in the EC50{HAsO42−} values with varying Ca2+ concentrations are shown in Figure 1. The EC50{HAsO42−} of H. vulgare significantly decreased from 45.1 ± 4.34 to 15.0 ± 2.60 μM as the Ca2+ concentrations increased from 0.2 to 20 mM (Figure 1a). However, the EC50{HAsO42−} of A. fischeri, which was the species used for developing the original BLM for As(V), was not significantly altered, although the Ca2+ concentrations increased from 0 to 25 mM (Figure 1b) [14]. This may be due to the sharp increase in Ψ0 of H. vulgare from −53.8 to −3.3 mV. However, only a slight increase in Ψ0 from −13.7 to −0.4 mV was obtained for A. fischeri because the experimental solution containing 0.342 M NaCl was completely used for the osmotic pressure control in the toxicity test using A. fischeri and, thus, the solution already had a considerable number of positive ions. As reported in previous studies [21,22,23], an increase in Ψ0 accumulates more H2AsO4 and HAsO42−, thereby increasing As(V) toxicity. The EC50{HAsO42−} of H. vulgare decreased 3.02 times, indicating its significance for more accurate prediction and evaluation of As(V) toxicity; however, it cannot be obtained using the current BLM for As(V).
A negative linear relationship (slope = −0.615, R2 = 0.771) between the calculated Ψ0 and measured EC50{HAsO42−} of H. vulgare is shown in Figure 2a. Wang et al. [22] revealed a similar trend in wheat T. aestivum (slope = −0.003, R2 = 0.729; Figure 2b). The slopes of the linear relationships between the calculated Ψ0 and measured EC50{HAsO42−} were different owing to the differences in species sensitivity to As(V). Therefore, the normalized EC50, which can be defined as the measured EC50{HAsO42−} divided by the y-axis intercept of the negative linear relationship (i.e., a situation where Ψ0 = 0), was used to quantify the effect of Ψ0 when compensating for species sensitivity (Figure 2c). Herein, the same negative linear relationship (slope = −0.055, R2 = 0.742) was obtained for both species (H. vulgare and T. aestivum). This indicates that the influence of Ψ0 is not a plant-specific property but a physicochemical property based on the attraction or repulsion of As(V) with the PM surface. Consequently, the effect of Ψ0 could be considered in a similar way for various plants that have a negatively charged PM surface.

3.2. Interspecies Extrapolation of BLM to Predict As(V) Toxicity to H. vulgare and T. aestivum

To extrapolate the BLM originally developed from A. fischeri to barley H. vulgare, the IS (fmix50%) had to be determined first. The EC50 value (i.e., EC50{HAsO42−}) of H. vulgare was 45.1 ± 4.34 μM, when the concentrations of major cations and anions were set to background levels by adjusting the pH to 7. Using the calculated EM value (2.70 × 10⁻⁵ M) in Equation (11), the IS and fmix50% were determined to be 1.675 and 0.626, respectively (Table 1b). The calculated IS of H. vulgare was similar to that of A. fischeri (fmix50% = 0.616) (Table 1b). The IS of wheat T. aestivum was also calculated to assess its applicability to other terrestrial plants. Wang et al. [22] reported the EC50 values of T. aestivum (toxic endpoint = root elongation change over 48 h) in hydroponic cultures. The calculated IS (fmix50%) of T. aestivum was 0.015 (Table 1b), implying that the sensitivity to As(V) is considerably higher in T. aestivum than in H. vulgare.
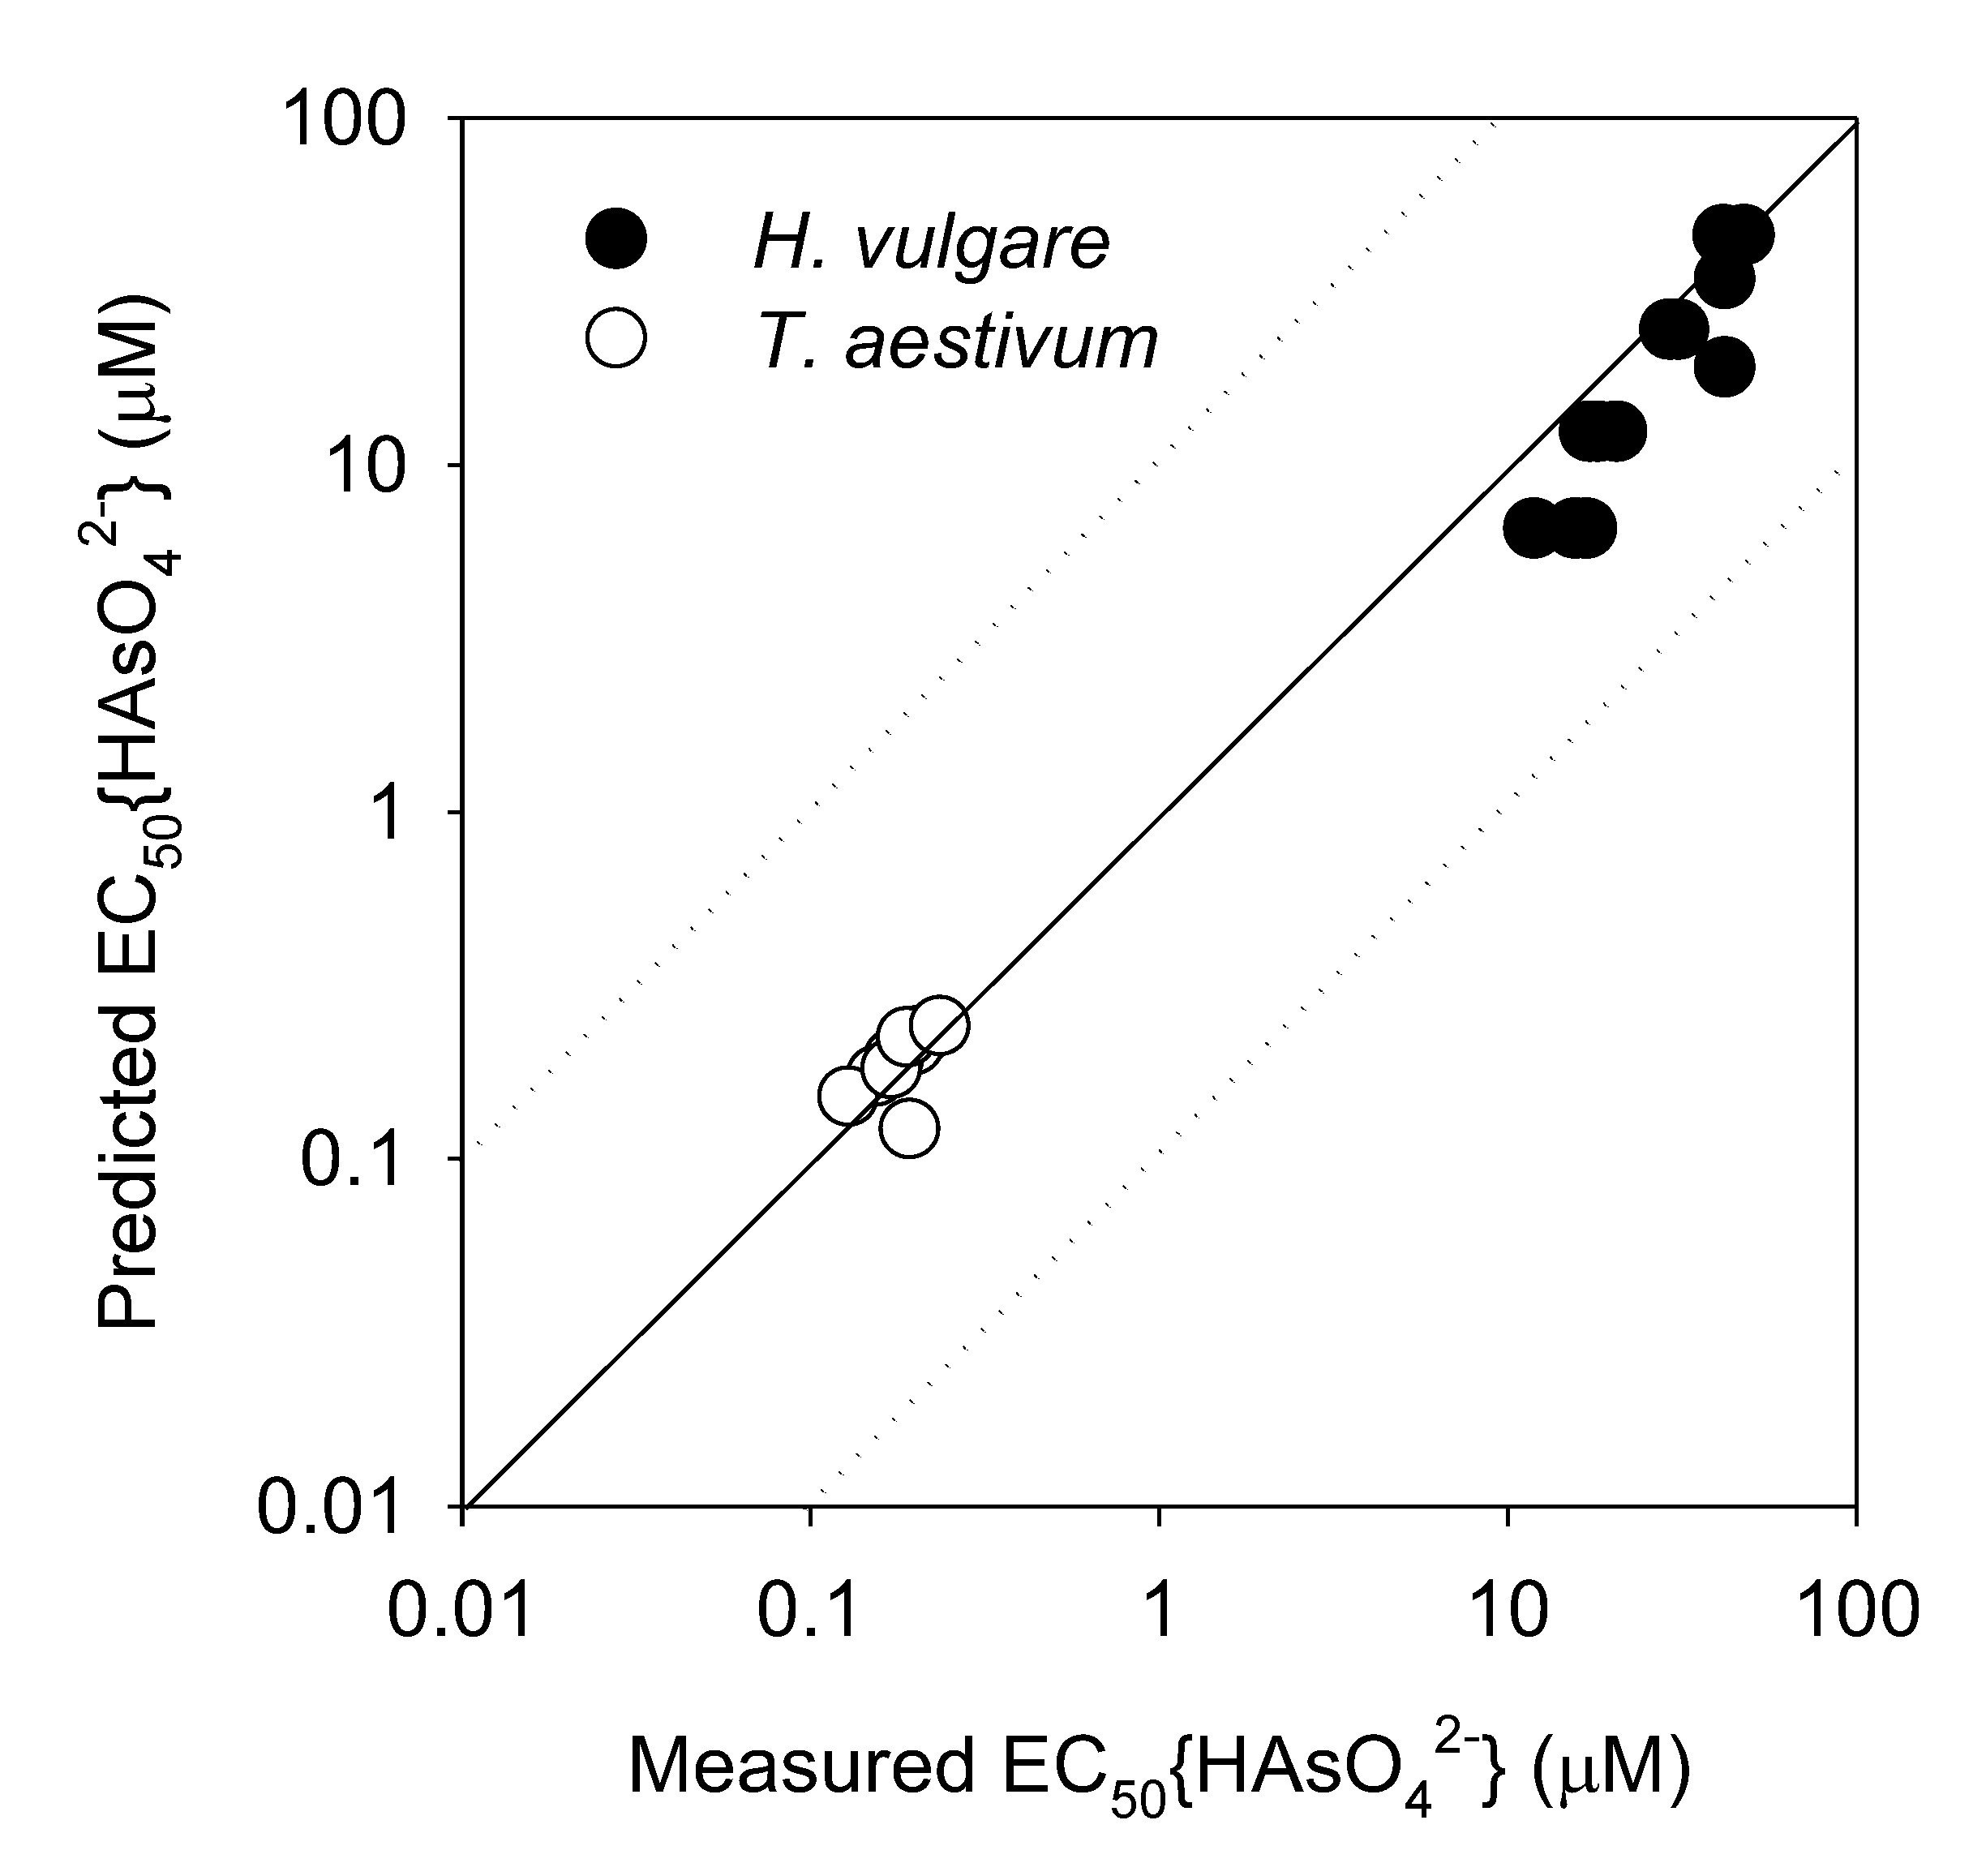
The extrapolated BLM to predict As(V) toxicity to H. vulgare and T. aestivum was validated by comparing the measured EC50 values with the predicted EC50 values (Figure 3). To analyze the effect of Ψ0 described in Section 3.1, the slopes of the negative linear relationships (p) in Figure 2a,b were used following Equation (12), when EC50 was predicted.
EC 50 HAsO 4 2 site = EC 50 HAsO 4 2 ini + p Ψ 0 , site Ψ 0 , ini
where EC50{HAsO42−}site is the value indicating the effect of Ψ0 at a site; EC50{HAsO42−}ini is the predicted EC50 value from the extrapolated BLM; Ψ0,site is the PM surface electrical potential calculated from the chemical analysis of water at the site; Ψ0,ini is the PM surface electrical potential calculated from the chemical analysis of water in the toxicity test solution when determining the EC50 value.
The model-predicted EC50{HAsO42−} and experimentally determined EC50{HAsO42−} exhibited a strong linear relationship within an order of magnitude (Figure 3). This demonstrated that although only IS is considered, site-specific As(V) toxicity to terrestrial plants can be predicted via the chemical analysis of water or porewater with significant accuracy. Thus, the BLM parameters for each plant species are not required, that is, the conditional binding constants between As(V) or phosphate and ABSs of the cell membrane are the same for both species; however, only one EC50 should be used for sensitivity correction. To achieve improved prediction accuracy, the relationship between EC50 values and Ψ0 must be derived.
As(V) is assimilated into cells by the existing orthophosphate transporters in both prokaryotes and eukaryotes [28,29], because As(V) is a chemical analog of orthophosphate. This suggests that there are no severe problems in directly using the BLM parameters (e.g., conditional binding constants: KXH2AsO4, KXHAsO4, KXH2PO4, and KXHPO4) derived from A. fischeri to predict As(V) toxicity to terrestrial plants. The BLM for As(V), originally developed for A. fischeri, can be extrapolated to terrestrial plants, including H. vulgare and T. aestivum across, plant kingdoms.

4. Conclusions

In this study, the toxicity caused by As(V) to the terrestrial plants, namely, H. vulgare and T. aestivum, was predicted using the existing BLM for bioluminescence of A. fischeri via interspecies extrapolation. The EC50{HAsO42−} values decreased from 45.1 ± 4.34 to 15.0 ± 2.60 μM as Ca2+ concentration increased from 0.2 to 20 mM, owing to the accumulation of H2AsO4 and HAsO42− on the PM surface. This was successfully predicted in the extrapolated BLM using a linear relationship between Ψ0 and EC50{HAsO42−}. Consequently, the BLM for As(V) developed for a single bacterium can predict As(V) toxicity to terrestrial plant species among various physicochemical properties by optimizing IS.

Funding

This study was supported by the Semyung University Research Grant of 2019.

Institutional Review Board Statement

Not applicable.

Informed Consent Statement

Not applicable.

Data Availability Statement

Data is contained within the article.

Conflicts of Interest

The author declares no conflict of interest.

References

  1. Mandal, B.K.; Suzuki, K.T. Arsenic round the world: A review. Talanta 2002, 58, 201–235. [Google Scholar] [CrossRef]
  2. Smedley, P.L.; Kinniburgh, D.G. A review of the source, behaviour and distribution of arsenic in natural waters. Appl. Geochem. 2002, 17, 517–568. [Google Scholar] [CrossRef] [Green Version]
  3. Das, D.; Samanta, G.; Mandal, B.K.; Chowdhury, T.R.; Chanda, C.R.; Chowdhury, P.P.; Basu, G.K.; Chakraborti, D. Arsenic in groundwater in six districts of West Bengal, India. Environ. Geochem. Health 1996, 18, 5–15. [Google Scholar] [CrossRef] [PubMed]
  4. An, J.; Jeong, B.; Jeong, S.; Nam, K. Diffusive gradients in thin films technique coupled to X-ray fluorescence spectrometry for the determination of bioavailable arsenic concentrations in soil. Spectrochim. Acta Part B At. Spectrosc. 2020, 164, 105752. [Google Scholar] [CrossRef]
  5. Park, J.; Chung, J.; Kim, S.H.; An, J.; Nam, K. Effect of neutralizing agents on the type of as co-precipitates formed by in situ Fe oxides synthesis and its impact on the bioaccessibility of as in soil. Sci. Total Environ. 2020, 743, 140686. [Google Scholar] [CrossRef]
  6. An, J.; Jeong, B.; Nam, K. Evaluation of the effectiveness of in situ stabilization in the field aged arsenic-contaminated soil: Chemical extractability and biological response. J. Hazard. Mat. 2019, 367, 137–143. [Google Scholar] [CrossRef]
  7. Lamb, D.T.; Kader, M.; Wang, L.; Choppala, G.; Rahman, M.M.; Megharaj, M.; Naidu, R. Pore-water carbonate and phosphate as predictors of arsenate toxicity in soil. Environ. Sci. Technol. 2016, 50, 13062–13069. [Google Scholar] [CrossRef]
  8. Rubinos, D.A.; Calvo, V.; Iglesias, L.; Barral, M.T. Acute toxicity of arsenic to Aliivibrio fischeri (Microtox® bioassay) as influenced by potential competitive-protective agents. Environ. Sci. Pollut. Res. 2014, 21, 8631–8644. [Google Scholar] [CrossRef]
  9. Dyer, S.D.; Versteeg, D.J.; Belanger, S.E.; Chaney, J.G.; Raimondo, S.; Barron, M.G. Comparison of species sensitivity distributions derived from interspecies correlation models to distributions used to derive water quality criteria. Environ. Sci. Technol. 2008, 42, 3076–3083. [Google Scholar] [CrossRef]
  10. Lock, K.; Van Eeckhout, H.; De Schamphelaere, K.A.C.; Criel, P.; Janssen, C.R. Development of a biotic ligand model (BLM) predicting nickel toxicity to barley (Hordeum vulgare). Chemosphere 2007, 66, 1346–1352. [Google Scholar] [CrossRef]
  11. De Schamphelaere, K.A.C.; Janssen, C.R. A biotic ligand model predicting acute copper toxicity for Daphnia magna: The effects of calcium, magnesium, sodium, potassium, and pH. Environ. Sci. Technol. 2002, 36, 48–54. [Google Scholar] [CrossRef]
  12. Wang, X.; Li, B.; Ma, Y.; Hua, L. Development of a biotic ligand model for acute zinc toxicity to barley root elongation. Ecotoxicol. Environ. Saf. 2010, 73, 1272–1278. [Google Scholar] [CrossRef]
  13. An, J.; Jeong, S.; Moon, H.S.; Jho, E.H.; Nam, K. Prediction of Cd and Pb toxicity to Vibrio fischeri using biotic ligand-based models in soil. J. Hazard. Mat. 2012, 203, 69–76. [Google Scholar] [CrossRef]
  14. An, J.; Jeong, B.; Nam, K. Extension of biotic ligand model to account for the effects of pH and phosphate in accurate prediction of arsenate toxicity. J. Hazard. Mat. 2020, 385, 121619. [Google Scholar] [CrossRef]
  15. Newman, M.C.; Ownby, D.R.; Mézin, L.C.A.; Powell, D.C.; Christensen, T.R.L.; Lerberg, S.B.; Anderson, B.-A. Applying species-sensitivity distributions in ecological risk assessment: Assumptions of distribution type and sufficient numbers of species. Environ. Toxicol. Chem. 2000, 19, 508–515. [Google Scholar] [CrossRef] [Green Version]
  16. De Schamphelaere, K.A.C.; Janssen, C.R. Cross-phylum extrapolation of the Daphnia magna chronic biotic ligand model for zinc to the snail Lymnaea stagnalis and the rotifer Brachionus calyciflorus. Sci. Total Environ. 2010, 408, 5414–5422. [Google Scholar] [CrossRef]
  17. Schlekat, C.E.; Van Genderen, E.; De Schamphelaere, K.A.C.; Antunes, P.M.C.; Rogevich, E.C.; Stubblefield, W.A. Cross-species extrapolation of chronic nickel biotic ligand models. Sci. Total Environ. 2010, 408, 6148–6157. [Google Scholar] [CrossRef]
  18. De Schamphelaere, K.A.C.; Heijerick, D.G.; Janssen, C.R. Cross-phylum comparison of a chronic biotic ligand model to predict chronic toxicity of copper to a freshwater rotifer, Brachionus calyciflorus (Pallas). Ecotoxicol. Environ. Saf. 2006, 63, 189–195. [Google Scholar] [CrossRef]
  19. Verschoor, A.J.; Vink, J.P.M.; de Snoo, G.R.; Vijver, M.G. Spatial and temporal variation of watertype-specific no-effect concentrations and risks of Cu, Ni, and Zn. Environ. Sci. Technol. 2011, 45, 6049–6056. [Google Scholar] [CrossRef]
  20. Van Sprang, P.A.; Verdonck, F.A.M.; Van Assche, F.; Regoli, L.; De Schamphelaere, K.A.C. Environmental risk assessment of zinc in European freshwaters: A critical appraisal. Sci. Total Environ. 2009, 407, 5373–5391. [Google Scholar] [CrossRef]
  21. Kopittke, P.M.; Kinraide, T.B.; Wang, P.; Blamey, F.P.C.; Reichman, S.M.; Menzies, N.W. Alleviation of Cu and Pb rhizotoxicities in cowpea (Vigna unguiculata) as related to ion activities at root-cell plasma membrane surface. Environ. Sci. Technol. 2011, 45, 4966–4973. [Google Scholar] [CrossRef] [PubMed]
  22. Wang, P.; Zhou, D.; Kinraide, T.B.; Luo, X.; Li, L.; Li, D.; Zhang, H. Cell membrane surface potential (Ψ0) plays a dominant role in the phytotoxicity of copper and arsenate. Plant Physiol. 2008, 148, 2134–2143. [Google Scholar] [CrossRef] [PubMed] [Green Version]
  23. Wang, Y.M.; Kinraide, T.B.; Wang, P.; Hao, X.Z.; Zhou, D.M. Surface electrical potentials of root cell plasma membranes: Implications for ion interactions, rhizotoxicity, and uptake. Int. J. Mol. Sci. 2014, 15, 22661–22677. [Google Scholar] [CrossRef] [PubMed] [Green Version]
  24. Soil Quality—Determination of the Effects of Pollutants on Soil Flora. Part 1. Method for the Measurement of Inhibition of Root Growth; No. 11269-1:2012; International Organization for Standardization (ISO): Geneva, Switzerland, 2012.
  25. Le, T.T.Y.; Peijnenburg, W.J.G.M.; Hendriks, A.J.; Vijver, M.G. Predicting effects of cations on copper toxicity to lettuce (Lactuca sativa) by the biotic ligand model. Environ. Toxicol. Chem. 2012, 31, 355–359. [Google Scholar] [CrossRef]
  26. Gustafsson, J.P. Visual Minteq Ver 3.1. 2014. Available online: http://vminteq.lwr.kth.se/ (accessed on 20 December 2020).
  27. Kopittke, P.M.; Wang, P.; Menzies, N.W.; Naidu, R.; Kinraide, T.B. A web-accessible computer program for calculating electrical potentials and ion activities at cell-membrane surfaces. Plant Soil 2014, 375, 35–46. [Google Scholar] [CrossRef] [Green Version]
  28. Rosen, B.P.; Liu, Z. Transport pathways for arsenic and selenium: A minireview. Environ. Int. 2009, 35, 512–515. [Google Scholar] [CrossRef] [Green Version]
  29. Muehe, E.M.; Eisele, J.F.; Daus, B.; Kappler, A.; Harter, K.; Chaban, C. Are rice (Oryza sativa L.) phosphate transporters regulated similarly by phosphate and arsenate? A comprehensive study. Plant Mol. Biol. 2014, 85, 301–316. [Google Scholar] [CrossRef]
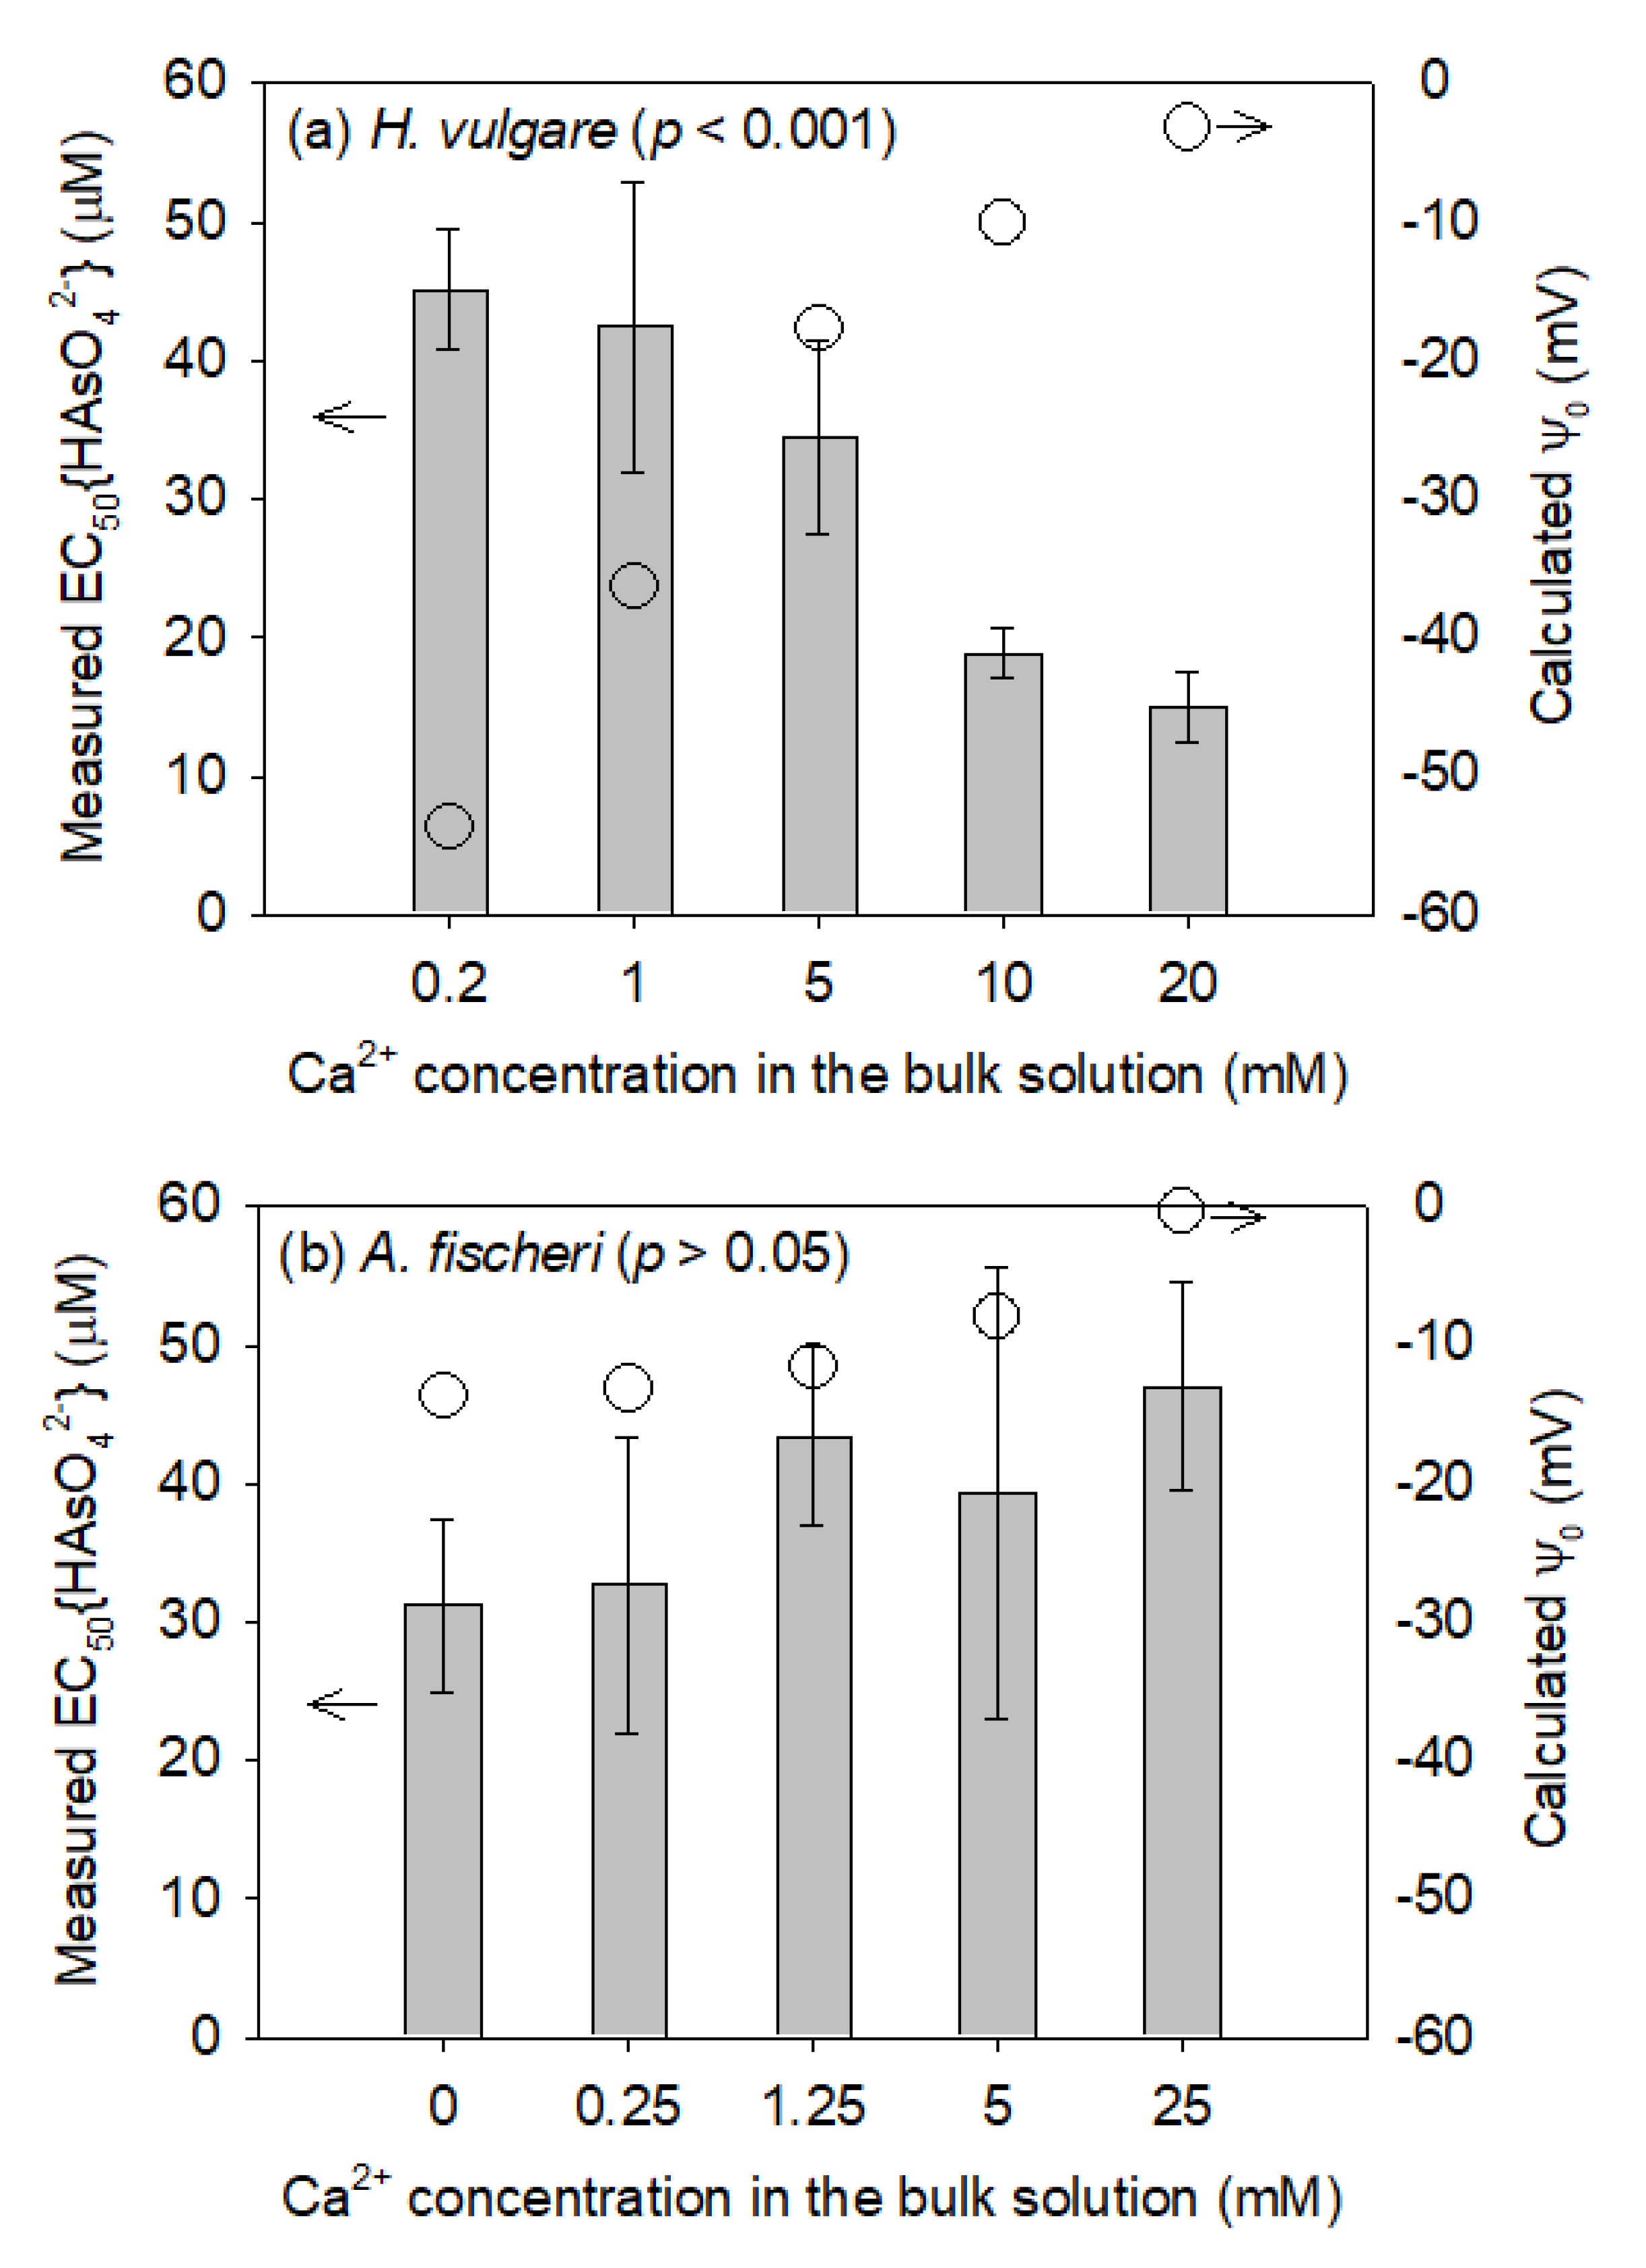
Figure 1. Measured EC50 values expressed as HAsO42− activity (left y-axis) obtained from (a) root elongation tests using Hordeum vulgare and (b) bioluminescence inhibition tests using Aliivibrio fischeri (data obtained from An et al. [14]). Calculated cell membrane surface electrical potential (Ψ0) (right y-axis) for (a) H. vulgare and (b) A. fischeri with varying Ca2+ concentrations. Solid bars and error bars indicate the EC50 values and their standard deviations (n = 3), respectively. Open circles represent the calculated Ψ0 values. The p-value of the ANOVA test was >0.05, indicating that Ca2+ addition did not significantly affect As(V) toxicity.
Toxics 10 00078 g001
Figure 2. Measured EC50 values expressed as HAsO42− activity from root elongation tests using (a) H. vulgare conducted in this study and (b) T. aestivum obtained from Wang et al. [22] plotted against calculated PM surface electrical potential (Ψ0). Normalized EC50 calculated by dividing the measured EC50{HAsO42−} by the y-axis intercept (i.e., a situation where Ψ0 = 0) of the negative linear relationship of each species presented in Figure 2a,b is also plotted against Ψ0 (c) to quantify the effect of Ψ0 by eliminating species sensitivity. The solid line represents the linear regression curve.
Toxics 10 00078 g002
Figure 3. Comparison of measured EC50{HAsO42−} and predicted EC50{HAsO42−} by the extrapolated BLM considering Ψ0. Open and closed circles indicate the EC50{HAsO42−} values for T. aestivum and H. vulgare, respectively. The solid line represents a perfect match between the measured and predicted EC50 values. The dashed lines indicate the difference between the measured and predicted values within an order of magnitude.
Toxics 10 00078 g003
Table 1. (a) Conditional binding constants of the biotic ligand model (BLM) for inorganic arsenate (As(V)) obtained from A. fischeri [14] and (b) calculated inherent sensitivity (fmix50%) of A. fischeri and terrestrial plants.
(a) Parameters of BLM for As(V) obtained from An et al. [14]
Conditional binding constant alog KXH2AsO4log KXHAsO4log KXH2PO4log KXHPO4
Value
(L/mol)
3.0674.8023.4244.588
(b) Inherent sensitivity of A. fischeri and terrestrial plants
SpeciesToxic endpointf50
(dimensionless)
Aliivibrio fischeri5 min bioluminescence inhibition0.616 b
Hordeum vulgare5 days relative root elongation0.626 c,d
Triticum aestivum2 days relative root elongation0.015 c,e
a Conditional binding constants for As(V) (HAsO42− and H2AsO4) or phosphate (HPO42− and H2PO4) bound to active binding sites on the cell membrane surface of A. fischeri; b obtained from An et al. [14]; c Calculated in this study; d Toxicity data obtained from this study; e Toxicity data obtained from Wang et al. [22].
Publisher’s Note: MDPI stays neutral with regard to jurisdictional claims in published maps and institutional affiliations.