Article

The Downstream Supply Chain for Electricity Generated from Renewables in Egypt: A Dynamic Analysis

by
Islam Hassanin
1,2,*,
Tariq Muneer
3 and
Matjaz Knez
2
1
College of International Transport and Logistics, Arab Academy for Science, Technology and Maritime Transport, Alexandria P.O. Box 1029, Egypt
2
Faculty of Logistics, University of Maribor, 3000 Celje, Slovenia
3
School of Computing, Engineering and the Built Environment, Edinburgh Napier University, Edinburgh EH10 5DT, UK
*
Author to whom correspondence should be addressed.
Logistics 2025, 9(4), 150; https://doi.org/10.3390/logistics9040150
Submission received: 30 August 2025 / Revised: 9 October 2025 / Accepted: 15 October 2025 / Published: 21 October 2025

Abstract

Background: Generating electricity from renewable sources continues to receive significant attention from both scholars and professional communities. This is mainly because traditional energy use harms public health, threatens biodiversity, and increases pollution, particularly in developing countries. Meanwhile, renewable technologies are considered one of the most effective solutions to enrich energy security for future usage with clean practices and affordable prices. However, planning such applications may become complex due to the convolution of many technical, economic, environmental, and social dimensions, particularly from a supply chain management viewpoint. Methods: The paper identifies the dimensions affecting the supply chain variables of downstream processes in renewable energy supply systems, especially for generating electricity in Egypt. Also, this paper investigates the relationships between the dimensions of renewable energy supply systems and the downstream supply chain variables that are closely related to the Egyptian energy sector. Results: The different relationships between these indicators and downstream supply chain variables are revealed. Conclusions: This study employed conceptual causality diagramming to organize these relationships harmoniously, which helps to analyze the behavior of the supply chain during the transitions to renewable energy applications and its implications, whether at the managerial or policy and procedural levels.

1. Introduction

Lately, the transformation toward various green and sustainable energy systems has concentrated on the stimulated expansion of renewable energy (RE) schemes. This transformation could be acknowledged as significant at the same time, especially with contemporary matters threatening economic, environmental, and social aspects of human life [1,2,3,4]. Therefore, sustainable energy supply has become a complicated mission [5,6]; RE technologies represent gateways to achieving sustainable development efficiently by satisfying future energy demand and contributing to a fair movement toward climate change, particularly within the countries classified as developing [7,8]. Hence, emerging nations in RE development should make the required and quick preparations for the enlargement and growth of such technologies.
On the other side, the supply chain (SC) associated with RE shows equivalences with conventional supply chain frameworks [9], whereas a renewable energy supply chain (RESC) fundamental domain has been effectively established to produce energy utilizing various supply chain approaches [10]. Thus, its activities should be analyzed from a sustainability perspective [3,11]; consequently, in recent times, it has become an obligatory critical challenge to direct the way of thinking to enhance the SC schemes of RE technologies, which is considered one of the most vital strategies to enrich this sector to achieve sustainable practices, especially those related to environmental concerns [12,13].
This study concentrates on surveillance loops to illuminate the interconnections among various variables within a dynamic and sophisticated SC system, with a greater concentration on downstream processes. Therefore, the investigation was applied to conclude all the technical, economic, environmental, and social dimensions that dominate SC variables, as extracted from the literature, regarding RE applications in Egypt, mainly the dimensions affecting the downstream SC. Then, this study determines the correlations among these influences that impact the downstream SC for such systems. Accordingly, the dynamic behavior of these indicators and the downstream SC variables is described by developing a conceptual causal loop diagram (CLD) for renewable electricity in Egypt.
Hence, the research questions related to this study have been developed as follows: (i) What are the principal indicators of the dimensions of renewable energy supply systems related to the Egyptian market? (ii) What are the key downstream SC variables that affect the RESC in Egypt? (iii) How are the various renewable energy system dimensions correlated with the downstream SC variables? Finally, (iv) What is the dynamic system outline that links these variables?
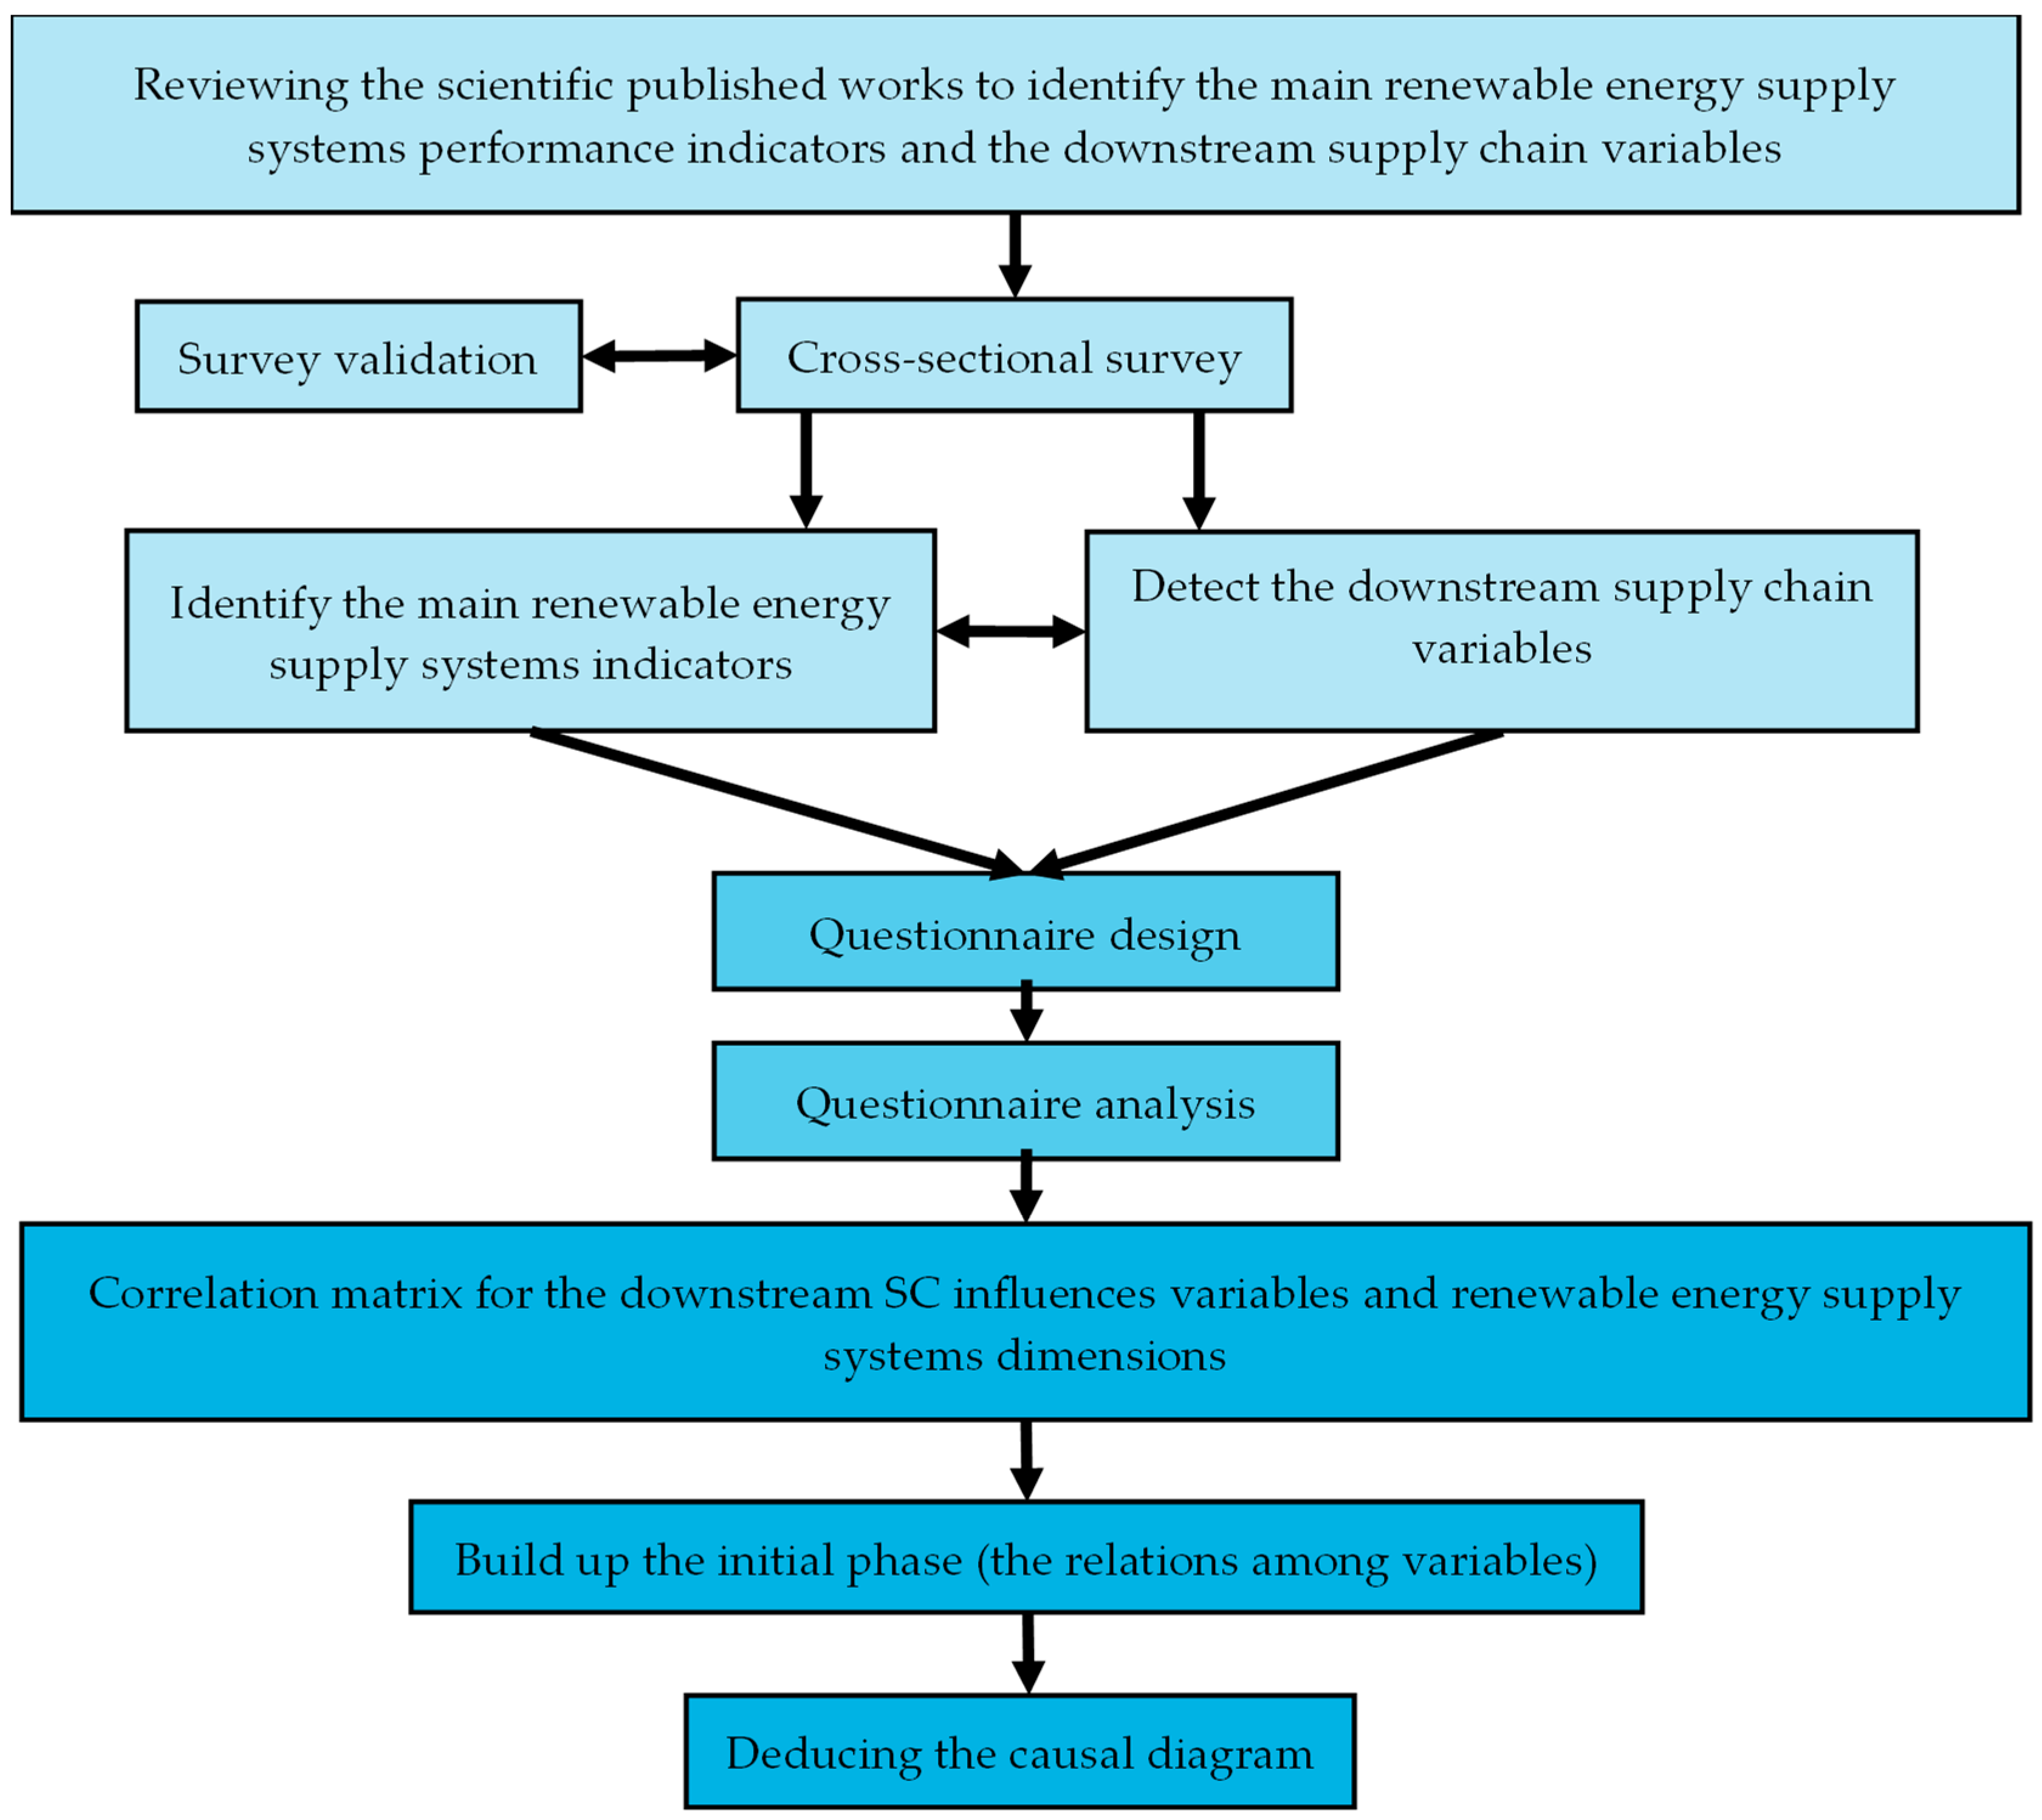
Thus, these research questions were investigated using, first, a survey to investigate Egyptian experts’ opinions to identify the main indicators extracted from the literature related to the renewable energy supply system dimensions and to determine the downstream SC variables. The relationships between the indicators and the downstream SC variables for the renewable energy system were then delineated using a correlation matrix analysis based on a questionnaire. Lastly, the conceptual CLD has been designed to clarify the dynamic relationships between these variables and their impacts on each other.
The organization of the following sections of this manuscript is articulated as follows: Section 2 provides the contextual information that scientifically regulates the relationship between the SC and RE technologies, with more clarification of the influencing variables affecting the process of the downstream SC. The second section also declares the dimensions of RE supply systems and their indicators, which are described in previously published scientific works. Then, Section 3 identifies the methodologies and research tools. Next, Section 4 expounds on the key research analysis and results, specifying the correlation between renewable energy supply system dimensions and downstream SC variables. Section 5 illustrates the formation of the CLD. Section 6 presents the managerial and procedural implications of this study, and Section 7 concludes this study and represents the future research areas.

2. Study Overview and Background Information

2.1. Renewable Energy Supply Chain

The link between SC and RE technology expansion has received increased attention in scientific investigations [8,14]. All published works have exposed that the SC in RE domains has the foremost consequences on economic progression [15,16], creating the term RESC that is defined as follows: “the transformation of raw energy into usable energy and involving an effective set of management principles from the acquisition of energy resources to the consumption of usable energy” [4]. However, contemporary literature on SC approaches in the RE environment has primarily been combined with inventory management, forecasting, network optimization, and transport, focusing more on biomass because it has greater materialistic practices than others [17].
Nevertheless, many published works have been conducted in supply chain management (SCM) concerning RE technology development, designing, optimization, and control, such as Lam, Varbanov, and Klemeš [17], Wee et al. [18], Balaman and Selim [19], Jeong and Ramírez-Gómez [20], and Sahebi et al. [21]. Additionally, some review papers have examined the critical relationship between SC and RE, such as Jelti, Allouhi, Büker, Saadani, and Jamil [4] who assessed the SC’s contribution to the RE sector and evaluated RESC performance; Azevedo, Santos, and Antón [8] who conducted a bibliometric examination of previous research on the domain of SCM and renewables; and finally, Acuna et al. [22] who reviewed optimization methods for biomass SCs.
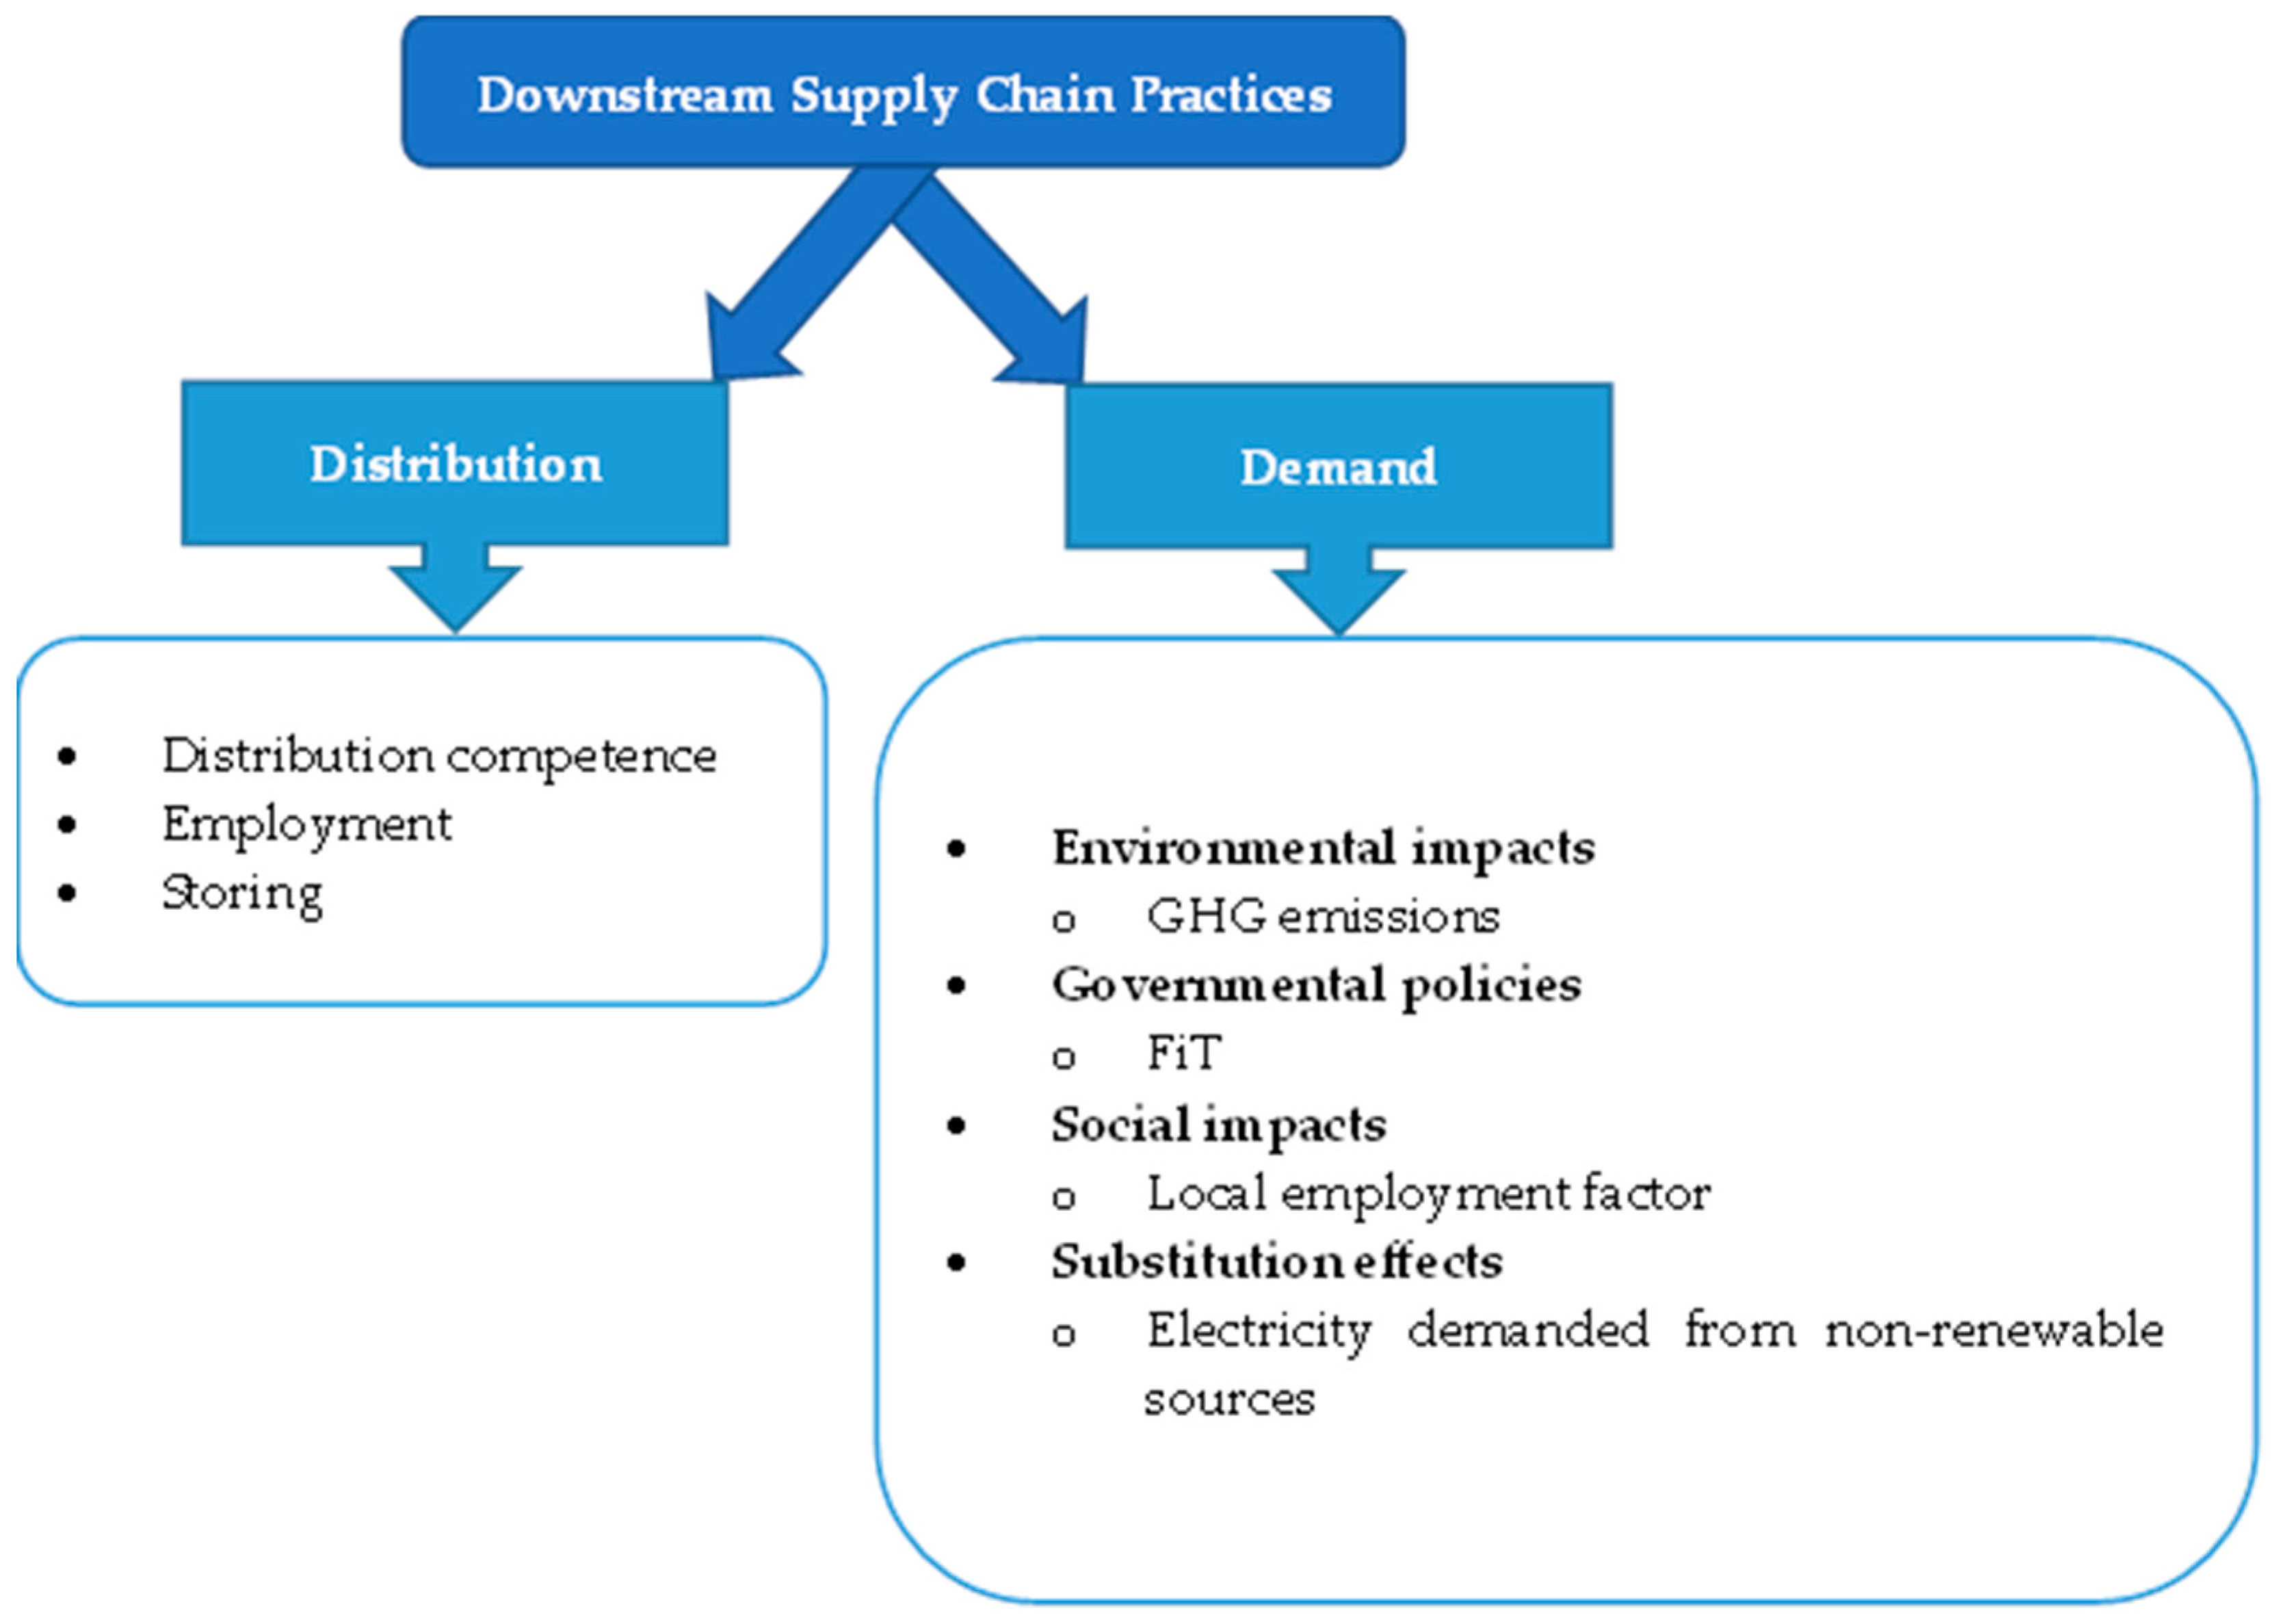
On the other hand, upstream, production, and downstream processes are considered the main stages of an RESC. These processes have five sub-stages: procurement for the upstream stage, generation and transmission for the production stage, and distribution and demand for the downstream stage [16,23]. They comprise all the RESC processes from the installation to the conversion into valuable power. Hence, the RESC’s main goals are to support a reliable supply of renewable power and to promote RE technology utilization [4]. Regarding this study, Figure 1 depicts the specific downstream supply chain process for renewable energy that consists of two main sub-phases, distribution and demand, as well as the significant variables for each sub-phase.
Concerning the downstream phase, specifically the demand-related practices, the factors are quite broad, so different studies identified various sub-factors, such as:
  • The environmental impacts could be represented by many sub-factors [24], for example:
  • Land requirement that correlates with the energy produced per unit of land.
  • Greenhouse gas (GHG) emissions negatively impact public health and the environmental ecosystem.
  • Sustainability refers to meeting contemporary requirements while safeguarding the capacity of future generations to achieve their goals [25].
2.
Different governmental policies have been adopted across countries, especially in developing countries, as support instruments to deploy the RE in the field of electricity generation. Some countries within the European Union are using only one policy; however, others apply a combination of support policies to sustain renewable electricity [4], such as:
  • Feed-in-tariffs (FiT) policy represents the money paid by the government to electricity suppliers for each unit of electricity produced in the network [26].
  • Tax reductions or subsidies can assist investors in lowering their initial investment costs for RE systems.
  • Renewable portfolio standards represent a progressive regulatory framework that delineates a specific proportion of electrical consumption or generation to be derived from renewable energy sources.
3.
Also, social impact variables vary considerably [24], including the following:
  • Local employment factor by measuring the direct and indirect employment related to RE projects that includes manufacturing, construction, operation and maintenance, project planning and management, consultancy, supply chain, and other services such as research and development (R&D), banking planning and management, and energy trading and distribution [27].
  • Secure energy supply by ensuring consistent availability of sufficient energy supplies through the exploitation of local RE sources.
  • Price stability of electricity by developing indigenous RE might eliminate price fluctuations.
4.
Finally, the substitution effects include [4]:
  • Electricity demanded from non-renewable sources refers to the energy volume consumed from fossil resources, which can impact the demand dynamics within the electricity market.
  • Optimal price levels by adopting the RE may assist in preserving economically viable energy prices for end users.
  • Economic shifts that change the budget invested in other power projects to be directed to RE technology to generate electricity, along with the financial profitability of acquiring such sources.

2.2. Energy Supply Systems Dimensions

There are some dimensions for the systems of energy supply, as shown in Table 1, which consist of: (i) a technical dimension that evaluates the processes’ performance technically throughout the system by considering the issues related to the technological constraints [3]. Also, this dimension ensures the monitoring of the system elements’ efficiency and the quality of service provided [28]; (ii) an economic dimension that assesses the cost-effectiveness of each activity in the system to effectively respond to market needs; (iii) an environmental dimension that is mainly for supporting the monitoring and decision making of all performed works by the involved participants in the system from an environmental perspective; and (iv) a social dimension that establishes social indicators to evaluate user interest and motivation for RE technologies and their projects, as well as assesses the social impact of RE technologies and regulations [3,4,28].

3. Research Methods and Tools

In this study, and in accordance with the steps demonstrated in Figure 2, the mixed approach has been employed [29] to accomplish the principal aim of the investigation and to respond to the research questions presented previously. First, a qualitative methodology was conducted by organizing a cross-sectional survey that was distributed to academic experts from different related higher educational institutions and professionals from practical fields, including both industrial or governmental bodies, to explore the central assessment indicators of energy supply systems that regulate the RE sector in Egypt on one hand and to define the key variables that influence the downstream supply chain behavior related to the RE sector in Egypt on the other.
Then, a questionnaire was deployed to investigate and test the relationships between the downstream SC variables and RE systems dimensions to establish the initial phase of the relationships based on the directions of relationships specific to the Egyptian energy market. Consequently, the CLD was developed for renewable electricity in Egypt based on these refined relationships, which helps to enhance the understanding of the complex system related to this field [30,31].

4. Analysis and Results

4.1. Cross-Sectional Survey Results

4.1.1. Survey Design

A cross-sectional survey was performed across the supply chain and energy sectors in Egypt. All participants were requested to participate in the online survey, which was designed to collect data from experts in the SC and RE sectors. This approach allowed for the collection of relevant insights, facilitating a comprehensive understanding of the current perspectives and experiences of professionals within these industries. Thus, the minimum age for participation in this survey was set at 25 years. This criterion ensures that respondents possess relevant experience and knowledge, thereby contributing valuable and pertinent information to the research.
The survey was structured into three sections: the first, socio-demographic information; the second, surveying the indicators that affect the RE sector in Egypt, which were presented in Table 1; and the third, surveying the downstream SC variables, focusing on all variables mentioned in Figure 1. This comprehensive design was intended to acquire an integrated image of the participants’ perspectives and experiences related to the RE sector in Egypt and its influences, specifically those related to the downstream activities. The survey was validated by a panel of six experts from relevant disciplines, who were selected according to their years of experience. Experts were chosen based on their subject-matter expertise, academic qualifications, and professional experience in the area covered by the survey. Additionally, a minimum of 10 years of experience was required to ensure that the experts possessed a deep understanding of the field and were well-positioned to evaluate the relevance and comprehensiveness of the survey items. The survey was validated using the content validity index (CVI) [32,33], and the detailed results of the validation process are provided in Appendix A.
An online self-reporting platform was employed to collect data. This method was selected for several reasons: first, the online format facilitated ease of access, permitting participants to engage in the survey at their discretion, which is crucial for obtaining thoughtful and accurate responses; second, it enabled a broader reach, ensuring that experts in the supply chain and RE sectors across Egypt could participate regardless of their location; and finally, the online platform allowed participants to take their time to read each question carefully, thereby enhancing the quality of the data collected.
Both English and Arabic languages were used in the survey design to provide participants with the freedom to engage in the language they were most comfortable with. This bilingual approach was intended to enhance the accuracy of responses, as some participants may find it challenging to express their thoughts in English or may struggle to fully understand the questions. By accommodating linguistic preferences, the study seeks to ensure that all participants can contribute effectively and provide valuable insights.

4.1.2. Data Analysis

A descriptive analysis was employed, focusing on the count of responses rather than a detailed statistical analysis. According to the survey’s sampling calculations, as presented in Appendix B, out of the 768 surveys distributed, 530 responses were received. However, 96 of these were incomplete and thus excluded from the analysis. Additionally, the minimum age for participation in this survey was set at 25 years. This criterion was established to ensure that respondents possessed relevant experience and knowledge, thereby contributing valuable and pertinent information to the research. Hence, 14 responses were eliminated because the participants were younger than the minimum age requirement. Consequently, the final dataset included 420 valid responses, which will be employed for analytical purposes. Table 2 outlines the demographic attributes of the valid responses.
By setting 50% as the threshold, any indicator or variable was considered influential in the RE Egyptian market if more than 50% of the participants acknowledge it. In other words, when most of the participants agree on the relevance of an indicator or variable, it was deemed to have an impact on the market. The results showed strong support for both Efficiency (410 participants, 97.6%) and Exergy Efficiency (400 participants, 95.2%), while other criteria, such as Primary Energy Ratio, Safety, Maturity, and Reliability, received significantly lower endorsements and were subsequently excluded from further analysis. Additionally, in response to the second question, participants were asked to suggest any other related criteria beyond those mentioned in the first question. Accordingly, 380 participants (90.5%) recommended the Renewable Energy Consumption Rate as an important indicator, while 280 participants (66.7%) suggested a Satisfaction Rate, recognizing them as effective indicators regarding the technical performance of RE sources.
Regarding the economic dimension, various cost-related criteria were evaluated by the participants. The responses indicated that 395 participants (94.0%) identified Investment Cost and 410 participants (97.6%) emphasized Operational and Maintenance Cost. Fuel Cost received minimal attention, with only three participants (0.7%) mentioning it, and Electric Cost garnered 69 responses (16.4%). Additionally, the Equivalent Annual Cost was recognized by 45 participants (10.7%), and the Net Present Value was reported by 98 participants (23.3%), while the Payback Period was acknowledged by 407 participants (96.9%). Lastly, 72 participants (17.1%) provided insights into Service Life. Regarding the second question concerning additional economic indicators, a few participants suggested alternative factors; however, these were excluded from further consideration by the authors due to their low frequency.
Considering the environmental dimension, various emissions and land use criteria were evaluated. The results indicated that 393 participants (93.6%) addressed Land Use, while CO2 Emissions were noted by 401 participants (95.5%). Other emissions were reported as follows: NO2 Emissions received 84 responses (20.0%), CO Emissions were identified by 43 participants (10.2%), SO2 Emissions were acknowledged by 17 participants (4.0%), and Particle Emissions were noted by 8 participants (1.9%). Notably, no participants reported Non-Methane Volatile Organic Compounds. Regarding the second question about the suggested environmental indicators, no additional indicators were proposed by the participants.
In examining the social dimensions, the survey revealed that 365 participants (86.9%) identified Social Acceptability as a significant indicator. Additionally, 30 participants (7.1%) recognized Social Benefits, while Job Creation was highlighted by 409 participants (97.4%). In addition, no additional indicators were proposed by participants in response to the second question within this dimension. All the identified indicators correspond to the various dimensions depicted in Figure 3.
Regarding the downstream supply chain aspects, participants considered all three distribution variables to be approximately equally important, with a slight preference for Employment. All presented variables received more than 80% agreement. In addition, concerning the demand variables, the survey revealed that only one variable for each practice was identified. A total of 401 participants (95.5%) considered GHG Emissions a significant variable within environmental impacts. FiT was recognized by 398 participants (94.8%), making it the only influential policy among governmental policies.
Also, 295 participants (70.2%) identified the Local Employment Factor as representative of the social impact. Finally, the Electricity Demanded from Non-renewable Sources was chosen by 351 participants (83.6%), representing the substitution effects. Overall, no additional variables were anticipated by participants in response to the second question. Accordingly, Figure 4 shows the specified variables affecting the downstream supply chain practices in Egypt.

4.2. Questionnaire and Correlation Results

Correlation is broadly defined as a determination of the relationship linking elements. In the context of correlation analysis, a modification in the amplitude of a particular variable is correlated with a concomitant modification in the amplitude of a differing variable, which may be positive or negative [34]. It is also known as correlation analysis, which represents the connection or link among two or more quantitative variables. The key assumption of this analysis is that the quantitative variables exhibit a linear correlation. A correlation analysis produces a correlation coefficient that spans from −1 to +1, a correlation coefficient of +1 demonstrates that the two variables are identically related in a positively linear manner, and a correlation coefficient of −1 proves that both variables are identically related in a manner that is negatively linear. Conversely, a coefficient of zero implies the absence of any linear relationship between the variables under examination [34,35].
Regarding the investigation and testing of the relationship between the downstream SC variables and the RE supply systems indicators in Egypt, a questionnaire was adopted to investigate the relationship between the RE supply system indicators and the downstream supply chain variables in the RE field, considering the Egyptian situation. The questionnaire is directed to the academic communities from different fields related to energy education, as well as a group of Egyptian experts from the related disciplines with relevant practical experience, closely related to the RE field, electrical engineering, networking and designing electric grids, energy economics, and SCM.
Considering the dimensions of RE supply systems and their indicators as independent variables, the sample-to-variable ratio technique is used with a 20:1 ratio [36] to determine the appropriate sample size. Accordingly, with 11 independent variables, the sample size was calculated to be 220 responses. To achieve this target, and accounting for an anticipated response rate of approximately 50%, a total of 450 questionnaires were distributed across diverse sectors. Academic participants included faculty from universities and colleges offering electrical engineering programs, while the industrial participants comprised technicians and engineers from both public and private entities. This strategic distribution aimed to obtain a balanced and representative sample, ensuring that the collected insights reflected both academic and practical perspectives within the renewable energy systems field.
The 7-point Likert scale was used, where “1” indicated “Not important at all” and “7” indicated “Extremely important”. A total of 269 valid responses were collected and analyzed using correlation analysis conducted in SPSS version 29. The correlation was completely applied to include all identified indicators and variables. The indicators were coded using T for technical indicators, ENV for environmental indicators, ECO for economic indicators, and S for social indicators. Similarly, downstream SC variables are coded as Di for distribution variables and De for demand variables. The calculations were conducted to determine the relationships between the downstream SC and all RE supply indicators that were revealed from the survey and shown in Figure 3 and Figure 4.
A Pearson product-moment correlation coefficient, one of the most frequently used correlation measures, is performed when all variables are quantitative. The rows and columns indicate separate variables used in behavioral research [35]. Also, the p-value is a crucial consideration when measuring dependency using Pearson correlation. The p-value serves as a statistical metric that assesses the possibility that the empirical data are incompatible with the theoretical model. A p-value less than or equal to 0.05 typically signifies a statistically significant correlation, whereas a p-value exceeding 0.05 indicates a statistically insignificant correlation [37].
Hence, utilizing the Pearson product-moment correlation coefficient of the findings derived from the questionnaire data predominantly serves to clarify the principal trajectories of relationships among the various variables. Significant correlations were revealed between all independent and dependent variables; however, some exposed positive correlations, while others showed negative correlations, as illustrated in Table 3.

4.2.1. Distribution Variables

The analysis identified a significant positive correlation between all distribution variables, i.e., Distribution Competence, Employment, and Storing with Efficiency, Exergy Efficiency, Renewable Energy Consumption Rate, Satisfaction Rate, Investment Cost, Operation and Maintenance Cost, Land Use, Job Creation, and Social Acceptability (r > 0, p-value < 0.05). Similarly, a significant negative relationship was observed between all distribution variables on one side and the Payback Period and CO2 Emissions on the other (r < 0, p-value <0.05).

4.2.2. Demand Variables

The examination revealed a significant positive correlation between FiT Policy and Local Employment Factor, as well as Efficiency, Exergy Efficiency, Renewable Energy Consumption Rate, Satisfaction Rate, Investment Cost, Operation and Maintenance Cost, Land Use, Job Creation, and Social Acceptability (r > 0, p-value < 0.05). However, GHG Emissions and Electricity Demanded from Non-renewable Sources have a significant negative correlation with the same set of indicators (r < 0, p-value < 0.05). Conversely, a significant positive relationship was established between the same factors and both CO2 emissions and the payback period (r > 0, p-value < 0.05).
Furthermore, Cronbach’s alpha test is utilized to evaluate the reliability of the data, comparing the amount of shared variance among the tested items. The commonly acknowledged ratio is α between 0.6 and 0.7, indicating an acceptable reliability level, and A value of 0.8 or more is considered an actual good level for applied research.

5. Structuring a Conceptual Causal Loop Diagram

According to the relationships identified in the previous section, the authors proceeded to deduce the CLD to clearly define the auxiliary or intermediate variables. Through the internal dynamics in the system, the endogenous and exogenous variables reflected from the main variables were concluded [38]. Accordingly, to incorporate all variables, the depiction of block diagrams was subsequently transformed into a causality diagram to determine the relationships among all variables, considering the auxiliary or intermediate variables [30]. The process began with identifying small loops to design systematic interventions within the diagram. A single variable was selected to create an individual loop, and this process was repeated until the patterns of loops were recognized and structured, using computerized system thinking and simulation software (VENSIM PLE v. 9.3.4) [39].
To facilitate and enhance the diagram’s visibility, the indicators, primary variables, and auxiliary variables were differentiated using different colors. The indicators of the renewable energy supply system were categorized into four colors: red for technical indicators, green for economic indicators, light blue for environmental indicators, and purple for social indicators. On the other hand, the SC downstream variables were divided into two colors: pink for distribution variables and orange for demand variables. In addition, all auxiliary variables, which are considered flow-influencing factors, were represented by black.
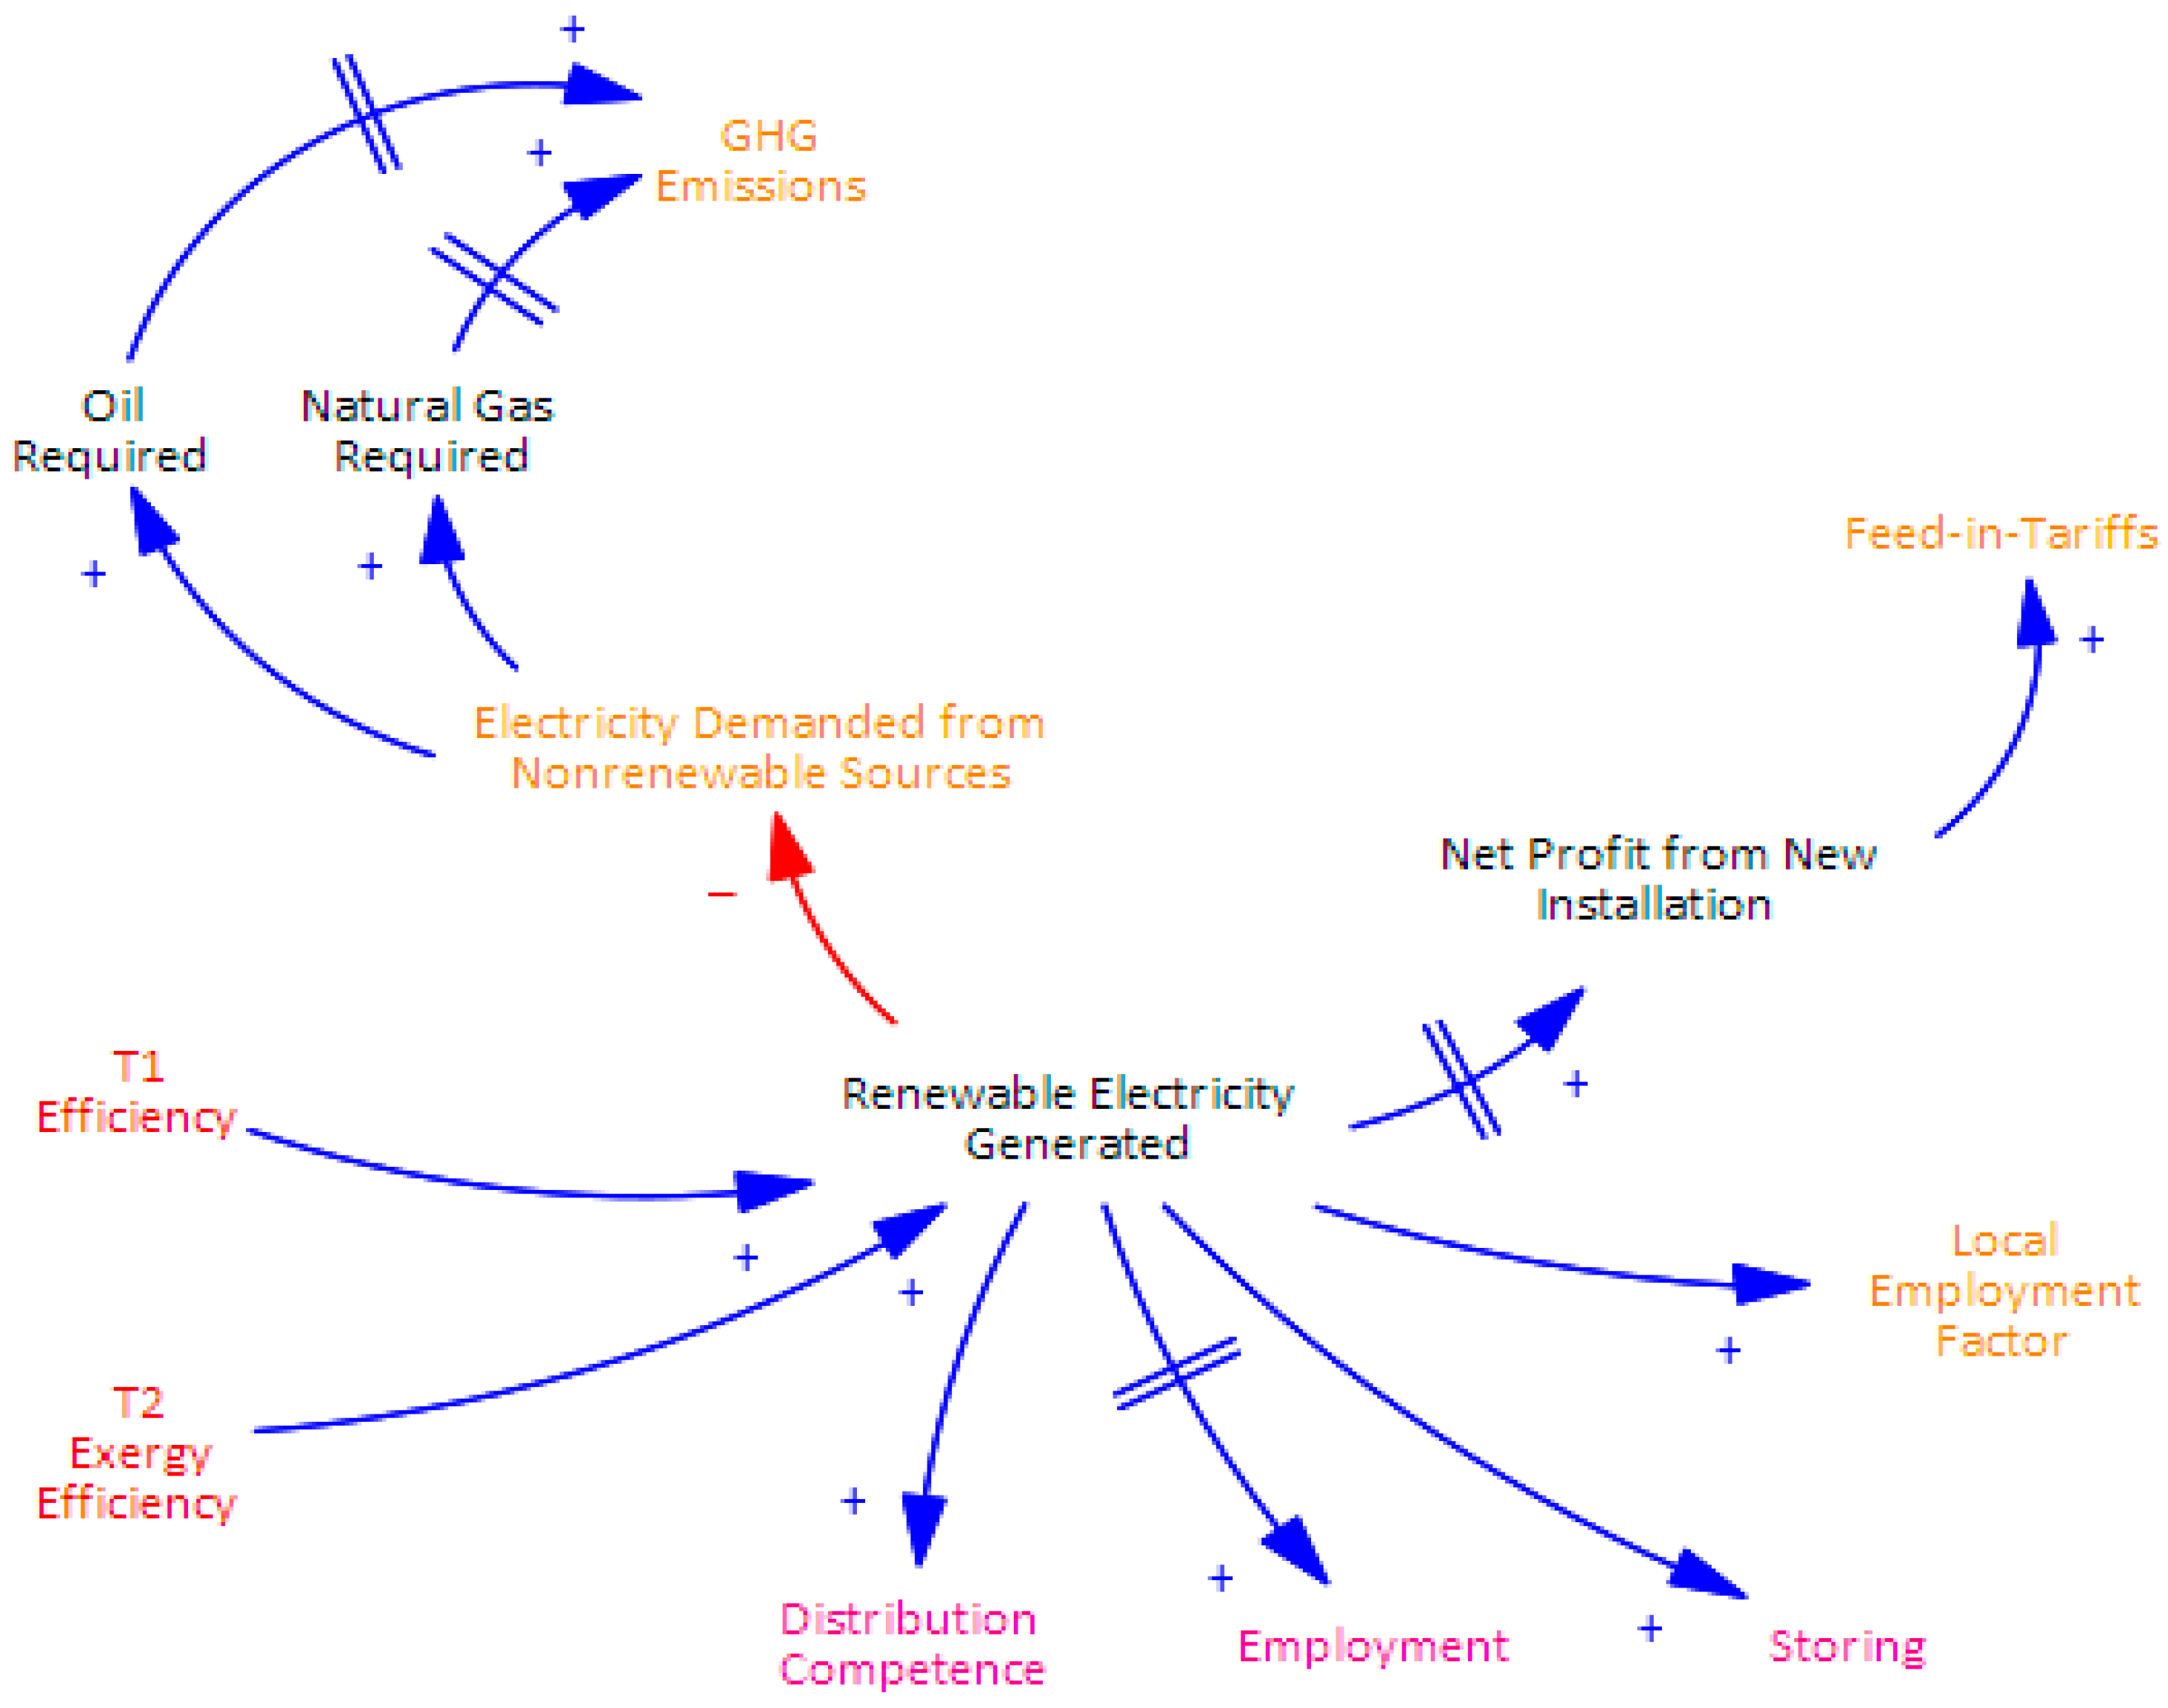
Taking into account the correlations shown in Table 3, the causality diagram was constructed accordingly. Regarding the first two technical indicators “T1—Efficiency” and “T2—Exergy Efficiency”, as illustrated in Figure 5, there exist indirect positive relationships between the Efficiency and Exergy Efficiency on one side and all distribution variables from the other, as well as indirect positive relationships with Feed-in-Tariffs and Local Employment Factor. However, Efficiency and Exergy Efficiency exhibit indirect negative relationships with GHG Emissions and Electricity Demanded from Non-renewable Sources.
It can be observed from Figure 5 that the Efficiency indicator functions as one of exogenous variables defining the system boundaries; also, no feedback loops are identified in the constructed causal diagram. In addition, several auxiliary variables serve as intermediates between the main variables. The first auxiliary variable is Renewable Electricity Generated from renewables, since Efficiency cannot directly affect the distribution and demand variables without electricity production. Efficiency directly affects the production of electricity, which subsequently influences other variables. Other auxiliary variables, such as the Net Profit from New Installation, directly affect the Feed-in-Tariffs policy, while Oil and Natural Gas Required positively influences GHG Emissions.
In addition, there are causal connections among certain variables that include a delay mark, which represents that the cause does not produce an immediate effect on its corresponding variable. This is exemplified by the relation between the Oil and Natural Gas Required and the GHG Emissions. A second delay occurs between Renewable Electricity Generated and Net Profit from New Installation, while a third is identified between Renewable Electricity Generated and Employment.
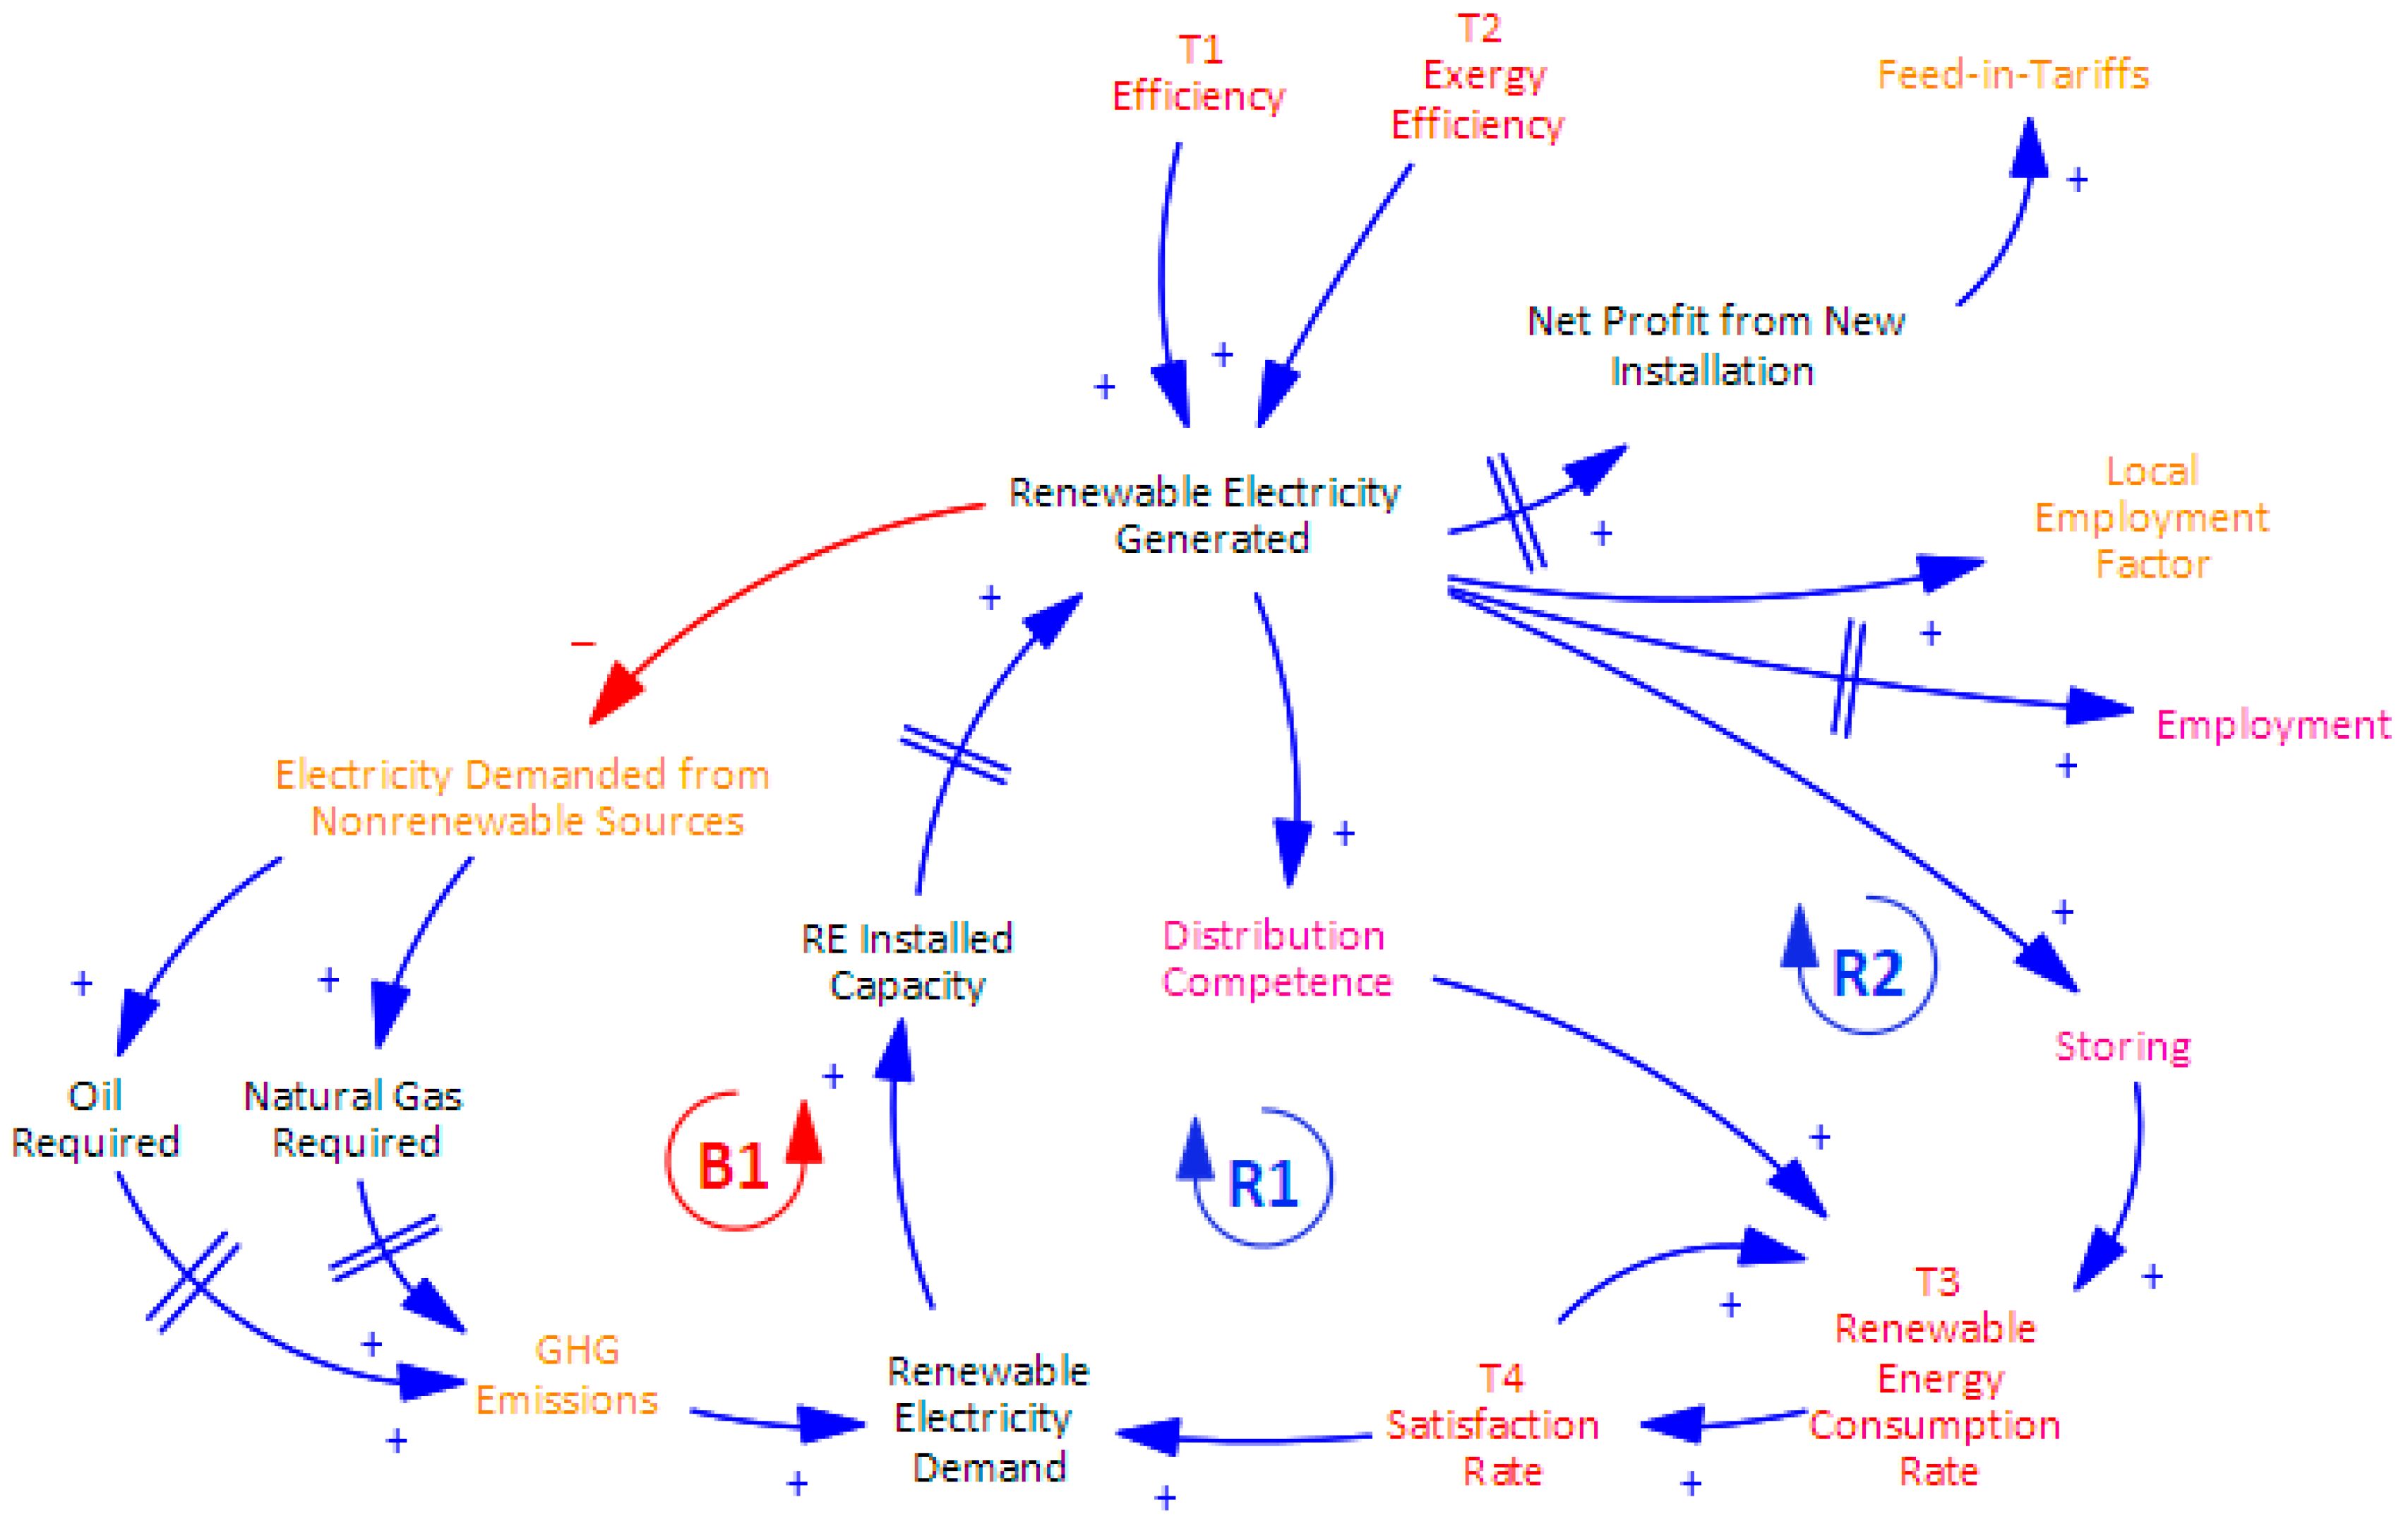
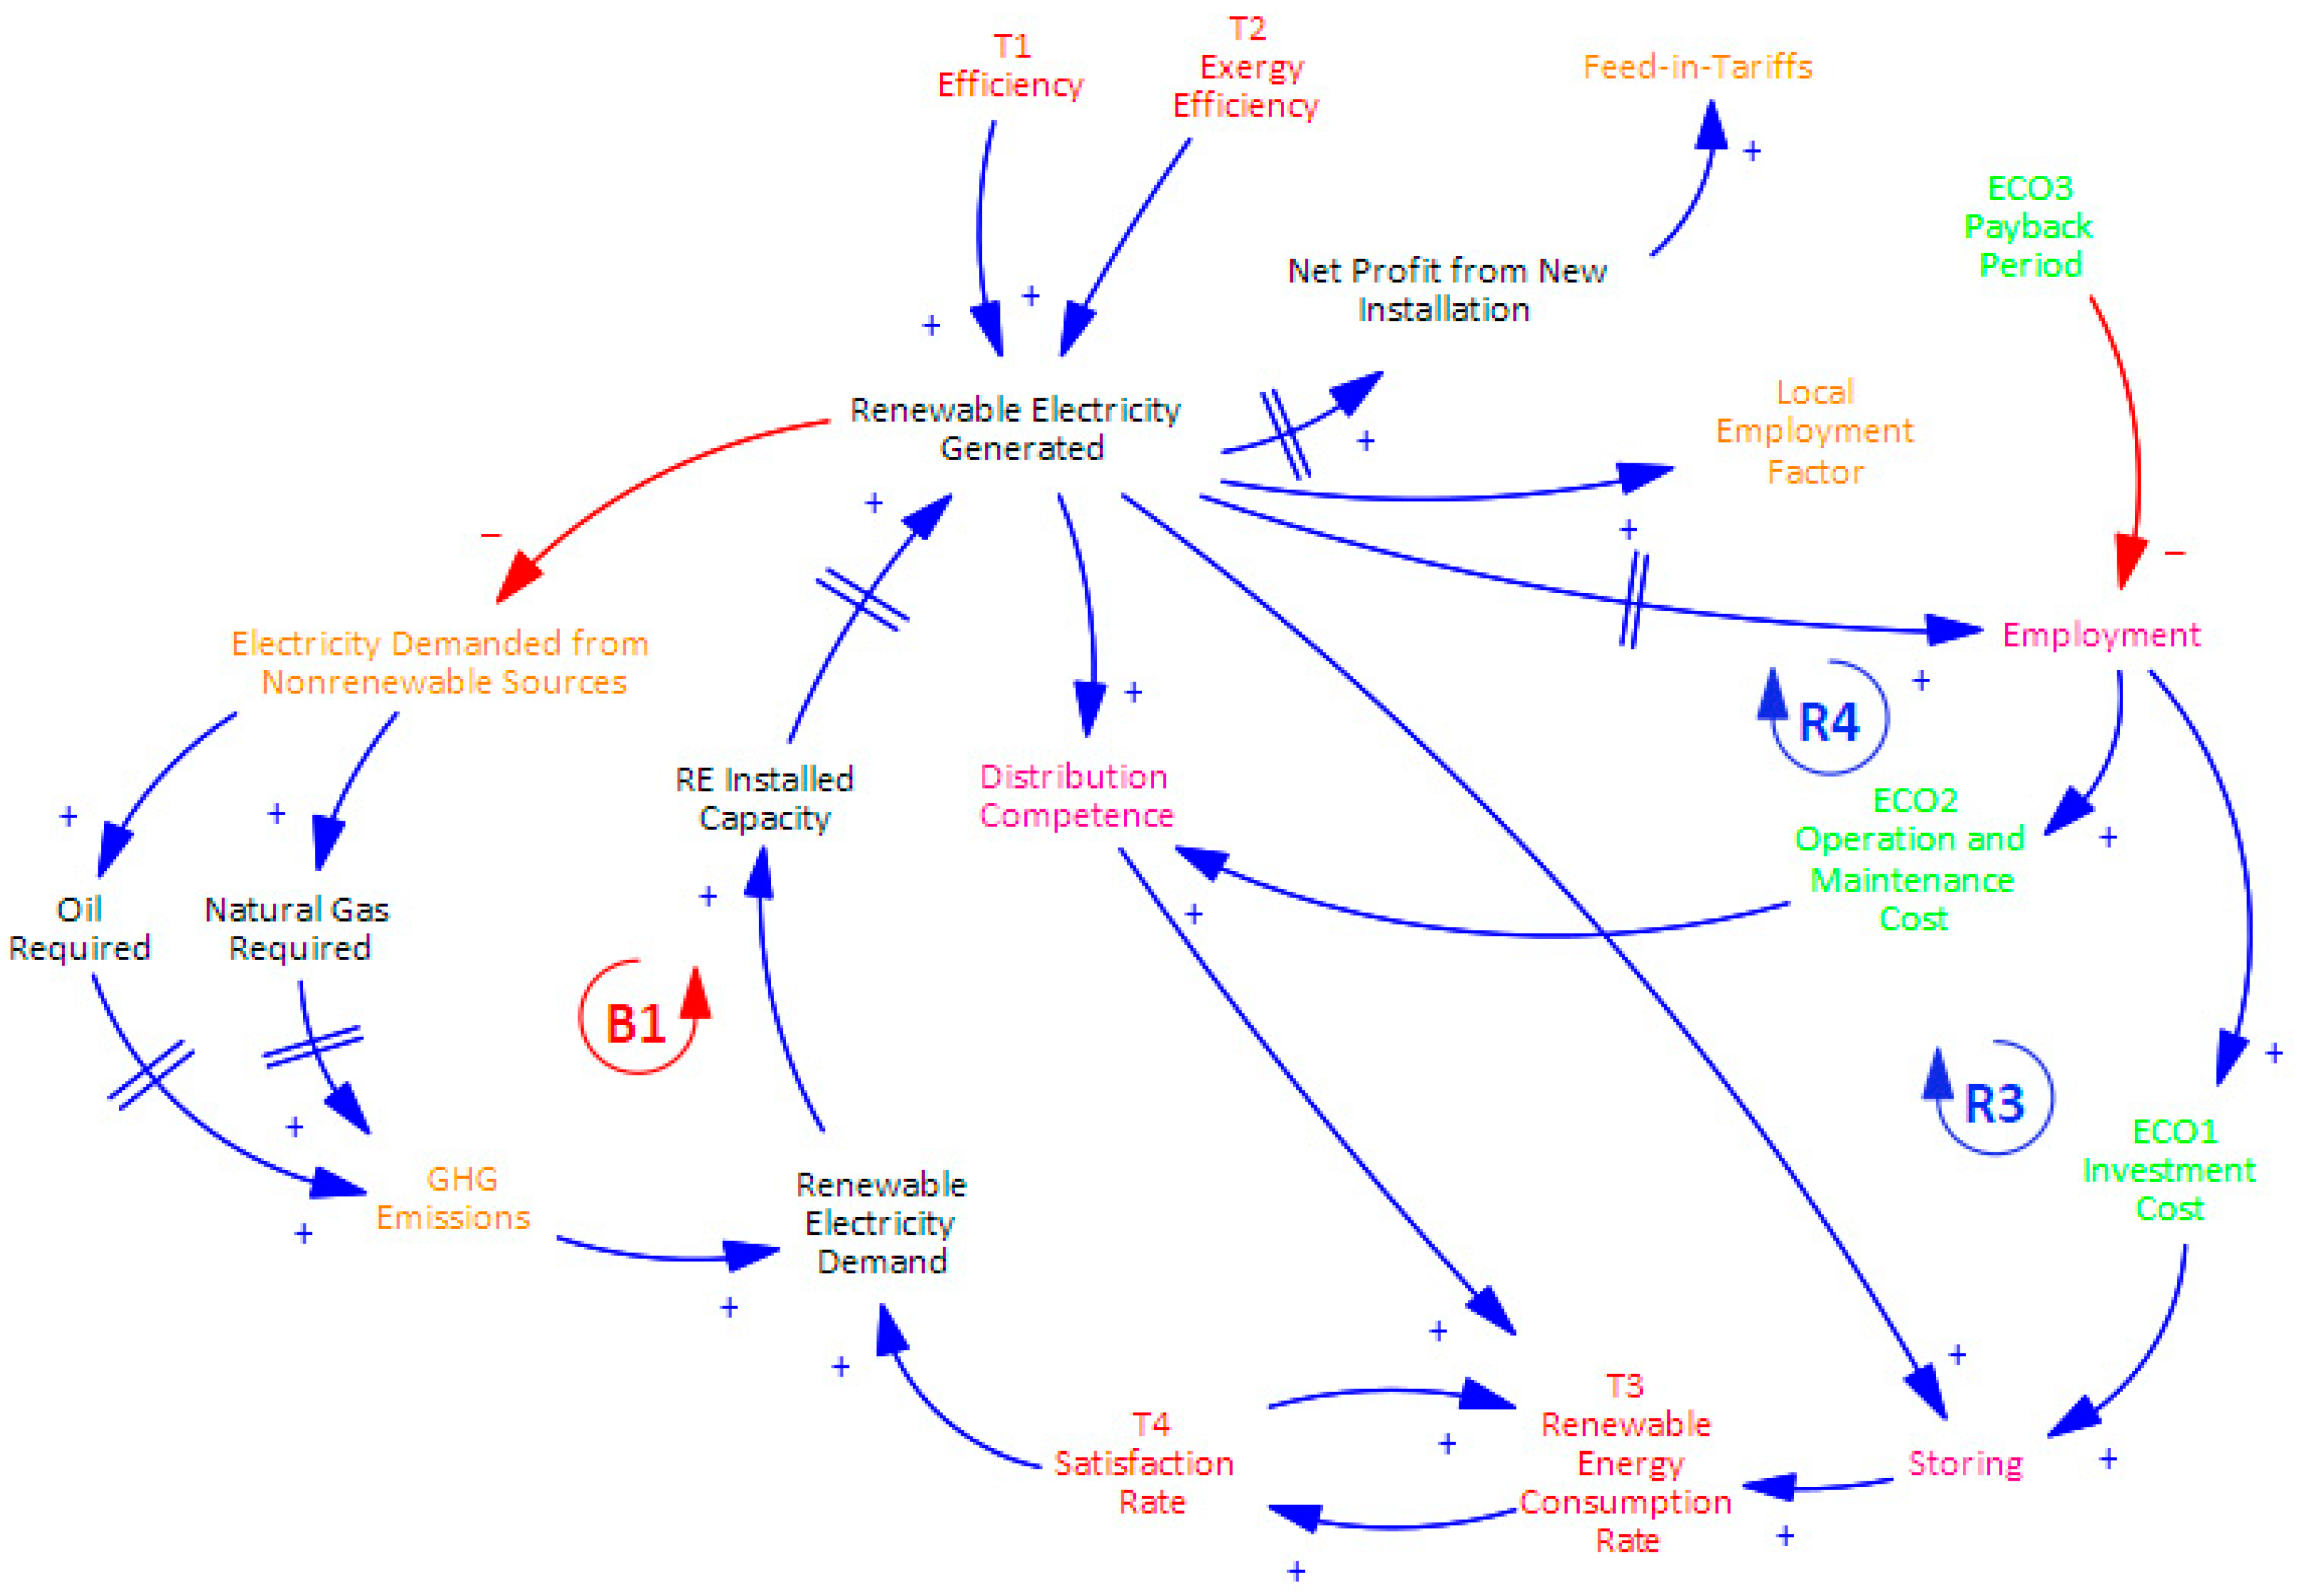
By completing the causality diagram, the remaining technical indicators “T3—Renewable Energy Consumption Rate” and “T4—Satisfaction Rate” were incorporated, both of which demonstrate a direct positive relationship with each other. Figure 6 illustrates the different relationships between the Renewable Energy Consumption Rate and Satisfaction Rate, revealing indirect positive relationships between these indicators and all distribution variables, namely Distribution Competence, Storing, and Employment. Additionally, there are indirect positive relationships with Feed-in-Tariffs and Local Employment Factor on the demand side. Conversely, indirect negative relationships exist with GHG Emissions and Electricity Demanded from Non-renewable Sources.
The RE Installed Capacity, with a delayed effect on Renewable Electricity Generated and Renewable Electricity Demanded, is represented as an endogenous auxiliary variable. These auxiliary variables serve as common factors that reflect the types of feedback loops between the primary variables. The direct relationships between the Distribution Competence and Storing variables from one side and the Renewable Energy Consumption Rate and Satisfaction Rate on the other form two reinforcing feedback loops (R1 and R2). Loop R1 includes the Renewable Energy Consumption Rate, Satisfaction Rate, Renewable Electricity Demanded, RE Installed Capacity, Renewable Electricity Generated, and Distribution Competence, going back to Renewable Energy Consumption Rate again. Loop R2 follows a similar pattern, beginning with Renewable Energy Consumption Rate, Satisfaction Rate, Renewable Electricity Demanded, RE Installed Capacity, Renewable Electricity Generated, Storing, before returning to Renewable Energy Consumption Rate.
However, there is a balancing feedback loop (B1) that connects the same auxiliary variables with Electricity Demanded from Non-renewable Sources and GHG Emissions variables. This loop includes Electricity Demanded from Non-renewable Sources, Oil and/or Natural Gas Required, GHG Emissions, Renewable Electricity Demanded, RE Installed Capacity, and Renewable Electricity Generated to Electricity Demanded from Non-renewable Sources again. It creates a de-escalation dynamic between the reinforcing feedback loops R1 and R2 and the balancing loop B1, thereby confirming the negative relation between the Renewable Energy Consumption Rate and Satisfaction Rate on one side and Electricity Demanded from Non-renewable Sources and GHG Emissions variables on the other.
By completing the causality diagram through the incorporation of the three economic indicators “ECO1—Investment Cost”, “ECO2—Operation and Maintenance Cost”, and “ECO3—Payback Period”, as portrayed in Figure 7, several direct relationships have been identified. Specifically, there is a direct positive relation between Investment Cost and Storing, a direct positive relation between Operation and Maintenance Cost and Distribution Competence, and a direct negative relation between the Payback Period and Employment. In addition, indirect negative relationships have been identified between the Payback Period with Feed-in-Tariffs and the Local Employment Factor. Conversely, the Payback Period exhibits indirect positive relationships with GHG Emissions and Electricity Demanded from Non-renewable Sources.
On the other hand, it was found that, without the introduction of any new auxiliary variables, two reinforcing feedback loops (R3 and R4) were delineated between Investment Cost and Operation and Maintenance Cost on one side and all distribution variables on the other. Loop R3 encompasses the Investment Cost, Storing, Renewable Energy Consumption Rate, Satisfaction Rate, Renewable Electricity Demanded, RE Installed Capacity, Renewable Electricity Generated, and Employment, on the way to Investment Cost again. Similarly, loop R4 initiates from Operation and Maintenance Cost and follows the path to Distribution Competence, Renewable Energy Consumption Rate, Satisfaction Rate, Renewable Electricity Demanded, RE Installed Capacity, Renewable Electricity Generated, and Employment and back to Operation and Maintenance Cost again.
Notwithstanding, the same balancing feedback loop (B1) connects the Investment Cost and Operation and Maintenance Cost with Electricity Demanded from Non-renewable Sources and GHG Emissions variables. This loop generates a de-escalation between the reinforcing feedback loops and the balancing one that proves the negative relation between Investment Cost and Operation and Maintenance Cost from one side and Electricity Demanded from Non-renewable Sources and GHG Emissions variables from the other side. However, the Investment Cost and Operation and Maintenance Cost have an indirect positive relation with Feed-in-Tariffs and the Local Employment Factor.
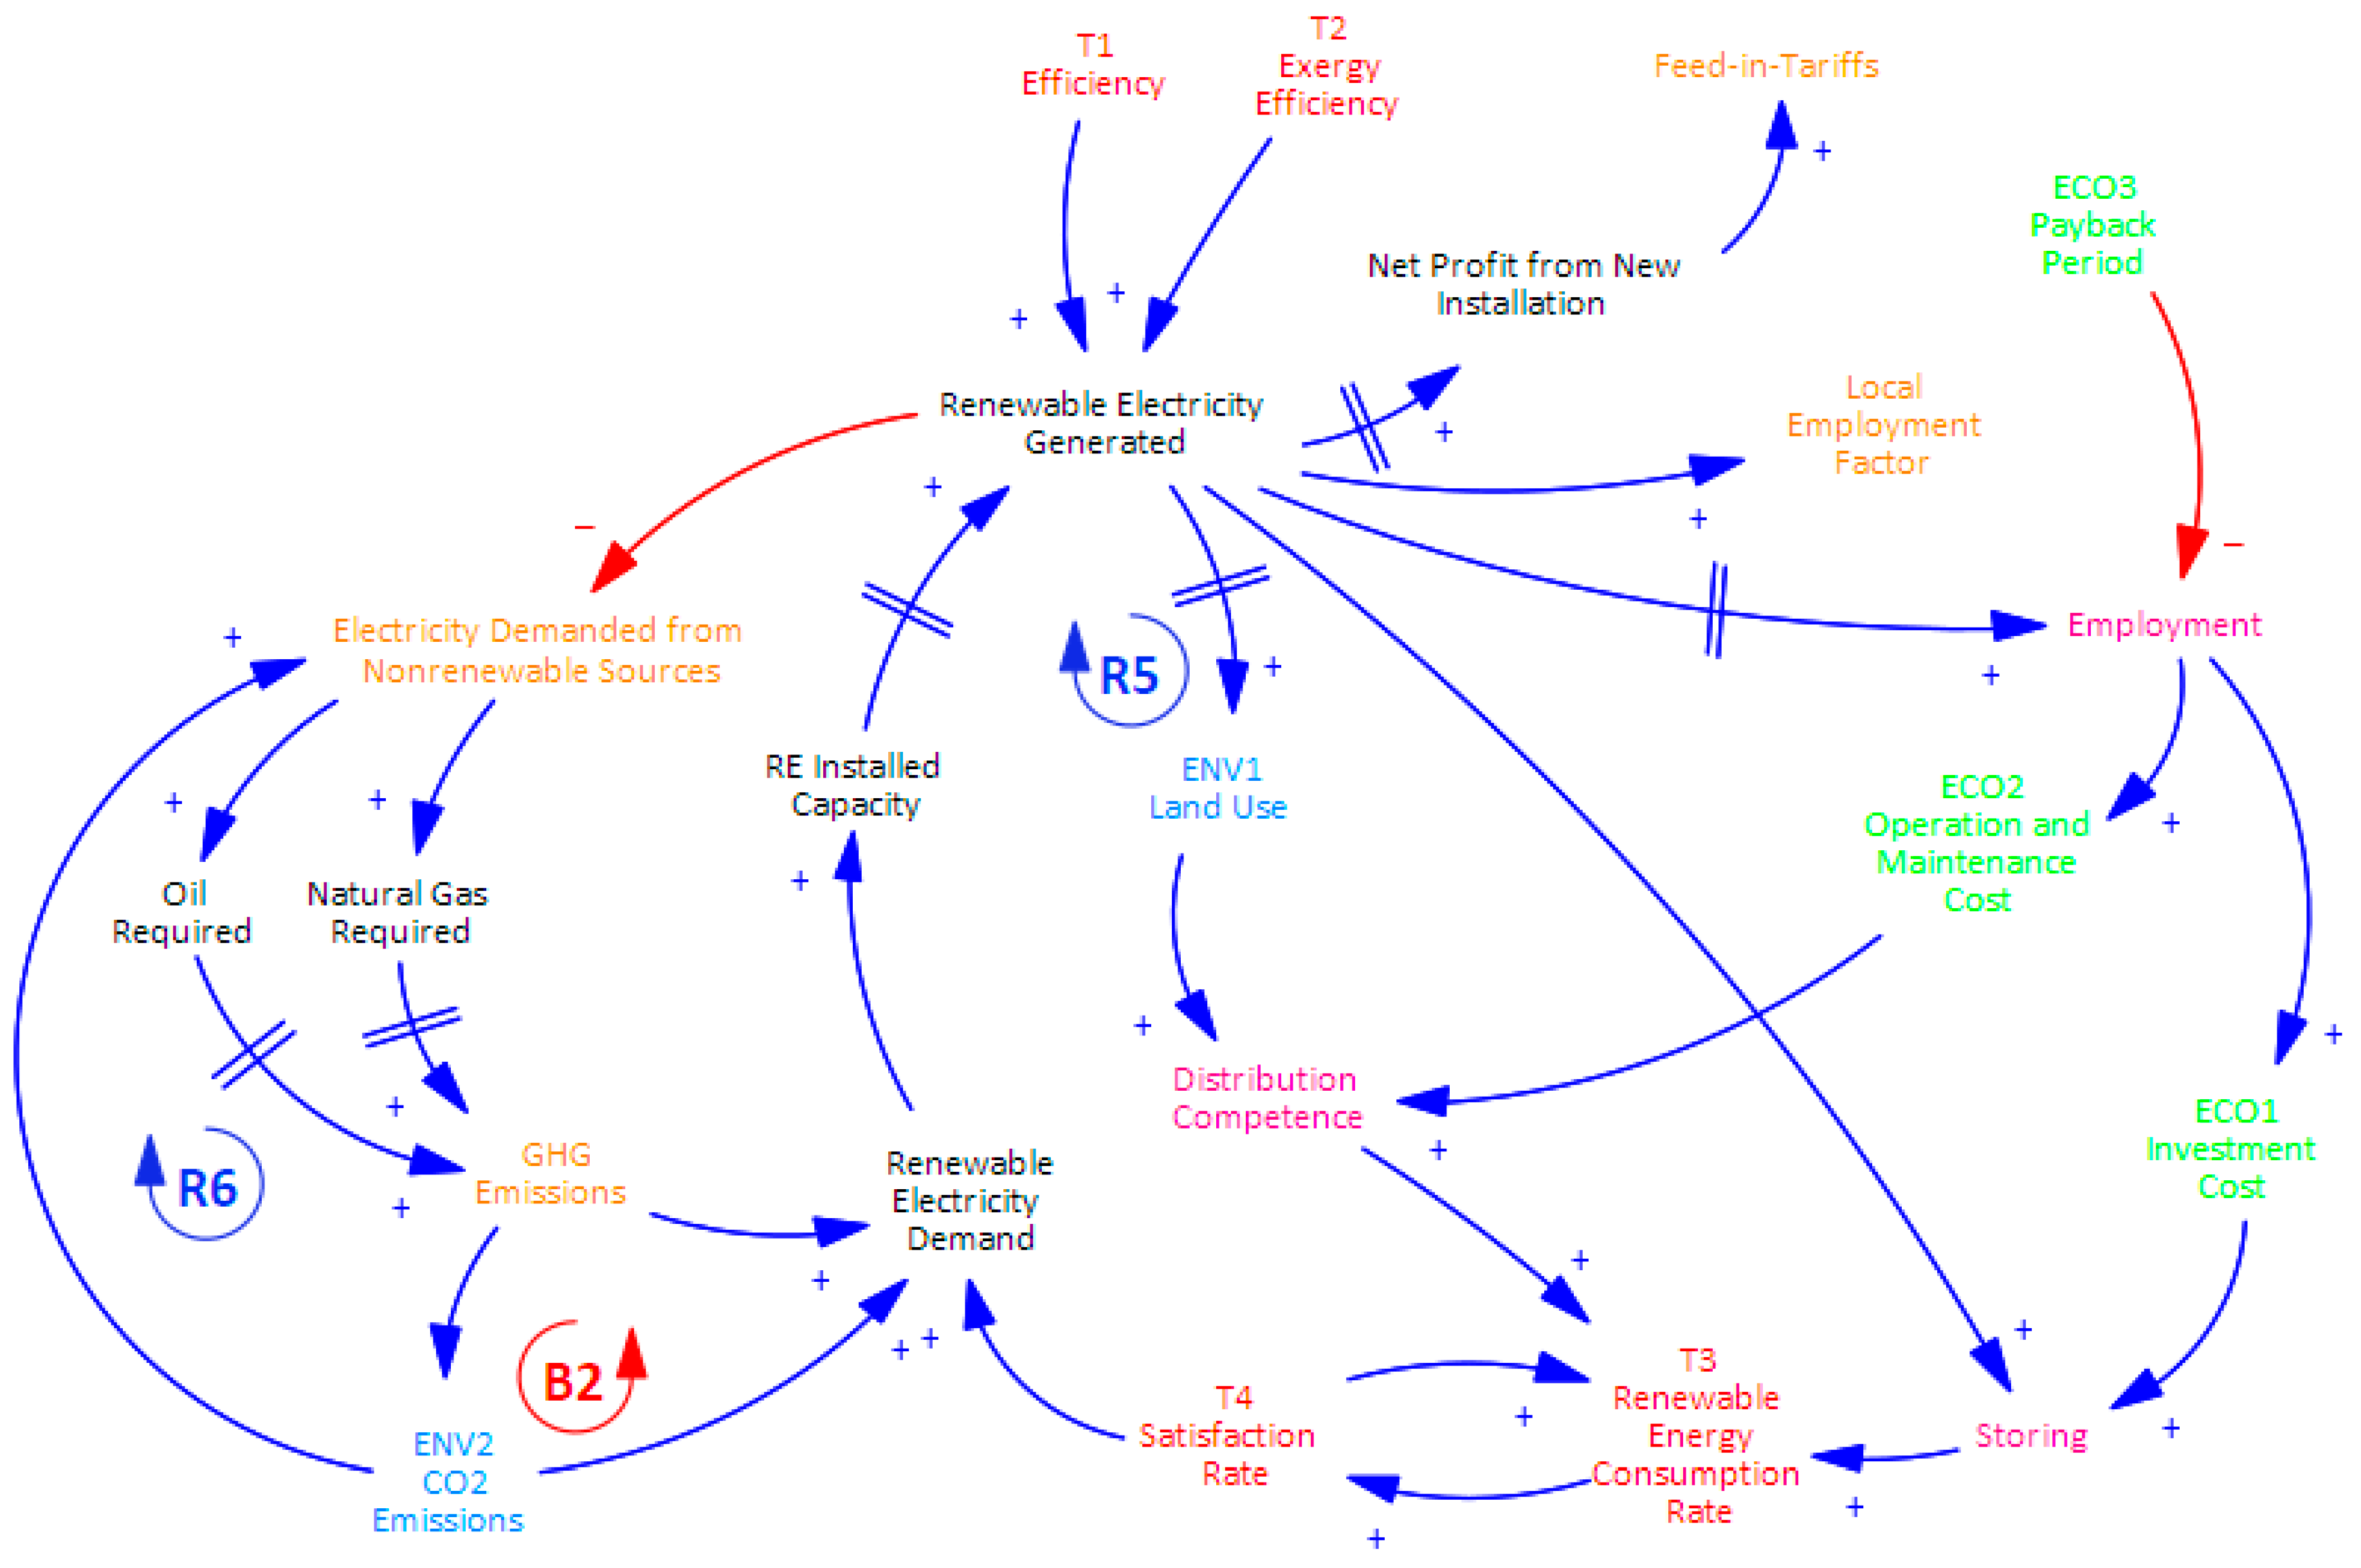
Upon integrating the environmental indicators “ENV1—Land Use” and “ENV2—CO2 Emissions”, the Renewable Electricity Generated exhibits a delayed effect on the Land Use, and the diagram is updated as shown in Figure 8. The Land Use indicator demonstrates a direct positive relation with Distribution Competence, forming a reinforcing feedback loop (R5). This loop consists of Land Use, Distribution Competence, Renewable Energy Consumption Rate, Satisfaction Rate, Renewable Electricity Demanded, RE Installed Capacity, and Renewable Electricity Generated and ends up at Land Use again. Moreover, the Land Use indicator shows indirect positive relationships with the rest of the distribution variables, namely Employment and Storing.
Dependably, the CO2 Emissions indicator exhibits a direct positive relation with Electricity Demanded from Non-renewable Sources and an indirect positive relation with GHG Emissions, creating a reinforcing feedback loop (R6). Meanwhile, when incorporating the Renewable Electricity Demand, a balancing feedback loop (B2) has emerged to accommodate the CO2 Emissions, Renewable Electricity Demanded, RE Installed Capacity, Renewable Electricity Generated, Electricity Demanded from Non-renewable Sources, Oil and/or Natural Gas Required, and GHG Emissions, then back to CO2 Emissions again. This structure indirectly reflects the negative relation between the CO2 Emissions indicator and all SC downstream distribution variables by de-escalation that occurs when reinforcing and balancing feedback loops interact. Likewise, this de-escalation also creates an indirect negative relation between Land Use and both GHG emissions and Electricity Demanded from Non-renewable Sources.
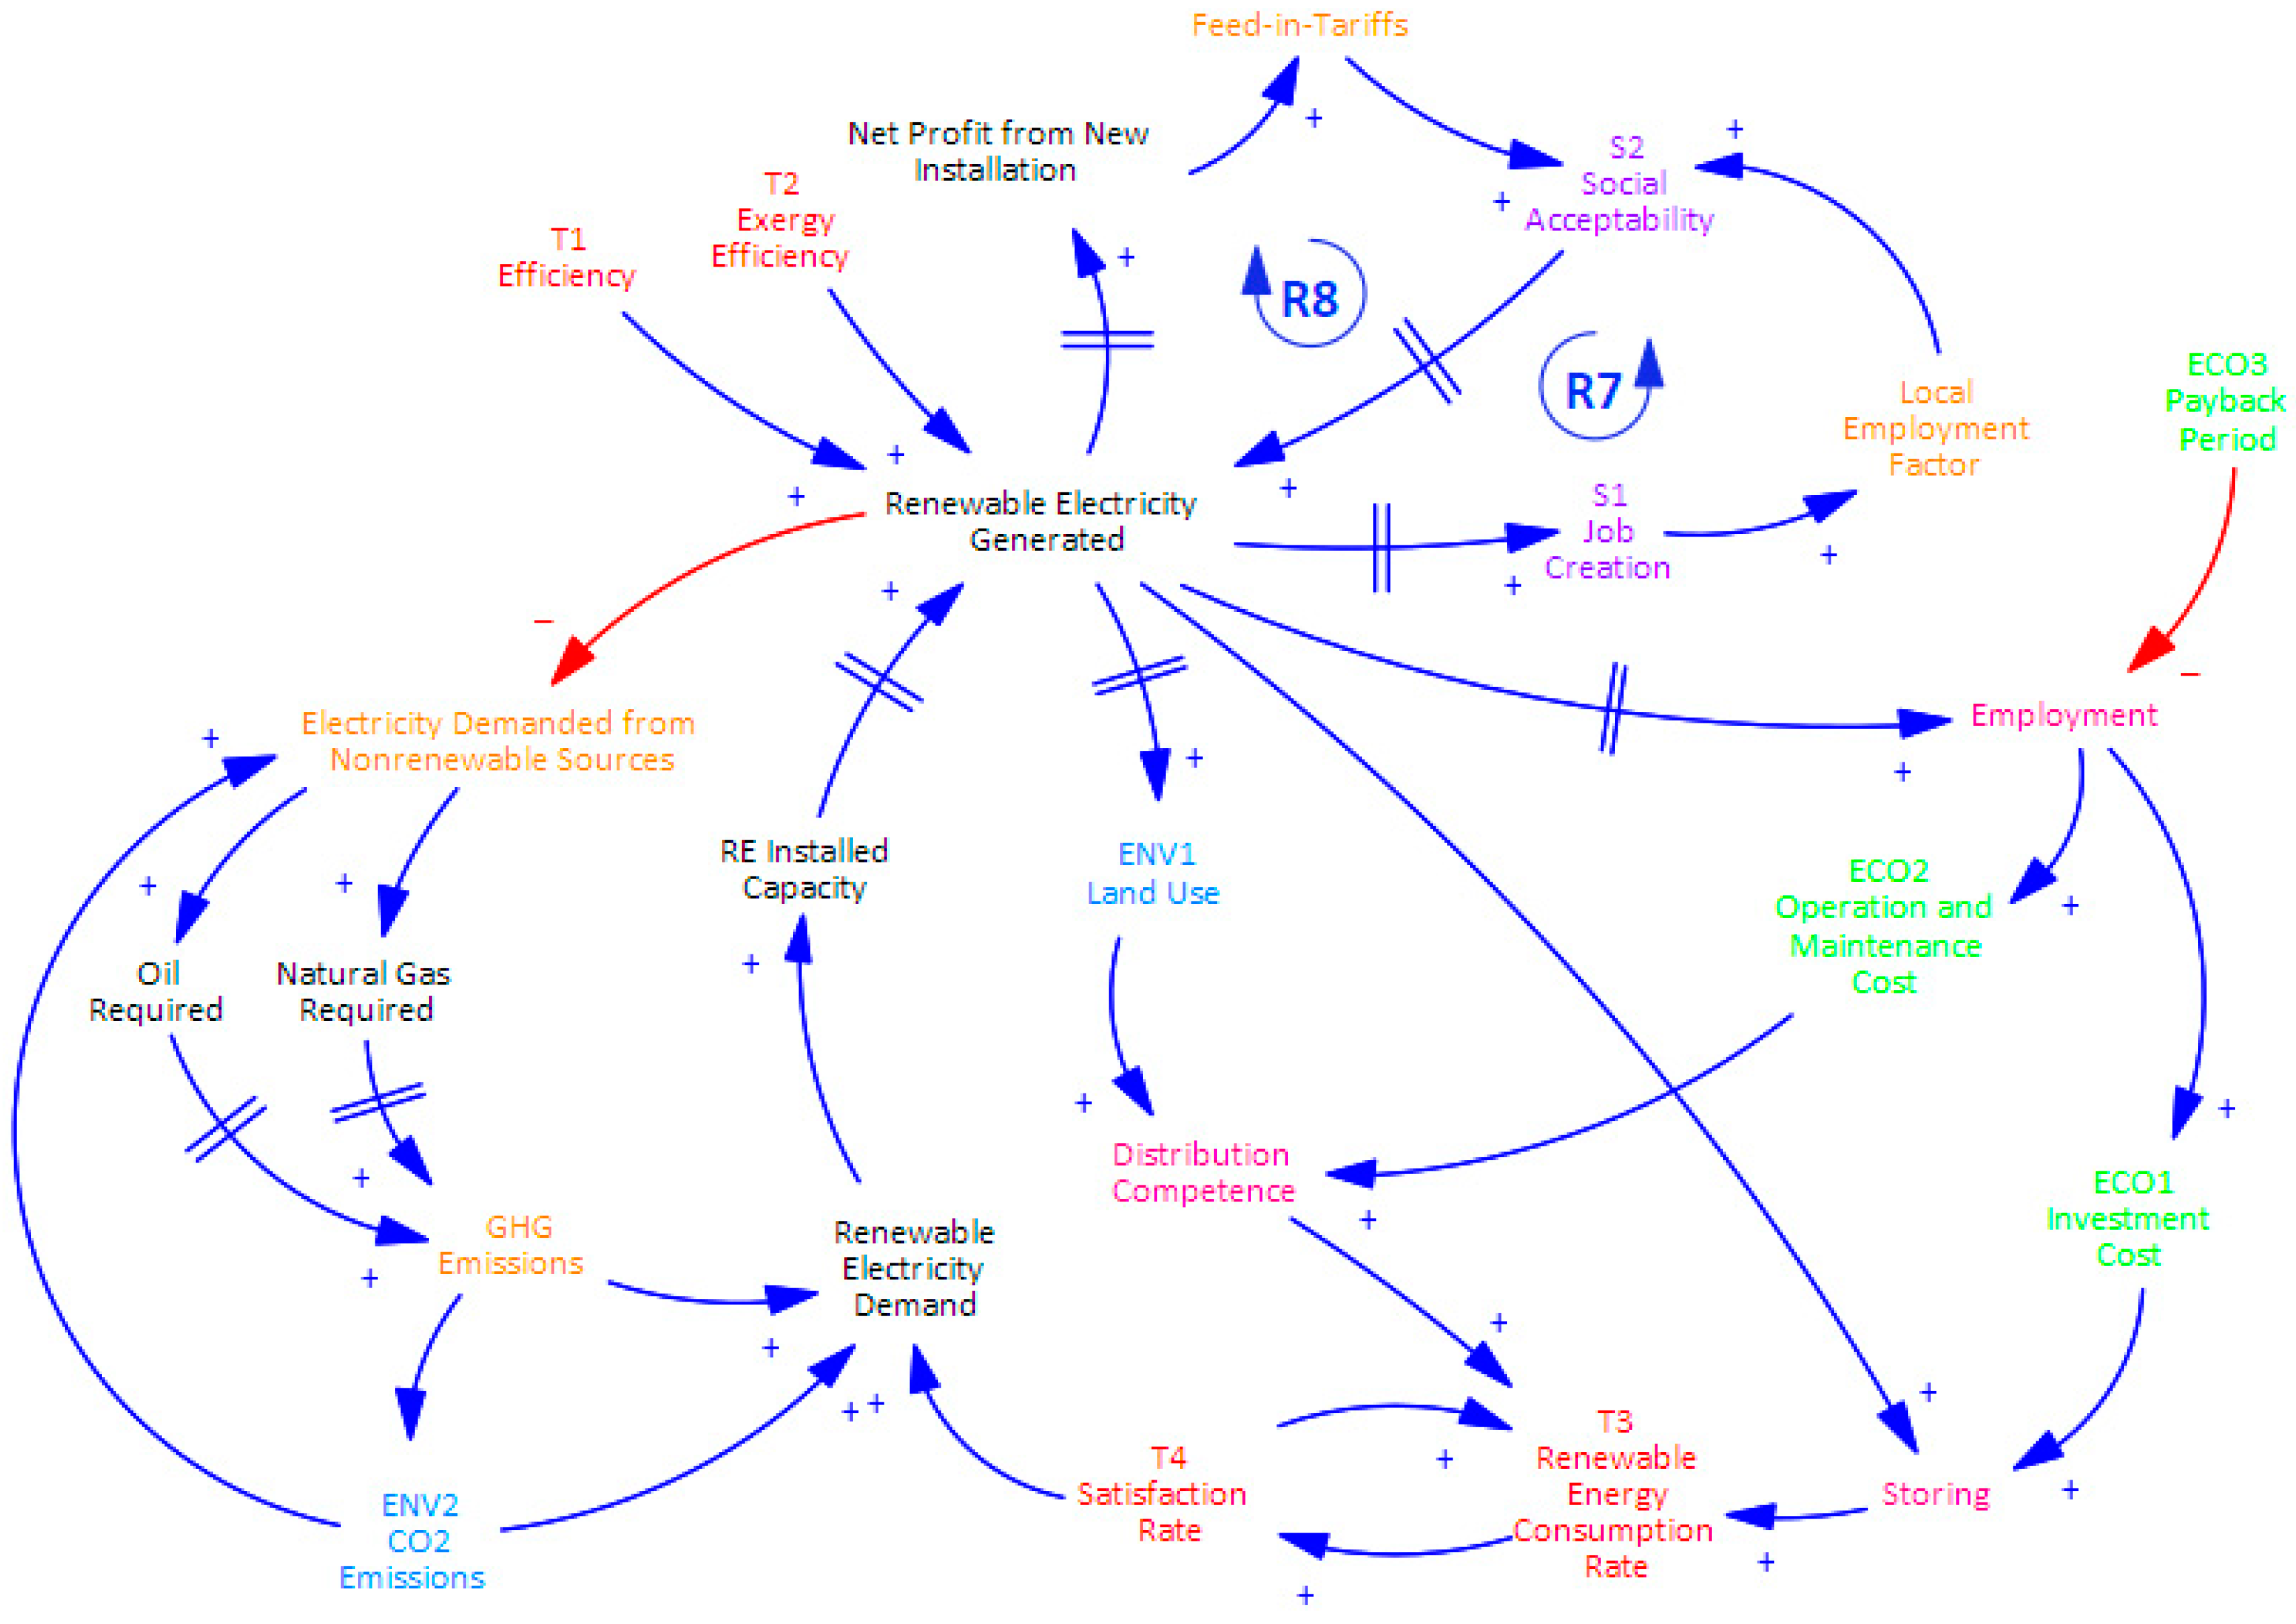
Finally, as shown in Figure 9, the social indicators “S1—Job Creation” and “S2—Social Acceptability” establish connections with all variables through multiple feedback loops. The reinforcing loops (R7 and R8) reflect the direct relation between both indicators and the Local Employment Factor and Feed-in-Tariffs, highlighting the escalation performance between these loops. Furthermore, this escalation extends to other loops developed for SC downstream distribution variables, namely R1, R2, R3, R4, and R5, thereby demonstrating the indirect positive relationships between social indicators and Distribution Competence, Employment, and Storing variables.
Likewise, a de-escalation is observed between social indicators through R6 and R7 on one side and the balancing loop B1 on the other, showing the indirect negative relationships between both indicators and Electricity Demanded from Nonrenewable Sources and GHG Emissions variables. Also, R7 and R8 exhibit a similar de-escalating connection with the balancing loop B2, which reflects the indirect negative relation between the CO2 Emissions indicator, the Local Employment Factor, and the Feed-in-Tariffs.
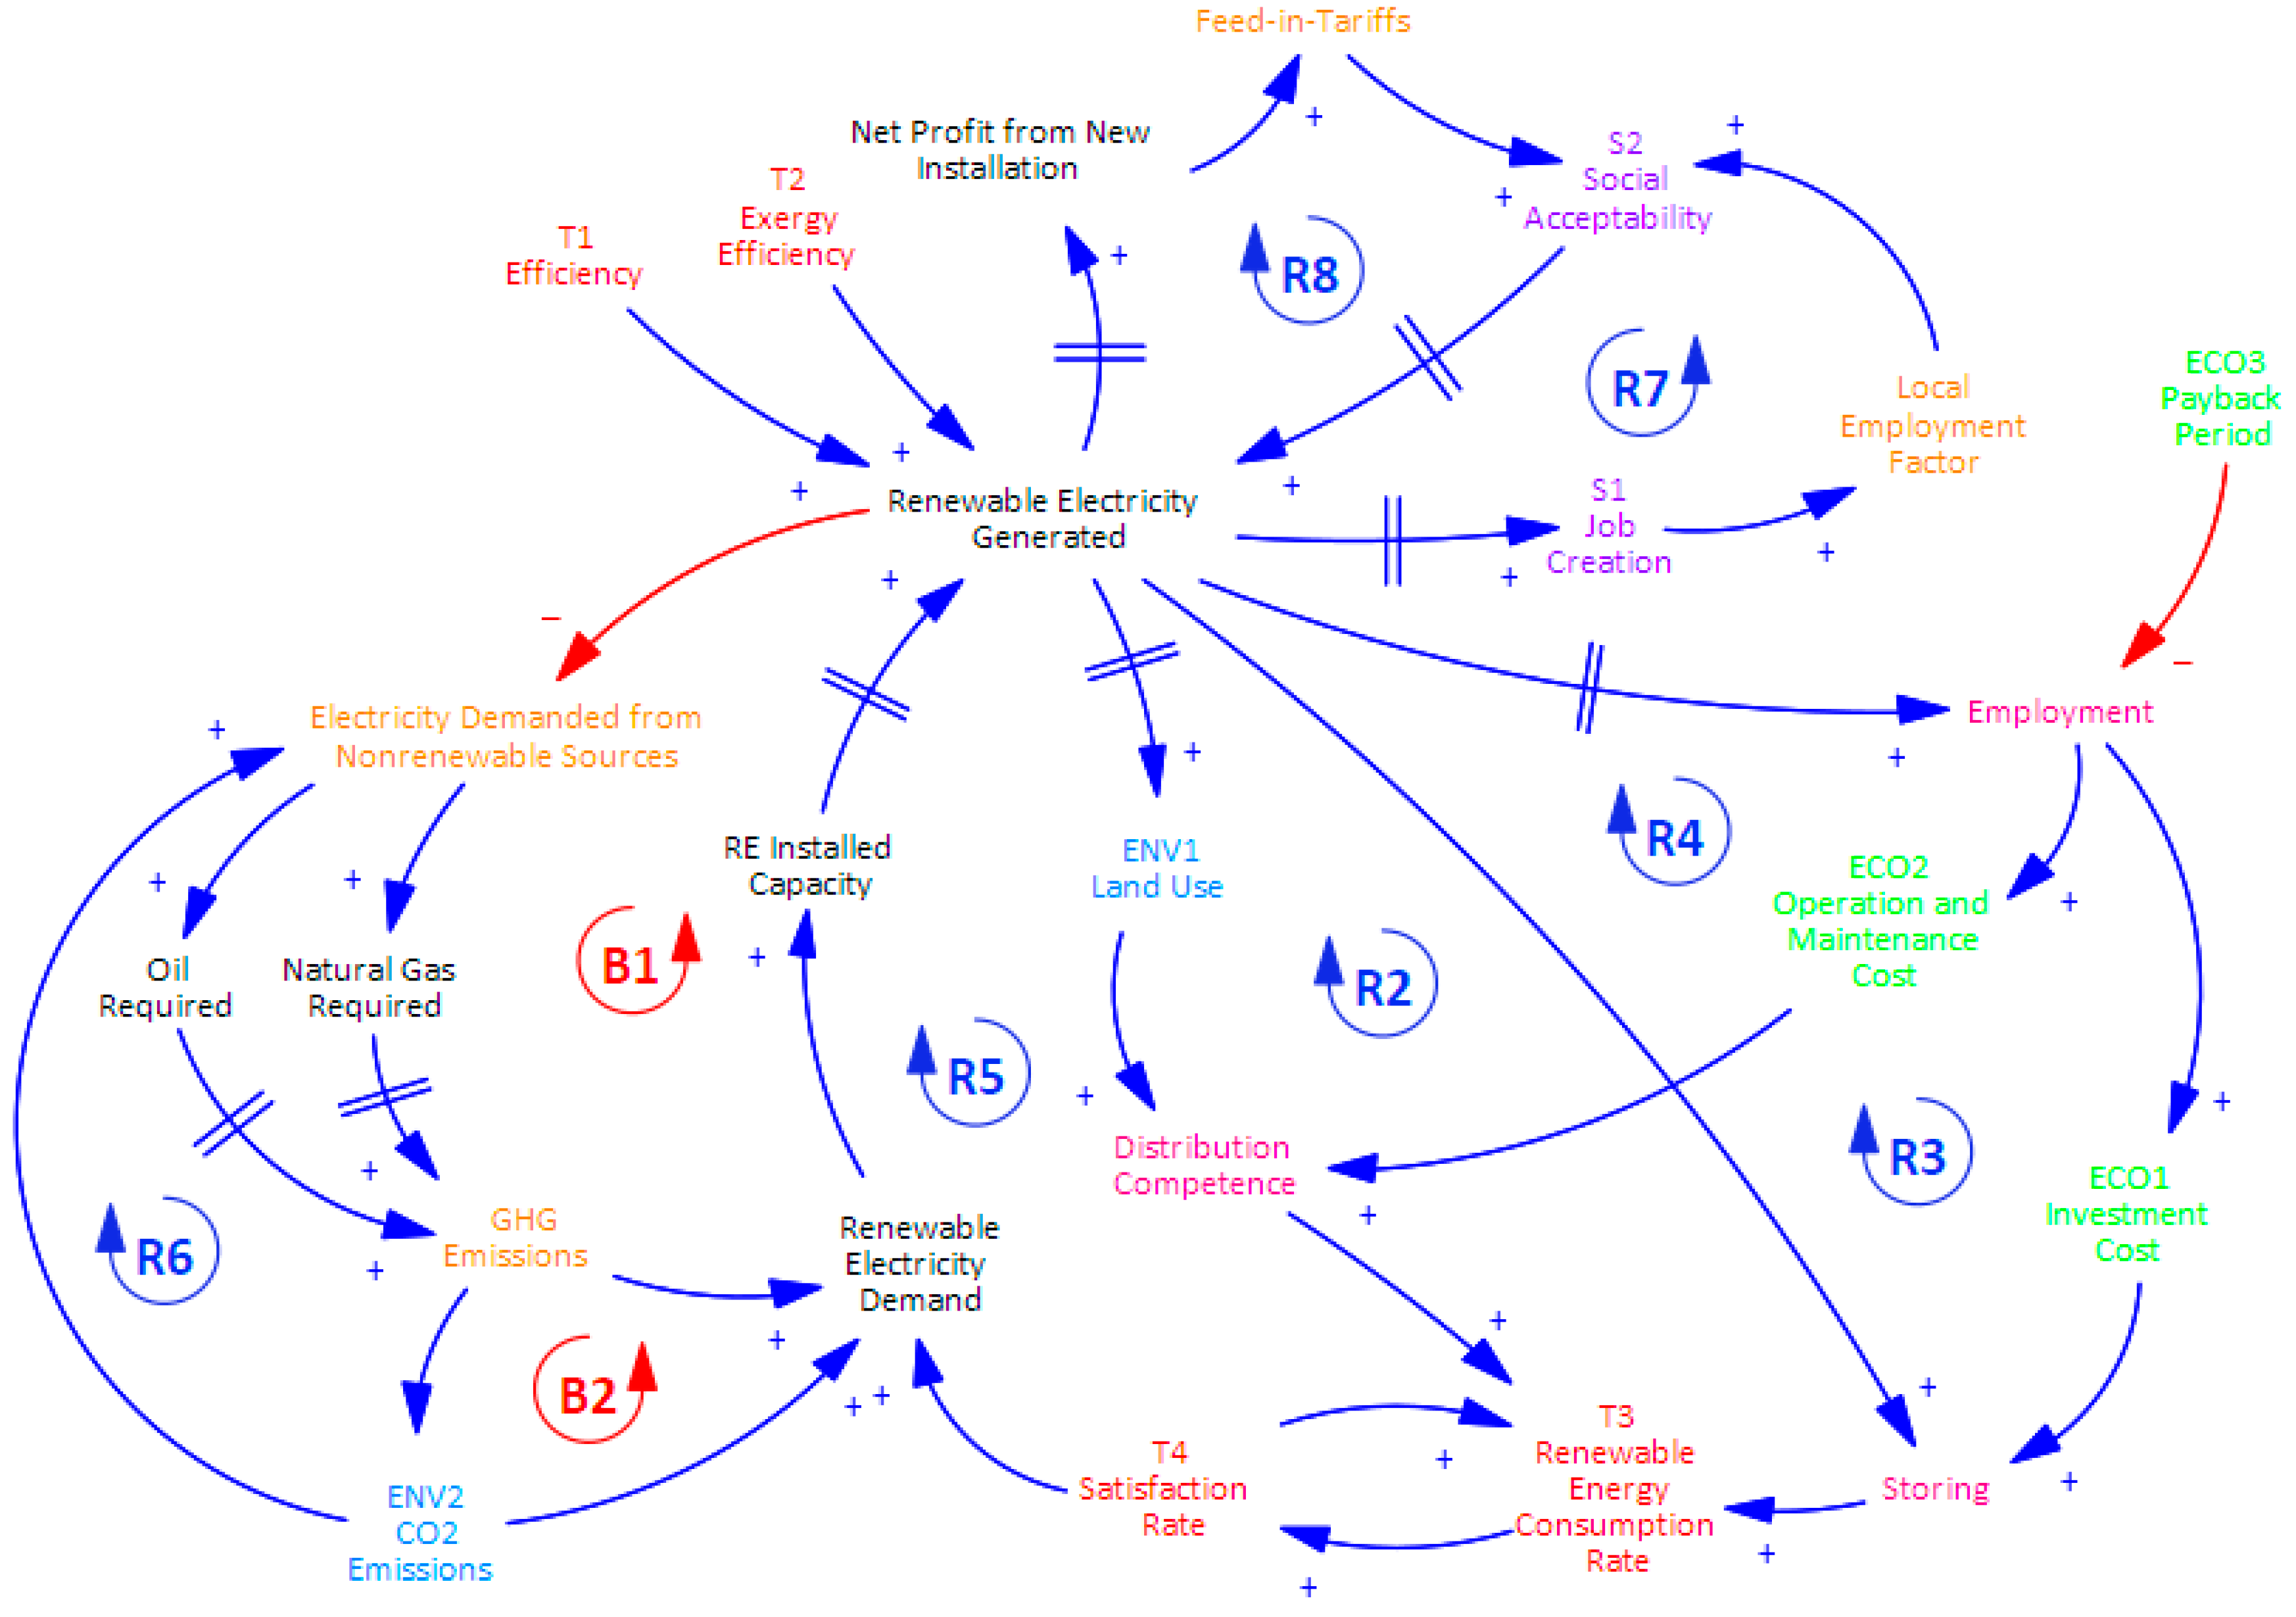
To sum up, the causality diagram developed in this study illustrates a set of interlinked feedback loops. The reinforcing loops are depicted by R2, R3, R4, R5, R6, R7, and R8. It is noteworthy that R1 has been updated and reclassified as R5, as both represent the same loop following the inclusion of the Land Use indicator during the model’s development process. Conversely, two balancing loops, B1 and B2, represent the opposing change within the system. Figure 10 illustrates the complete CLD, which integrates the main directions of relationships between the different variables of SC downstream activities and the RE supply system indicators. This integrated visualization facilitates a comprehensive understanding of the dynamic interactions and interdependencies within the overall system.
Additionally, a strong consistency was observed between all the relationships revealed from the correlation matrix and those illustrated in the causality diagram. Hence, the use of conceptual causal loop diagrams to map these relationships has revealed the dynamic and interdependent nature of the RESC. By identifying key feedback mechanisms, policymakers and stakeholders are better equipped to comprehend how changes in one dimension can influence supply chain outcomes across other dimensions. This systems-based approach is particularly relevant for Egypt, where the RE sector is still evolving, and the interactions between dimensions hold significant implications for long-term energy security.

6. Managerial and Procedural Implications

6.1. Managerial Implications

Considering the reasonable allocation of RE growth over a designated time, there is an urgent need to enhance reliance on RE for electricity generation. This situation compels decisionmakers with a required consideration of the trade-off between the immediate adoption of RE technologies and the long-term integration of such resources. Additionally, the development of comprehensive financial strategies that accommodate potential initial losses is crucial for RE initiatives, especially when it comes to funding these projects. To minimize overall costs, the focus should be placed on improving operational efficiency through integrating state-of-the-art technologies, streamlining the supply chain, and the optimization of production efficiencies to increase profitability.
In addition, decisionmakers must prepare for variability in financial returns, as the fluctuating payback period indicates unreliable performance. This denotes the need for heightened risk control to effectively mitigate instability and ensure a sustained economic safety net. Moreover, there is a need for quick contouring to embrace operational and fiscal strategies that will respond to transforming situations. This involves the stocking of liquidity reserves to offset the seemingly continuous return periods or diversifying revenue streams through multichannel income acquisition strategies.
On the other hand, the findings of this study present actionable guidance for policymakers, energy sector managers, and supply chain planners aiming to boost the downstream renewable electricity supply chain in Egypt. Focusing on the managerial implications, the key points can be summarized as follows:
  • The survey and questionnaire results underline the value of joining diverse stakeholder views, particularly engineers, policymakers, and logistics specialists, into distribution planning to enhance adoption rates and strengthen policy legitimacy.
  • The causal loop modeling developed in this study provides a valuable framework for evaluating future scenarios through the construction of stock and flow models before implementation, thereby reducing investment risks and improving strategic alignment with national energy goals.
  • Managers should adopt a system dynamics modeling when planning energy distribution, considering the interdependence between technical, economic, environmental, and social dimensions, which ensures balanced trade-offs between efficiency, sustainability, and social acceptance.

6.2. Policy and Procedural Implications

The Egyptian government can effectively formulate strategies to reduce its carbon footprint, optimize resource utilization, and transition towards more sustainable energy alternatives through the continuous monitoring and assessment of the metrics employed in this study. This integrated approach not only fosters long-term sustainability and corporate accountability but also reinforces compliance with environmental regulations. Ultimately, linking these metrics to the key performance indicators (KPIs) of all energy production initiatives can stimulate innovation in green technologies, strengthen accountability, and demonstrate commitment to combating climate change. Accordingly, the policy and procedural implications of this study can be summarized as follows:
  • Energy planning procedures, especially the renewables, should integrate technical efficiency, economic viability, environmental impact, and social context as core evaluation criteria, ensuring that renewable energy distribution strategies address all key dimensions identified in this study.
  • Institutions should combine causal loops and stock and flow modeling, as demonstrated in this study, into the policy design process to capture feedback loops, delays, and non-linear relationships in the renewable electricity supply chain.
  • Planning procedures should track critical downstream supply chain metrics, such as distribution efficiency, demand satisfaction, and public acceptance, which were identified in the model as significant determinants of system performance.

7. Conclusions and Future Scopes

This paper investigates the intricate dynamics of managing energy supply systems, with particular emphasis on the production of electricity within the Egyptian energy sector. It explores the interrelations among technical, social, economic, and environmental dimensions through downstream SC factors. Such an analysis has not been previously undertaken, neither for downstream practices nor for other phases of the RESC, and neither in the Egyptian context nor in other contexts. By employing conceptual causal loop diagrams, this paper delineates the correlations between the determined dimensions and downstream SC variables, emphasizing the determinants that affect the efficacy of RE systems. The outcomes provide valuable perspectives into how these interdependent dimensions influence energy security, cost-effectiveness, and sustainability, thereby enhancing the comprehension of the RESC in developing countries.
The current study presents a conceptual CLD that serves as a foundational step toward developing a comprehensive system dynamics model through stock-and-flow modeling. Hence, the authors utilize the results obtained to validate the interrelationships identified in this stage. Additionally, a structural rationality test was conducted as one of the means of validating the model’s framework. This test is specifically designed to ascertain whether there are any mechanical or dimensional inconsistencies present within the model’s framework. The outcome of this test confirms that the model is structurally reliable and free from critical faults. Consequently, different scenarios have been analyzed in alignment with the Egyptian energy strategy of 2035, providing a pathway for deeper exploration. The authors intend to extend this work and publish subsequent findings in future research.
Future research connected to this area may expand on this work by investigating the CLD of other SC variables, particularly the upstream SC, to create a comprehensive conceptual model. Further scopes might also employ optimization methods and techniques for RESC, such as machine learning and artificial intelligence, to improve the efficiency of downstream operations in RE systems. Also, comparative analyses across developing countries are recommended to observe whether the identified dimensions and variables identified in this study hold true in other contexts facing similar energy challenges. Specifically, future efforts should focus on developing integrated frameworks that consider these dimensions holistically to ensure that RE systems can meet Egypt’s growing energy demand while promoting sustainability and resilience.
In addition, policy and regulatory framework development is essential to examine how government policies, incentives, and regulations affect RESC development and management. On the other hand, economic feasibility studies remain a key research avenue to evaluate the economic viability of incorporating RE technologies, including cost–benefit and risk assessments. Additionally, comprehensive lifecycle assessments should be performed to assess the environmental footprint and efficiency of RE supply systems throughout various stages.

Author Contributions

Conceptualization, I.H. and M.K.; methodology, I.H.; software, I.H.; validation, I.H., M.K. and T.M.; formal analysis, I.H.; investigation, I.H.; resources, I.H.; data curation, I.H., M.K. and T.M.; writing—original draft preparation, I.H.; writing—review and editing, M.K. and T.M.; visualization, I.H.; supervision, M.K. and T.M. All authors have read and agreed to the published version of the manuscript.

Funding

This research received no external funding.

Institutional Review Board Statement

This study is waived for ethical review in compliance with the Arab Academy for Science Technology & Maritime Transport’s Research Policy on Research Ethics by the Institutional Committee.

Informed Consent Statement

Informed consent was obtained from all subjects involved in the study.

Data Availability Statement

All data sources employed to conduct this study are available upon request, such as survey and questionnaire original templates and analysis files, except the survey and questionnaire participants’ biometric data due to privacy.

Acknowledgments

The authors express their sincere appreciation to all individuals who were involved in the surveys and fulfilled the questionnaires for their significant contributions, which were necessary to complete this study. Additionally, the authors appreciatively acknowledge the experts for their valuable assistance in validating the survey.

Conflicts of Interest

The authors declare no conflicts of interest.

Abbreviations

The following abbreviations are used in this manuscript:
CLDCausal Loop Diagram
CVIContent Validity Index
FiTFeed-in-tariffs
GHGGreenhouse Gas
R&DResearch and Development
RERenewable Energy
RESCRenewable Energy Supply Chain
SCSupply Chain
SCMSupply Chain Management

Appendix A

Appendix A.1. Survey Validation Processes

Appendix A.1.1. Validation Questionnaire Template

Dear expert,
I am currently conducting research on the factors influencing the renewable energy sector in Egypt, with a specific focus on the downstream supply chain activities. As an esteemed expert in the field, your insights and expertise would be valuable in validating this survey. The survey is designed to identify the key indicators impacting the renewable energy sector in Egypt, as well as to recognize the downstream supply chain variables.
I would be grateful if you could review the attached survey and offer your feedback on its relevance and clarity. The primary goal is to ensure that the questions and constructions accurately capture the understanding of all respondents. Your validation will help refine the survey to ensure it effectively gathers data aligned with the current needs and challenges within Egypt’s renewable energy sector.
Please fill out the questionnaire that is appropriate for each item of the survey, which reflects your opinion regarding the survey’s different sectors. Thank you very much for considering this request. Your specialized knowledge and critical evaluation would substantially enhance the accuracy of this study.
Table A1. Experts’ opinions questionnaire.
Please Indicate to What Extent You Agree with the Given Statement.Comments
Survey’s SectionsYour Assessment
(Kindly Check the Column Which Is Appropriate for Each Item)
Relevance and Clarity
Not Relevant and ClearSomewhat Relevant and ClearQuite Relevant and ClearHighly Relevant and Clear
1234
Section 1 (Energy Supply System Indicators)
1. Technical
2. Economic
3. Environmental
4. Social
Section 2 (Downstream Supply Chain Variables)
1. Distribution
2. Demand

Appendix A.1.2. CVI Application

To ascertain the survey content validity, a CVI application has been employed. The CVI was used to assess the relevance of each item in the survey and ensure that the items adequately represent the constructs being measured. A panel of six experts was involved, with experts from each of the three following relevant disciplines: three experts from the electrical engineering field, one expert from the renewable energy field, and two from the supply chain management field. This multidisciplinary approach will provide a comprehensive evaluation of the survey items, ensuring their relevance from diverse perspectives.

Appendix A.2. Rating Process

Each subject matter expert engaged in an autonomous assessment of the pertinence and lucidity of each survey item employing a 4-point Likert scale mentioned above. Experts assessed how well each item represents the construct being measured.

Appendix A.3. Item Evaluation

I-CVI has been calculated for each survey item based on the experts’ ratings. An item is considered valid if at least 78% of the experts rate it as 3 or 4.
  • Calculate the I-CVI using Equation (A1).
I - C V I = T h e t o t a l s c o r e o f e a c h e x p e r t N u m b e r o f e x p e r t s
  • Calculate the scale-level S-CVI using Equation (A2) that reflects the overall content validity of the scale. This score is calculated by averaging the I-CVIs for all individual items or by using an alternate method that considers the proportion of items rated as relevant.
S - C V I = T h e t o t a l o f I - C V I T o t a l i t e m s
  • Calculate the universal agreement method (UA-CVI) using Equation (A3) by calculating the proportion of items that receive an I-CVI score of 0.78 or higher. It is an additional conservative measure, ensuring that only items rated as highly relevant by the majority of experts are maintained.
S - C V I / U A = T h e s u m o f U A s c o r e s n u m b e r o f i t e m s
Table A2. Questionnaire Results.
Sectors
Section 1E 1E 2E 3E 4E 5E 6Es in AgreementI-CVIUA
1. Technical dimension434344611
2. Economic dimension443434611
3. Environmental dimension43442350.830
4. Social dimension334444611
Section 2:E 1E 2E 3E 4E 5E 6Es in agreementI-CVIUA
1. Distribution24344350.830
2. Demand443433611
UA-CVI4/6 = 0.66
Proportion relevance0.831110.831S-CVI (Ave)5.66/6 = 0.943
Total number of items = 6 (6 questions from 2 sections)
Based on the calculations presented above, both the S-CVI Ave (derived from the I-CVI and S-CVI based on proportion relevance) and the UA-CVI have achieved satisfactory levels. As a result, the survey scale demonstrates a robust level of content validity, confirming its adequacy for use.

Appendix B

Appendix B.1. Survey’s Sample Size

The optimal sample size was essential for guaranteeing the validity of the survey findings. However, the exact number of experts in the SC and RE sectors in Egypt is largely unknown. To address this uncertainty, the study was conducted by utilizing a sample size estimation formula. This approach facilitates a rigorous computation of the requisite sample size predicated upon specified confidence intervals and permissible margins of error, notwithstanding the absence of exact population metrics. By implementing this strategy, the research sought to ascertain whether the results would possess statistical validity and be emblematic of the expert perspectives within these domains.
The sample size formula estimation is represented in (A4), where (n) is the required sample size and Z is the confidence level, which is commonly 90%, 95%, or 99%. A higher confidence level requires a larger sample size. In addition, p is an estimated proportion of the population, and it is usually 0.5 for unknown populations, as it maximizes the sample size, and E represents the margin of error that reflects willingness to differ from the true population value. A smaller margin of error will require a larger sample size. Hence, by applying the formula, in this study the confidence level was 95% with a 5% margin of error, using the estimated proportion of the population p = 0.5. Thus, the total sample size needed in this study is 384 participants or above.
n = z 2 p ( 1 p ) E 2
n = ( 1.96 ) 2 0.5 ( 1 0.5 ) ( 0.05 ) 2 = 384

Appendix B.2. Estimate Response Rate

Given the objectives of this research and the need for accurate data, the authors considered the nature of the online survey format when determining the appropriate sample size. Recognizing that participants are not obligated to complete the survey, it was essential to account for potential non-responses. To address this, the authors employed response rate calculations to estimate the number of surveys to distribute. This approach involved assessing typical response rates for similar studies, which often range from 10% to 30%. However, in this study, the authors had strong engagement strategies and a particularly interested audience. Thus, a response rate of 50% was considered achievable. As the survey is targeting highly relevant groups, i.e., the experts in SC and RE fields, they may be more inclined to respond.
By estimating a conservative response rate, the authors aimed to ensure that enough completed surveys would be collected to meet the target of 384 respondents. This strategy not only enhances the reliability of the findings but also accommodates the voluntary nature of participation in online surveys, thereby allowing for a more robust analysis of the expert opinions in the logistics and RE sectors. Thus, the total number of surveys needed to achieve 384 completed responses, considering a 50% response rate, is calculated using the following formula: surveys to distribute = 384 0.50 = 768. Accordingly, a total of 768 surveys should be distributed to ensure that the target number of completed surveys is met.

References

  1. Aliyu, A.K.; Modu, B.; Tan, C.W. A Review of Renewable Energy Development in Africa: A Focus in South Africa, Egypt and Nigeria. Renew. Sustain. Energy Rev. 2018, 81, 2502–2518. [Google Scholar] [CrossRef]
  2. Mangla, S.K.; Luthra, S.; Jakhar, S.; Gandhi, S.; Muduli, K.; Kumar, A. A Step to Clean Energy-Sustainability in Energy System Management in an Emerging Economy Context. J. Clean. Prod. 2020, 242, 118462. [Google Scholar] [CrossRef]
  3. Mastrocinque, E.; Ramírez, F.J.; Honrubia-Escribano, A.; Pham, D. An AHP-based Multi-criteria Model for Sustainable Supply Chain Development in the Renewable Energy Sector. Expert Syst. Appl. 2020, 150, 113321. [Google Scholar] [CrossRef]
  4. Jelti, F.; Allouhi, A.; Büker, M.S.; Saadani, R.; Jamil, A. Renewable Power Generation: A Supply Chain Perspective. Sustainability 2021, 13, 1271. [Google Scholar] [CrossRef]
  5. Fashina, A.; Mundu, M.; Akiyode, O.; Abdullah, L.; Sanni, D.; Ounyesiga, L. The Drivers and Barriers of Renewable Energy Applications and Development in Uganda: A Review. Clean Technol. 2018, 1, 9–39. [Google Scholar] [CrossRef]
  6. Asante, D.; He, Z.; Adjei, N.O.; Asante, B. Exploring the Barriers to Renewable Energy Adoption Utilising MULTIMOORA-EDAS Method. Energy Policy 2020, 142, 111479. [Google Scholar] [CrossRef]
  7. RP, P.; Abdul Baseer, M.; Awan, A.B.; Zubair, M. Performance Analysis and Optimization of a Parabolic trough Solar Power Plant in the Middle East Region. Energies 2018, 11, 741. [Google Scholar] [CrossRef]
  8. Azevedo, S.G.; Santos, M.; Antón, J.R. Supply Chain of Renewable Energy: A Bibliometric Review Approach. Biomass Bioenergy 2019, 126, 70–83. [Google Scholar] [CrossRef]
  9. Paul, A.; Shukla, N.; Paul, S.K.; Trianni, A. Sustainable Supply Chain Management and Multi-criteria Decision-making Methods: A Systematic Review. Sustainability 2021, 13, 7104. [Google Scholar] [CrossRef]
  10. Ramos-Hernández, R.; Sánchez-Ramírez, C.; Sandoval-Salas, F.; Manotas-Duque, D.F.; Rivera-Cadavid, L.; Pérez-Rodríguez, S.I. Systemic Approach for the Design of Renewable Energy Supply Chain Generated from Biomass. In Techniques, Tools and Methodologies Applied to Global Supply Chain Ecosystems; García-Alcaraz, J., Sánchez-Ramírez, C., Avelar-Sosa, L., Alor-Hernández, G., Eds.; Springer Nature: Cham, Switzerland, 2020; Volume 166, pp. 259–283. [Google Scholar]
  11. Sadeghi, J.; Haapala, K.R. Optimizing a Sustainable Logistics Problem in a Renewable Energy Network Using a Genetic Algorithm. Opsearch 2019, 56, 73–90. [Google Scholar] [CrossRef]
  12. Saqib, Z.A.; Zhang, Q. Impact of Sustainable Practices on Sustainable Performance: The Moderating Role of Supply Chain Visibility. J. Manuf. Technol. Manag. 2021, 32, 1421–1443. [Google Scholar] [CrossRef]
  13. Saqib, Z.A.; Xu, G.; Luo, Q. Green Manufacturing for a Green Environment from Manufacturing Sector in Guangdong Province: Mediating Role of Sustainable Operations and Operational Transparency. Appl. Sci. 2024, 14, 10637. [Google Scholar] [CrossRef]
  14. Jafarinejad, S.; Beckingham, L.E.; Kathe, M.; Henderson, K. The Renewable Energy (RE) Industry Workforce Needs: RE Simulation and Analysis Tools Teaching as an Effective Way to Enhance Undergraduate Engineering Students’ Learning. Sustainability 2021, 13, 11727. [Google Scholar] [CrossRef]
  15. Cucchiella, F.; D’Adamo, I. Issue on Supply Chain of Renewable Energy. Energy Convers. Manag. 2013, 76, 774–780. [Google Scholar] [CrossRef]
  16. Hassanin, I.; Knez, M. Managing Supply Chain Activities in the Field of Energy Production Focusing on Renewables. Sustainability 2022, 14, 7290. [Google Scholar] [CrossRef]
  17. Lam, H.L.; Varbanov, P.S.; Klemeš, J.J. Optimisation of Regional Energy Supply Chains Utilising Renewables: P-graph Approach. Comput. Chem. Eng. 2010, 34, 782–792. [Google Scholar] [CrossRef]
  18. Wee, H.-M.; Yang, W.-H.; Chou, C.-W.; Padilan, M.V. Renewable Energy Supply Chains, Performance, Application Barriers, and Strategies for Further Development. Renew. Sustain. Energy Rev. 2012, 16, 5451–5465. [Google Scholar] [CrossRef]
  19. Balaman, Ş.Y.; Selim, H. Sustainable Design of Renewable Energy Supply Chains Integrated with District Heating Systems: A Fuzzy Optimization Approach. J. Clean. Prod. 2016, 133, 863–885. [Google Scholar] [CrossRef]
  20. Jeong, J.S.; Ramírez-Gómez, Á. Optimizing the Location of a Biomass Plant with a Fuzzy-DEcision-MAking Trial and Evaluation Laboratory (F-DEMATEL) and Multi-criteria Spatial Decision Assessment for Renewable Energy Management and Long-term Sustainability. J. Clean. Prod. 2018, 182, 509–520. [Google Scholar] [CrossRef]
  21. Sahebi, I.G.; Mosayebi, A.; Masoomi, B.; Marandi, F. Modeling the Enablers for Blockchain Technology Adoption in Renewable Energy Supply Chain. Technol. Soc. 2022, 68, 101871. [Google Scholar] [CrossRef]
  22. Acuna, M.; Sessions, J.; Zamora, R.; Boston, K.; Brown, M.; Ghaffariyan, M.R. Methods to Manage and Optimize Forest Biomass Supply Chains: A Review. Curr. For. Rep. 2019, 5, 124–141. [Google Scholar] [CrossRef]
  23. Ricardo Saavedra M., M.; Fontes, C.H.d.O.; Freires, F.G.M. Sustainable and Renewable Energy Supply Chain: A System Dynamics Overview. Renew. Sustain. Energy Rev. 2018, 82, 247–259. [Google Scholar] [CrossRef]
  24. Shen, Y.-C.; Lin, G.T.; Li, K.-P.; Yuan, B.J. An Assessment of Exploiting Renewable Energy Sources with Concerns of Policy and Technology. Energy Policy 2010, 38, 4604–4616. [Google Scholar] [CrossRef]
  25. Mohamed, S.K.; Haddad, S.; Barakat, M. Does blockchain adoption engender environmental sustainability? The mediating role of customer integration. Bus. Process Manag. J. 2024, 30, 558–585. [Google Scholar] [CrossRef]
  26. Dong, Z.; Yu, X.; Chang, C.-T.; Zhou, D.; Sang, X. How Does Feed-in tariff and Renewable Portfolio Standard Evolve Synergistically? An Integrated Approach of Tripartite Evolutionary Game and System Dynamics. Renew. Energy 2022, 186, 864–877. [Google Scholar] [CrossRef]
  27. Simas, M.; Pacca, S. Assessing Employment in Renewable Energy Technologies: A Case Study for Wind Power in Brazil. Renew. Sustain. Energy Rev. 2014, 31, 83–90. [Google Scholar] [CrossRef]
  28. Şengül, Ü.; Eren, M.; Shiraz, S.E.; Gezder, V.; Şengül, A.B. Fuzzy TOPSIS Method for Ranking Renewable Energy Supply Systems in Turkey. Renew. Energy 2015, 75, 617–625. [Google Scholar] [CrossRef]
  29. Qian, X.; Shen, L.; Wang, Y.; Lin, J.; Jin, Z.; Ge, Y.-E.; Haddad, S.S.G. Stability Analysis of Maritime Logistics Alliance Based on Blockchain. Transp. Policy 2025, 163, 219–231. [Google Scholar] [CrossRef]
  30. Giordano, R.; Osann, A.; Henao, E.; López, M.L.; Piqueras, J.G.; Nikolaidis, N.P.; Lilli, M.; Coletta, V.R.; Pagano, A. Causal Loop Diagrams for Bridging the Gap Between Water-Energy-Food-Ecosystem Nexus Thinking and Nexus Doing: Evidence from Two Case Studies. J. Hydrol. 2025, 650, 132571. [Google Scholar] [CrossRef]
  31. Alvarado, M.; Garrett, J.; Fullam, J.; Lovell, R.; Guell, C.; Taylor, T.; Garside, R.; Zandersen, M.; Wheeler, B.W. Using Causal Loop Diagrams to Develop Evaluative Research Propositions: Opportunities and Challenges in Applications to Nature-based Solutions. Syst. Dyn. Rev. 2024, 40, e1756. [Google Scholar] [CrossRef]
  32. Rutherford-Hemming, T. Determining Content Validity and Reporting a Content Validity Index for Simulation Scenarios. Nurs. Educ. Perspect. 2015, 36, 389–393. [Google Scholar] [CrossRef] [PubMed]
  33. Almanasreh, E.; Moles, R.; Chen, T.F. Evaluation of Methods Used for Estimating Content Validity. Res. Soc. Adm. Pharm. 2019, 15, 214–221. [Google Scholar] [CrossRef]
  34. Schober, P.; Boer, C.; Schwarte, L.A. Correlation Coefficients: Appropriate Use and Interpretation. Anesth. Analg. 2018, 126, 1763–1768. [Google Scholar] [CrossRef]
  35. Hadd, A.; Rodgers, J.L. Understanding Correlation Matrices; Sage Publications: Thousand Oaks, CA, USA, 2020; Volume 186. [Google Scholar]
  36. Hair, J.F.; Black, W.C.; Babin, B.J.; Anderson, R.E. Multivariate Data Analysis, 8th ed.; Cengage Learning: Hampshire, UK, 2019. [Google Scholar]
  37. Bermudez-Edo, M.; Barnaghi, P.; Moessner, K. Analysing Real World Data Streams with Spatio-temporal Correlations: Entropy vs. Pearson Correlation. Autom. Constr. 2018, 88, 87–100. [Google Scholar] [CrossRef]
  38. Roos, M. Feedback, Circular Causality, and System Dynamics. In Principles of Complexity Economics: Concepts, Methods and Applications; Springer: Berlin/Heidelberg, Germany, 2024; pp. 253–338. [Google Scholar]
  39. Mohammadi, M.A.; Sayadi, A.R.; Khoshfarman, M.; Kashan, A.H. A systems dynamics simulation model of a steel supply chain-case study. Resour. Policy 2022, 77, 102690. [Google Scholar] [CrossRef]
Figure 1. RESC downstream process and its variables.
Logistics 09 00150 g001
Figure 2. Methodology framework.
Logistics 09 00150 g002
Figure 3. Performance dimensions of renewable energy supply systems and their identified indicators.
Logistics 09 00150 g003
Figure 4. RESC downstream practices and their identified variables.
Logistics 09 00150 g004
Figure 5. The causality diagram for efficiency and exergy efficiency indicators.
Logistics 09 00150 g005
Figure 6. The causal loop diagram for Renewable Energy Consumption Rate and Satisfaction Rate indicators.
Logistics 09 00150 g006
Figure 7. The causal loop diagram for economic indicators.
Logistics 09 00150 g007
Figure 8. The causal loop diagram for environmental indicators.
Logistics 09 00150 g008
Figure 9. The causal loop diagram for social indicators.
Logistics 09 00150 g009
Figure 10. The complete causality diagram with different feedback loops.
Logistics 09 00150 g010
Table 1. Typical assessment indicators of energy supply systems [28].
DimensionsIndicators
Technical
  • Efficiency.
  • Safety.
  • Maturity.
  • Primary energy ratio.
  • Exergy efficiency.
  • Reliability.
Economic
  • Service life.
  • Fuel cost.
  • Payback period.
  • Investment cost.
  • Electric cost.
  • Equivalent annual cost.
  • Net present value.
  • Operation and maintenance cost.
Environmental
  • CO emission.
  • CO2 emission.
  • NO2 emission.
  • SO2 emission.
  • Particles emission.
  • Land use.
  • Non-methane volatile organic compounds.
Social
  • Social acceptability.
  • Social benefits.
  • Job creation.
Table 2. Demographic information analysis.
CategoriesSample DisseminationNumbersPercentage
Age26–30 years1303.10%
31–40 years19746.90%
41–50 years18042.90%
51–60 years3007.10%
GenderMale37088.10%
Female5011.90%
Education DegreeBachelor’s degree33680.00%
Master’s degree6014.30%
Ph.D. degree2405.70%
Employment SectorPublic sector29871.00%
Private sector12229.00%
Professional FieldAcademics1303.10%
Supply chain specialists7016.70%
Logistics27665.70%
Energy experts6114.50%
Table 3. Summary of the relationship directions between the variables.
IndicatorsDownstream SC Variables
DistributionDemand
Di1Di2Di3De1De2De3De4
TechnicalT10.723 **0.850 **0.814 **−0.783 **0.788 **0.733 **−0.898 **
T20.744 **0.867 **0.810 **−0.761 **0.812 **0.734 **−0.883 **
T30.614 **0.761**0.671 **−0.667 **0.734 **0.767 **−0.811 **
T40.653 **0.778 **0.708 **−0.707 **0.750 **0.725 **−0.857 **
EconomicECO10.373 **0.454**0.473 **−0.426 **0.423 **0.448 **−0.580 **
ECO20.523 **0.590 **0.446 **−0.228 **0.586 **0.584 **−0.386 **
ECO3−0.147 *−0.262 **−0.404 **0.366 **−0.171 **−0.456 **0.466 **
EnvironmentalENV10.328 **0.506 **0.484 **−0.393 **0.423 **0.598 **−0.498 **
ENV2−0.227 **−0.299 **−0.288 **0.438 **−0.277 **−0.222 **0.537 **
SocialS10.567 **0.746 **0.642 **−0.503 **0.651 **0.846 **−0.620 **
S20.683 **0.827 **0.811 **−0.783 **0.753 **0.720 **−0.892 **
** Correlation is significant at the 0.01 level (2-tailed). * Correlation is significant at the 0.05 level (2-tailed).
Disclaimer/Publisher’s Note: The statements, opinions and data contained in all publications are solely those of the individual author(s) and contributor(s) and not of MDPI and/or the editor(s). MDPI and/or the editor(s) disclaim responsibility for any injury to people or property resulting from any ideas, methods, instructions or products referred to in the content.