2. Literature Review
In the information technology sector, particularly in the area of computer equipment and high technology intended for corporate customers, the post-pandemic macroeconomic environment highlights the efficiency of SCM of spare parts as a key focus through which companies with international operations compete. Gartner, Inc. has released the results of its annual Global Supply Chain Top 25, which identifies supply chain leaders and highlights their best practices. The results show that resilience and flexibility are highlighted as vital qualities of SC. The ranking highlights companies that possess these qualities and views them as a strategic competitive advantage. Other authors [
3], however, believe that the efficient flow of goods from manufacturers to consumers relies heavily on logistics operations. Supply chain management is viewed as a series of activities and processes that end with the delivery of the finished product to the customer [
4,
5,
6,
7,
8,
9,
10]. The authors Bhalaji et al. consider that a strong collaborative supply chain (CSC) is crucial to ensure both the timely receipt of raw materials and the delivery of finished goods [
11], and other studies identify and evaluate the critical success factors (CSFs) necessitating SC digitalization and strategies helping in SC digitalization [
12]. Dragomirov described that the context of supply chain management, logistics serves to move and position inventory to achieve desired time, place, and possession benefits at the lowest total cost [
13]. After-sales service refers to the services and support that companies provide to their customers as part of their customer satisfaction and retention policies after the sale of the product. After-sales service refers to the provision of services for transportation, installation, adjustment, and commissioning of purchased goods, ensuring maintenance during the warranty period, as well as spare parts, accepting and settling complaints and returning defective goods [
14,
15,
16].
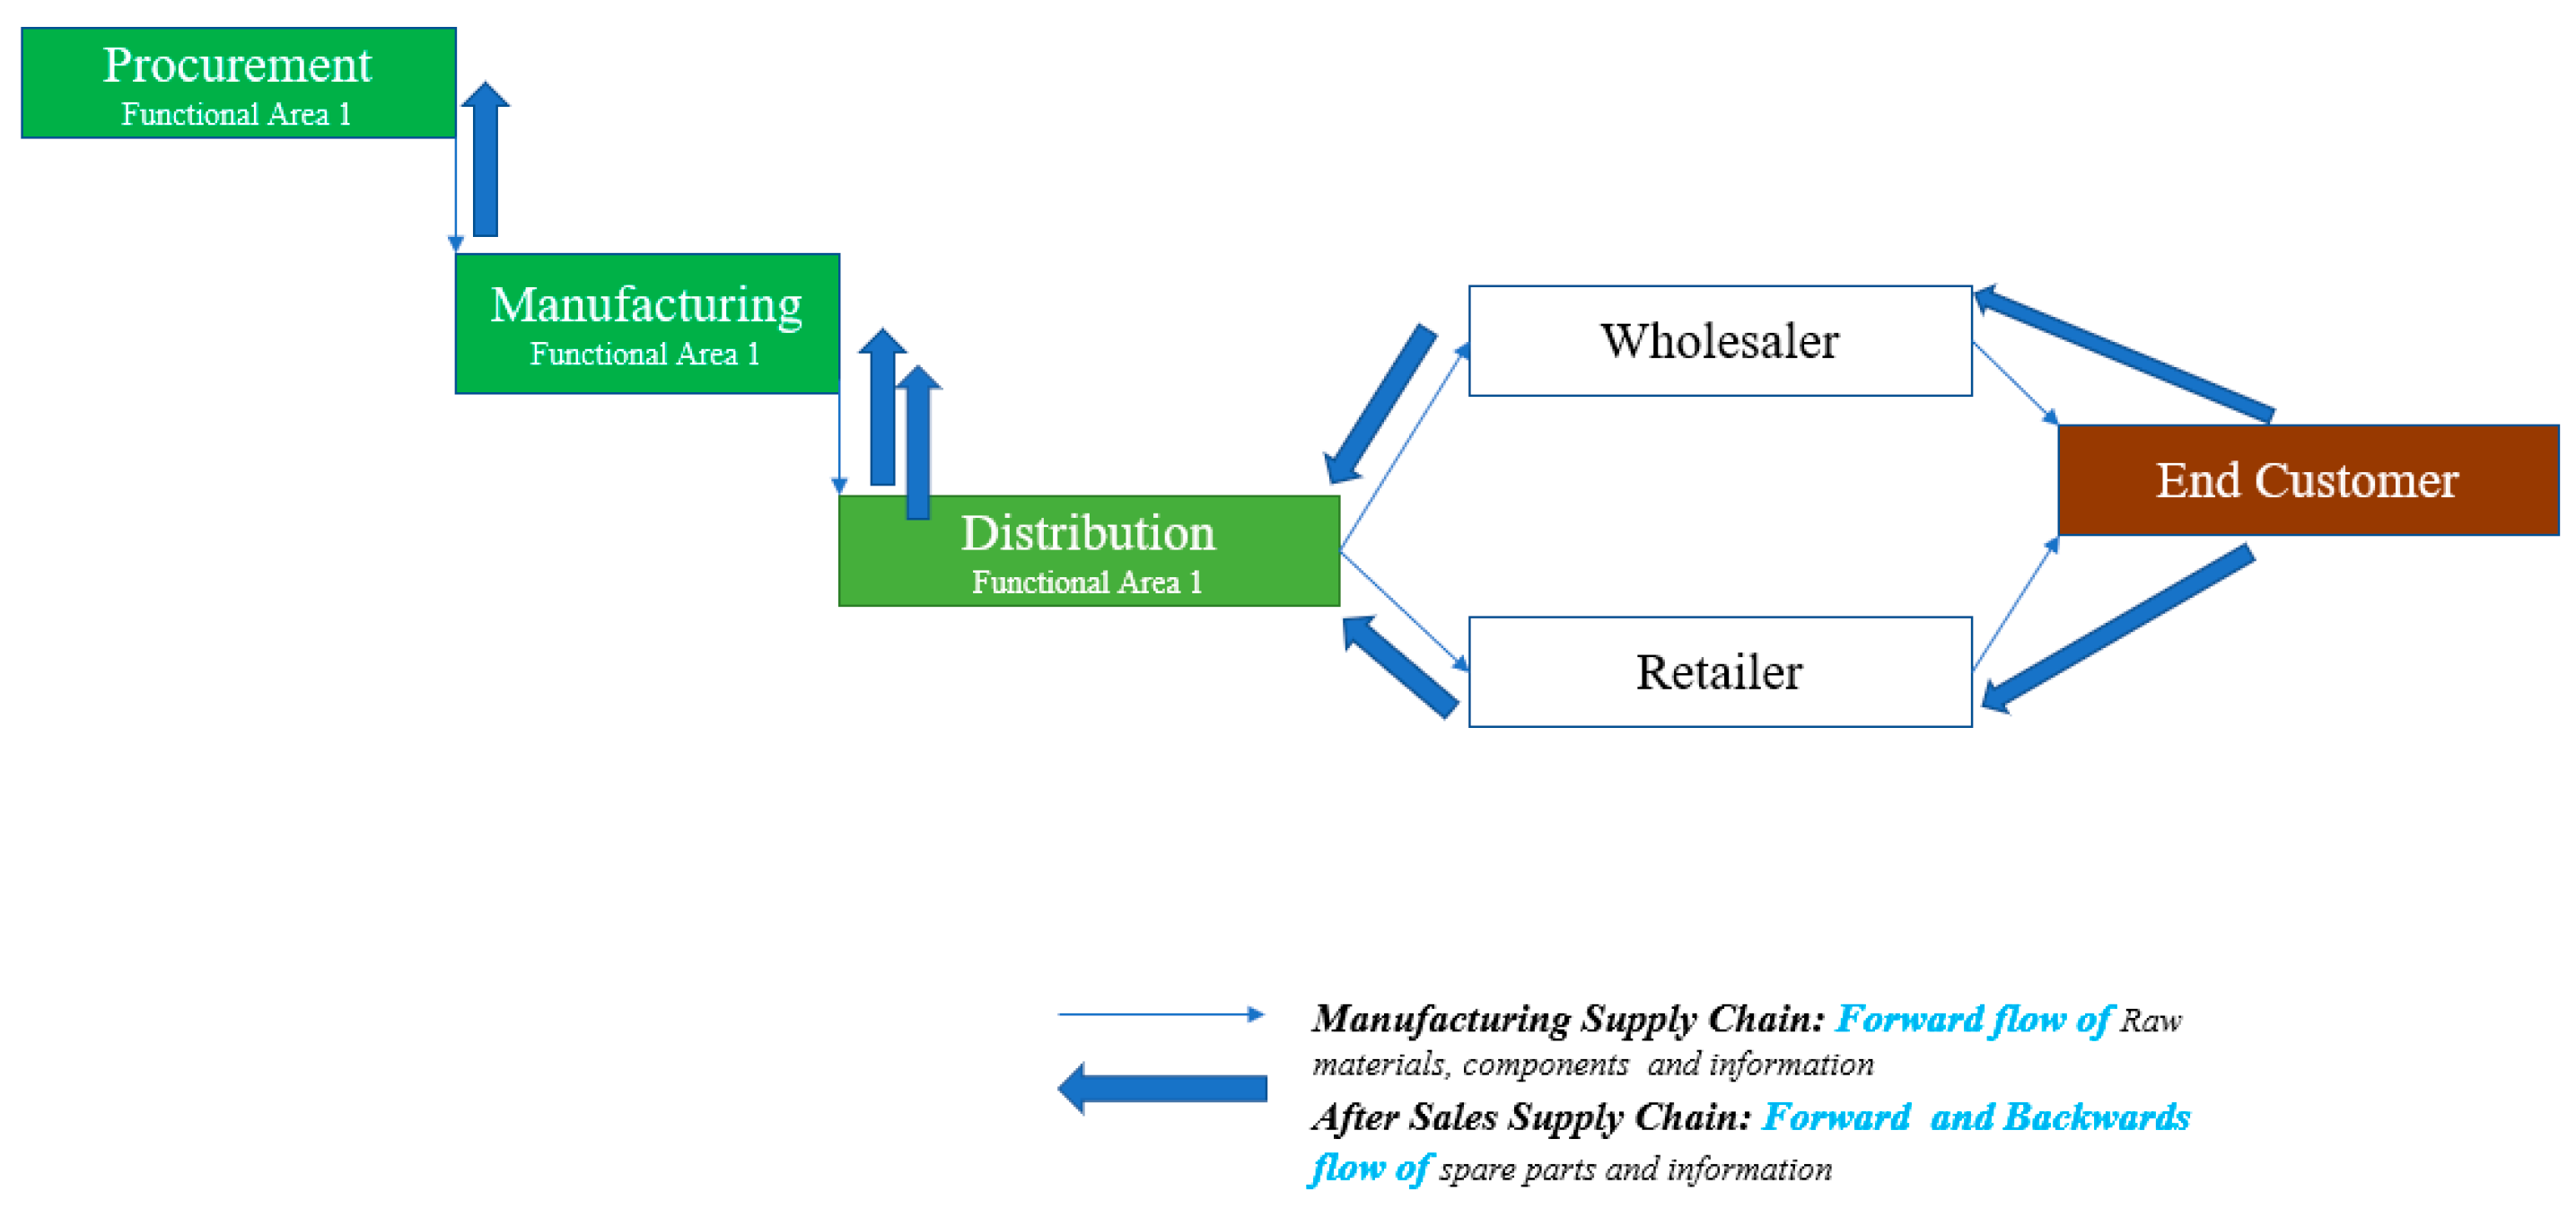
Figure 1 shows the customer service process in both sequential and reverse order through all its functional areas. The role of customer service is to ensure the flow of information and materials throughout the supply chain, including in reverse order, to ensure the required level of customer service. The spare parts required for after-sales or warranty service for the products sold are sourced from the same raw material and material suppliers that the company uses to manufacture the finished ICT product that the end customers buy and with which they conclude a maintenance contract. Once in the supply chain and in the company’s inventory, a spare part (in need of repair) could be used multiple times until the possibility of repair and return to the chain for later use for a service contract is exhausted. An exception to this rule is any spare part that contains confidential customer information, and after replacement with a new part, the old part should be physically destroyed. Such spare parts include hard discs—they cannot be repaired and reused to protect the confidentiality of customer data [
17,
18,
19]. According to Vodenicharova, it is important to establish long-term partnership relations between the manufacturer and the main suppliers [
20].
After a replacement part is used to repair an end product, it drives the reverse flow by returning the replaced/defective part back into the chain. The latter is repaired by engineers in the company or by the supplier/manufacturer of the same part and returned to the company’s inventory so that it can be reused for service [
22,
23,
24]. Spare parts repaired in this way are referred to as the refurbishment process. Corporate customers, who are often the main users of computer equipment (servers and/or supercomputers), are guided by two models for the consumption of these products: (1) installation of this equipment in a data center located on the customer’s premises and owned by the customer, and (2) cloud services, where the customer only purchases the capacity and the equipment is not installed on the customer’s premises and does not belong to the customer. In recent years, a third (hybrid) model has also been introduced, where the customer only pays for what they use, without purchasing the corresponding computer equipment. In all three options, the equipment or services that the customer uses must be supported by a stable spare parts supply chain so that the business processes of the customers who use them can run smoothly. The research by Rohaan et al. contributes to the literature by giving step-by-step guidance on incorporating artificial intelligence in B2B sales forecasting and gives an indication of the performance improvement [
25,
26,
27]. Supply chain customer service is usually located in companies that manage the material flow of spare parts and the corresponding flow of information resources required to carry out after-sales service for the end products sold. A spare part or a part for service/repair of a finished product is part of the product tree (Bill of Materials) in the production of products. Its place in the after-sales supply chain is occupied in the process of delivery of a spare part for the provision of customer services and the return of a defective part to production or to the supplier for repair and subsequent return of the repaired part. The spare part has its own technical specifications and characteristics, which are determined during the manufacture of the products. The same specifications are also used in the manufacture of spare parts that are stored and used for after-sales service (and not for the manufacture of new products) [
28,
29,
30,
31]. A spare part in this work is a replaceable part that is stored in warehouses and used to repair or replace defective equipment/products. Spare parts are an important part of logistics engineering and supply chain management, often using specialised management systems (ERP). It is interesting to consider the hierarchical perspective [
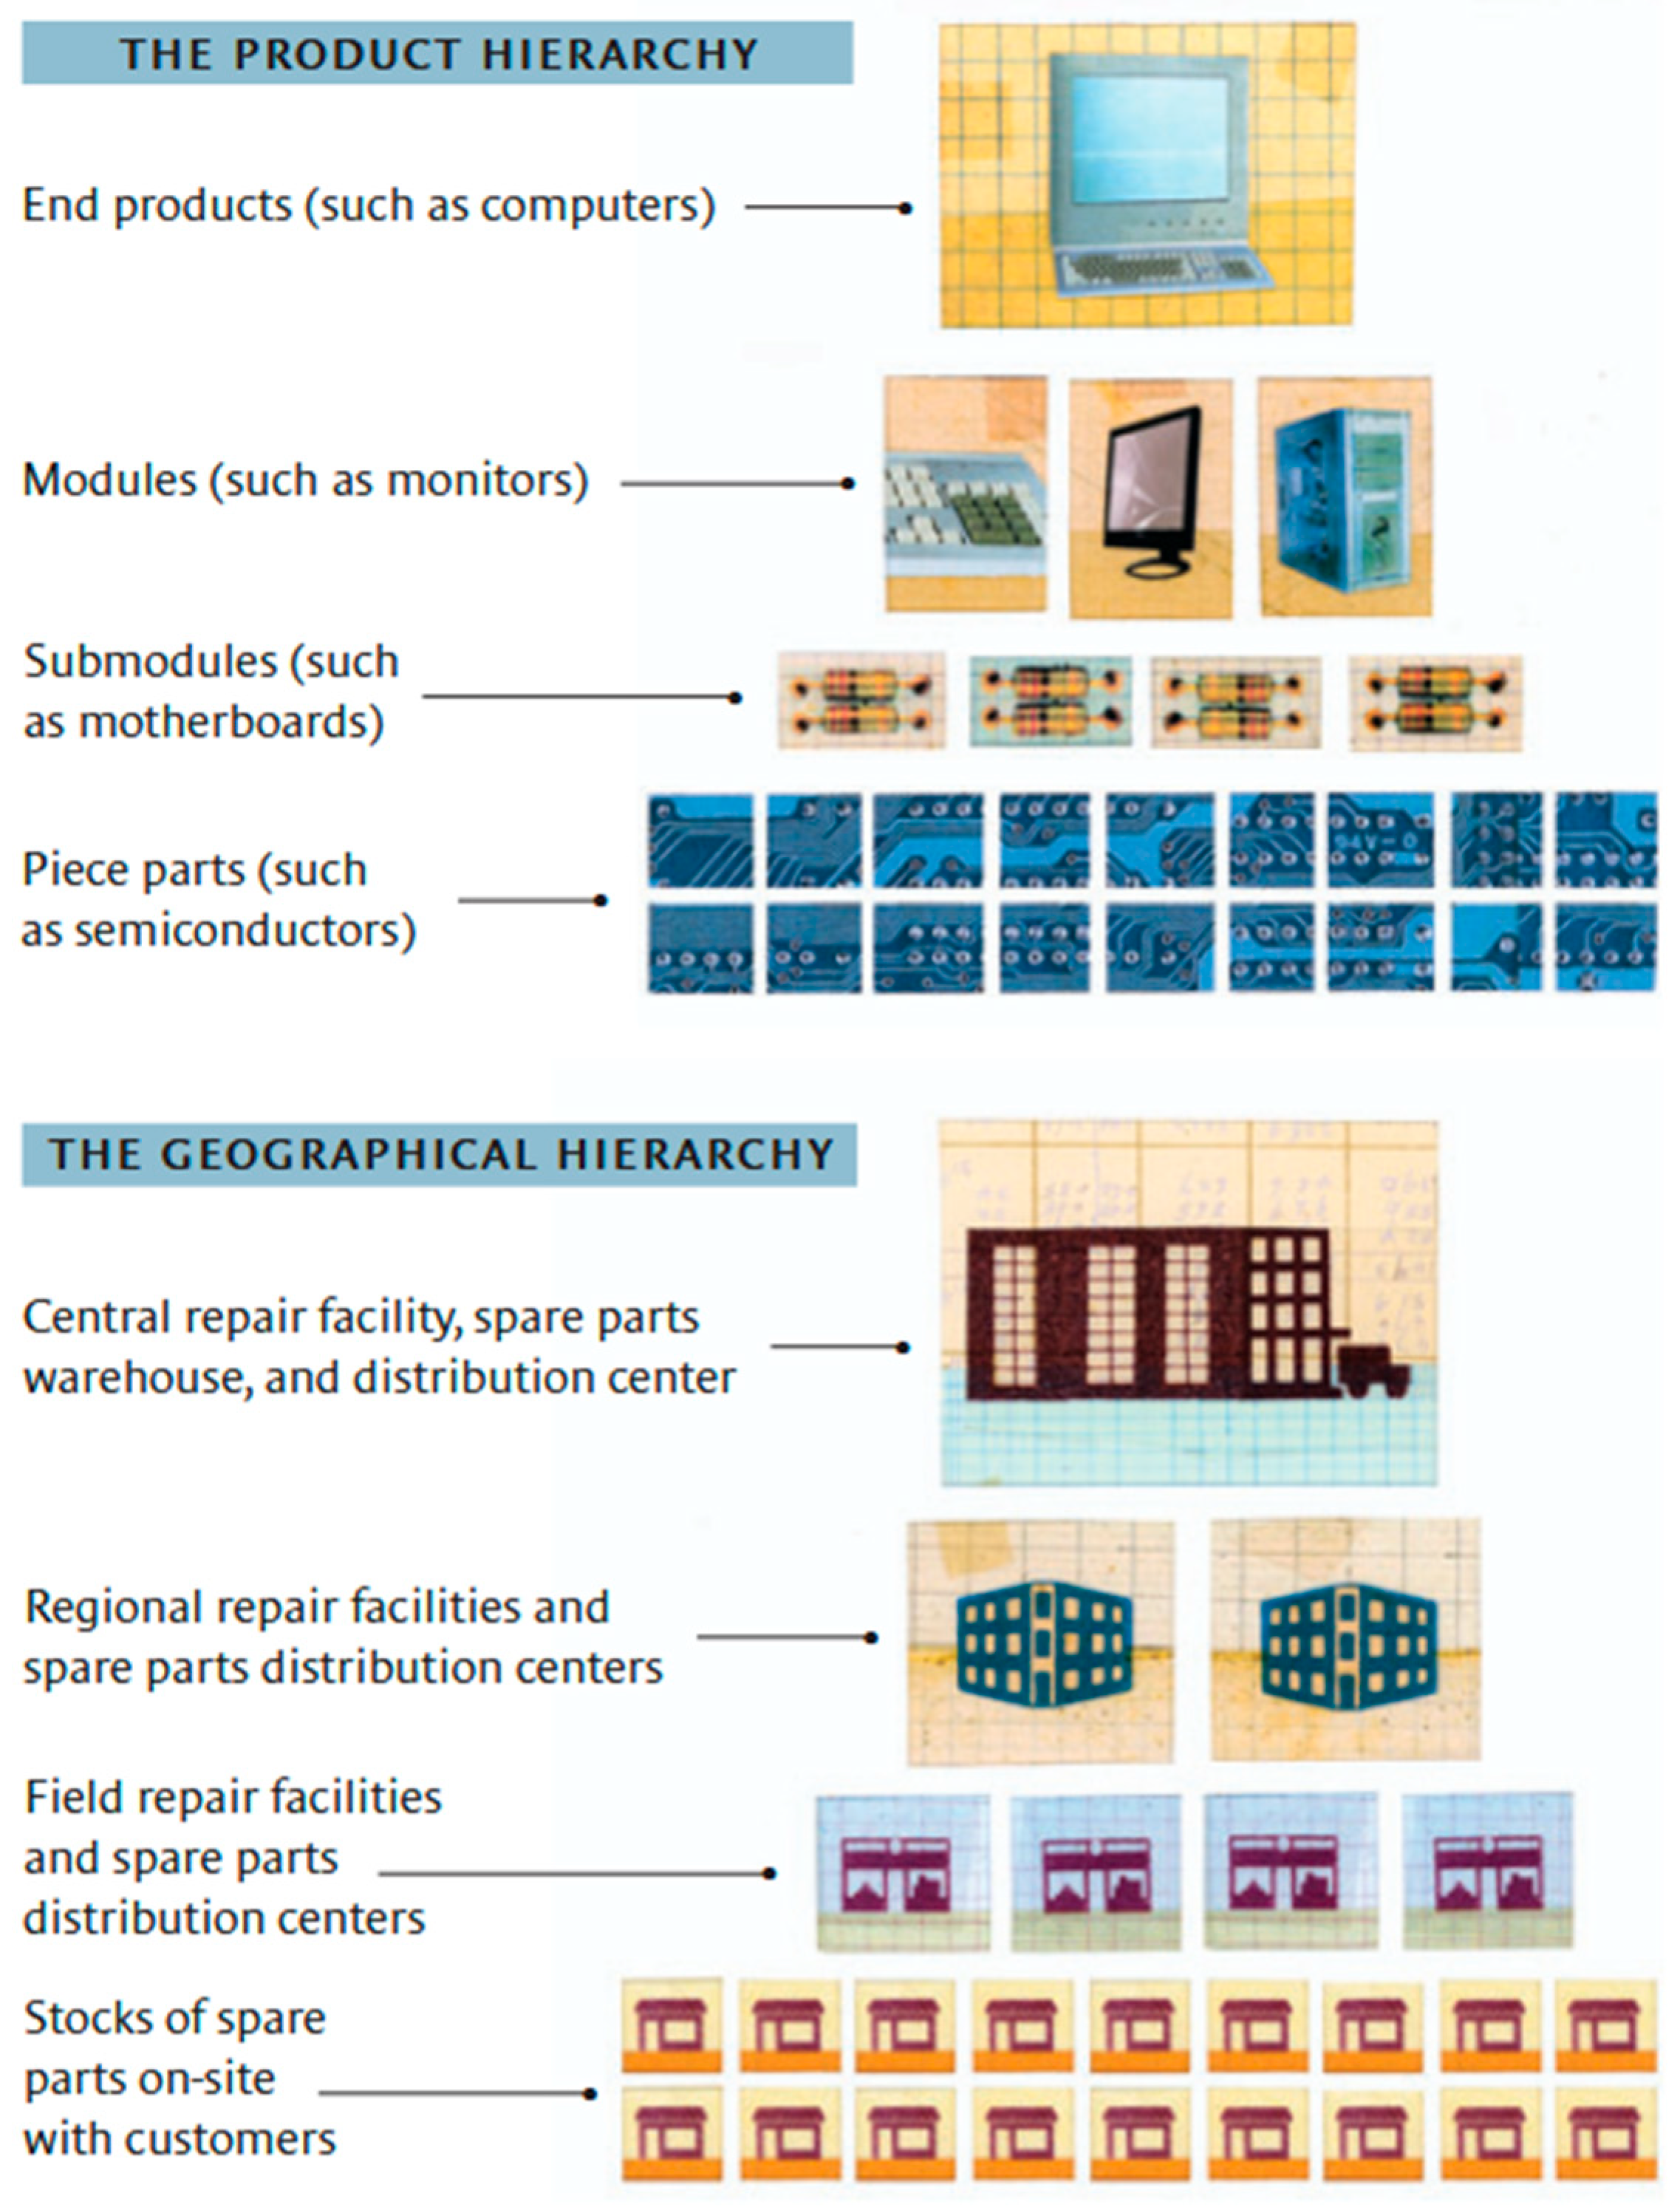
32,
33] according to which a spare parts SCM could be effectively constructed. Two main levels can be distinguished in the hierarchical arrangement (
Figure 2). This two-axis hierarchy, encompassing both product criticality at the Bill of Materials (BOM) level and the geographical structure of the warehouse network, is fundamentally critical for Multi-Echelon Inventory Optimization (MEIO). It enables strategic decisions regarding stock positioning and quantities across central and regional warehouses, ensuring that diverse time-to-serve constraints can be met effectively under various Service Level Agreements (SLAs), such as 6 h (CTR), same-business-day (SBD), and next-business-day (NBD) service requirements.
Depending on the type of hierarchy a company chooses, it can build its after-sales spare parts management system and manage the flow of materials (spare parts) and related information and other flows to provide the highest level of after-sales service to customers. This shows that the supply chain for ICT products is often characterized by a dual nature: it is important to distinguish between the supply chain for the production and sales of the product and the after-sales service chain. The after-sales service chain can continue long after the end of production, especially for ICT products. Distinguishing between the production and after-sales supply chain helps to better understand the specificities and challenges of each. The importance of after-sales service is not clearly highlighted and brought to the fore: after-sales service is often an overlooked area, despite its importance for the satisfaction, loyalty, and retention of customers who consume products with long warranty periods. This includes services and support with spare parts that flow through the supply chain and are offered to customers after the product has been sold. The correct introduction of new products is crucial for successful sales and the conclusion of agreements with spare parts suppliers. At this stage, decisions are made that affect the successful SCM for spare parts until the end of the ICT product’s life cycle. The role of the supply chain in the introduction of new products should not be overlooked, as it can lead to high costs, unmet demand, unsatisfactory warranty service and ineffective customer service. This shows the need for a specific methodology to study the after-sales service provided by the spare parts supply chain during the introduction of new ICT products.
3. Materials and Methods
Due to the scale of the study, this article expands on results published by Vodenicharova, Genova [
34]. The data collection is based on requests to customers, i.e., users of computer equipment. The inquiries addressed to customers were conducted with the help of computer equipment manufacturer of one of the computer equipment manufacturers that provides after-sales service for computer equipment not manufactured by the same company, and are therefore suitable for the study to determine the existing level of after-sales service with spare parts and the ways to improve it. The data was collected through feedback from customers who had suffered a warranty failure, where a replacement part was required to repair the product. The response times specified in the customer contracts for the warranty request by the after-sales service company, compared to the response time, show the extent to which the company was able to meet the customer’s expectations in a timely manner. The respondents are private and corporate customers who use computer equipment (servers) and have active customer service contracts [
34]. The steps for implementing the development methodology are presented in a flow chart in
Figure 3.
The data obtained from the interviews is intended to provide a more complete picture of the performance of the spare parts supply chain in the initial phase, i.e., the introduction of a new product in the computer category, evaluating two main aspects:
Aspects related to the activities of the spare parts supply chain during the launch of a new product from the point of view of ensuring after-sales service. The data refers to a period of one year (1 January 2023 to 1 January 2024) and takes into account all new products launched in the computer category during this period (116 new products) and the product tree for each of these products (or the spare parts required for after-sales service (839 spare parts)). The deadlines within which each newly created spare part must be available in the computer manufacturers’ stock network and ready for after-sales service are examined. This data is examined to identify weaknesses in the after-sales supply chain for spare parts during the launch of the new product, which are the cause of delays in ensuring the availability of spare parts in the stock network required for after-sales service.
Aspects related to the activities of the spare parts supply chain immediately after the launch of a new product (up to 6 months) of computer equipment from the point of view of ensuring after-sales service. The data reflect the level of after-sales service provided to 101 customers of the new product category (New Product Introduction flag) computer equipment who made 1294 requests for warranty services requiring a replacement part. This data is analysed to identify the weak points in the after-sales supply chain for spare parts immediately after the launch of the new product. The following methods were used to analyze the data from the questionnaire survey:
1. Statistical analysis of descriptive statistics (one-dimensional and two-dimensional) frequency distributions according to qualitative and quantitative characteristics—this method was used to clarify the importance and role of the spare parts supply chain from the point of view of the customer service provided and the image of the company as follows: the number of warranty service requests submitted compared to the deadlines specified in the customer contracts (request with a deadline from the time of its submission by the customer to the manufacturing company: (1) 6 h, (2) within the same day and (3) the next day) is presented using a one-dimensional frequency distribution. The level of after-sales service presented in this way goes on to clarify the level of service currently provided and whether it corresponds to the objectives set by the company and the agreements with the end customers—a two-dimensional frequency distribution by quality is used (execution deadline and cases in which this deadline was not met for specific reasons that occurred in the spare parts supply chain).
2. Pareto in combination with one- and two-dimensional distributions according to qualitative and quantitative characteristics—specifically in the study, this method was used to assess the complexity of the supply chain. Based on the data collected, an analysis is made of the complexity of the spare parts supply chain in terms of the number and type of warehouses, the suppliers of components, materials and spare parts with which the company works, as well as the number and type of different spare parts that flow daily in the after-sales service chain. By deriving the main elements of each category, the author succeeds in showing and clarifying how complex and varied the relationships with third parties along the chain are, the extent of the processes that take place, and the main categories that stand out in the so-called “complexity” of the supply chain. The Pareto analysis reduces the data to a level where only the categories that have the greatest impact on the ongoing processes along the chain can be analyzed (main suppliers with whom the company works, main types of spare parts requested, etc.). Based on the two-dimensional frequency distribution according to the Pareto analysis by quality criteria (main categories of spare parts and number of cases in which they were not available in stock when submitting a warranty claim), it is determined that 20% have an 80% impact on the processes along the chain, which could improve the management of the spare parts supply chain. Taking into account the results of the data analysis on the complexity of the chain, a proposal could be made for the main suppliers with whom the company should establish a working relationship during the launch of a new product, as well as the main types of spare parts that should be positioned in the warehouse network during the launch of a new product in order to avoid shortages immediately after the launch of a new product on the market. The results of this analysis can indicate areas where rationalization can be used to improve the management of processes in the spare parts supply chain during the launch of a new product. The data analysis relied on established statistical methods suited for diagnostic and descriptive research:
Statistical Analysis of Descriptive Statistics:
- ○
One-Dimensional Frequency Distributions: Used to clarify the overall distribution of requests by SLA type.
- ○
Two-Dimensional Frequency Distributions (Cross-Tabs): Employed to analyze service performance (HIT vs. MISS) against SLA categories and to identify reasons for missed deadlines by functional group.
Pareto Analysis: This method, in combination with frequency distributions, was crucial for assessing the complexity of the supply chain. It allowed for the identification of the “main elements” (e.g., top suppliers, most problematic spare part categories) that had the greatest impact on service failures, thereby reducing complex data into actionable insights for optimization.
Temporal Analysis: Although not explicitly termed “time series analysis,” the study examined service levels and request volumes “by quarter”, providing a temporal perspective on performance trends over the one-year study period.
The primary units of analysis were individual warranty service requests, specific spare parts, types of warehouses, and supplier entities.
Key variables extracted and analyzed from the data included:
Service Level Agreement (SLA) Class: Categorized into three main types based on contractual response and repair times:
- ○
CTR (Call to Repair): Services to be provided within 6 h.
- ○
SBD (Same Business Day): Services to be provided within the same business day.
- ○
NBD (Next Business Day): Services to be provided on the next business day.
Service Outcome (Derived Feature): Each warranty request was classified based on whether the SLA was met:
- ○
HIT: Applications completed on time.
- ○
MISS: Missed deadline, indicating a response with delay or failure to meet the warranty period.
Reason for Missed Deadline (Functional Group): For “MISS” cases, the reasons were grouped into functional categories:
- ○
SC (Supply Chain): Lack of spare parts in the nearest warehouse.
- ○
LG (Logistics): Delays primarily due to transportation activities.
- ○
WH (Warehousing): Delays in warehouse activities (consolidation, packing, shipping, labeling).
- ○
OC (Order Creation): Systematic interruptions in the order cycle.
- ○
IT (Information Technology): System crashes, non-functioning software.
- ○
LGIN (Logistics Information): Logistics software issues.
Spare Part Characteristics: Type/category of spare part (e.g., power supply, hard drives, memory), its position in the product Bill of Materials (BOM) hierarchy, and its lifecycle stage (e.g., Sustaining, End of Manufacturing Life, End of Life).
Supplier Information: Manufacturer of the spare part (e.g., Foxconn, DIV, Acction Technology Corporation).
Warehouse Network: Number, type (Central, CHUB, FSL), and geographical distribution of warehouses from which spare parts were dispatched.
The study involved the analysis of operational service logs and feedback from customers. All data was collected and processed in collaboration with a computer equipment manufacturer. While specific ethical review board details are not provided in the excerpts, it is understood that such research involving customer data adheres to internal company protocols for data privacy and confidentiality. For instance, the study notes that any spare parts containing confidential customer information, such as hard drives, are subject to physical destruction after replacement to protect data confidentiality, rather than repair and reuse. This demonstrates an awareness of, and adherence to, data protection principles in practice.
Research Questions
Research Question 1: What is the current level of performance in the after-sales spare parts supply chain, and how do failures to meet diverse Service Level Agreements (SLAs)—specifically CTR (6 h), SBD (Same Business Day), and NBD (Next Business Day)—quantify the overall service gap for new computer products?
Research Question 2: How does the complexity of the global warehouse network influence inventory management costs and service failure rates, particularly regarding the challenge of positioning parts optimally versus the overall stock availability?
Research Question 3: Which specific categories of spare parts and which lifecycle stages (e.g., Sustaining vs. End of Life) are the dominant drivers of untimely service requests, and how should this Bill of Material (BOM)-level criticality inform initial inventory and supplier strategies during the new product introduction phase?
Research Question 4: What strategic rationalization opportunities exist—including strengthening partnerships with top suppliers and optimizing the two-axis inventory hierarchy—to enhance customer satisfaction and stabilize the after-sales service flow?
4. Results
To measure the level of after-sales service for spare parts, customers’ warranty contracts for computer equipment are divided into three categories. The categories are according to the response and repair time specified in the contract. The response time starts from the time the damage is reported. These periods are indicated in the tables and figures created from the survey data with the abbreviation SLA—Service Level Agreement—and refer to the respective Service Level Agreement. For each service level agreement, targets are set for response by the producing company (which may differ from 100%—i.e., requests that may not be answered on time are allowed). The targets set in this way (targets in the figures and tables extracted from the data) make it clear whether the service provided is at a level that the company producing the computer equipment considers acceptable. The main groups of service conditions in all warranty contracts can be reduced to the following categories:
- (1)
CTR (Call to Repair): Provision of services by the manufacturer of computer equipment within 6 h of a warranty claim by the customer, indicating a defect in the product used. The manufacturer’s goal is to provide service to customers with contracts in this warranty group in 98% to 95% of cases. Non-compliance with the warranty conditions is only permitted in 2 to 5% of cases.
- (2)
SBD (Same Business Day): Provision of service by the manufacturer of computer equipment within the same business day of a customer’s request for a defect in the product used (replacement part). The company’s goal is to provide service at this warranty level in 94–92% of cases. Non-compliance with the warranty conditions is only allowed in 6–8% of the cases of requests.
- (3)
NBD (Next Business Day): Provision of services by the company that manufactures the computer equipment on the next business day following a request from the customer due to a defect in the product used. The company’s goal is to provide service at this warranty level in 93 to 90% of cases. Non-compliance with the warranty conditions is only permitted in 7 to 10% of cases.
The data obtained from the study shows that of all warranty service requests received (149,937 requests) from the 1572 computer equipment customers surveyed, 18,757 were not fulfilled within the agreed timeframe (measured in the study data as the period between the time a customer submits a request and the time the request is completed by the computer equipment manufacturer). This means that approximately 12.5% of warranty requests were not fulfilled in a timely manner. This percentage indicates that the level of customer service needs to be improved, and it is necessary to further analyze what proportion of unfulfilled requests are due to weaknesses in the spare parts supply chain. Untimely customer service is noted in the survey data as a “miss” (failure to meet the warranty period). All gaps in timely service are analyzed by the computer equipment manufacturer’s staff and included in the survey to clarify the reasons for the gaps and the weaknesses in the spare parts supply chain. On this basis, suggestions are derived to improve the spare parts SCM in setting up the after-sales spare parts supply chain in the market launch phase of the new computer product. The reasons for the provision or non-provision of a prompt after-sales service are grouped in the study according to functional groups as follows:
HIT—applications completed on time. This term denotes applications completed on time. Specifically, it refers to a timely response to the request within the agreed service level agreement (SLA) deadlines.
INFO (information)—a request for information that is not a signal of an actual error (system test, absence of an active warranty contract or another condition that is not a signal of a warranty event).
IT—information technology as a reason for untimely customer service (system crash, non-functioning software or other).
LG (Logistics)—this category includes all cases of untimely service provided by the logistics department of a company that manufactures computer equipment (this category mainly considers transportation activities).
LGIN (Logistics Information)—logistics software as a cause of untimely customer service.
OC (Order Creation)—systematic interruption of the order cycle as a cause of untimely customer service (system crash, failure to send a request to the relevant teams in time to provide the service, etc.).
SC (Supply Chain)—any activity along the supply chain that results in a lack of spare parts in the warehouse closest to the customer at the time the request is submitted.
WH (Warehousing)—delays in warehouses as a cause of untimely customer service (consolidation, packing, shipping, labeling, etc.).
The reasons described for the failure of timely customer service were analyzed to identify weaknesses in the spare parts supply chain. Therefore, the study focuses on the reasons for missed deadlines for warranty claims in the category “SC” (Supply Chain). This category includes all claims that are not processed on time because the correct spare part is not available in a warehouse near the customer at the time of the claim in order to carry out the warranty repair. The data from the study, shown in
Table 1 and
Figure 4, indicates that the majority of customer service requests submitted (67%) are from customers with warranty periods that require the manufacturer to resolve the request the next business day. It follows that more than half of the customer service requests relate to contracts that need to be processed within the next working day.
This could provide clues as to how to structure the warehouse network and highlight optimization opportunities for the location of stock, i.e., the parts supply chain could consider holding the majority of its stock in warehouses far enough away to ensure next day service and eliminate all or part of stock that is in close proximity to customers, unless those customers have contracts that require a shorter delivery time than the “next working day”.
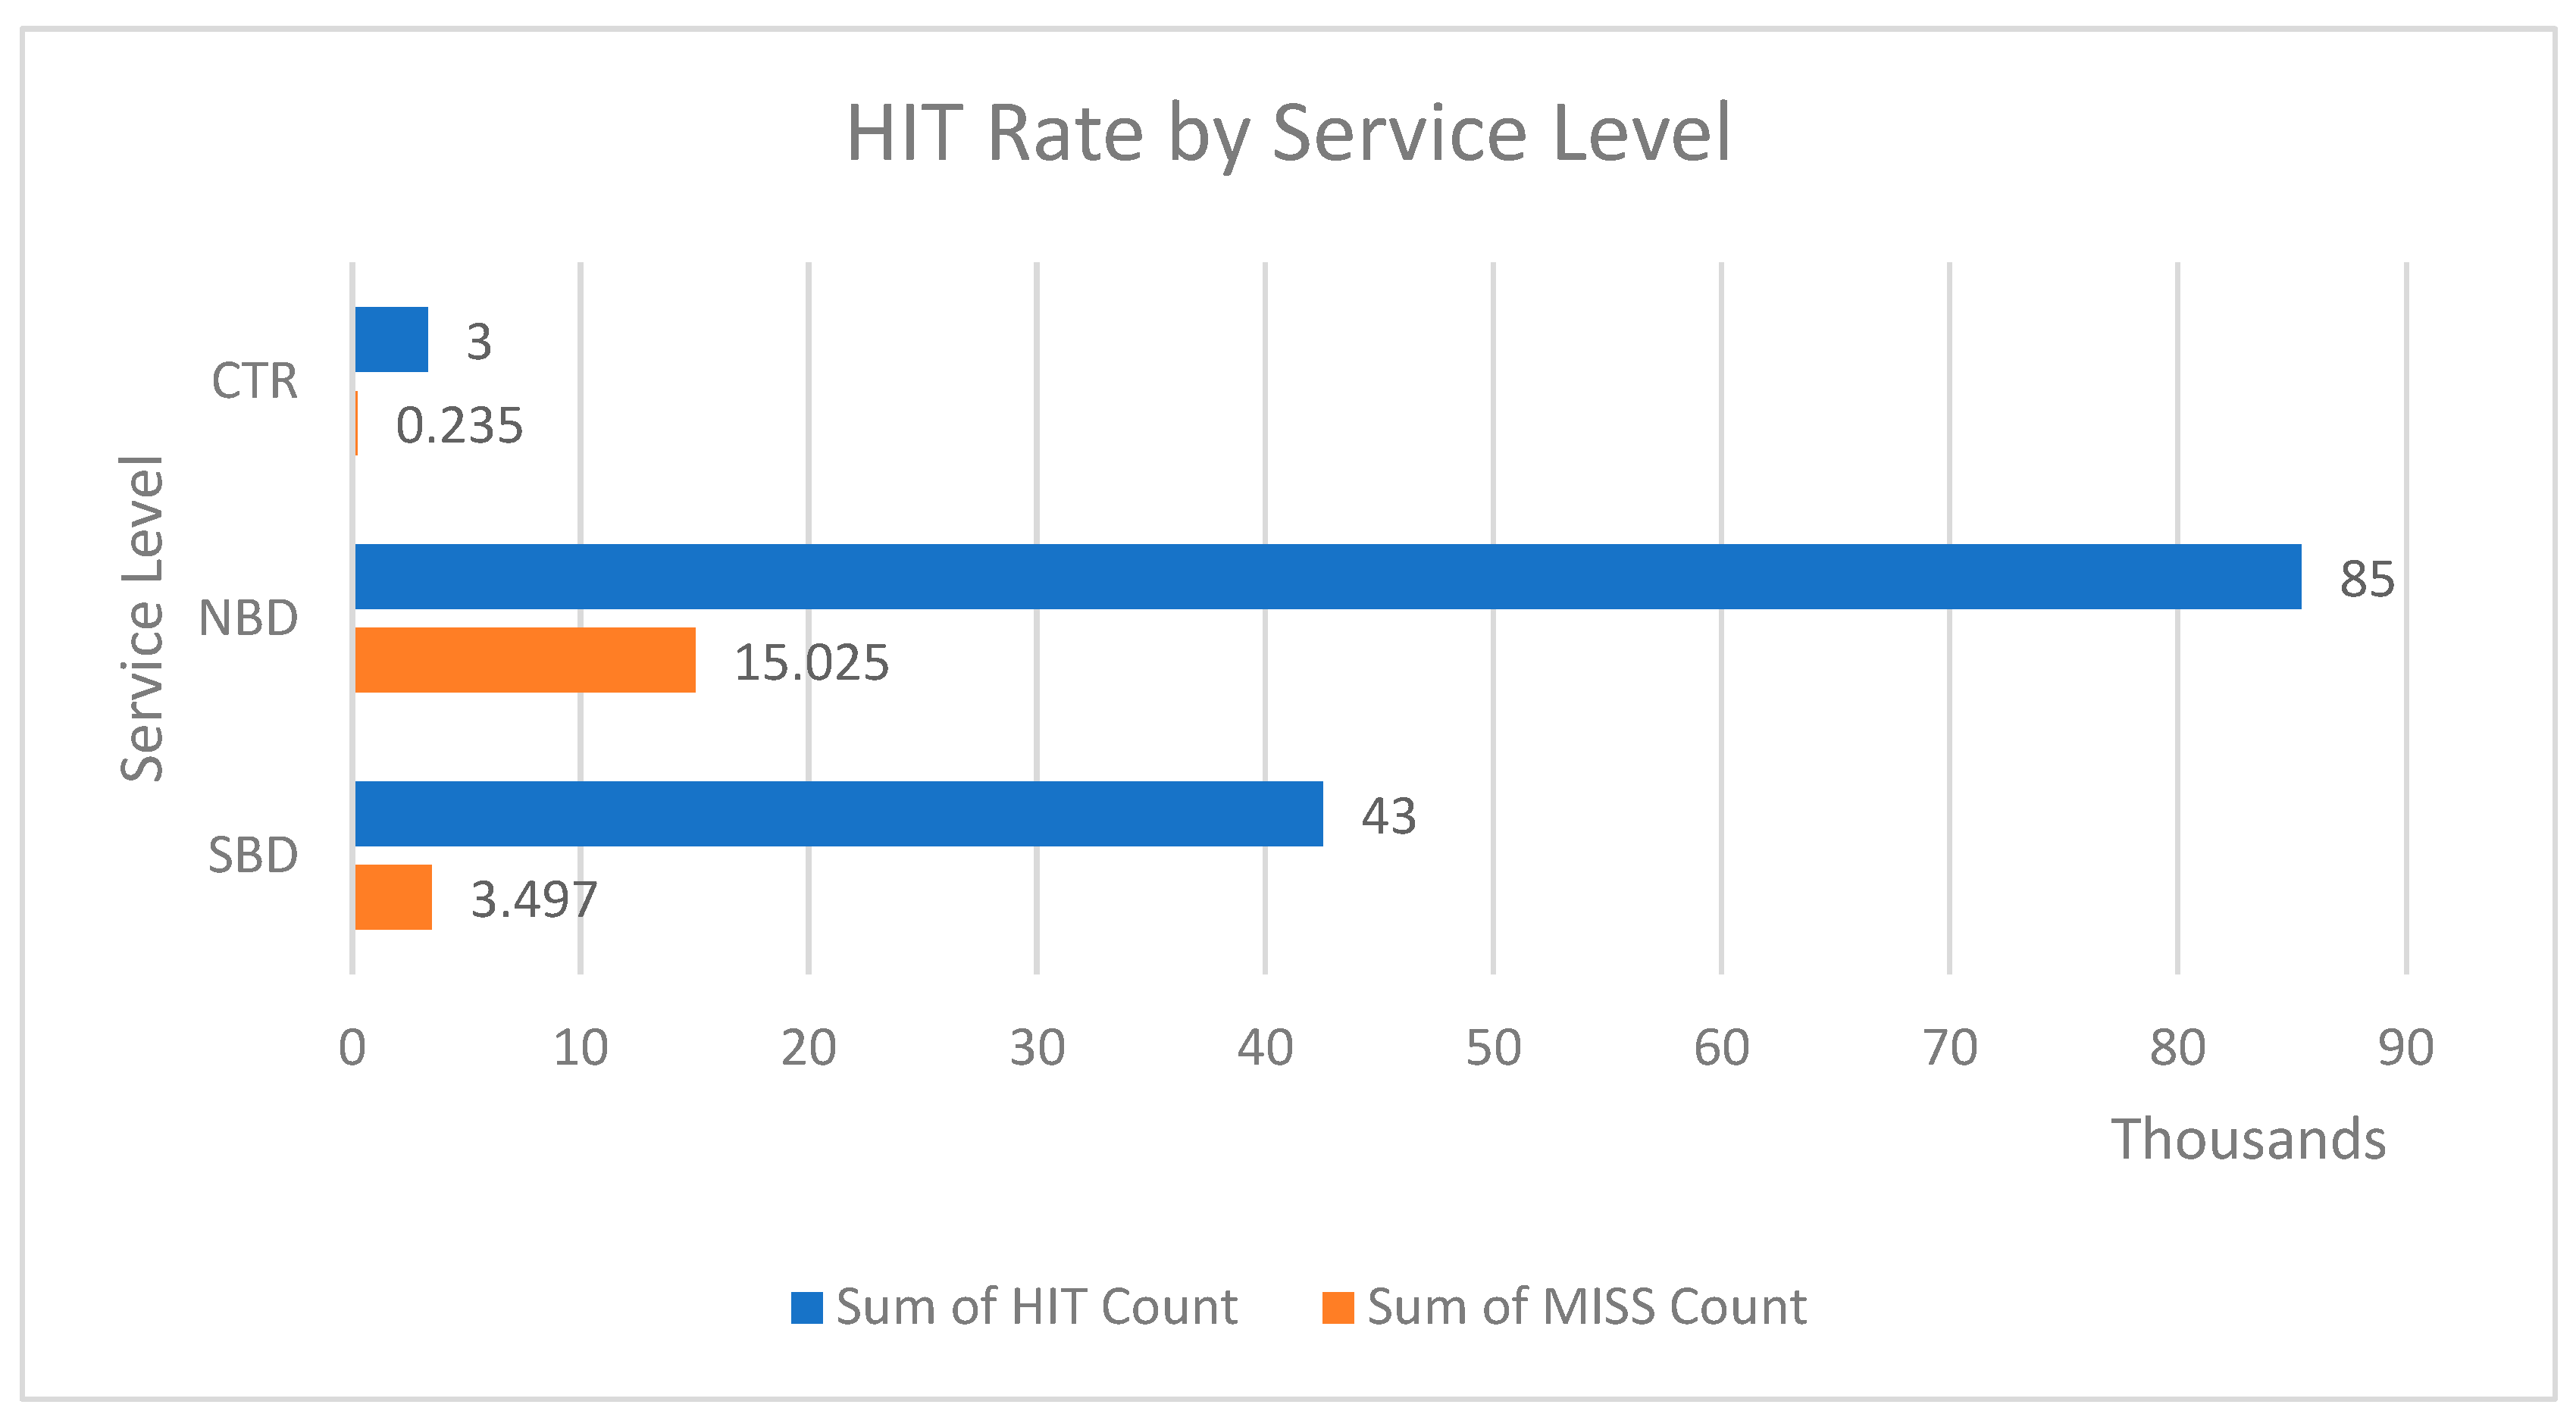
Table 2 and
Figure 5 show the extent to which the agreed service dates were met by the manufacturer of the computer equipment. From this, it can be concluded that all service requests are categorized as HIT (serviced on time) or MISS (missed warranty date) (Missing = 0, Valid Percent 100%). The following table (cross-tabulation) shows the two-dimensional distribution of service agreements (SLA Service Level Agreement) against the deadline within which the manufacturer responded to the request (HIT—timely response to the request, MISS—missed deadline, response with delay). The level of service achieved for SLA CTR is 3306, for SBD, it is 42,528, and for NBD, it is 85,408, but in the MISS category (irresponsible deadline for implementation by the company-manufacturer of computer equipment), SLA CTR is 235, SBD is 3497, and NBD is 15,025. This shows that in 6.6% of cases where a request was submitted by customers with a CTR service period, the request was not fulfilled on time. This percentage is 7.6% for customers with SBD contracts and 14.9% of all cases for customers with an NBD term.
By analysing the data using the two-dimensional frequency distribution, it can be concluded that the cases in which a customer service request is not answered on time are more than acceptable (compared to the targets set by the companies that manufacture computer equipment) and that there are opportunities to improve the spare parts supply chain by identifying its weak points.
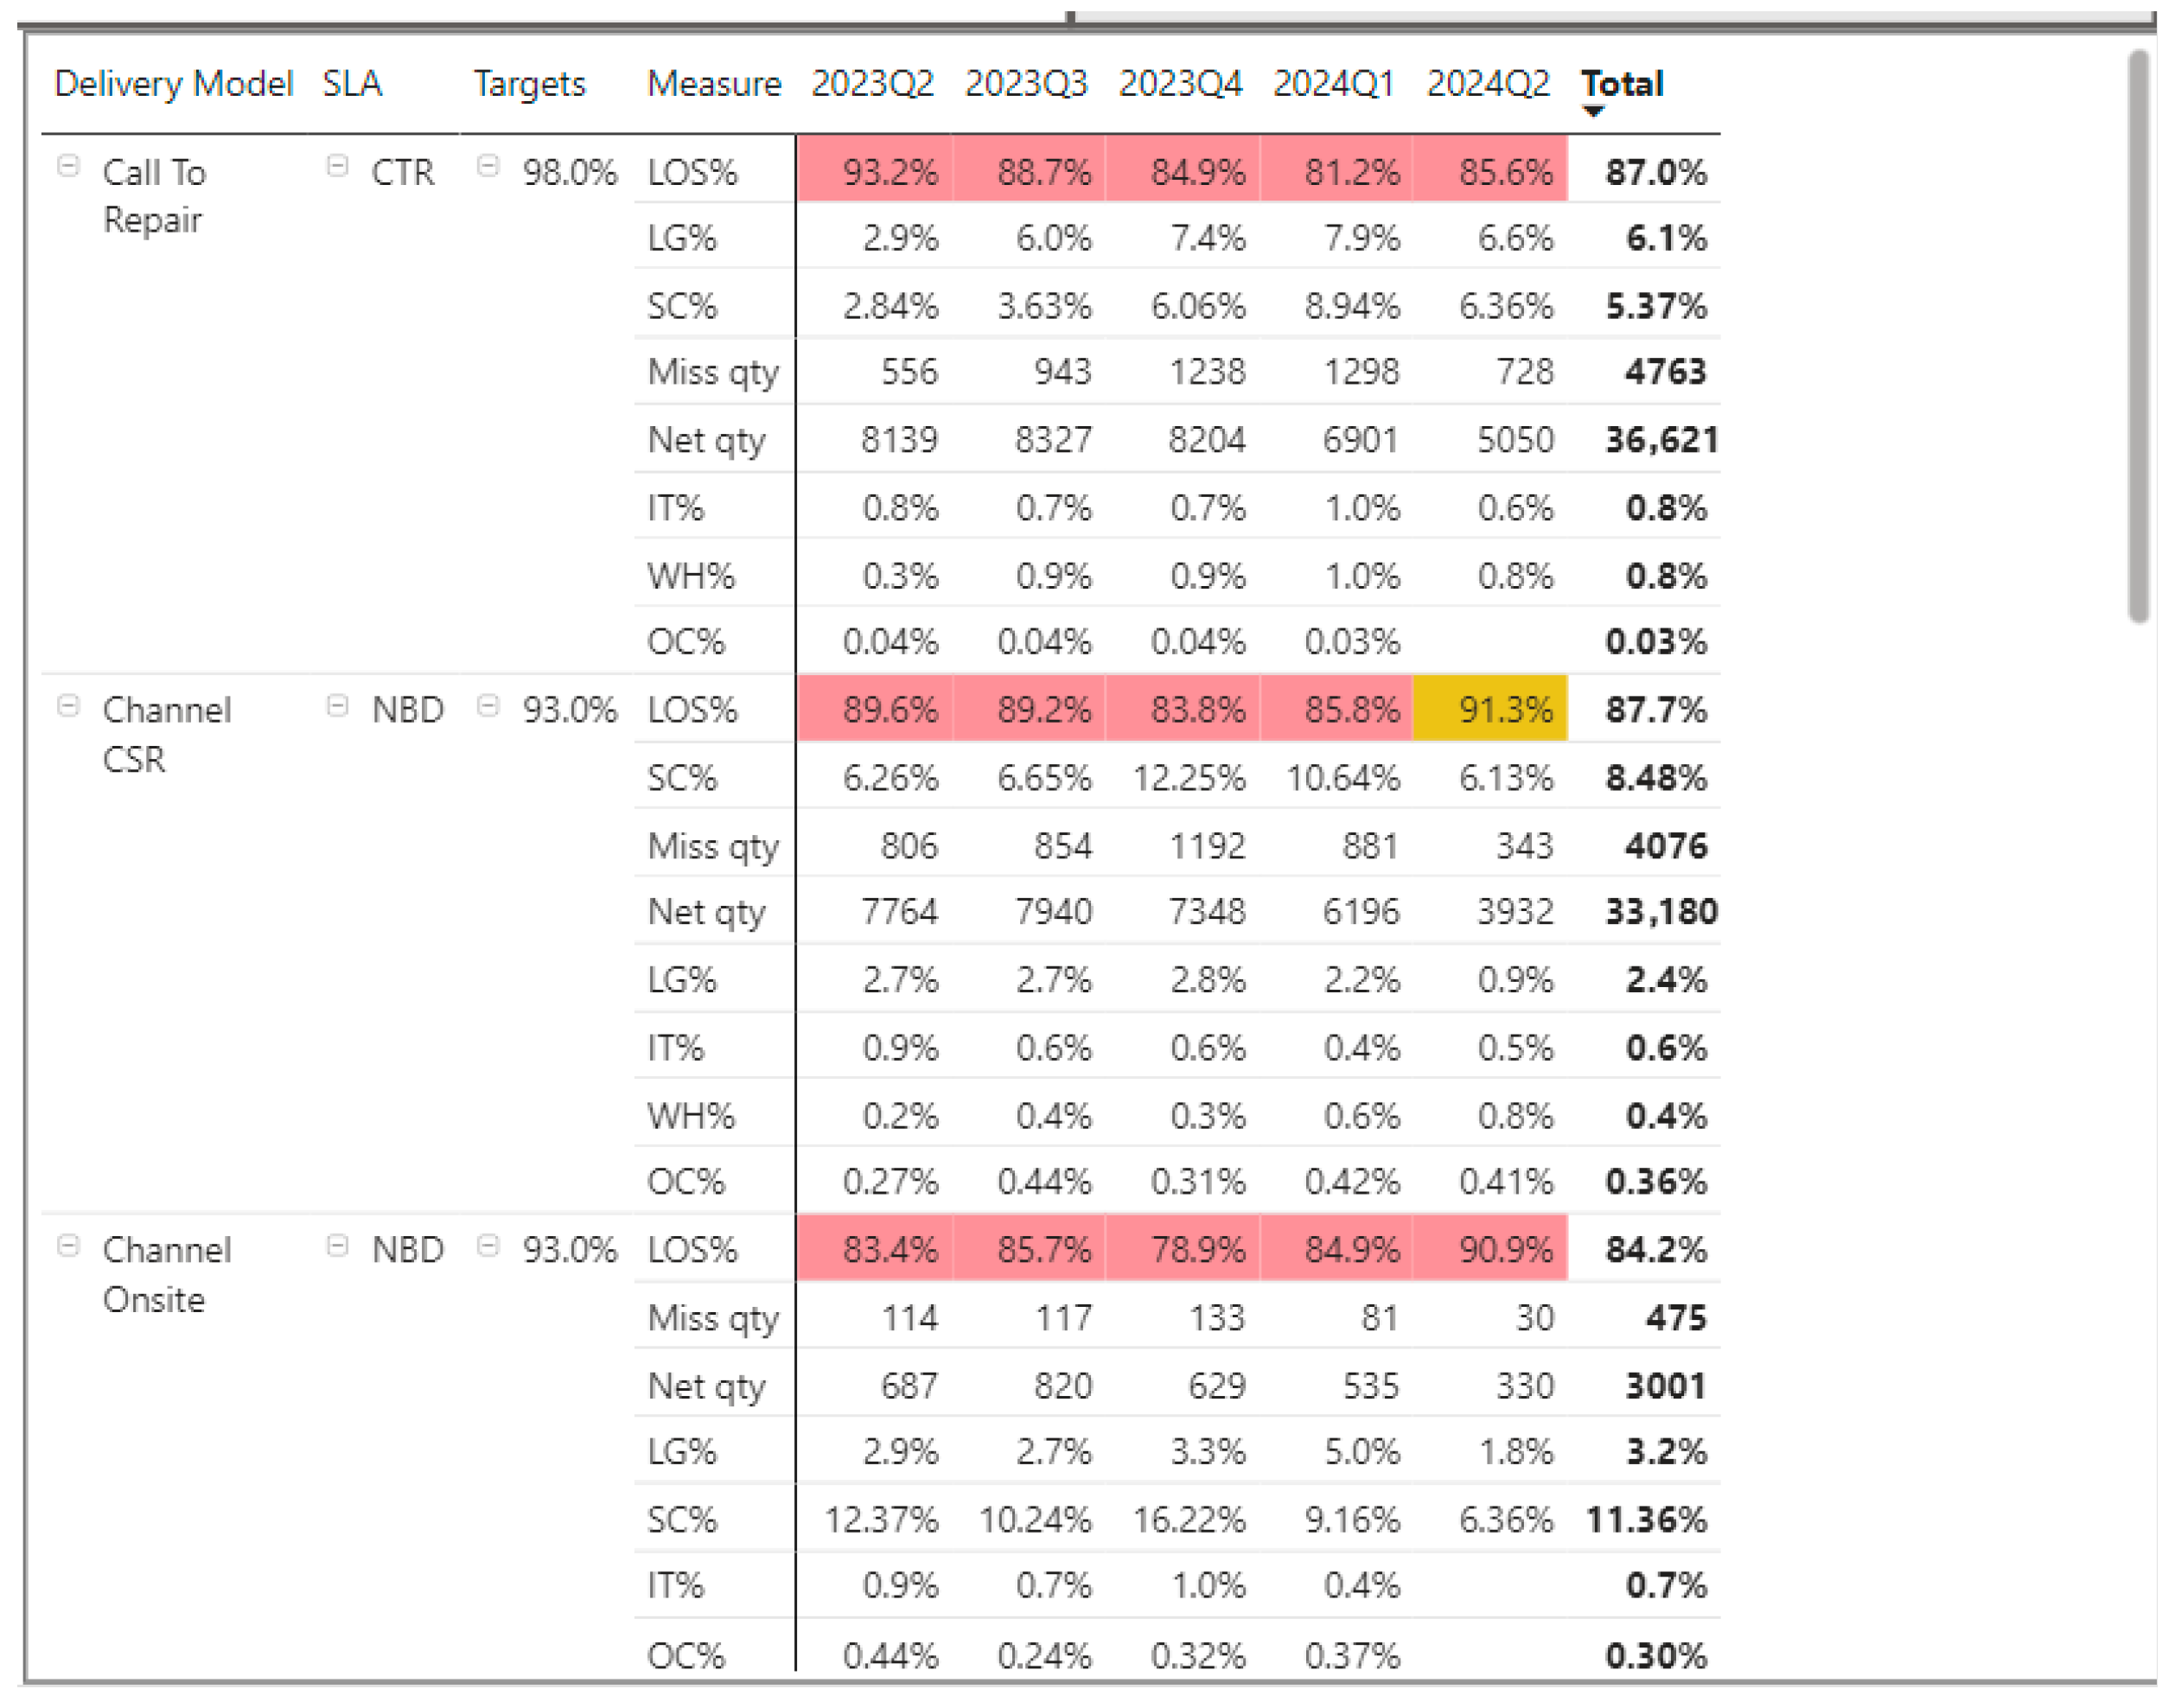
Figure 6 shows the results of the study in terms of the level of customer service achieved compared to the targets set by the computer equipment manufacturer. The targets can be seen in the Target column in
Figure 6. For example, for contracts (CTR call to repair) with a service time of 6 h after receiving a customer request, the computer manufacturer sets a target of meeting the expectation in 98% of cases (cases of warranty requests received over a period of one month), which is not achieved (compared to the data collected for the study period, the achievement is only 87% of cases). This data shows that the after-sales service of computer manufacturers needs to be improved in order to achieve the targets set for a satisfactory level of service. The opportunities for improvement are identified in the subsequent analysis of the collected data, which reveals the weak points in the spare parts supply chain.
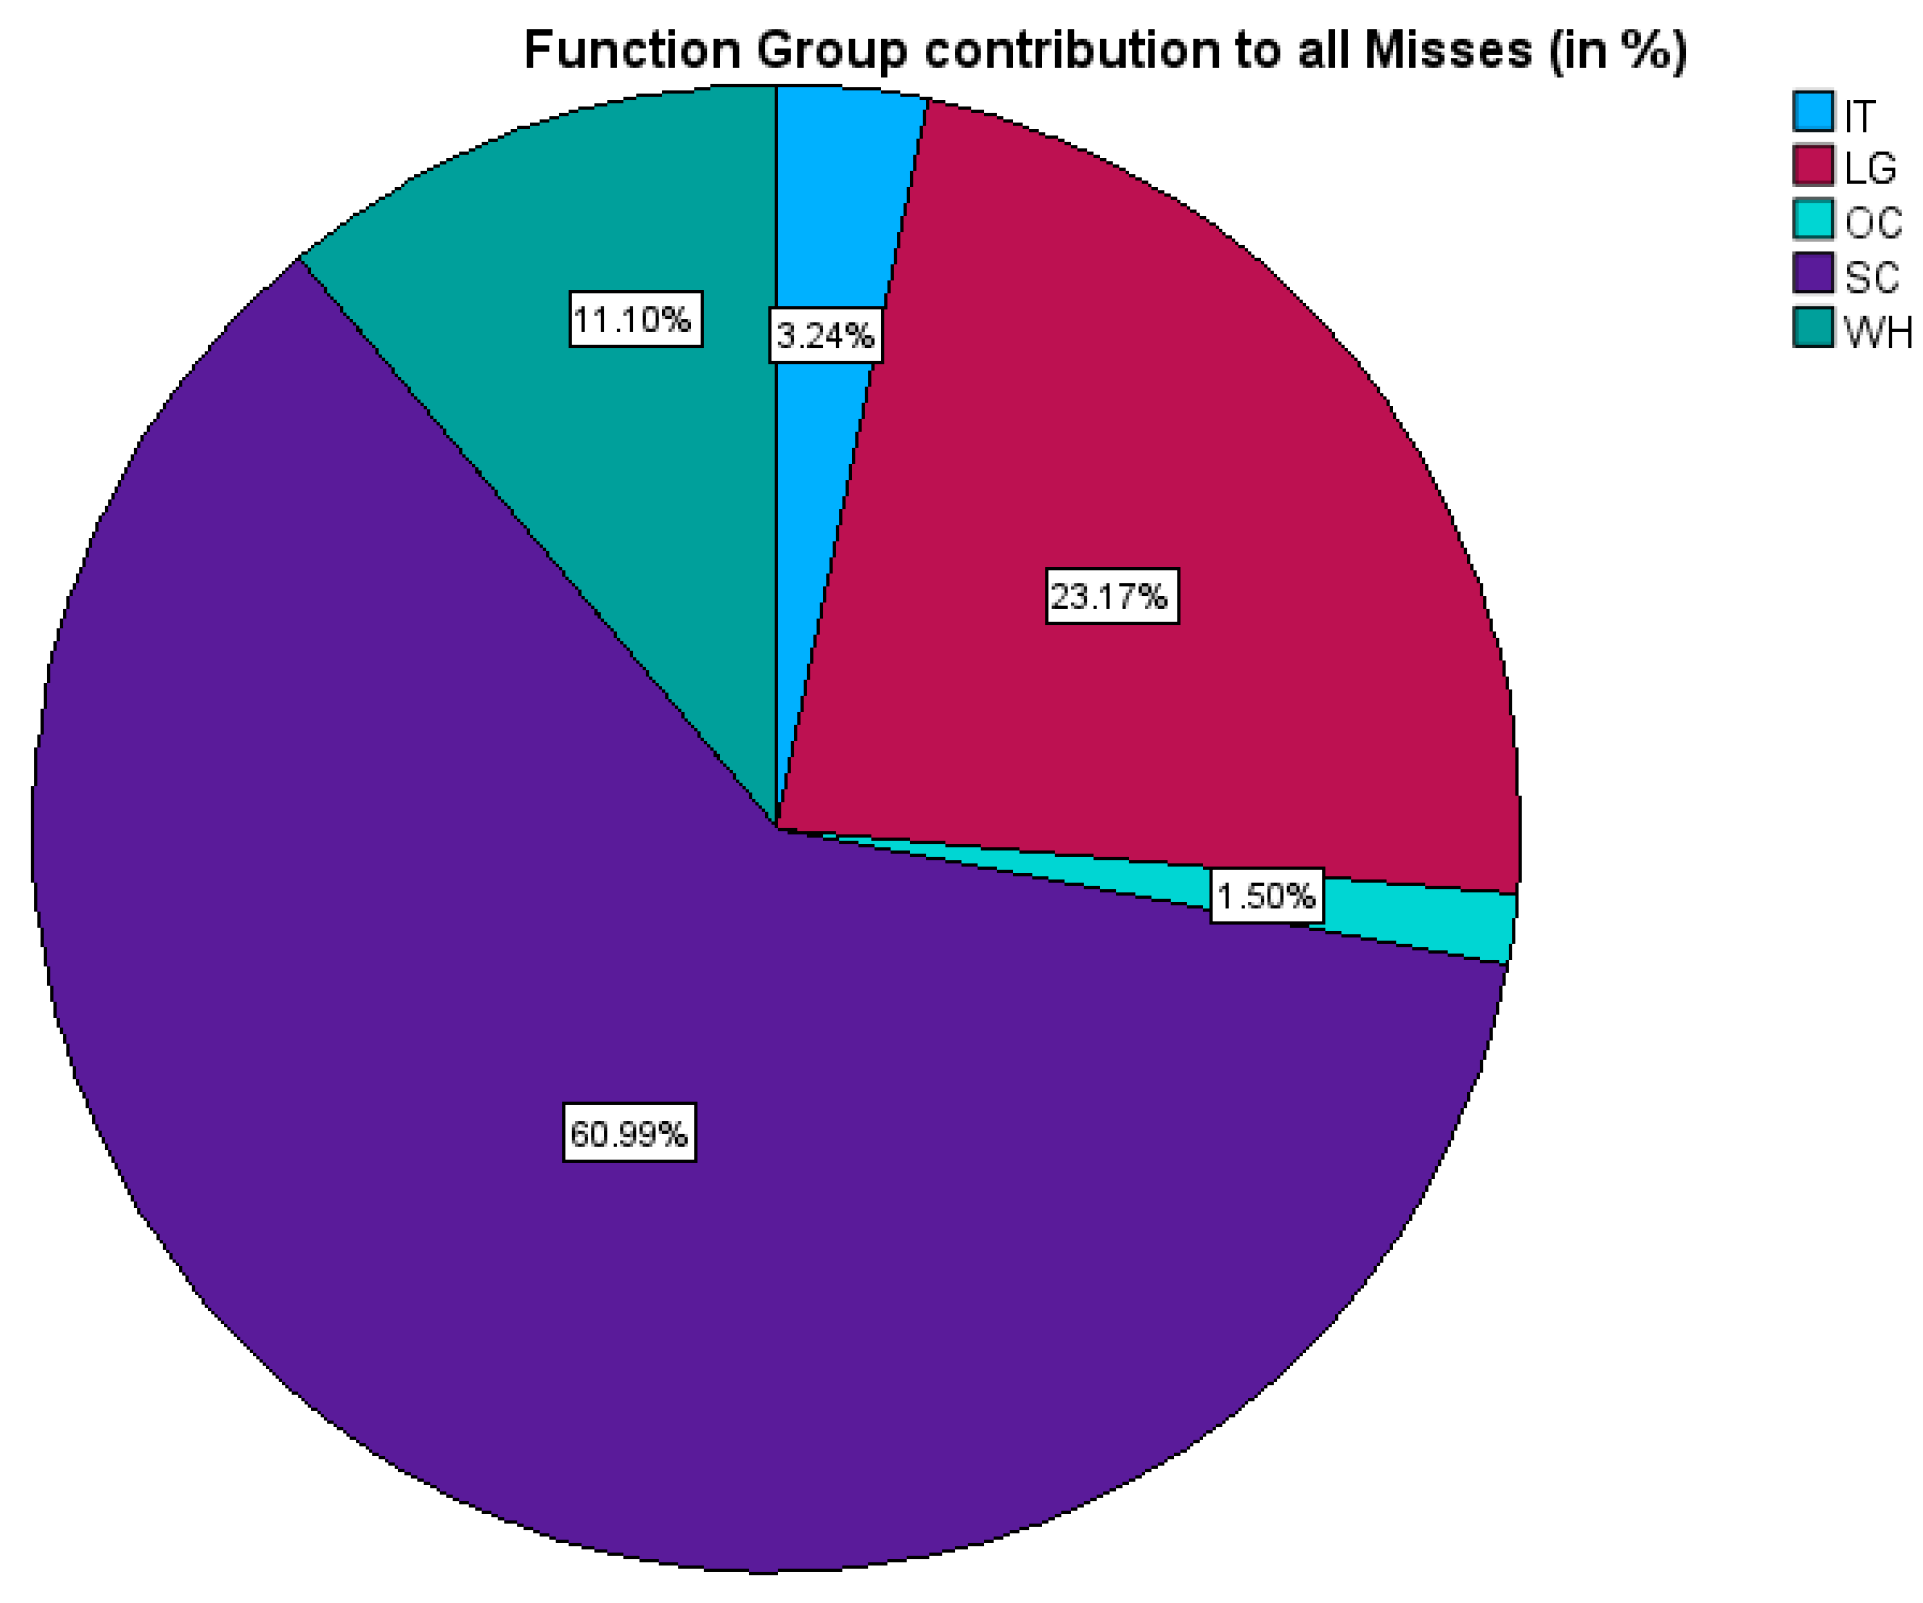
The reasons for unsatisfactory customer service and the role of the customer service supply chain are shown in
Table 3 and
Figure 7—Distribution of missed deadlines by reason (functional groups).
Figure 7 shows the distribution of untimely warranty service requests by root functional group (total missed: 18,757 cases). This clarifies the purpose and provides key context (total cases).
We will ensure that the interpretation clearly emphasizes that this figure visually represents the primary causes of the 12.5% (18,757 requests) of unfulfilled warranty services, as introduced in the earlier results.
- ○
We will explicitly state that the figure breaks down the proportion of missed deadlines attributable to different functional areas.
- ○
We will re-emphasize that the “SC (Supply Chain)” category is the dominant factor, accounting for 60.99% (11,439 cases) of all untimely requests, making it the most critical area for intervention.
- ○
We will highlight the combined impact, noting that almost 96% of all service failures originate within the broader supply chain functions (SC, LG, WH, OC).
- ○
This will explicitly tie the figure to the overall service performance and the significant role of the supply chain.
Next, the complexity of the spare parts supply chain is analyzed in terms of the number of warehouses, components, materials, and spare parts suppliers that computer equipment manufacturers work with. This analysis could give an idea of how complex the relationships with third parties along the chain are and how extensive the processes are. It examines the number and type of spare parts that flow through the chain on a daily basis and are required for after-sales service. By identifying the main elements in each category to be analyzed, the weak points along the chain and the most frequent cases of spare parts shortages are determined in order to identify opportunities for improvement. Analysis of the data obtained can indicate areas that require optimization or streamlining of the supply chain.
From the research conducted and the data obtained, conclusions could be drawn about the complexity of the computer equipment manufacturers’ warehouse network. The research data shows where the warehouses are located from which a spare part is sent to process a warranty claim. Considering that each customer service case requiring a spare part is processed from the nearest warehouse, depending on the warranty deadlines of each customer (repair with a spare part up to 6 h after the request, within the same working day or the next working day), the data makes it possible to group the warehouses by location and identify opportunities for optimization or rationalization. The survey data (confirmed in the case study) shows that computer equipment manufacturers have central warehouses in the three main regions of the world (AME—Americas, EMEA—Europe/Middle East/Mediterranean/Africa—Europe, Middle East, Mediterranean, Africa and APJ—Asia Pacific). These warehouses are divided into three main types:
Central—Central warehouse: one warehouse per region from which the warehouse network in the respective region is served;
CHUB—central warehouse for a specific country, from which all smaller regional warehouses in a country are served (applies to countries with a large stock turnover);
FSL (field stock location)—regional warehouse serving customers in a specific region or major city.
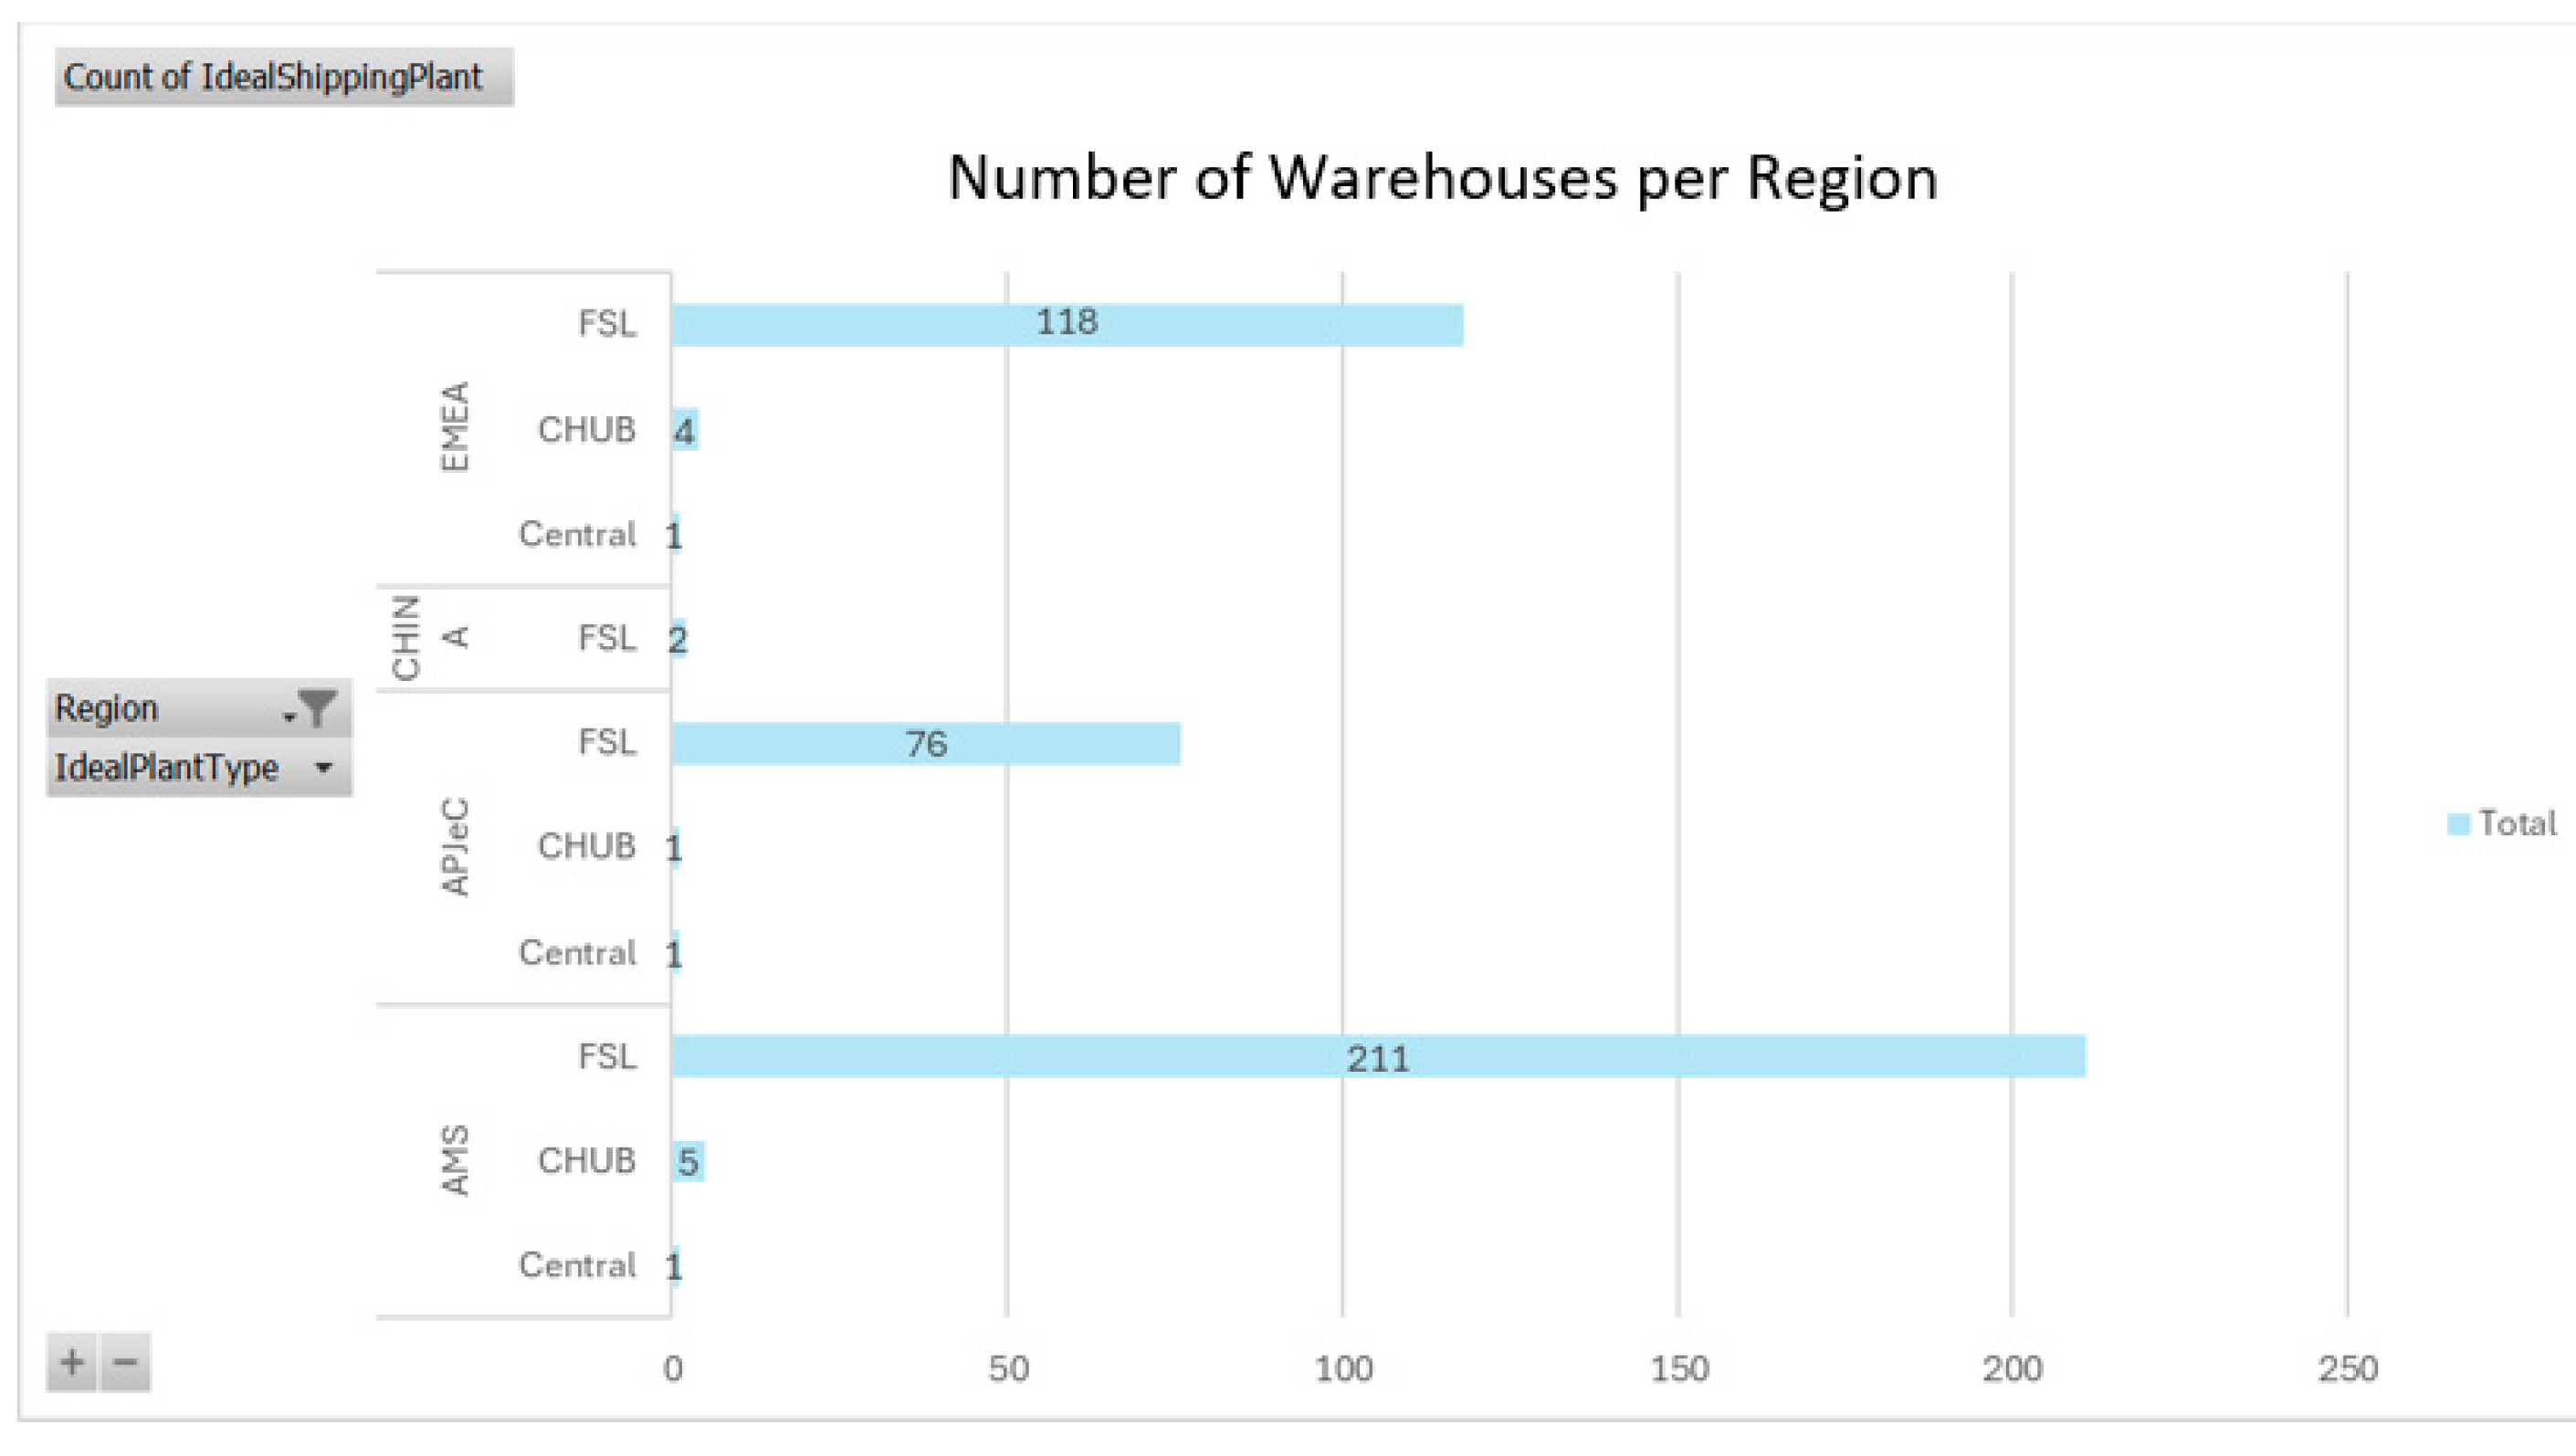
The data in
Figure 8 show that the respondents were supplied with a spare part during the period under investigation, which was sent to them from a total of 420 different warehouses around the world. A large proportion of the warehouses that supplied the spare part in the event of a warranty claim (a total of 217 warehouses or 51.6% of all warehouses that sent a spare part) are located in the Americas region (North and South America and Canada). 97% of them (211 out of a total of 217 warehouses) are regional (FSL). A similar distribution can be observed for the EMEA and APJ regions—the warehouses that have provided warranty services in the form of spare parts are mainly regional (FSL type), 96% for EMEA and 97% for APJ. From this data, it can be concluded that the after-sales service of the companies manufacturing data processing equipment is mainly provided from the spare parts stock in the regional warehouses. The need for regional warehouses to provide spare parts arises from the fact that the spare parts needed for after-sales service must be placed as close as possible to the customer so that they reach them in time to repair warranty claims. Considering the cost of inventory, the obsolescence of spare parts in the IT industry and the positioning of spare parts close to the customer, computer equipment manufacturers’ inventories are increasing as the same spare parts are stored in many different regional warehouses. This suggests that there are opportunities to optimize inventories, particularly in terms of where and what type of spare parts should be stocked to ensure timely customer service. These weak points in the chain (namely, holding large stocks of identical spare parts in many regional warehouses) offer opportunities for improvement through optimization and rationalization.
The data collected as part of the study provides information on the manufacturer of each spare part used by the company for customer service. Spare parts manufactured by an in-house factory are usually labelled with a code beginning with “DIV” division. The other parts bear the name of the company that manufactured the spare part in question. To identify the most frequently requested spare parts for warranty service, a Pareto analysis (
Figure 9) of computer equipment supplier manufacturers was conducted. This would help to identify the exact partners with whom corporate computer equipment manufacturers should develop strategic partnerships. Three main groups of suppliers emerge with which the computer equipment manufacturers work and which are responsible for the production of 75% of the requested spare parts during the study period:
Foxconn ranks first as a manufacturer of spare parts that are in demand for after-sales service. The company is an ODM, but also a kitting partner of companies that manufacture computer equipment for the education sector, which means that some of the parts labelled as made by Foxconn actually come from a Tier 3 supplier with which the companies that manufacture computer equipment have no direct relationship, but indirectly—through Foxconn Kitting, which buys components from a Tier 3 supplier and assembles them according to the requirements of the companies that manufacture computer equipment.
“DIV” or spare parts manufactured in an internal factory for the company;
“Acction Technology Corporation” ranks third among the manufacturers of spare parts requested for warranty service during the period under review.
It follows that where the company needs to look for optimization and rationalization opportunities to improve the after-sales supply chain for spare parts, efforts should be focused on building strategic partnerships and opportunities to rationalize the warehouse network, building more stable relationships and the ability to supply spare parts directly from the manufacturers of the spare parts in question to the customer.
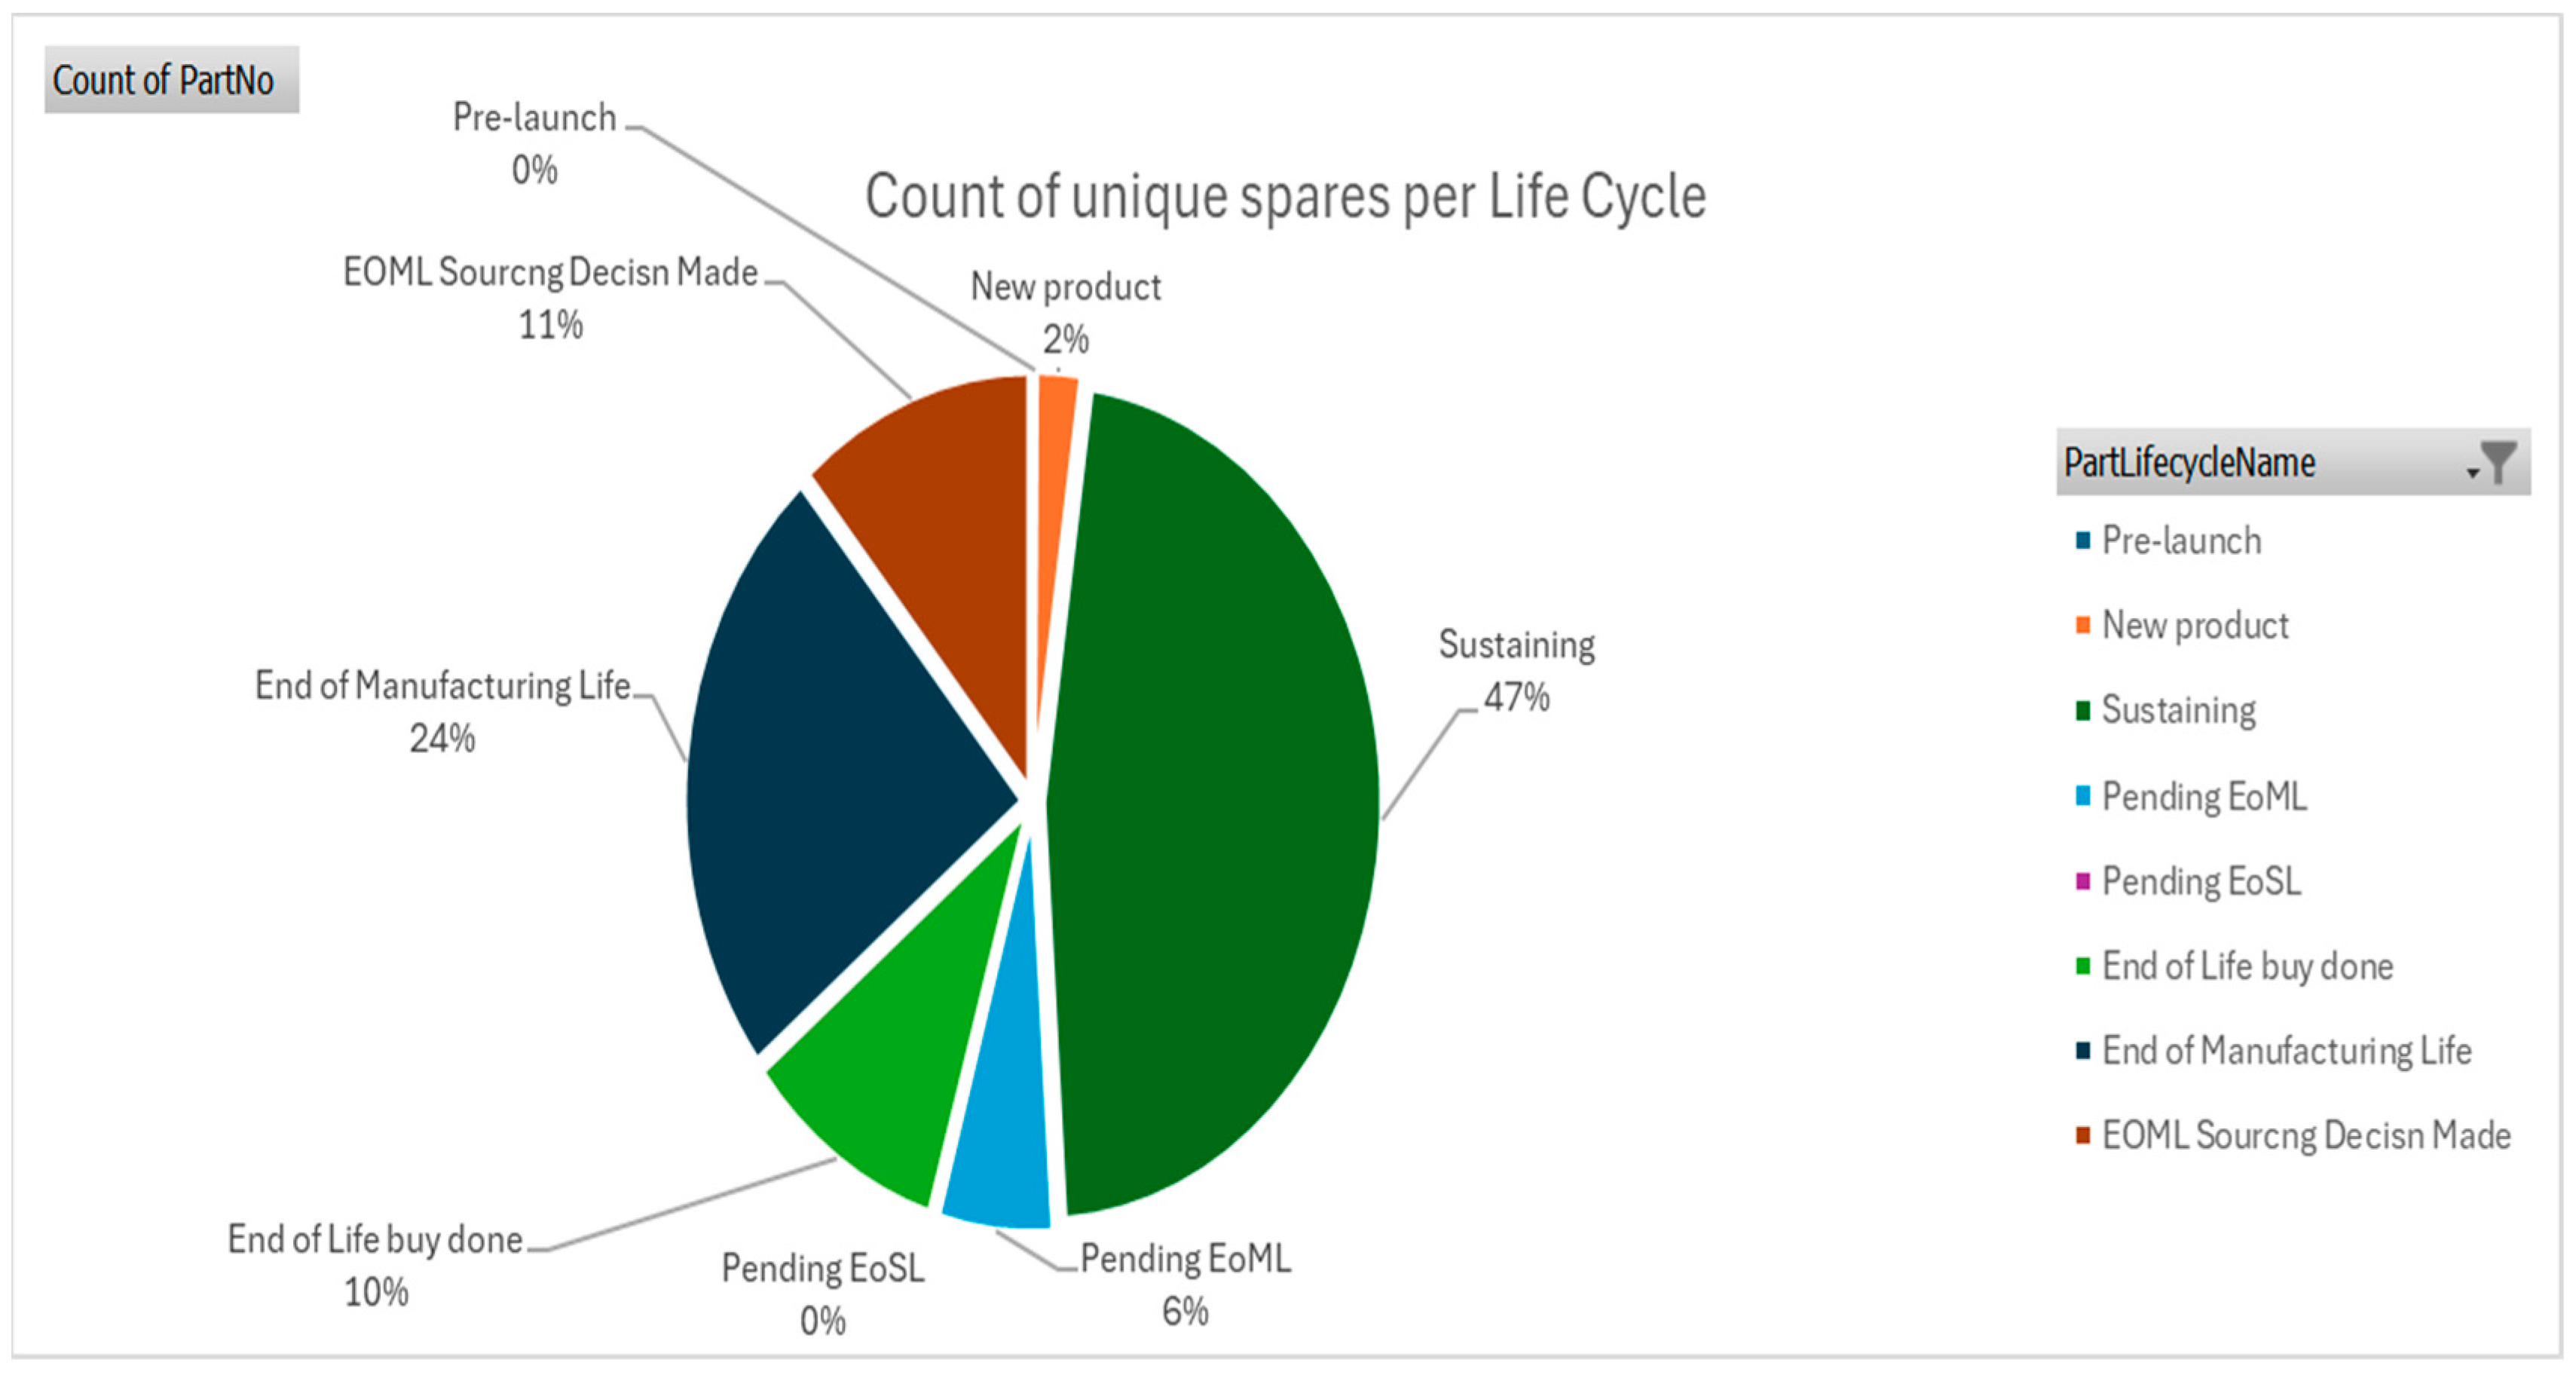
The data presented (
Figure 10) show that the companies producing data processing equipment used 10185 different spare parts for after-sales service. 47% of the parts used are in a growth period (Sustaining), are produced by the manufacturer-supplier and no difficulties are expected in providing these parts and keeping them in stock. 24% of the parts are no longer manufactured (end of manufacturing life), but are still in demand for warranty services as part of concluded customer service contracts. As a rule, these parts are no longer produced as they are not used for the manufacture of end products and the level of demand does not justify the supplier’s costs for the continued production of these parts. In these cases, the spare parts manufacturers rely on the stocks in the company’s or supplier’s warehouses to provide after-sales service under contract for products that are no longer manufactured. 11% of parts are marked as “EoML procurement decision made”, which means that the supplier has made the decision to discontinue production of these parts, but will do so at a later date. The spare parts companies must take measures for the future consumption of these parts, i.e., they do not extend after-sales service contracts or sell their available spare parts. 10% of the spare parts used are “end of life” spare parts, which means that stocks are limited and increasing the use of these parts for after-sales service would jeopardise the future availability of stocks. Therefore, almost half of the spare parts used for after-sales service are in the sustaining phase, assuming that they are available and there are no difficulties in obtaining them (sustaining), while the other half are spare parts that are at the end of their life cycle and where there would be difficulties in obtaining them for warranty service. Only about 2% of the parts are in the initial phase and are put into circulation to support the company’s newly launched products. This highlights a weakness in the spare parts supply chain—the difficulty in maintaining and sourcing spare parts that are at the end of their life cycle.
Figure 11 shows the number of service requests for after-sales service by spare parts and the service level achieved as a percentage (the curve running through the bar chart expresses the percentage of requests completed on time). Although there are no drastic changes in the volume of spare parts requests, the service level falls sharply from the second half of the period under review (2023), only to rise again slightly at the beginning of 2024.
In order to understand whether service levels have fallen only for certain customers grouped by customer service contract, the curves of customer service provided (as a percentage of completed requests compared to the total percentage of requests received) and by type of customer service contract (CTR 6 h Call to Repair—service within 6 h of receiving the request, SBD—service within the same working day and NBD within the next working day) are derived (
Figure 12). The conclusions that can be drawn from this are that the level of service follows the same trend regardless of the type of contract. This shows that it is necessary to look for the reasons for unsatisfactory after-sales service in the absence of a spare part.
According to the analysis, the cause of the unsatisfactory customer service is to be found in the supply chain, more precisely in the spare parts that pass through it. To do this, it is necessary to analyze the data from the study and deduce which specific spare parts were most in demand, as well as the weak points and opportunities for improving the spare parts supply chain.
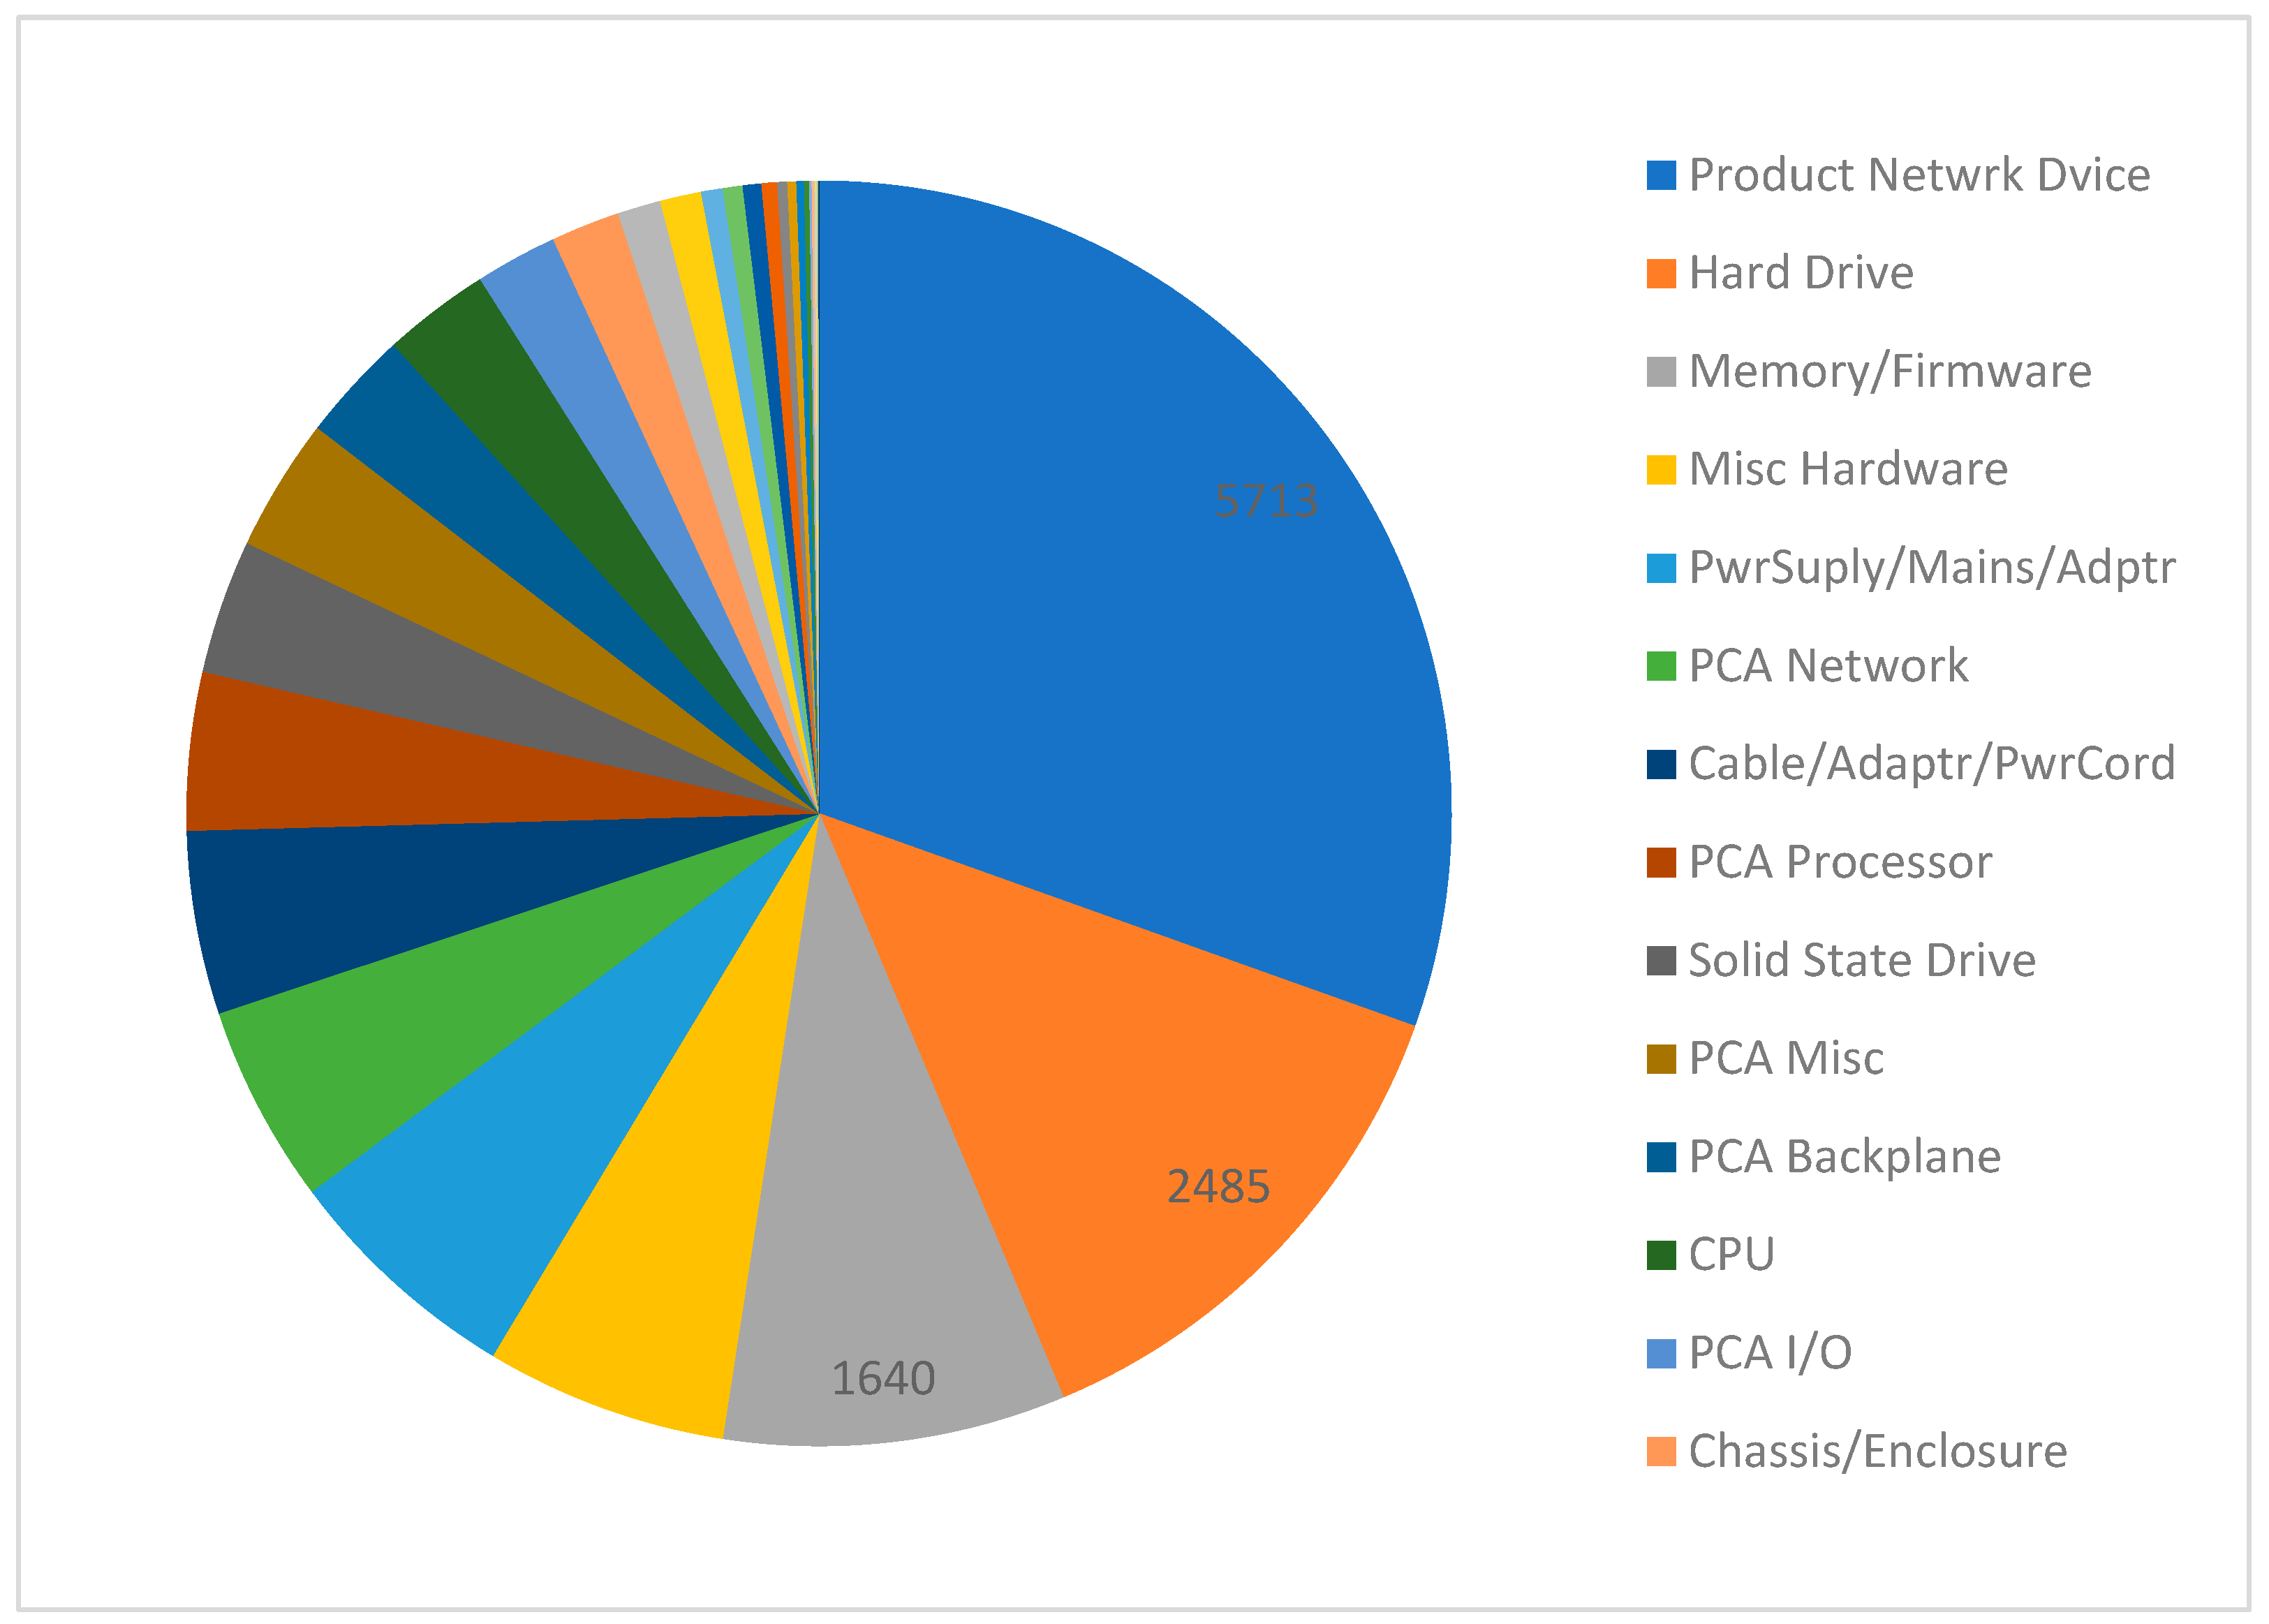
Figure 13 provides a Pareto analysis of the specific spare part categories most frequently associated with untimely service. We will elaborate on the significance of the top three categories (power supply, hard drives, and memory), collectively responsible for 52% of all unfulfilled after-sales service requests due to spare part issues.
We will stress that identifying these specific parts (5713 cases for power supply, 2485 for hard drives, 1640 for memory) allows for targeted improvement strategies, such as optimizing inventory, securing supplier relationships, or re-evaluating sourcing for these critical components.
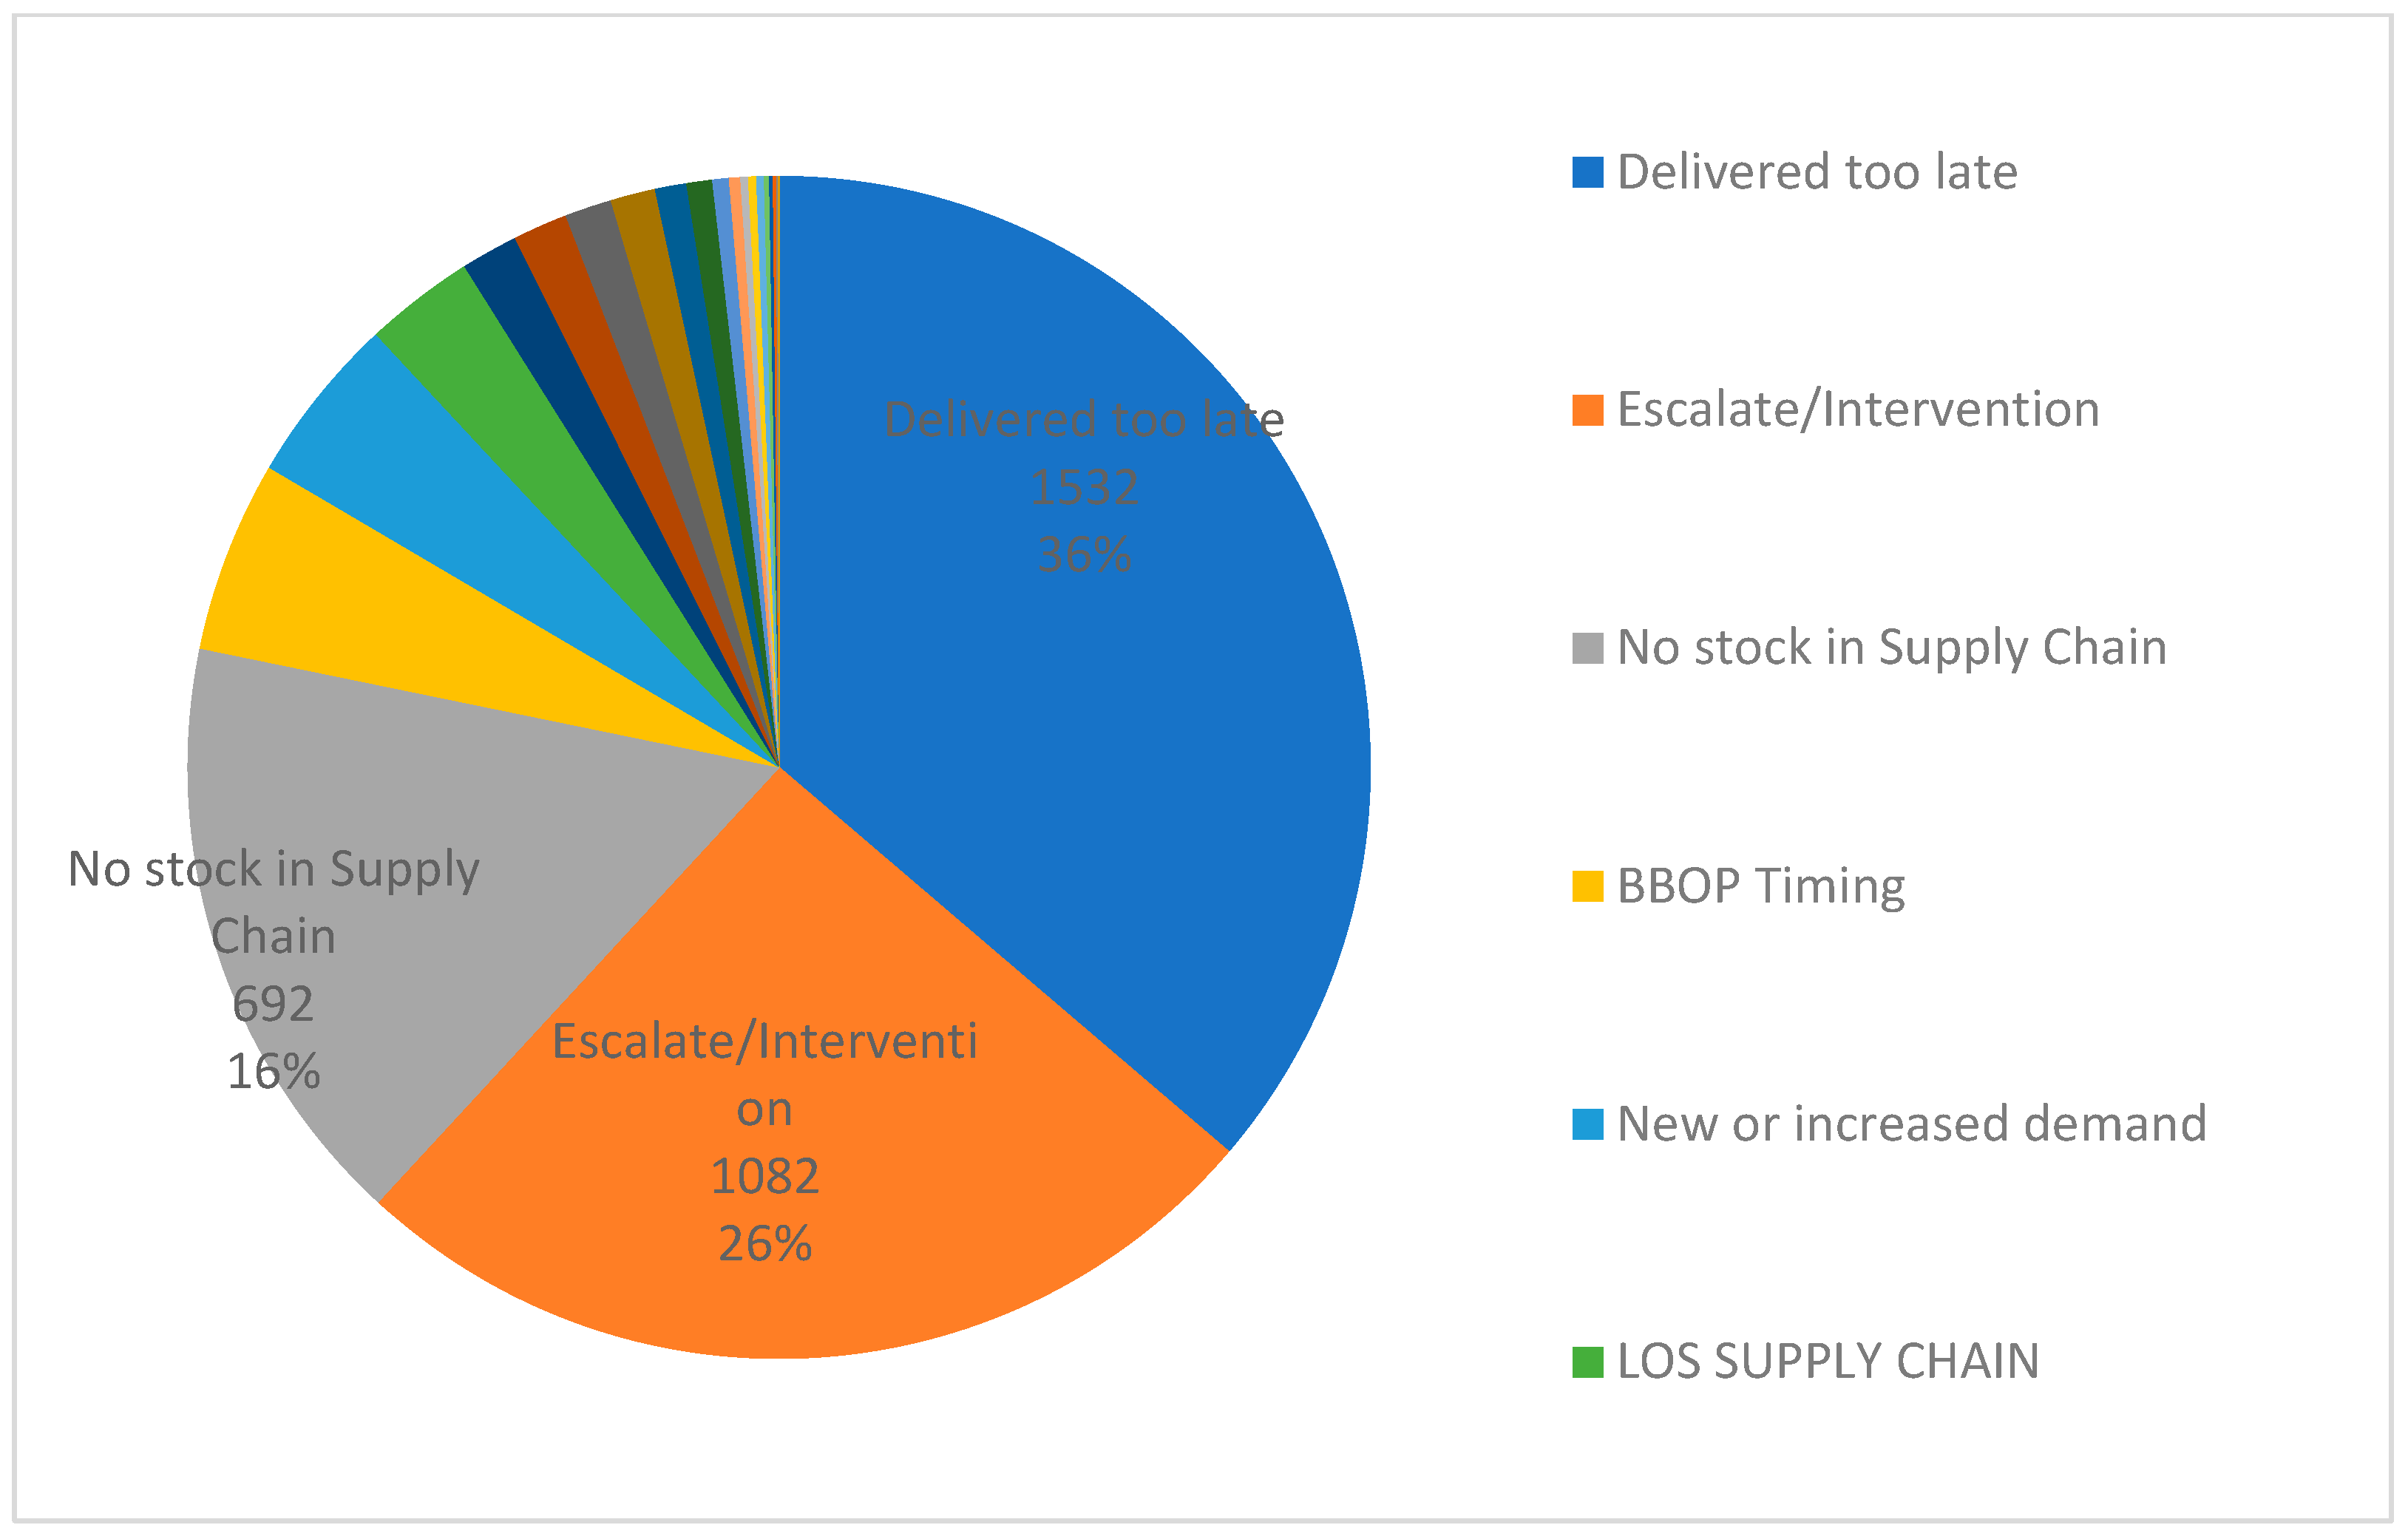
Figure 14 delves deeper into the specific causes underlying the failures categorized under “SC (Supply Chain)”.
The three main reasons collectively account for 78% of all unanswered requests due to spare parts issues.
- ○
For “Delivered too late” (36%), this indicates a systemic problem of suboptimal stock positioning or inefficient local logistics/warehousing, even when the part is globally available, affecting timely delivery.
- ○
For “Escalation/intervention” (26%), this is a symptom of rigid or inefficient inventory management systems that require manual workarounds, which still often fail to prevent missed deadlines.
- ○
For “No Stock in Supply Chain” (16%), this is a critical systemic inventory planning or sourcing failure, especially given the vast global network of over 400 warehouses.
It can be deduced that in 62% of the cases where timely after-sales service was missed due to the spare parts supply chain, the relevant spare part was available in the warehouse network, but not close to the customer (not stored in a suitable location), to achieve the expected level of after-sales service in time. In 16% of cases of missed timely service, the spare part was not available throughout the company’s warehouse network.
The study on the spare parts supply chain for new computing products revealed several key results regarding after-sales service performance and supply chain weaknesses:
Overall Service Performance: Out of 149,937 warranty service requests, 18,757 (approximately 12.5%) were not fulfilled within the agreed timeframe, indicating a need for improvement in customer service.
Service Level Agreement (SLA) Compliance:
For CTR (Call to Repair—6 h) contracts, 6.6% of requests were not fulfilled on time, falling short of the 95–98% target (achieved only 87%).
For SBD (Same Business Day) contracts, 7.6% of requests were untimely, against a 92–94% target.
For NBD (Next Business Day) contracts, 14.9% of requests were missed, compared to a 90–93% target.
The majority of requests (67%) were for NBD service, suggesting that the warehouse network might be optimized for next-day service, potentially at the expense of faster delivery for other contracts.
Reasons for Untimely Service: The primary reason for missed deadlines was related to the spare parts supply chain (SC), accounting for 60.99% (11,439 out of 18,757) of all unfulfilled warranty requests. Other contributing factors included logistics/transportation (LG) at 23.2%, warehousing (WH) at 11.1%, and order creation (OC) at 1.5%.
Impact of the Supply Chain: Almost 96% of the failure to provide timely after-sales service was attributed to the supply chain (SC, WH, OC, and LG combined).
Warehouse Network Complexity:
Computer equipment manufacturers utilize a network of 420 different warehouses globally.
The majority are regional (FSL—field stock location) warehouses, especially in the Americas (97% of 217 warehouses), EMEA (96%), and APJ (97%).
This distribution indicates a strategy to position spare parts close to customers for after-sales service. However, it also leads to increasing inventories and potential obsolescence due to stocking identical spare parts in many regional locations, highlighting optimization opportunities.
Spare Parts Suppliers: Three main groups of suppliers were responsible for 75% of the requested spare parts:
Foxconn ranked first, often acting as an ODM and kitting partner.
“DIV” refers to spare parts manufactured in an internal factory.
Acction Tehnology Corporation ranked third.
Efforts to improve the after-sales supply chain should focus on building strategic partnerships with these main suppliers.
Spare Part Lifecycle:
Of the 10,185 different spare parts used, 47% were in the “Sustaining” (growth) phase, meaning they are readily available.
However, a significant portion was at the end of their life cycle, posing difficulties: 24% were “end of manufacturing life,” 11% had an “EoML procurement decision made,” and 10% were “end of life” with limited stocks.
Only about 2% of parts were in the initial phase for newly launched products.
This highlights a weakness in maintaining and sourcing end-of-lifecycle spare parts.
Specific Weak Points by Spare Part Category: The top categories of spare parts causing unfulfilled after-sales service requests were:
Power supply (product power supply): 30% of cases (5713 cases).
Hard drives: 13% of cases (2485 cases).
Memory (Memory/Firmware): 9% of cases (1640 cases).
Reasons for Missed Deadlines due to Spare Part Issues:
“Delivered too late” accounted for 36% of cases, meaning the part was available but did not reach the customer in time due to issues like improper storage location, warehouse delays, or transportation problems.
“Escalation/intervention” (manual override by an employee to access a part) was 26% of cases, where even intervention did not prevent a missed deadline.
“No Stock in Supply Chain” represented 16% of cases, indicating a complete lack of the required spare part across the entire global warehouse network.
In 62% of missed timely services due to the spare parts supply chain, the part was available but not suitably located near the customer. In 16% of cases, the part was entirely unavailable.
These findings collectively demonstrate that the after-sales supply chain for spare parts is a critical factor influencing customer satisfaction and the company’s image, often being an overlooked area despite its importance.
The most unique and theoretically relevant contribution of this study lies in its empirical quantification of failure attribution in the specific context of New Product Introduction (NPI) for ICT spare parts, specifically linking SLA failure rates to physical inventory positioning and lifecycle stage. While existing literature acknowledges the importance of after-sales service for customer satisfaction and the challenges of managing spare parts with long warranty periods, this study provides original results by analyzing 149,937 warranty requests related to 116 new products and 839 spare parts over a one-year period. It explicitly identifies that 96% of all untimely requests were attributable to the supply chain (SC, LG, WH, OC), with 61% specifically due to a lack of spare parts at the nearest warehouse. The novel insight that 62% of part-related misses occurred despite the part being available within the 420-warehouse network but suboptimally located empirically validates the crucial need for the two-axis hierarchical framework (BOM criticality and geographical echelon) and Multi-Echelon Inventory Optimization (MEIO)—a perspective often discussed theoretically but rarely diagnostically supported with such precise operational failure rates that differentiate between “no stock” (16% of misses) and “mis-positioned stock” (62% of misses). The study’s diagnostic findings critically position the manufacturer’s performance against several supply chain theories, confirming that the after-sales spare parts supply chain is a fundamental determinant of customer satisfaction and loyalty, crucial to Service Supply Chain Management (SSCM). The research demonstrates a severe failure in this area, attributing nearly 96% of all unfulfilled customer service requests to issues within the broader supply chain functions. This inability to reliably deliver service exposes a critical lack of Resilience, highlighted by the finding that in 62% of missed deadlines, the spare part was physically available but not suitably located near the customer to meet the required SLA, despite the complexity of managing a global network of 420 warehouses. From a Resource-Based View, this operational failure diminishes superior customer service as a strategic competitive advantage; therefore, optimization efforts must focus on transforming key resources, such as building stable strategic partnerships with the three main supplier groups responsible for 75% of parts and utilizing the proposed two-axis hierarchy (BOM criticality and geographical structure) to enable efficient Multi-Echelon Inventory Optimization (MEIO) and improve delivery performance.
6. Conclusions
The study ultimately underscores that effective management of the after-sales spare parts supply chain is paramount for customer satisfaction, loyalty, and retaining customers who use products with long warranty periods.
In the rapidly evolving landscape of the fourth industrial revolution, where technology and the internet are deeply integrated into daily life, the image of any company in the information technology sector is fundamentally shaped not only by the quality of its end products but also by the quality of the service it provides. For industries like telecommunications, computer equipment, and aircraft, after-sales service is paramount, with response time in the event of a breakdown and the availability of spare parts being of paramount importance. Computer users, especially corporate clients whose operations rely on fast data processing, increasingly demand flexible and rapid solutions for IT customer service. This creates an extremely competitive environment where manufacturers must vie not only with innovative technologies but also with superior customer service. The study underscores that the after-sales spare parts supply chain is a critical, yet often overlooked, component influencing customer satisfaction, loyalty, and the retention of customers who utilize products with long warranty periods.
The research concluded that a substantial 96% of all unfulfilled customer service requests were directly attributable to the spare parts supply chain. This significant finding indicates that manufacturers frequently fail to meet their predefined targets for timely spare parts provision under warranty requests. The “forgotten supply chain” aspect emphasizes that while focus is often on the production of final products, the stability of the spare parts supply chain is required years after the product has been manufactured and sold. After-sales service can vary significantly between individual end-customers and corporate customers, but for all, the continuity of business processes hinges on a stable spare parts supply chain. The ability to quickly source and deliver replacement parts, potentially from diverse locations, is key to maintaining operational continuity for customers.
The research provides empirical data demonstrating that approximately 12.5% of warranty service requests (18,757 out of 149,937) were not fulfilled within agreed timeframes, directly impacting customer satisfaction. It precisely quantifies the contribution of different supply chain elements to these misses, showing that 61% were due to spare parts supply chain (SC) issues, 23.2% to logistics (LG), 11.1% to warehousing (WH), and 1.5% to order creation (OC).
The study identified critical operational vulnerabilities. It revealed that the global network of 420 different warehouses, predominantly regional (FSL) locations, while intended to place parts close to customers, leads to increasing inventories and potential obsolescence due to stocking identical spare parts in many locations. This highlights a key area for optimization and rationalization of inventory.
The research specifically identified the top three categories of spare parts causing the most unfulfilled after-sales service requests: power supply (30%), hard drives (13%), and memory (9%). This targeted insight allows for focused improvement efforts.
Beyond just identifying a lack of parts, the study detailed the reasons for missed deadlines. It found that in 36% of cases, parts were “delivered too late” despite being available, indicating issues with storage location, warehouse processing, or transportation. A significant 16% of cases were due to “No Stock in Supply Chain”, meaning the part was entirely unavailable across the global network, and 26% involved “escalation/intervention” that still failed to meet the deadline. This breakdown reveals that unavailability is not the sole problem; inefficient delivery of available parts is also a major factor.
The study analyzed the lifecycle distribution of 10,185 different spare parts, revealing that while 47% were in the “Sustaining” phase, a significant portion (24% “end of manufacturing life,” 11% “EoML procurement decision made,” and 10% “end of life”) were at the end of their lifecycle, posing difficulties for sourcing and maintenance. It also identified Foxconn, internal “DIV” factories, and Accton Technology Corporation as the three main suppliers responsible for 75% of requested spare parts, emphasizing the need for strategic partnerships with these key players.
The research highlights that decisions made during the new product introduction phase, regarding spare parts suppliers and warehouse positioning, are crucial for the successful management of the spare parts supply chain throughout the product’s entire lifecycle, and overlooking this can lead to high costs and unsatisfactory service.
