Article

Impact of Logistics on Global Economic Growth: Beta and Sigma Convergence During the Period 2007–2022

by
Pablo Coto-Millán
,
David Paz Saavedra
* and
Marta De la Fuente
Department of Economy, University of Cantabria, 39005 Santander, Spain
*
Author to whom correspondence should be addressed.
Logistics 2025, 9(4), 147; https://doi.org/10.3390/logistics9040147
Submission received: 14 July 2025 / Revised: 1 October 2025 / Accepted: 15 October 2025 / Published: 20 October 2025

Abstract

Background: Logistics plays a key role in economic performance, yet its contribution to global growth and convergence remains underexplored. This study examines how different logistics dimensions have influenced GDP per worker across countries over the period 2007–2022. Methods: Using econometric panel data techniques and convergence models (β and σ), data from 86 countries are analysed by incorporating logistics performance indicators—such as infrastructure quality, customs efficiency, and shipment traceability—into an endogenous growth framework. Results: The analysis confirms the existence of both β- and σ-convergence, suggesting that lower-income countries are catching up with higher-income ones. Improvements in logistics competence and tracking systems positively affect economic growth, while inefficiencies in shipping services and delivery timeliness negatively impact convergence. Conclusions: These findings highlight the dual role logistics can play in fostering or hindering growth. Enhancing logistics infrastructure and services through targeted policies is essential to promote sustained economic development and reduce global income disparities.

1. Introduction

Economic growth has long been a central theme in economic research. It attracts the attention of both academics and policymakers because it improves welfare, reduces poverty, and creates employment opportunities. Yet, the determinants of sustained growth remain a matter of debate. Beyond capital accumulation and human capital, infrastructure and logistics play a fundamental role in facilitating the movement of goods and people, lowering transaction costs, and strengthening competitiveness in the global market.
Globalisation has increased interdependence among economies, thereby magnifying the importance of logistics performance for integration into international trade and value chains. Efficient logistics not only foster trade and investment but also enhance the development of strategic sectors and long-term productivity [1]. For this reason, understanding how logistics influences economic performance is crucial for both advanced and developing economies. Building on this global context, research on growth and convergence is next reviewed to clarify how logistics performance fits within existing theories.
Most existing research has focused on the short-run effects of logistics on trade flows and competitiveness [2,3]. However, less is known about the role of logistics in shaping long-term convergence in productivity and income across countries. This gap is particularly relevant, as improvements in logistics may accelerate the catch-up process of lower-income economies or, if unevenly distributed, reinforce structural disparities. Recent studies point to the growing influence of digitalisation, automation, and smart infrastructure, which further underline the importance of logistics performance for economic development [4].
This study extends rather than replaces prior analyses by providing a broader time frame and integrating digital-logistics indicators into a convergence framework, thereby offering an updated perspective on how logistics performance influences global income convergence. Convergence is assessed using two complementary approaches: β convergence, which measures whether poorer economies grow faster than richer ones, and σ-convergence, which evaluates the reduction in income dispersion over time. By embedding logistics within this framework, the analysis captures not only aggregate effects but also the differentiated impact of specific logistics dimensions such as infrastructure quality, customs efficiency, international shipments, service competence, tracking systems, and delivery timeliness.
The objectives of this research are threefold: first, to examine the impact of logistics performance on GDP per worker growth in a large sample of countries; second, to evaluate income convergence through β and σ models; and third, to provide policy recommendations aimed at improving logistics performance to foster inclusive and sustained growth.
The remainder of the paper is structured as follows. Section 2 reviews the relevant literature on growth, convergence, and logistics. Section 3 presents the theoretical model integrating logistics as a productive factor. Section 4 describes the data and variables used. Section 5 reports and discusses the econometric results, including convergence analysis. Section 6 concludes with key findings and policy implications.

2. Literature Review

2.1. Growth Models and Logistics Capital

Classical and endogenous growth models provide the macroeconomic context for analysing income convergence. Early frameworks such as the Harrod–Domar model emphasise capital accumulation as the main driver of long-run growth [5,6]. The neoclassical contributions of Solow [7,8] introduces diminishing returns and exogenous technological progress as key determinants of steady-state income levels. Subsequent extensions, notably Romer’s endogenous growth theory, treat knowledge and innovation as internal growth factors that sustain long-term productivity gains [9]. While these contributions remain foundational, they abstract from the role of trade facilitation and supply chain performance. More recent perspectives recognise logistics infrastructure and digital connectivity as productivity-enhancing forms of capital, capable of accelerating convergence by reducing transaction costs and improving market integration [1,2,4,10]. This view motivates the inclusion of logistics indicators as central variables in the empirical analysis undertaken here.
Empirical studies on income convergence build on these growth frameworks, testing whether poorer economies tend to catch up with richer ones when structural factors, including infrastructure quality, are considered. Seminal contributions documented long-run productivity convergence and its welfare implications [11], cross-country income convergence [12], and regional cohesion within Europe [13]. Complementary analyses reinforced these findings across countries and regions [14]. These insights motivate the present study’s focus on logistics performance as a potential driver of income convergence, which is explored in greater depth in the subsequent subsection.

2.2. Endogenous Growth and the Role of Human Capital

The limitations of the neoclassical paradigm led to the development of endogenous growth theories, most notably by Romer [9,15] and Lucas [16]. These models “endogenized” technological progress by highlighting the role of innovation, learning-by-doing [17], and human capital accumulation [18]. Growth was no longer dependent on exogenous shocks but on deliberate policy choices and investments in education, research, and knowledge creation. Empirical evidence confirms that higher human capital boosts productivity and innovation [12,13,19], enabling economies to sustain growth without relying solely on external technological inflows. These contributions opened the door to incorporating new forms of capital—including logistical capital—as internal determinants of growth.

2.3. Logistics, Infrastructure, and Trade Efficiency

Recent studies have placed logistics and infrastructure at the centre of competitiveness and growth. Efficient logistics reduce trade costs, facilitate participation in global value chains, and attract foreign investment [3,20]. Ref. [21] showed that time delays in shipping significantly reduce trade volumes, while [2,10] demonstrated that logistics performance enhances both growth and technical efficiency at the global level. Munim & Schramm (2018) [22] further identified port infrastructure as a mediator between logistics and GDP, and Khadim et al. (2021) [23] confirmed that improvements in logistics amplify the productivity effects of capital accumulation, particularly in developing countries. Collectively, these findings suggest that logistics functions as a form of “logistics capital”—understood as the stock of infrastructure, connectivity, and operational efficiency that supports trade and production—complementing physical and human capital in the production process.

2.4. Synthesis and Research Gap

The reviewed literature shows a progression from exogenous to endogenous growth models, highlighting the increasing importance of intangible and institutional factors. Human capital has been successfully integrated into growth frameworks, yet logistics has received less systematic attention despite its direct impact on trade efficiency and competitiveness. While previous studies have demonstrated a positive association between logistics performance and growth, they have not fully explored how logistics influences convergence dynamics across countries. This study addresses this gap by extending endogenous growth theory to include logistics capital and by testing its role using both sigma and beta convergence models. Just as human capital expanded the explanatory power of growth models, logistics capital may serve as a complementary factor shaping convergence outcomes. In doing so, it seeks to clarify whether logistics can accelerate the catch-up process of lagging economies, thereby offering novel insights into the determinants of global growth disparities.
Recent studies have deepened insights into how digital and smart logistics reshape last-mile delivery in urban and semi-urban settings. Autonomous delivery robots have been reviewed to assess infrastructure constraints, emission externalities, and competitiveness under rising parcel volumes (Alverhed et al., 2024) [24]. Innovations in customer-service-oriented last-mile technologies—such as parcel lockers and sustainable delivery options—have been documented in the Polish context (Kolasińska-Morawska et al., 2022) [25]. Decision-making models addressing complex urban contexts have been proposed to balance environmental, service-quality, and operational-cost criteria (Silva et al., 2023) [26]. Multi-criteria optimisation approaches that integrate smart lockers, crowdshipping, and capillary distribution have also been developed (Sawik, 2024) [27]. Finally, the evolution of digital-logistics business models driven by platform technologies and connected or autonomous vehicles has been analysed in depth (Turienzo et al., 2024) [28]. Together, these works highlight that logistics performance is increasingly influenced not only by traditional infrastructure and customs efficiency but also by digital tools, autonomous technologies, and sustainable delivery methods, reinforcing the rationale for incorporating disaggregated and technology-focused logistics indicators in the present convergence analysis.

2.5. Recent Advances in Digital and Smart Logistics (2020–2024) and Critical Synthesis

Recent scholarship has highlighted the rapid transformation of global logistics through digital technologies, artificial intelligence (AI), and smart infrastructure, offering new perspectives on the logistics–growth nexus. Wang et al. (2024) [1] documented how AI-driven tracking and Internet-of-Things (IoT) platforms reduce coordination failures and lower trade costs along the Belt and Road corridors. Sabir et al. (2024) [4] showed that machine-learning-based predictive routing significantly improves supply chain resilience and export performance in emerging economies. Yingfei et al. (2022) [29] analysed the role of green logistics and sensor-based monitoring in enhancing service trade while mitigating environmental impacts. Collectively, these studies emphasise that digitalisation, smart ports, and data-driven decision systems are no longer peripheral but central to international competitiveness.
Earlier contributions on logistics and economic convergence—such as Coto-Millán et al. (2013, 2016) [2,10]—established that logistics performance fosters technical efficiency and accelerates income catch-up. The present analysis extends this literature by employing a longer period (2007–2022), disaggregating the Logistics Performance Index (LPI) into six dimensions, and explicitly integrating digital-logistics factors that have become critical since 2020.
From a conceptual standpoint, these recent findings reinforce the view of logistics as a dynamic, capital-like input that complements both physical and human capital. They also underscore heterogeneity: while infrastructure quality and customs efficiency remain fundamental, digital capabilities increasingly determine the speed and stability of economic convergence. This integrated perspective bridges the gap between traditional convergence theory and contemporary supply chain realities, providing the theoretical foundation for the empirical strategy adopted in this paper.

3. Endogenous Growth Model with Logistic Capital

3.1. Theoretical Justification

The neoclassical framework established by Solow [7,8] and its extensions by Mankiw, Romer, and Weil [18] distinguish between physical and human capital as fundamental drivers of growth. However, subsequent empirical research has demonstrated that productivity is also shaped by the quality of infrastructure, connectivity, and trade facilitation mechanisms [20,21,22]. Logistics systems —hereafter conceptualised as logistics capital (Q), a stock of infrastructural and institutional assets that accumulate over time—reduce transaction cost, enable participation in global value chains, and improve the marginal productivity of both physical and human capital.
Certain regressors—physical capital, human capital, and the disaggregated LPI components—were treated as endogenous because reverse causality with income growth is plausible: higher income can itself stimulate infrastructure investment and logistics improvements. Institutional variables and population growth were treated as exogenous on the grounds that their short-term feedback from income growth is limited, a distinction consistent with standard dynamic panel specifications in the convergence literature [14,30]. This approach ensures that the estimation properly accounts for potential endogeneity biases while maintaining theoretical coherence with established growth and convergence frameworks.
In this sense, logistics can be conceptualised as a distinct form of productive capital: like physical capital, it requires continuous investment in ports, airports, and information technologies; like human capital, it enhances efficiency by coordinating supply chains and enabling knowledge diffusion; unlike either, logistics capital is inherently relational, creating network externalities that extend beyond national borders.
Recent studies have adopted similar approaches, treating infrastructure or logistics performance as a capital-like input with cumulative effects on growth. For example, ref. [22] identified port logistics as a mediating factor between investment and GDP growth, while [23] demonstrated that logistics performance moderates the productivity of capital in developing countries. Building on this literature, logistics capital (Q) is defined as the stock of logistical assets and capabilities that accumulate through both tangible investments and institutional improvements.
The σ and β convergence framework is incorporated into the logistics-augmented model so that the effect of improvements in logistics capital on income convergence can be tested.

3.2. Model Specification

The augmented Cobb–Douglas production function is extended to include logistics capital:
Y t = K t α H t β   Q t γ ( A L ( t ) ) 1 α β γ
where Y t is output, K t physical capital, H t human capital, Q t logistic capital, L t labour, and A t technology. The elasticities α, β, and γ represent the output shares of each input.
The accumulation dynamics for each capital stock are:
K ˙ t =   s k   Y t   δ k K t
H ˙ ( t )   = s H   Y ( t ) δ H H ( t )
Q ˙   ( t ) = s Q   Y ( t ) δ Q Q ( t )
where s k , s H   ,     s Q are the respective saving/investment rates, and δ k ,   δ H ,   δ Q are depreciation rates. This formulation mirrors the established treatment of capital stocks, but allows for the explicit consideration of logistics as an accumulable factor. Unlike a one-off input, logistics infrastructure and institutions (e.g., digital tracking, customs efficiency) exhibit persistence and path dependence, justifying their modelling as a stock variable.

3.3. Linking Logistics Dimensions to Output

To better capture the dynamics of economic growth that include logistical factors, an endogenous growth model is proposed and expressed in per-worker terms as the following dynamic equation:
Δ   log ( y i t ) = β 0 + β 1 log y i t 1 + β 2 log k i t + β 3 log h i t + β 4 log q i t + Ɛ i t  
where
  • Δ log ( y i t ) is the growth rate of GDP per worker for country i in period t,
  • log ( y i t 1 )   captures convergence dynamics
  • k i t and h i t are, respectively, physical and human capital per worker
  • q i t are the components of logistics capital as derived from the LPI (see Section 4.2 for definitions)
  • Ɛ i t is the error term
By modelling q i t as a composite of these dimensions, we capture the multifaceted ways in which logistics performance interacts with other growth determinants. Importantly, this disaggregation also enables us to test whether specific bottlenecks (e.g., customs inefficiency, shipment delays) exert negative effects even when other logistics components are strong. Each of these variables can influence economic growth differently, and their inclusion in the model allows for a more detailed and nuanced analysis of the impact of logistics on growth.
To evaluate the impact of logistical and infrastructure factors on economic growth, panel data models are employed. These models allow control over unobserved variables that vary between individuals but not over time, providing consistent estimates even in the presence of unobserved heterogeneity.
Equation (5) needs to be dynamized to provide a growth equation incorporating the various logistical components, suitable for estimation using panel data, as follows:
log y i t log y i t 1   =   β 0 + β 1 log y 1   i t 1 + β 2 log k 2   k t + β 3 log h 3   i t + β 4 log q 1 ,   4 i t + β 5 log q 2 ,   5 i t +   β 6 log q 3 ,   6 i t + β 7 log q 4 ,   7 i t + β 8 log q 5 ,   8 i t + β 9 log q 6 ,   9 i t + Ɛ i t                  
Equation (6) will be estimated using a fixed effects model. This model assumes that unobserved individual differences are correlated with the explanatory variables, allowing control over these constant individual effects over time. Subsequently, it will be estimated with a random effects model, which assumes that individual differences are random and not correlated with the explanatory variables, enabling the generalisation of results beyond the studied sample. The Hausman test will then be performed to select between the models. Finally, the estimation strategy will employ the Generalised Method of Moments (GMM) to address issues of endogeneity and heteroskedasticity in panel data. This method provides robust estimates by using appropriate instruments and is particularly useful when the explanatory variables are correlated with the error term, which could bias the estimators of fixed and random effects models.
Convergence σ refers to the reduction in the dispersion of per capita GDP among countries over time. It is measured by observing the standard deviation of the logarithm of per capita GDP in a group of countries. If the standard deviation decreases over time, sigma convergence is said to occur, indicating that income level differences among countries are diminishing.
Mathematically, σ convergence can be expressed as:
σ t = ( 1 N i = 1 N ( L y i , t 1 N i = 1 N L y i , t ) 2 ) 1 2
where L y i , t is the logarithm of the per capita GDP of country i in year t , 1 N i = 1 N L y i , t is the average logarithm of per capita GDP of all countries in year t , and N is the number of countries.
Convergence β refers to the tendency of poorer countries to grow more rapidly than richer countries, suggesting that countries with lower initial levels of per capita GDP are catching up to those with higher levels. β convergence is estimated by regressing the growth of per capita GDP on the initial level of per capita GDP. If the coefficient of the initial variable is negative and significant, it provides evidence of β convergence.
The typical regression equation for β convergence is:
Δ ln y i , t =   α   +   β ln y i , 0 + Ɛ i , t
where Δ ln y i , t is the growth of the logarithm of the per capita GDP of country i over period t, ln y i , 0 is the initial logarithm of the per capita GDP of country i, and, Ɛ i , t is the error term. A negative β coefficient indicates β convergence.
The theoretical framework established in this section provides a solid foundation for the empirical analysis of the impact of infrastructure and logistics on economic growth. By integrating the concepts of sigma and beta convergence with both traditional and endogenous economic growth models and incorporating logistical factors, this study aims to offer a deeper and more nuanced understanding of global economic growth dynamics.
3.4. Contribution of the Model

This study extends rather than replaces prior analyses by providing a broader time frame and integrating digital-logistics indicators into a convergence framework. While the functional form resembles the Mankiw–Romer–Weil [18] extension of Solow [7,8], the substantive innovation lies in treating logistics as an endogenous growth driver with capital-like properties and externalities. This conceptualisation bridges three strands of the literature:
  • Endogenous growth models, which emphasise the role of internal factors such as knowledge and human capital.
  • Convergence studies, which assess how structural differences condition the pace of catch-up.
  • Empirical logistics research, which documents the measurable impact of infrastructure and service quality on trade and output.
This integrated framework provides a coherent basis for our empirical analysis, which employs panel data and convergence models to quantify the contribution of logistics to global economic growth.

4. Data

4.1. Data Source and Coverage

Data are drawn from the World Bank’s Logistics Performance Index (LPI) database and World Development Indicators (WDI) [30]. The empirical analysis considers 86 countries in a panel data set for the period 2007–2022. The years available from the Logistics Performance Index and its components are 2007, 2010, 2012, 2014, 2016, 2018, and 2022. The final sample was determined by the availability of complete data for all variables over the entire study period, resulting in a balanced panel of 86 countries.

4.2. Variables and Conceptual Rationale

The empirical strategy draws on three categories of explanatory variables: physical capital (K), human capital (Kh2, measured as secondary school enrollment, %), and logistics capital ( q 1 q 6 ), alongside GDP per worker as the dependent variable. Table 1 provides a detailed description of the variables included in the estimation of the economic growth model.
The inclusion of Kh2 variable follows the tradition of endogenous growth models, in which human capital is considered a fundamental determinant of productivity and long-run economic performance [16,18]. Although enrollment rates may primarily reflect the quantity rather than the quality of education, they are widely employed as proxies for the accumulation of basic skills that underpin a country’s ability to adopt and manage innovations, including those related to logistics performance. Higher human capital levels enhance the complementarities between infrastructure, logistics, and technology, thus raising productivity per worker and sustaining convergence [12,23]. Excluding this dimension could bias the analysis by underestimating the interaction between education and logistics in shaping growth outcomes.
The selection of the logistics indicators q 1 q 6 is directly based on the World Bank’s Logistics Performance Index (LPI), which is the most widely recognised international benchmark for assessing logistics performance [31,32]. Each dimension captures a specific mechanism through which logistics influence economic activity: q 1 (customs) reflects the efficiency of customs and border procedures, which affects trade costs and competitiveness [21,29]; q 2 (infrastructure) measures the quality of transport networks, ports, and airports that determine trade costs and competitiveness [22,33,34]; q 3 (international shipments) reflects the availability and competitiveness of international transport services, which condition a country’s integration into global value chains [2,4]; q 4 (logistics quality and competence) measures the professionalisation of logistics providers, an essential factor for reducing inefficiencies and sustaining trade facilitation [20,23,35]; q 5 (tracking and tracing) captures the reliability of shipment monitoring systems that mitigate information asymmetries, lower inventory costs, and improve supply chain coordination [10]; q 6 (timeliness) assesses the punctuality of deliveries, a crucial determinant of firms’ reliability and their participation in international production networks [21,29,32].
Finally, this study employs GDP per worker as the dependent variable instead of GDP per capita because the objective is to measure labour productivity rather than average income. GDP per worker better reflects the efficiency of factor utilisation and reduces potential distortions associated with demographic composition (non-working population shares). This measure is consistent with endogenous growth models where output per worker is determined by the joint accumulation of physical capital, human capital, and logistics capital [9,16,22]. In this work, the disaggregated LPI components were tested for stationarity using Augmented Dickey–Fuller tests. All components were found to be stationary at conventional significance levels, supporting their use in dynamic panel models without further transformation.

4.3. Descriptive Statistics and Interpretation

Table 2 presents the descriptive statistics, along with their sources and units, for 86 countries worldwide that have complete data for all variables over the period 2007–2022 (504 observations).
A wide dispersion is observed in GDP per worker, ranging from approximately $1337 to $248,365, reflecting sharp productivity gaps across countries. These differences provide the empirical foundation for testing convergence, as poorer economies with low initial productivity may exhibit higher growth rates. For human capital, secondary school enrolment (Kh2) shows an average above 90%, but with considerable variation across countries. This heterogeneity reflects uneven progress in educational attainment, with implications for the ability of countries to adopt and manage innovations. The wide standard deviation of $39,336 in GDP per worker underscores strong productivity inequality across countries.
The logistics indicators ( q 1 q 6 ) range between 1.5 and 4.8 on a five-point scale, evidencing substantial disparities in customs procedures, infrastructure quality, and service reliability. Such variation is expected to play a central role in explaining differences in productivity and growth convergence.
Table 3 summarises the distribution of the 86 countries in the sample according to World Bank income classification (high income, upper-middle income, lower-middle income, and low income). For each group, the table reports the count of countries as well as the mean values of GDP per worker (Y), gross capital formation per worker (K), secondary enrollment (Kh2), and all logistics indicators: customs ( q 1 ) , infrastructure ( q 2 ) , international shipments ( q 3 ) , logistics competence ( q 4 ) , tracking & tracing ( q 5 ) and timelines ( q 6 ) .

5. Results

5.1. Estimation Strategy and Model Selection

The econometric analysis employed Generalized Method of Moments (GMM), fixed effects, and random effects estimators to address potential challenges in panel data, including unobserved heterogeneity, endogeneity, and serial correlation. GMM was initially motivated by concerns that investment in physical, human, and logistics capital may be endogenous to growth. However, the Hausman test indicated that FE estimators provide more consistent results for the sample at hand.
Table 4 presents the results of four different panel data econometric models. The first column shows the results of the one-step GMM model. The second column presents the two-step GMM model. The third column contains the random effects model (RE), and the fourth column shows the fixed effects model (FE). In these models, the endogenous variables are Lk, Lkh2, Lq1, and Lq4. All other variables are considered exogenous. Variables Lk, Lkh2, Lq1, and Lq4 are treated as endogenous because past growth, investment decisions, and institutional factors likely influence them. This choice does not imply that GMM estimates are irrelevant. Rather, the FE results should be seen as complementary, capturing country-specific effects that GMM cannot fully disentangle. Differences across specifications are modest, suggesting robustness, but some coefficients vary in significance depending on the estimator. This highlights the trade-off between addressing endogeneity (via GMM) and capturing unobserved heterogeneity (via FE).

5.2. Main Findings

The global production per worker growth function shows that fixed capital per worker and human capital per capita (population with secondary education) are significant and positively impact growth.
Variables in logarithms reveal elasticities of income per worker. The sum of significant elasticities (0.549) indicates decreasing returns to scale. Logistics competence ( q 4 = 0.273) and tracking systems ( q 5 = 0.177) positively influence global production. However, indicators for infrastructure quality ( q 1 ) and customs efficiency ( q 2 ) are not significant, suggesting areas needing improvement. Negative elasticities for international shipping cost competitiveness ( q 3 = −0.117) and shipment punctuality ( q 6 = −0.276) highlight the detrimental effects of inefficiencies and delays on global production. The heterogeneity across logistics indicators underscores that not all logistics components are equally growth-enhancing. Policymakers should prioritise those with the largest and most consistent impacts (competence and tracking systems) while addressing inefficiencies in shipping and delivery punctuality. The limited significance of customs efficiency and infrastructure quality does not imply that these factors are unimportant. Rather, their marginal effects may diminish once a certain threshold of infrastructure development has been reached. Ref. [36] show in a comprehensive meta-analysis that the trade-enhancing impact of infrastructure varies widely across countries and tends to exhibit diminishing returns in highly developed economies. This helps explain why our results reveal weak or insignificant coefficients despite the well-established role of infrastructure in facilitating trade and growth.

5.3. Convergence Analysis

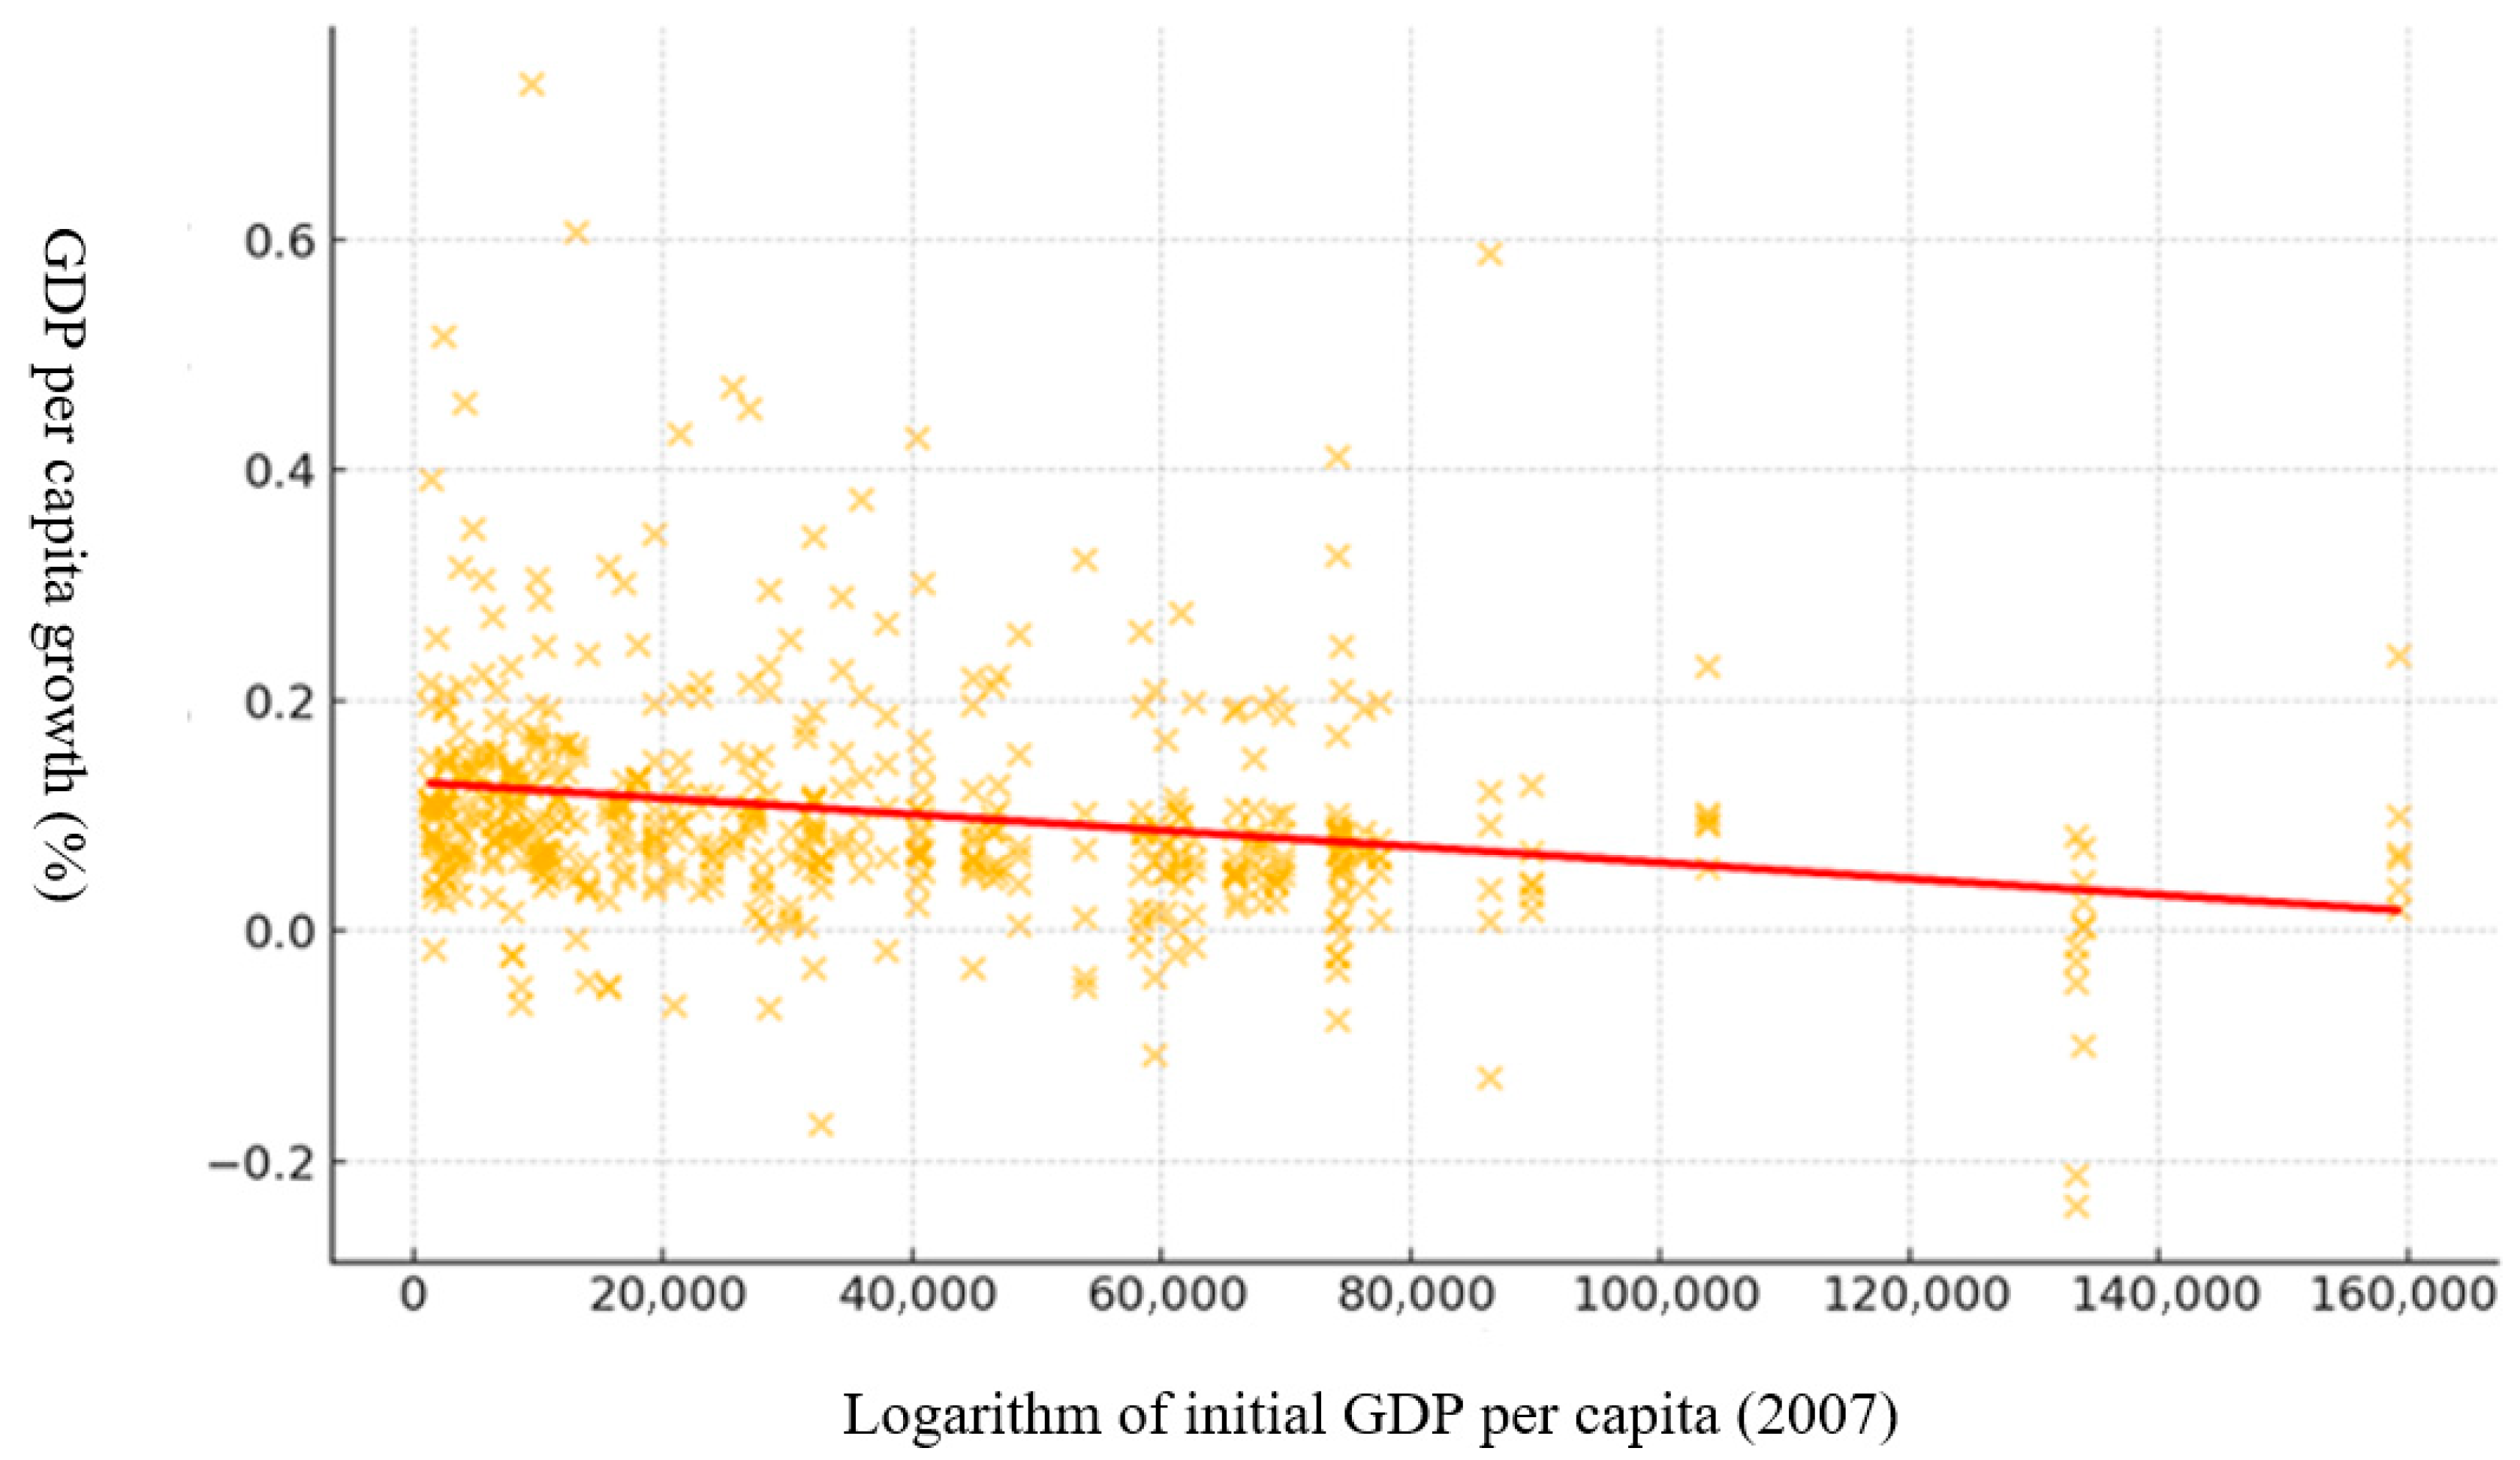
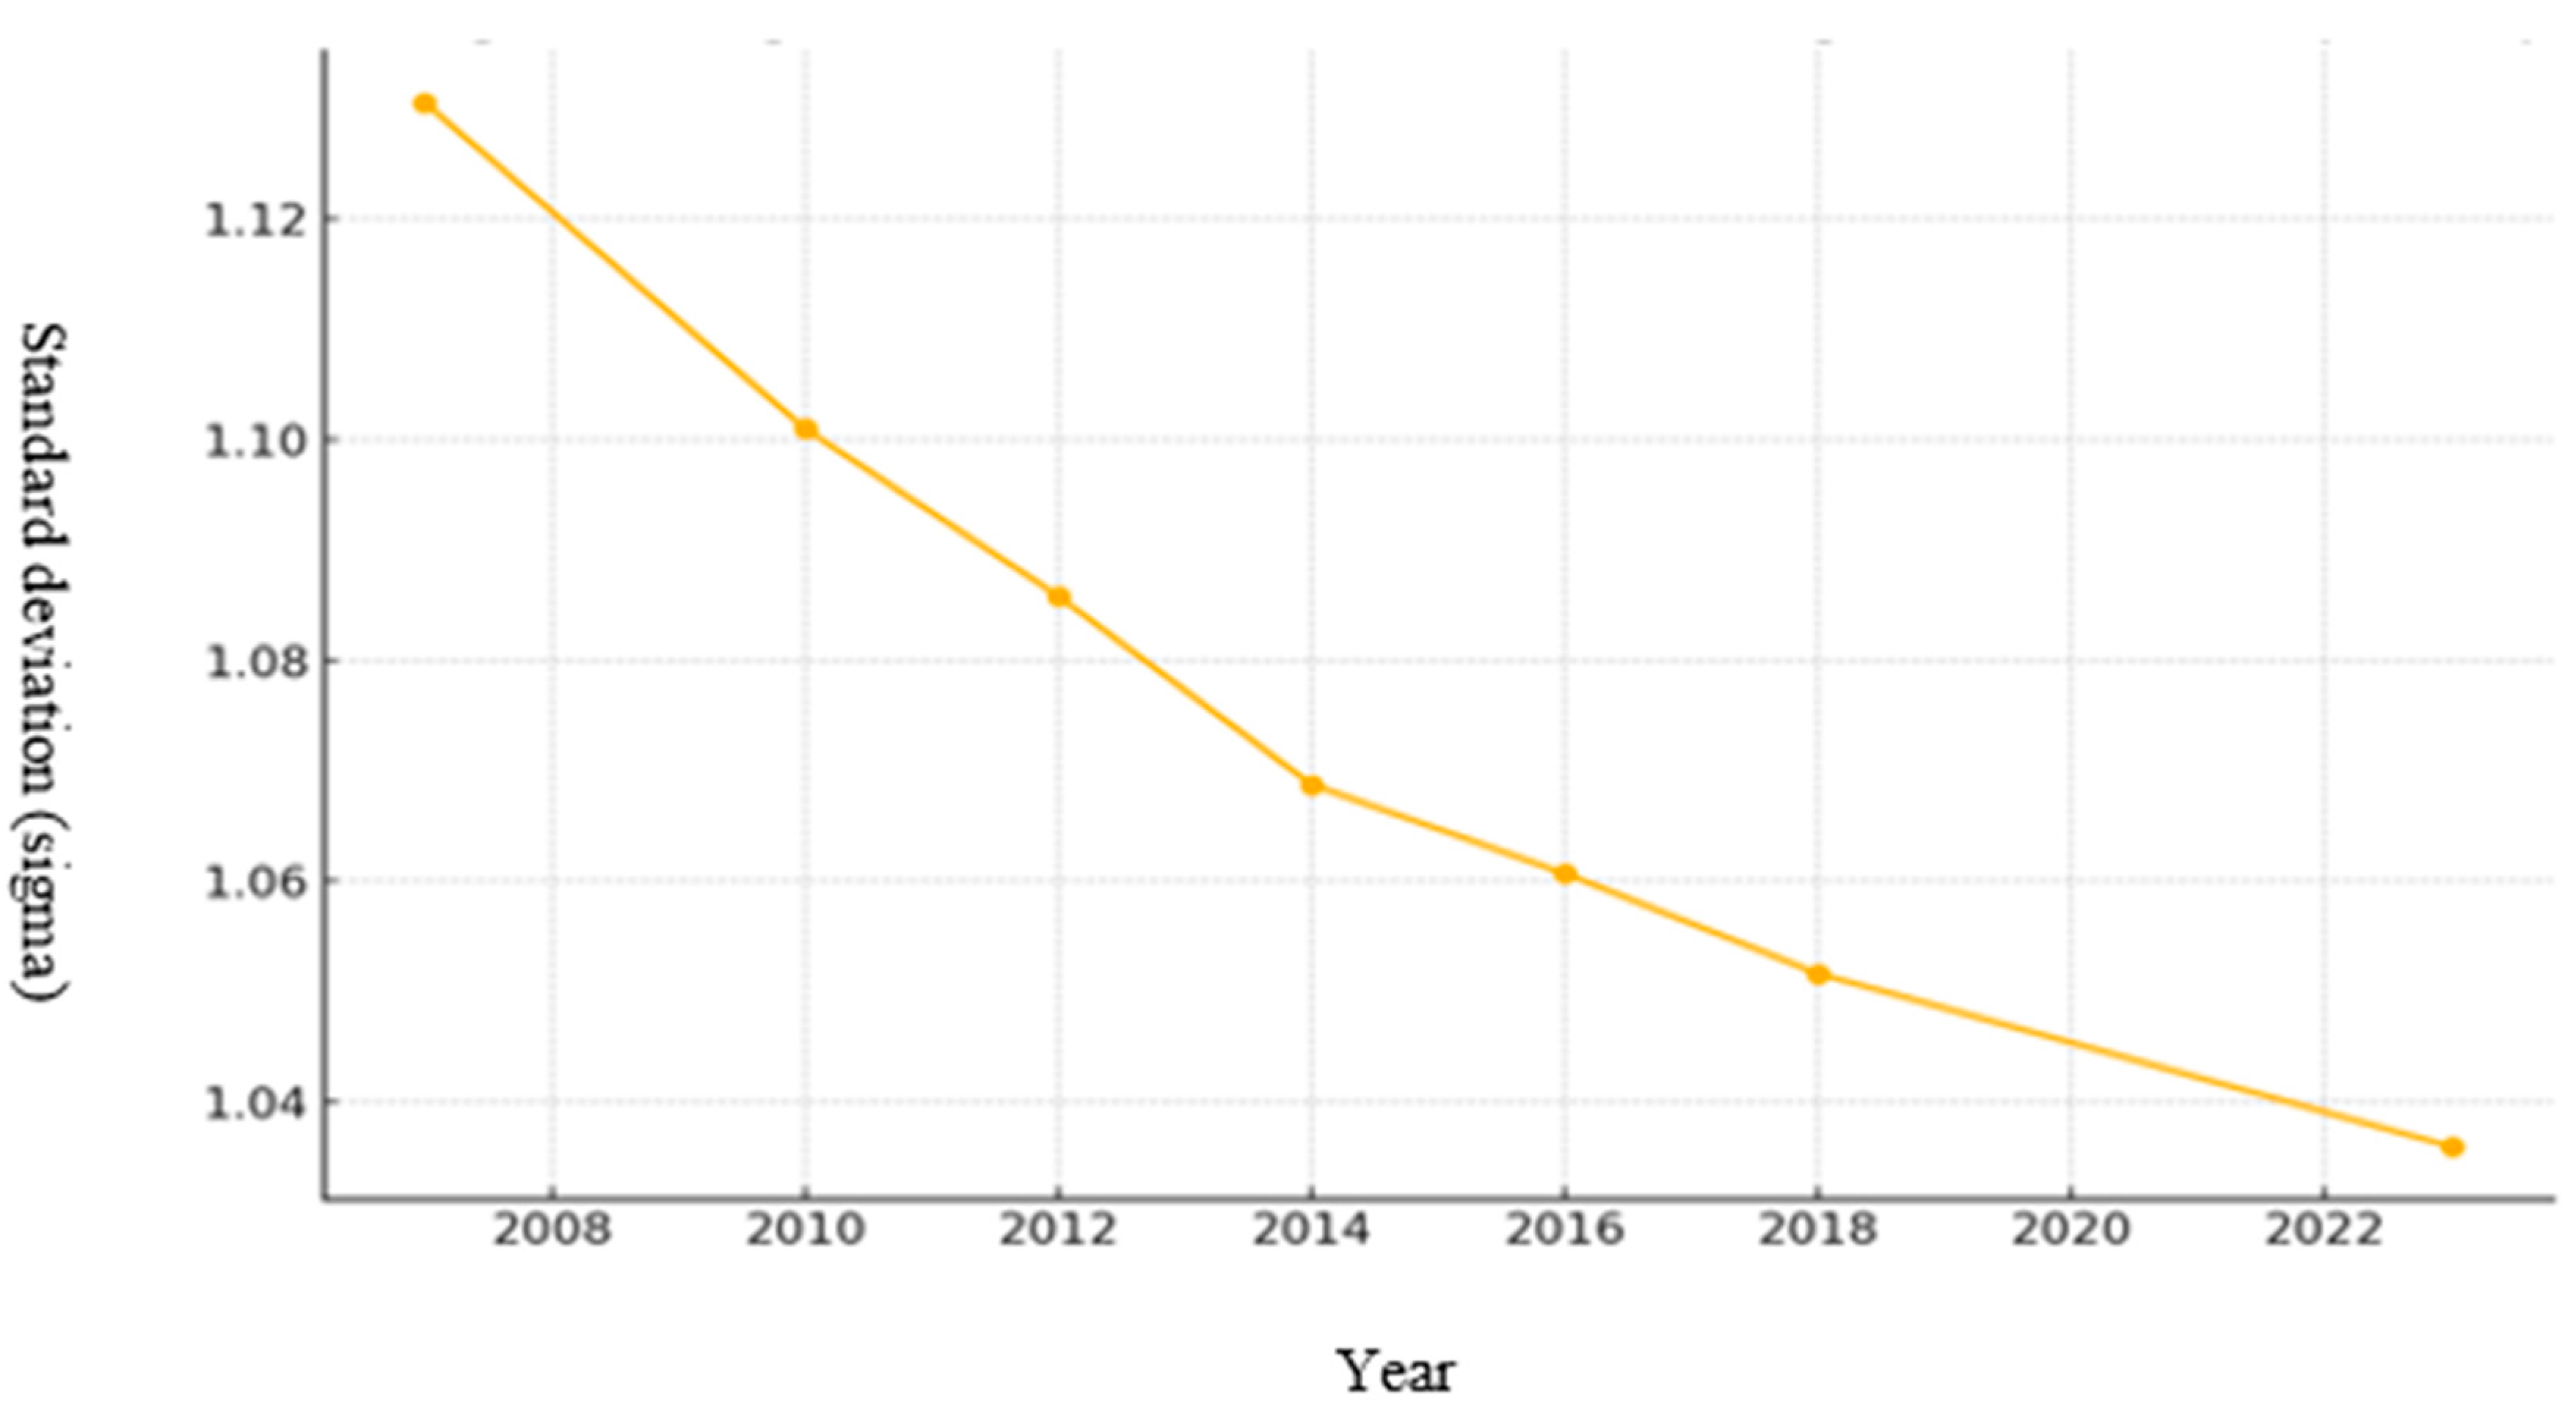
To improve clarity and adhere to academic standards, Figure 1 and Figure 2 have been revised with descriptive captions, clear titles, and fully labelled axes specifying variables and units. These visuals are now directly referenced at their first mention in the Results section to aid reader comprehension and integration with the narrative. For instance, Figure 1 illustrates the relationship between initial log GDP per worker and growth rate, indicating β-convergence by showing that lower-income countries grow faster. Figure 2 presents the standard deviation of log GDP per worker over time, demonstrating σ-convergence through the declining dispersion of income levels among countries. Table 5 reports the estimated β coefficients from the dynamic growth regressions and the corresponding implied speeds of convergence.
The results confirm the presence of β-convergence, as the coefficients on lagged GDP per worker are negative and statistically significant in both specifications. The inclusion of logistics variables yields a more negative β (−0.363037 compared to −0.337930), translating into a faster implied speed of convergence (0.4516% vs. 0.4137%). This confirms that the inclusion of logistic variables accelerates the convergence towards equilibrium and suggests that improvements in logistics performance accelerate the catch-up process, allowing lower-income economies to converge more rapidly towards the productivity levels of higher-income countries.
Using the standard deviation values of the logarithm of income per worker across countries, sigma convergence has been estimated, as illustrated in Figure 2.
The standard deviation of the logarithm of GDP per worker decreases over time, indicating σ-convergence. This suggests that the disparities in GDP per capita between countries are diminishing, with poorer countries growing at a faster rate than richer ones. Both Figure 1 and Figure 2 confirm the presence of β and σ convergence.

5.4. Diagnostic Tests

The results of several econometric tests (Table 6) confirm the validity of the estimates reported, checking for issues like overidentifying restrictions, autocorrelation, and the appropriate model specification.
Standard specification tests confirm the overall validity of the models: the Sargan–Hansen test does not reject the overidentifying restrictions, and the Arellano–Bond AR (2) test suggests no problematic autocorrelation in second-differenced residuals. While first-order autocorrelation is present, this outcome is common in dynamic panel estimations and does not invalidate the specification. The Hausman test strongly favours FE over RE, supporting the interpretation of fixed effects as the preferred model. These limitations suggest that while results are robust, policymakers should interpret logistics impacts with caution, particularly given the perception-based nature of LPI indicators.
Nevertheless, limitations remain. The presence of endogenous regressors implies that GMM remains valuable despite the FE preference. Moreover, measurement issues in the LPI (e.g., survey-based scores) may introduce noise into the logistics variables. These caveats should temper the interpretation of results while reinforcing the need for complementary robustness checks in future research.

5.5. Stationarity Tests

To assess the appropriateness of the panel data for dynamic panel estimation, Augmented Dickey–Fuller (ADF) unit root tests were conducted on the key variables. These included GDP per worker, education, customs efficiency, infrastructure quality, international shipments, logistics quality and competence, tracking and tracing, timeliness, and adjusted capital formation. The null hypothesis of non-stationarity was rejected at the 1% significance level for all variables, as shown by the negative and significant ADF statistics and corresponding p-values presented in Table 7. The results of the Augmented Dickey–Fuller unit root tests for stationarity, confirm that all key variables included in the analysis are stationary, validating the data set for dynamic panel modelling.

5.6. Robustness Test

To ensure the reliability of the principal findings, robustness tests were conducted by incorporating the full set of explanatory variables from the baseline model (Table 8). Year fixed effects were included to control for time-specific effects.
Additional estimations were performed on subsamples by region and income group. The results consistently show a positive and significant influence of capital formation and human capital on GDP per employee across all specifications. The logistics variables exhibit heterogeneous effects, with infrastructure (q2) and timeliness (q6) generally showing positive significant contributions, while other logistics indicators vary by subsample.
These robustness checks confirm the stability of the main results and support the validity of the conclusions drawn from the full-sample analysis.

6. Conclusions

The study confirms the significant role logistics plays in driving global economic growth. By incorporating logistical indicators into the endogenous growth model, the research highlights how logistics infrastructure, quality, and efficiency directly impact GDP per worker. The importance of logistics performance is similarly noted by [31], who emphasised the role of the Logistics Performance Index in international trade, showing its impact on overall growth. The findings illustrate both positive and negative influences of different logistical dimensions, with logistics competence and tracking systems positively contributing to growth, while inefficiencies in international shipments and timeliness negatively affect it. Importantly, the analysis demonstrates both β and σ convergence, showing that poorer countries are catching up economically with wealthier nations, further emphasising the critical role of logistics in reducing global income disparities. Ref. [32] further supports the findings on economic convergence, showing that logistics improvements drive export performance, particularly in Asian economies, which helps bridge the economic gap between poorer and wealthier nations. These results underscore the need for targeted policy interventions [41] to improve logistics infrastructure and performance, fostering sustained economic growth and competitiveness globally.

7. Theoretical and Policy Implications

This study extends the traditional endogenous growth models by integrating logistics performance as an internal growth driver, thus shifting the focus from purely technological progress to broader logistical variables that influence production efficiency. The introduction of these logistical factors highlights a more dynamic understanding of economic growth, with logistics infrastructure and operational efficiency serving as both facilitators and constraints in global production. The non-significant customs efficiency and infrastructure quality indicators point to the need for public intervention to improve these areas. The significant negative impacts of international shipments and shipment punctuality stress the importance of addressing inefficiencies. Conversely, the positive impacts of logistics competence and tracking and tracing suggest that market mechanisms and public regulation can support continued improvements. The findings contribute to the literature by showing that improvements in logistics lead to faster economic convergence, providing new insights into how logistics can enhance the productivity of capital and labour. The study also advances the discourse on economic convergence, offering empirical evidence that β convergence can be accelerated through improvements in logistics infrastructure, especially in developing countries. In theoretical terms, the results show that logistics capital—especially competence and digital traceability—acts as an accumulable input that accelerates conditional β-convergence through spill over and network effects. From a policy perspective, specific actors should be prioritised: trade and transport ministries (customs modernization, professionalisation of services), development banks and multilateral institutions (financing infrastructure and training), and regional trade blocs (harmonisation of standards).

8. Limitations and Future Research

This research offers valuable insights into the impact of logistics on economic growth, but several limitations must be acknowledged. First, the use of the Logistic Performance Index (LPI) focuses on country-level indicators, which may overlook firm-specific logistical performance differences. Future research could explore how individual firms’ logistical strategies interact with national logistics infrastructure to influence economic outcomes. Second, the study covers data from 2007 to 2022, which may not fully capture the long-term effects of infrastructural improvements or the rapidly evolving logistics sector driven by technological advances such as AI and the Internet of Things (IoT). Future studies could expand this analysis to include more recent data or focus on the influence of emerging technologies on logistical efficiency and economic growth. Additionally, regional studies could provide more granular insights into how different logistics challenges across geographic areas affect growth dynamics. Finally, the relationship between sustainable logistics practices and their long-term impact on economic growth presents a promising area for future exploration. A methodological limitation is that standard β- and σ-convergence tests may overlook structural breaks or cross-country heterogeneity, potentially biassing results in periods of global shocks or when convergence paths differ by income groups. Future research could apply threshold or nonlinear convergence models (e.g., club convergence approaches) to test whether the impact of logistics varies across different development stages, thus providing a more nuanced view of conditional catch-up processes.

Author Contributions

Conceptualization, P.C.-M.; Methodology, P.C.-M.; Software, M.D.l.F.; Validation, D.P.S.; Investigation, M.D.l.F.; Resources, M.D.l.F.; Data curation, D.P.S.; Writing—original draft, P.C.-M.; Writing—review & editing, D.P.S. All authors have read and agreed to the published version of the manuscript.

Funding

This research received no external funding.

Institutional Review Board Statement

Not applicable.

Informed Consent Statement

Not applicable.

Data Availability Statement

The original data presented in the study are openly available in Economic Indicators 2024: Data Base World Development Indicators [30].

Conflicts of Interest

The authors declare no conflict of interest.

References

  1. Wang, M.; Childerhouse, P.; Abareshi, A. Global logistics and supply chain integration in the digital era: A focus on China’s Belt and Road Initiative. J. Int. Logist. Trade 2024, 22, 58–79. [Google Scholar] [CrossRef]
  2. Coto-Millán, P.; Fernández, X.L.; Pesquera, M. Impact of Logistics on Technical Efficiency of World Production (2007–2012). Netw. Spat. Econ. 2016, 16, 981–995. [Google Scholar] [CrossRef]
  3. Irshad, R.; Ghafoor, N. Infrastructure and Economic Growth: Evidence from Lower-Middle-Income Countries. J. Knowl. Econ. 2023, 14, 161–179. [Google Scholar] [CrossRef]
  4. Sabir, M.; Akram, M.; Mian, R.U. Transport, Logistics, and Economic Growth Nexus: A Cross-Country Analysis. Transp. Telecommun. J. 2024, 25, 462–472. [Google Scholar] [CrossRef]
  5. Harrod, R.F. An Essay in Dynamic Theory. Econ. J. 1939, 49, 14–33. [Google Scholar] [CrossRef]
  6. Domar, E.D. Capital Expansion, Rate of Growth and Employment. Econometrica 1946, 14, 137–147. [Google Scholar] [CrossRef]
  7. Solow, R.M. A Contribution to the Theory of Economic Growth. Q. J. Econ. 1956, 70, 65–94. [Google Scholar] [CrossRef]
  8. Solow, R.M. Technical Change and the Aggregate Production Function. Rev. Econ. Stat. 1957, 39, 312–320. [Google Scholar] [CrossRef]
  9. Romer, P.M. Increasing Returns and Long-Run Growth. J. Political Econ. 1986, 94, 1002–1037. [Google Scholar] [CrossRef]
  10. Coto-Millán, P.; Agüeros, M.; Casares, P. Impact of Logistics Performance on World Economic Growth (2007–2012). World Rev. Intermodal Transp. Res. 2013, 4, 300–310. [Google Scholar] [CrossRef]
  11. Baumol, W.J. Productivity Growth, Convergence, and Welfare: What the Long-Run Data Show. Am. Econ. Rev. 1986, 76, 1072–1085. Available online: https://ideas.repec.org/a/aea/aecrev/v76y1986i5p1072-85.html (accessed on 22 July 2025).
  12. Barro, R.J. Economic Growth in a Cross Section of Countries. Q. J. Econ. 1991, 106, 407–443. [Google Scholar] [CrossRef]
  13. Sala-i-Martin, X.X. Regional Cohesion: Evidence and Theories of Regional Growth and Convergence. Eur. Econ. Rev. 1996, 40, 1325–1352. [Google Scholar] [CrossRef]
  14. Barro, R.T.; Sala-i-Martin, X. Regional Growth and Migration: A Japan-United States Comparison. J. Jpn. Int. Econ. 1992, 6, 312–346. [Google Scholar] [CrossRef]
  15. Romer, P.M. Endogenous Technological Change. J. Political Econ. 1990, 98, S71–S102. [Google Scholar] [CrossRef]
  16. Lucas, R.E. On the Mechanics of Economic Development. J. Monet. Econ. 1988, 22, 3–42. [Google Scholar] [CrossRef]
  17. Arrow, K.J. The Economic Implications of Learning by Doing. Rev. Econ. Stud. 1962, 29, 155–173. [Google Scholar] [CrossRef]
  18. Mankiw, N.G.; Romer, D.; Weill, D.N. A Contribution to the Empirics of Economic Growth. Q. J. Econ. 1992, 107, 407–437. [Google Scholar] [CrossRef]
  19. Temple, J. The New Growth Evidence. J. Econ. Lit. 1999, 37, 112–156. [Google Scholar] [CrossRef]
  20. Chu, Z. Logistics and Economic Growth: A Panel Data Approach. Ann. Reg. Sci. 2012, 49, 87–102. [Google Scholar] [CrossRef]
  21. Hummels, D.; Schaur, G. Time as a Trade Barrier. Am. Econ. Rev. 2013, 103, 2935–2959. [Google Scholar] [CrossRef]
  22. Munim, Z.H.; Schramm, H.J. The Impacts of Port Infrastructure and Logistics Performance on Economic Growth: The Mediating Role of Seaborne Trade. J. Shipp. Trade 2018, 3, 1. [Google Scholar] [CrossRef]
  23. Khadim, Z.; Batool, I.; Akbar, A.; Poulova, P.; Akbar, M. Mapping the Moderating Role of Logistics Performance of Logistics Infrastructure on Economic Growth in Developing Countries. Economies 2021, 9, 177. [Google Scholar] [CrossRef]
  24. Alverhed, E.; Hellgren, S.; Isaksson, H.; Olsson, L.; Palmqvist, H.; Flodén, J. Autonomous Last-Mile Delivery Robots: A Literature Review. Eur. Transp. Res. Rev. 2024, 16, 4. [Google Scholar] [CrossRef]
  25. Kolasińska-Morawska, K.; Sułkowski, Ł.; Buła, P.; Brzozowska, M.; Morawski, P. Smart Logistics—Sustainable Technological Innovations in Customer Service at the Last-Mile Stage: The Polish Perspective. Energies 2022, 15, 6395. [Google Scholar] [CrossRef]
  26. Silva, V.; Amaral, A.; Fontes, T. Towards Sustainable Last-Mile Logistics: A Decision-Making Model for Complex Urban Contexts. Sustain. Cities Soc. 2023, 96, 104665. [Google Scholar] [CrossRef]
  27. Sawik, B. Optimizing Last-Mile Delivery: A Multi-Criteria Approach with Automated Smart Lockers, Capillary Distribution and Crowdshipping. Logistics 2024, 8, 52. [Google Scholar] [CrossRef]
  28. Turienzo, J.; Blanco, A.; Lampón, J.F.; Muñoz-Dueñas, M.d.P. Logistics Business Model Evolution: Digital Platforms and Connected and Autonomous Vehicles as Disruptors. Rev. Manag. Sci. 2024, 18, 2483–2506. [Google Scholar] [CrossRef]
  29. Yingfei, Y.; Mengze, Z.; Zeyu, L.; Ki-Hyung, B.; Avotra, A.A.R.N.; Nawaz, A. Green Logistics Performance and Infrastructure on Service Trade and Environment-Measuring Firm’s Performance and Service Quality. J. King Saud Univ. Sci. 2022, 34, 101683. [Google Scholar] [CrossRef]
  30. World Bank. World Development Indicators (WDI) Database; World Bank: Washington, DC, USA, 2024. [Google Scholar]
  31. Martí, L.; Puertas, R.; García, L. The Importance of the Logistics Performance Index in International Trade. Appl. Econ. 2014, 46, 2982–2992. [Google Scholar] [CrossRef]
  32. Tang, C.F.; Abosedra, S. Logistics Performance, Exports, and Growth: Evidence from Asian Economies. Res. Transp. Econ. 2019, 78, 100743. [Google Scholar] [CrossRef]
  33. Aschauer, D.A. Is Public Expenditure Productive? J. Monet. Econ. 1989, 23, 177–200. [Google Scholar] [CrossRef]
  34. Wang, W.; Wu, Q.; Su, J. The impact of international logistics performance on import and export trade: An empirical case of the “Belt and Road” initiative countries. Humanit. Soc. Sci. Commun. 2024, 11, 1028. [Google Scholar] [CrossRef]
  35. Sergi, B.S.; D’Aleo, V.; Konecka, S.; Szopik-Depczyńska, K.; Dembińska, I.; Ioppolo, G. Competitiveness and the Logistics Performance Index: The ANOVA method application for Africa, Asia, and the EU regions. Sustain. Cities Soc. 2021, 69, 102845. [Google Scholar] [CrossRef]
  36. Celbis, G.; Nijkamp, P.; Poot, J. Infrastructure and Trade: A Meta-Analysis. Region 2014, 1, 25–64. [Google Scholar] [CrossRef]
  37. Sargan, J.D. The Estimation of Economic Relationships using Instrumental Variables. Econometrica 1958, 26, 393–415. [Google Scholar] [CrossRef]
  38. Hansen, L.P. Large Sample Properties of Generalized Method of Moments Estimators. Econometrica 1982, 50, 1029–1054. [Google Scholar] [CrossRef]
  39. Arellano, M.; Bond, S. Some tests of specification for panel data: Monte Carlo evidence and an application to employment equations. Rev. Econ. Stud. 1991, 58, 277–297. [Google Scholar] [CrossRef]
  40. Hausman, J.A. Specification tests in econometrics. Econometrica 1978, 46, 1251–1271. [Google Scholar] [CrossRef]
  41. Persson, G.; Virum, H. Growth Strategies for Logistics Service Providers: A Case Study. Int. J. Logist. Manag. 2001, 12, 53–64. [Google Scholar] [CrossRef]
Figure 1. Beta convergence: GDP per capita growth vs. GDP per capita.
Logistics 09 00147 g001
Figure 2. Convergence Sigma. Standard deviation of the log of GDP per capita.
Logistics 09 00147 g002
Table 1. Variable definitions.
VariableDefinition and Units
YGross Domestic Product per employee in $
KGross Capital Formation per employee in $
Kh2School enrollment, secondary (%)
q 1 Customs
q 2 Infrastructure
q 3 International shipments
q 4 Logistics quality and competence
q 5 Tracking and tracing
q 6 Timeliness
Source: compiled from [30].
Table 2. Main descriptive statistics.
VariablesMin.Max.MeanStd. Dev.
Y1337248,36547,37739,336
K185.38118,00011,49710,981
Kh216.16162.2992.3425.73
q 1 1.574.212.910.61
q 2 1.534.603.020.70
q 3 1.674.243.050.49
q 4 1.674.403.090.61
q 5 1.604.383.190.60
q 6 1.804.803.490.58
Note: The data for Y and K are in dollars. The data for Kh2 refer to enrolled students over the net percentage of students of enrollment age for each educational cycle. For this reason, this percentage is sometimes higher than 100%, given that there are students of younger and older ages who enrol in such training cycles. The values of the logistics performance indicators range from 1 to 5.
Table 3. Sample distribution by World Bank income classification (averaged values across 2007–2022).
Income GroupCountry CountYKKH2q1q2q3q4q5q6Adjusted R2
High income4377,47318,709107.743.353.523.373.513.603.880.88
Upper-middle2125,364589390.522.602.722.872.842.963.290.74
Lower-middle1811,177324469.512.332.342.592.512.632.920.80
Low income42330534.2839.122.282.222.562.362.502.750.74
Notes: Variables are averaged over all years included in the sample. Country income group classification follows [30].
Table 4. Model Estimates. Explained Variable: CREC = Ly − Ly (−1).
(GMM One-Step Model)(GMM Two-Step Model)(RE) CREC(FE) CREC
CRECCREC
Ly (−1)−0.226 *−0.240 ***−0.201 ***−0.379 ***
(−2.57)(−3.60)(−12.73)(−10.58)
Lk0.194 **0.227 ***0.159 ***0.331 ***
(3.29)(3.78)(11.26)(15.29)
Lkh20.171 *0.186 *0.0619 ***0.161 ***
(2.14)(2.40)(4.04)(4.04)
Lq10.009410.009090.001020.0311
(0.09)(0.09)(0.02)(0.54)
Lq20.06630.0757−0.0961−0.0625
(0.67)(0.54)(−1.56)(−0.97)
Lq3−0.555−0.564−0.0849−0.117 *
(−1.45)(−1.57)(−1.72)(−2.44)
Lq40.0285−0.1210.298 ***0.273 ***
(0.10)(−0.44)(3.92)(3.60)
Lq50.963 *1.111 **0.229 ***0.177 ***
(2.52)(3.00)(4.28)(3.31)
Lq6−0.662 *−0.613 *−0.315 ***−0.276 ***
(−2.33)(−1.97)(−7.42)(−6.08)
cons−0.850−1.291−0.309 ***−1.288 ***
(−1.23)(−1.67)(−3.93)(−4.57)
N516516516516
Source: Authors. Notes: ***, **, and *: Below the 1%, 5% and 10%, respectively. t statistics in parentheses.
Table 5. Estimated β-coefficients and implied convergence speeds.
Specificationβ Coefficient on Ly (−1)Expected SignImplied Speed of Convergence (%)
With logistics variables−0.363037Negative → evidence of β-convergence0.4516
Without logistics variables−0.337930Negative → evidence of β-convergence0.4137
Notes: Negative coefficient indicates convergence. The β coefficient corresponds to the estimated parameter on lagged GDP per worker (Ly (−1)) from the dynamic growth regression (Equation (8)). The implied speed of convergence is derived using the standard transformation λ = l n ( 1 + β ) / T , where T denotes the time span of the panel intervals (three years given the availability of LPI data).
Table 6. Validation tests.
TestTest Statisticp-ValueNull Hypothesis (H0)Result
Sargan-Hansen [37,38] for overidentifying restrictionschi2 (6) = 3.59810.7309Overidentifying restrictions are validDo not reject H0 (valid)
Arellano & Bond (1991) for autocorrelation (order 1) [39]z = −3.75440.0002No autocorrelation in first-differenced errorsReject H0 (autocorrelation present)
Arellano & Bond (1991) for autocorrelation (order 2) [39]z = −0.24960.8029No autocorrelation in second-order differenced errorsDo not reject H0 (no autocorrelation)
Hausman (1978) [40]chi2 = 3.5584 × 10⁻¹⁴<0.0001Random effects are consistentReject H0 (fixed effects preferred)
Table 7. Augmented Dickey–Fuller (ADF) test.
VariableADF Statisticp-ValueLag UsedObservations
Y−7.251.79 × 10−101600
K−8.061.65 × 10−121600
Kh2−6.782.48 × 10−97594
q1−7.484.83 × 10−116595
q2−6.511.09 × 10−814587
q3−6.752.89 × 10−916585
q4−6.626.07 × 10−914587
q5−6.635.88 × 10−914587
q6−6.664.86 × 10−918583
Notes: All variables were subjected to the Augmented Dickey–Fuller (ADF) unit root test to assess stationarity. The null hypothesis of a unit root (non-stationarity) was rejected for all variables at the 1% significance level, as indicated by the large negative ADF statistics and very low p-values. These results support the use of these variables in dynamic panel data modelling without additional differencing.
Table 8. Robustness Checks: Panel Regression Results on GDP per Employee (Y).
VariableFull Sample (Time FE)Region: Sub-Saharan AfricaRegion: Latin AmericaIncome: Lower MiddleIncome: Upper Middle
K2.441 ***4.518 ***3.296 ***1.866 ***2.833 ***
Kh2106.52 ***35.21 *87.94 ***46.56 **111.89 ***
q17082.16 **−926.98−594.44−3664.77 **−1741.01
q210,494.59 ***1531.512992.654091.41 **−2551.61
q3−5890.43 **−320.24−1114.372218.65−1267.52
q4−2520.391169.741206.32−1219.646281.94 *
q5134.91−623.271551.872506.79897.93
q66906.71 ***632.661531.97472.72−1891.81
Adjusted R-squared0.8810.9610.8830.8030.742
Observations (N)6027791126147
Notes: * p < 0.1, ** p < 0.05, *** p < 0.01.
Disclaimer/Publisher’s Note: The statements, opinions and data contained in all publications are solely those of the individual author(s) and contributor(s) and not of MDPI and/or the editor(s). MDPI and/or the editor(s) disclaim responsibility for any injury to people or property resulting from any ideas, methods, instructions or products referred to in the content.