1. Introduction
A circular economy, which emphasizes the reuse and recycling of end-of-life (EOL) technologies, is essential to the sustainability of critical mineral supply chains. By recovering valuable materials, this approach offers a cost-effective and energy-secure alternative to primary extraction, reducing dependence on geopolitically concentrated sources and mitigating associated national security risks [
1,
2]. Lithium-ion batteries (LIBs) are central to clean energy storage systems, powering electric vehicles (EVs), mopeds, scooters, and other technologies. The increasing adoption of EVs [
3] and the growing role of lithium in technological innovation [
4] underscore lithium’s designation as a high-priority critical mineral [
5]. While clean energy technologies offer significant carbon reduction potential, they rely heavily on LIBs and other storage systems that require critical minerals. The extraction of these minerals involves intensive mining, which already contributes 4–7% of global greenhouse gas emissions [
6]. Thus, to maximize the environmental benefits of clean energy, it is imperative to minimize mining activities [
4].
Projections for LIB demand [
6,
7,
8] indicate a sharp increase in the need for lithium, nickel, cobalt, and manganese. This trend not only exacerbates environmental degradation but also exposes the United States to strategic vulnerabilities. In 2022, the US was 50% or more import-reliant on 51 non-fuel mineral commodities, with 15 of these being 100% import-dependent [
9,
10]. Such dependence poses significant economic and national security risks, particularly in the face of global disruptions like the COVID-19 pandemic.
As noted by [
11,
12], the lithium supply chain must reconcile the competing demands of sustainability, energy security, and national security. Recycling LIBs presents a promising solution by enabling a cradle-to-cradle supply chain model. This approach reduces import reliance, mitigates hazardous waste from improper disposal, and supports a more resilient and sustainable supply chain. Aligned with the principles of the circular economy—repairing, refurbishing, repurposing, and recycling—LIB recycling extends product lifecycles and reduces environmental impact [
13]. However, lithium recycling remains in its early stages, with limited research, fragmented industry data, and infrastructure decisions often driven by economic rather than environmental or logistical considerations.
To address these challenges, this paper proposes a reconfiguration of the traditional lithium reverse logistics network. It presents a comparative evaluation of the modified reverse logistics model against the conventional centralized system, with the goal of improving efficiency, reducing emissions, and enhancing the resilience of the lithium supply chain.
2. Literature Review
2.1. The Significance of Lithium and Its Applications
The current pervasiveness of lithium-ion batteries cannot be overstated: it is virtually a ”one-stop-shop” for almost all electronic applications, from electric vehicles (EVs), critical security and defense infrastructures, consumer electronics, and stationary energy storage systems. Electrifying the US transportation sector—one of the largest contributors to national GHG emissions [
7]—is a practical and impactful step toward decarbonization. This transition supports climate change mitigation, air quality improvement, and a shift toward a clean energy economy. Central to this effort is the energy storage system, which is predominantly powered by lithium-based batteries. Bloomberg’s forecast projects by 2040 that 56 million electric vehicles will be sold worldwide, 17% of which will be sold in the US Similarly, energy storage installations are expected to climax 1095 GW by 2040 from 9 GW in 2018, largely due to the declining cost of LIBs, which already made EVs cost-competitive with fossil-fuel-powered vehicles [
7,
8,
14]. The proliferation of LIBs applications in industrial and consumer electronics has also increased the annual solid stream waste attributed to lithium—this is a growing environmental menace coupled with the health hazards implications of improper disposal of end-of-life LIBs [
15,
16,
17,
18]. This highlights the growing concern for more environmentally sustainable methods to address this problem, and lithium recycling offers a pathway.
2.2. Essence of Lithium Supply Chain
The critical relevance of lithium batteries has led the US to introduce the “National Blueprint for Lithium Batteries” in 2021 following the severe global disruption of the critical mineral supply chain (SC) induced by the COVID-19 outbreak. The vision of the national blueprint for the lithium battery supply chain in the US is to establish a secure supply chain network for both battery materials and its associated technology to maintain competitiveness and minimize national security threats [
7]. The rising demand for electric vehicles and energy storage systems is driving significant growth in the lithium-ion battery (LIB) market, which in turn necessitates the expansion of mining activities for critical minerals such as lithium, cobalt, nickel, etc., to meet increasing production needs [
7,
19]. However, the LIB recycling supply chain has emerged as a viable strategy to reduce the dependence on primary critical mineral extraction, thus mitigating the associated environmental and social impacts of mining. An established LIB recycling SC also has the potential to minimize the import dependence of critical essential minerals necessary for the production of LIBs, which poses both technological innovation and national security threats.
2.3. Existing (Traditional) Lithium Reverse Supply Chain
Several studies have modeled the LIB recycling supply chain to improve sustainability. Ref. [
20] integrated life cycle assessment with GIS to optimize the locations of dismantling and recycling sites in California, achieving a 23% reduction in GHG emissions compared to virgin LIB production. Other researchers used simulation-based approaches to assess remanufacturing strategies, indicating a potential 6–7% reduction in LIB demand [
21] and consequently minimizing efforts geared towards virgin extraction of new critical materials. Ref. [
22] developed a hybrid model that combined agent-based simulation, system dynamics, and metallurgical processes to evaluate long-term economic and environmental impacts, focusing on the role of LIB composition and operational factors in selecting the appropriate recycling methods.
There are several emerging works on the mathematical optimization of reverse logistic for lithium-ion batteries (LIBs), essentially a supply network for the recycling of spent LIBs. Ref. [
23] proposed a decision support tool to optimize the number of recycling facilities needed by developing a mixed-integer programming model of the reverse supply chain network for EOL LIBs. In addition, a two-stage stochastic optimization model was proposed by [
3] to maximize the recycling profit of the reverse logistics supply chain for spent LIBs under price and EOL LIBs return uncertainties.
2.4. Reconfiguration of Lithium Reverse SC
The traditional lithium reverse logistics supply chain network, especially in North America [
3], has always considered the LIB collection, black-mass (BM) production, and recycling phases as distinct hierarchical players in the SC. Black mass is an intermediate product derived from the mechanical processing of spent lithium-ion batteries, consisting of a heterogeneous mixture of valuable materials such as lithium, nickel, cobalt, graphite, etc. However, this paper attempts to reconfigure the SC network using small-scale collection centers that perform the dual function of collecting LIBs and preprocessing them to produce BM as output. This reconfiguration allows large recyclers to focus primarily on critical mineral recovery, repurposing, and remanufacturing of LIBs. The “conventional/traditional” LIB reverse logistic supply chain (SC) network essentially consists of key players: collection centers—solely responsible for the aggregation of spent LIBs; recycling facilities—addresses the preprocessing phase of LIB recycling (disassembling and dismantling, crushing/pulverizing, and separation/filtering) and chemical recovery of lithium and other valuable metals. The proposed reconfiguration of the LIB reverse logistics supply chain shifts the preprocessing responsibilities, usually black-mass production, from centralized recycling facilities to decentralized collection centers [
24]. As a result, collection centers now serve dual roles, also functioning as black-mass production sites. In this study, the terms “collection centers” and “black mass production facilities” are used interchangeably within the context of the decentralized network.
The advantage of the modified reverse logistics supply chain proposed by [
24] lies in decentralizing the labor intensive disassembly of end-of-life LIBs to collection centers. This approach not only streamlines preprocessing but also reduces transportation costs as black mass, being denser and more compact, requires less volume for transport compared to whole batteries in the traditional supply chain.
To establish a secure and efficient LIB reverse logistics supply chain network in the United States, this study makes the following key contributions:
Reconfigure the preprocessing activities of the reverse logistic supply chain among key entities in the supply chain (SC) network;
Pioneer the integration of this reconfigured reverse lithium recycling SC network design;
Evaluate the performance metrics of the design: total SC network cost, CO2 reductions, and key recycling infrastructure location decisions.
3. Problem Statement
The reverse logistic supply chain for the recycling of EOL LIBs consists of three (3) primary activities: collection of EOL LIBs, preprocessing of the collected EOL LIBs into black mass (black-mass production), and recycling—the chemical recovery process through pyrometallurgy, hydrometallurgy, direct recycling, or a combination of these recovery techniques [
4].
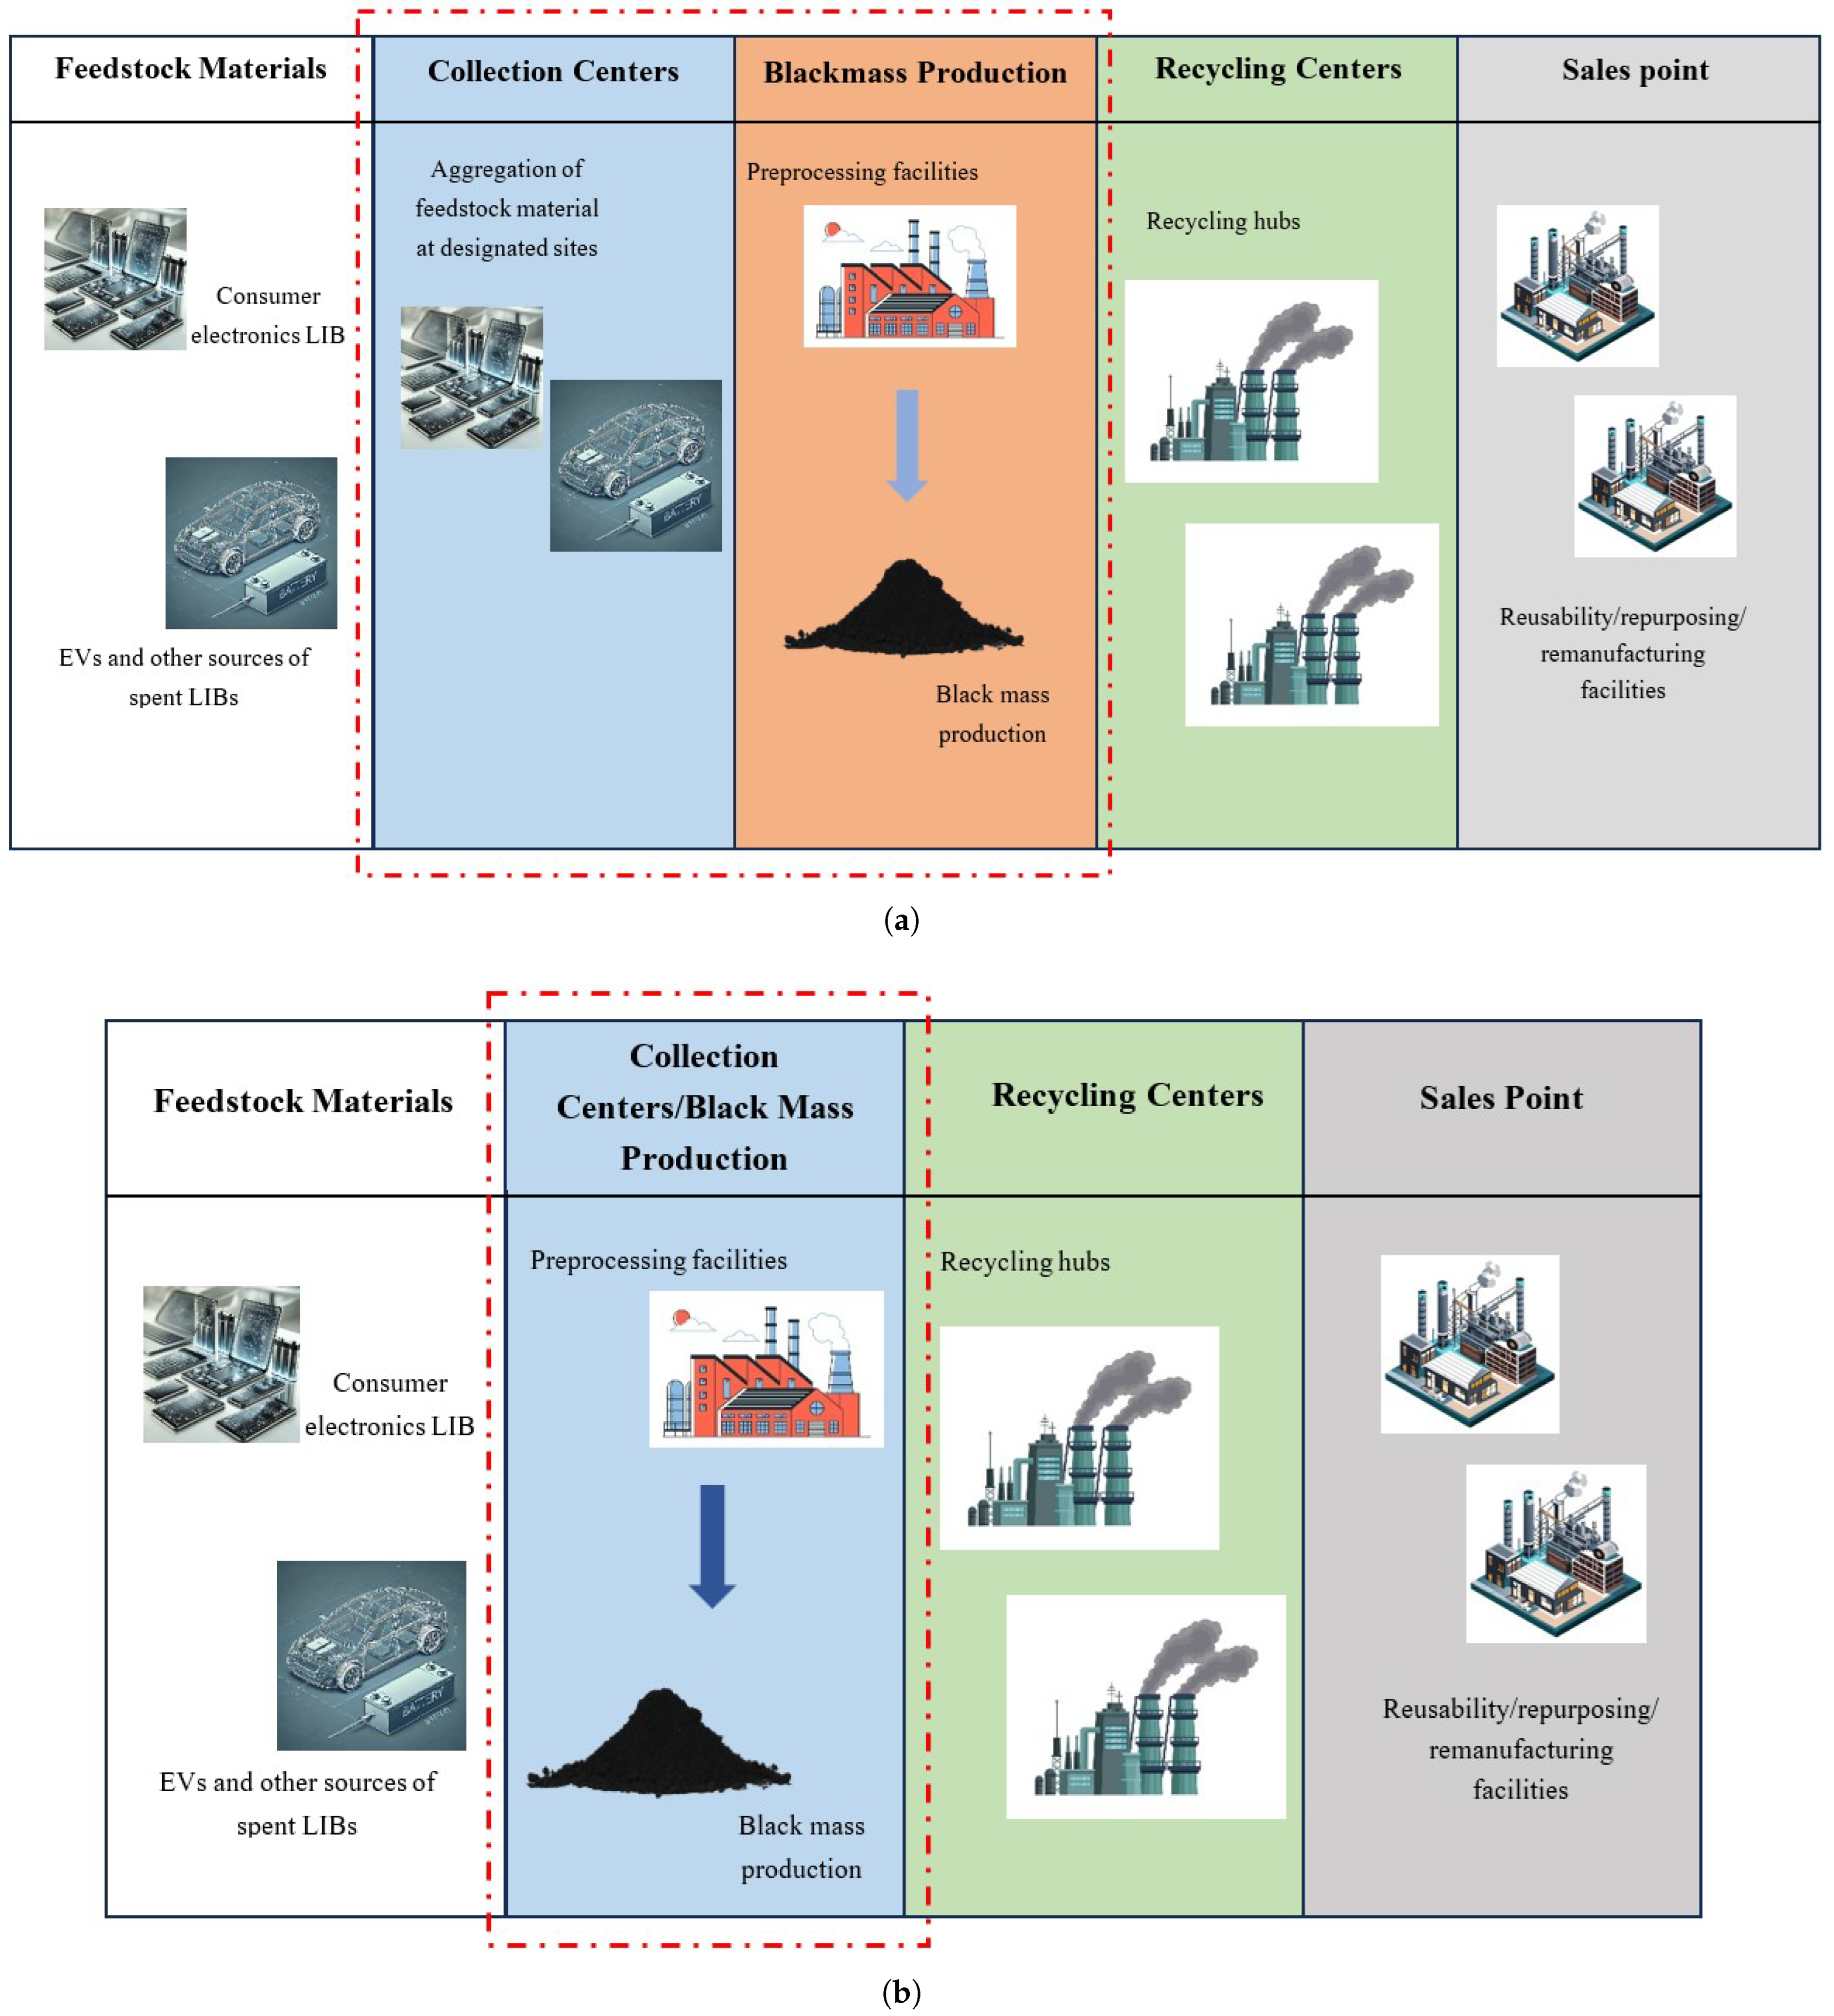
Figure 1 shows a schematic representation of key players in reverse logistics for lithium recycling, highlighting the redistribution of black-mass production operations in
Figure 1a to collection centers in
Figure 1b. The decentralized reverse logistics network benefits from streamlining two operations—the collection of EOL LIBs and the production of BM—that involve two distinct key players in the reverse logistics SC network shown in
Figure 1a to just one key player—collecting centers—managing both operations as shown in
Figure 1b. This redistribution of the preprocessing operations of EOL LIBs prior to material/metal recovery phase of the recycling process is the essence of the proposed lithium reverse logistics supply chain network. Spent LIBs from electric vehicles, consumer electronics, and other sources are aggregated at collection centers, where they undergo preprocessing steps such as discharge, disassembly, and mechanical crushing to produce black mass, a powdery mixture of cathode materials. This black mass is then transported to recycling centers for the recovery of lithium and other valuable metals, which are subsequently reintroduced into industrial supply chains.
The scope of this study, highlighted red in
Figure 1, is focused on the economic and environmental implications of redistributing the preprocessing activities of LIB recycling to collection centers, while the recycling centers focus only on optimizing the chemical recovery of critical minerals. The secondary objective of the scope of this study includes the determination of the optimal number of collection and recycling centers to sustain the reverse logistic supply network, as well as possible transportation flows between these two major players in this modified SC network. This study proposes two reverse logistics network models for lithium-ion battery recycling: a conventional centralized network and a modified decentralized network. The analysis focuses on comparing their total costs and associated CO
2 emissions.
The centralized model, also known as the “traditional” reverse logistics network model, assumes three stages as posited by [
3]; the choice of [
3] is largely due to its ease of replication, the optimization framework, and the lack of published work on the lithium reverse logistics SC network in the literature. The subsequent section details the methodological framework employed in this study.
3.1. Methodology and Differences Between the Models
The key distinction between traditional and proposed lithium reverse logistics networks lies in the configuration of preprocessing operations, which are identified as the main source of inefficiency in the conventional system [
24,
25]. The key modeling differences between the two networks are outlined below.
In the centralized (traditional) network, the preprocessing phase—comprising collection and black mass (BM) production—is divided between two distinct entities: the collection centers handle the aggregation of spent LIBs, while the BM production facilities produce black mass. In contrast, the decentralized model relocates this preprocessing phase to the collection center level, where it is performed by a single key entity—the collection center [
24].
Due to the fire hazard [
26] associated with LIBs generally, the centralized network model incorporates hazardous material transportation costs for moving LIBs from collection centers to black-mass production facilities. In contrast, the decentralized model assumes non-hazardous transportation costs as preprocessing and black-mass production occur at the collection centers.
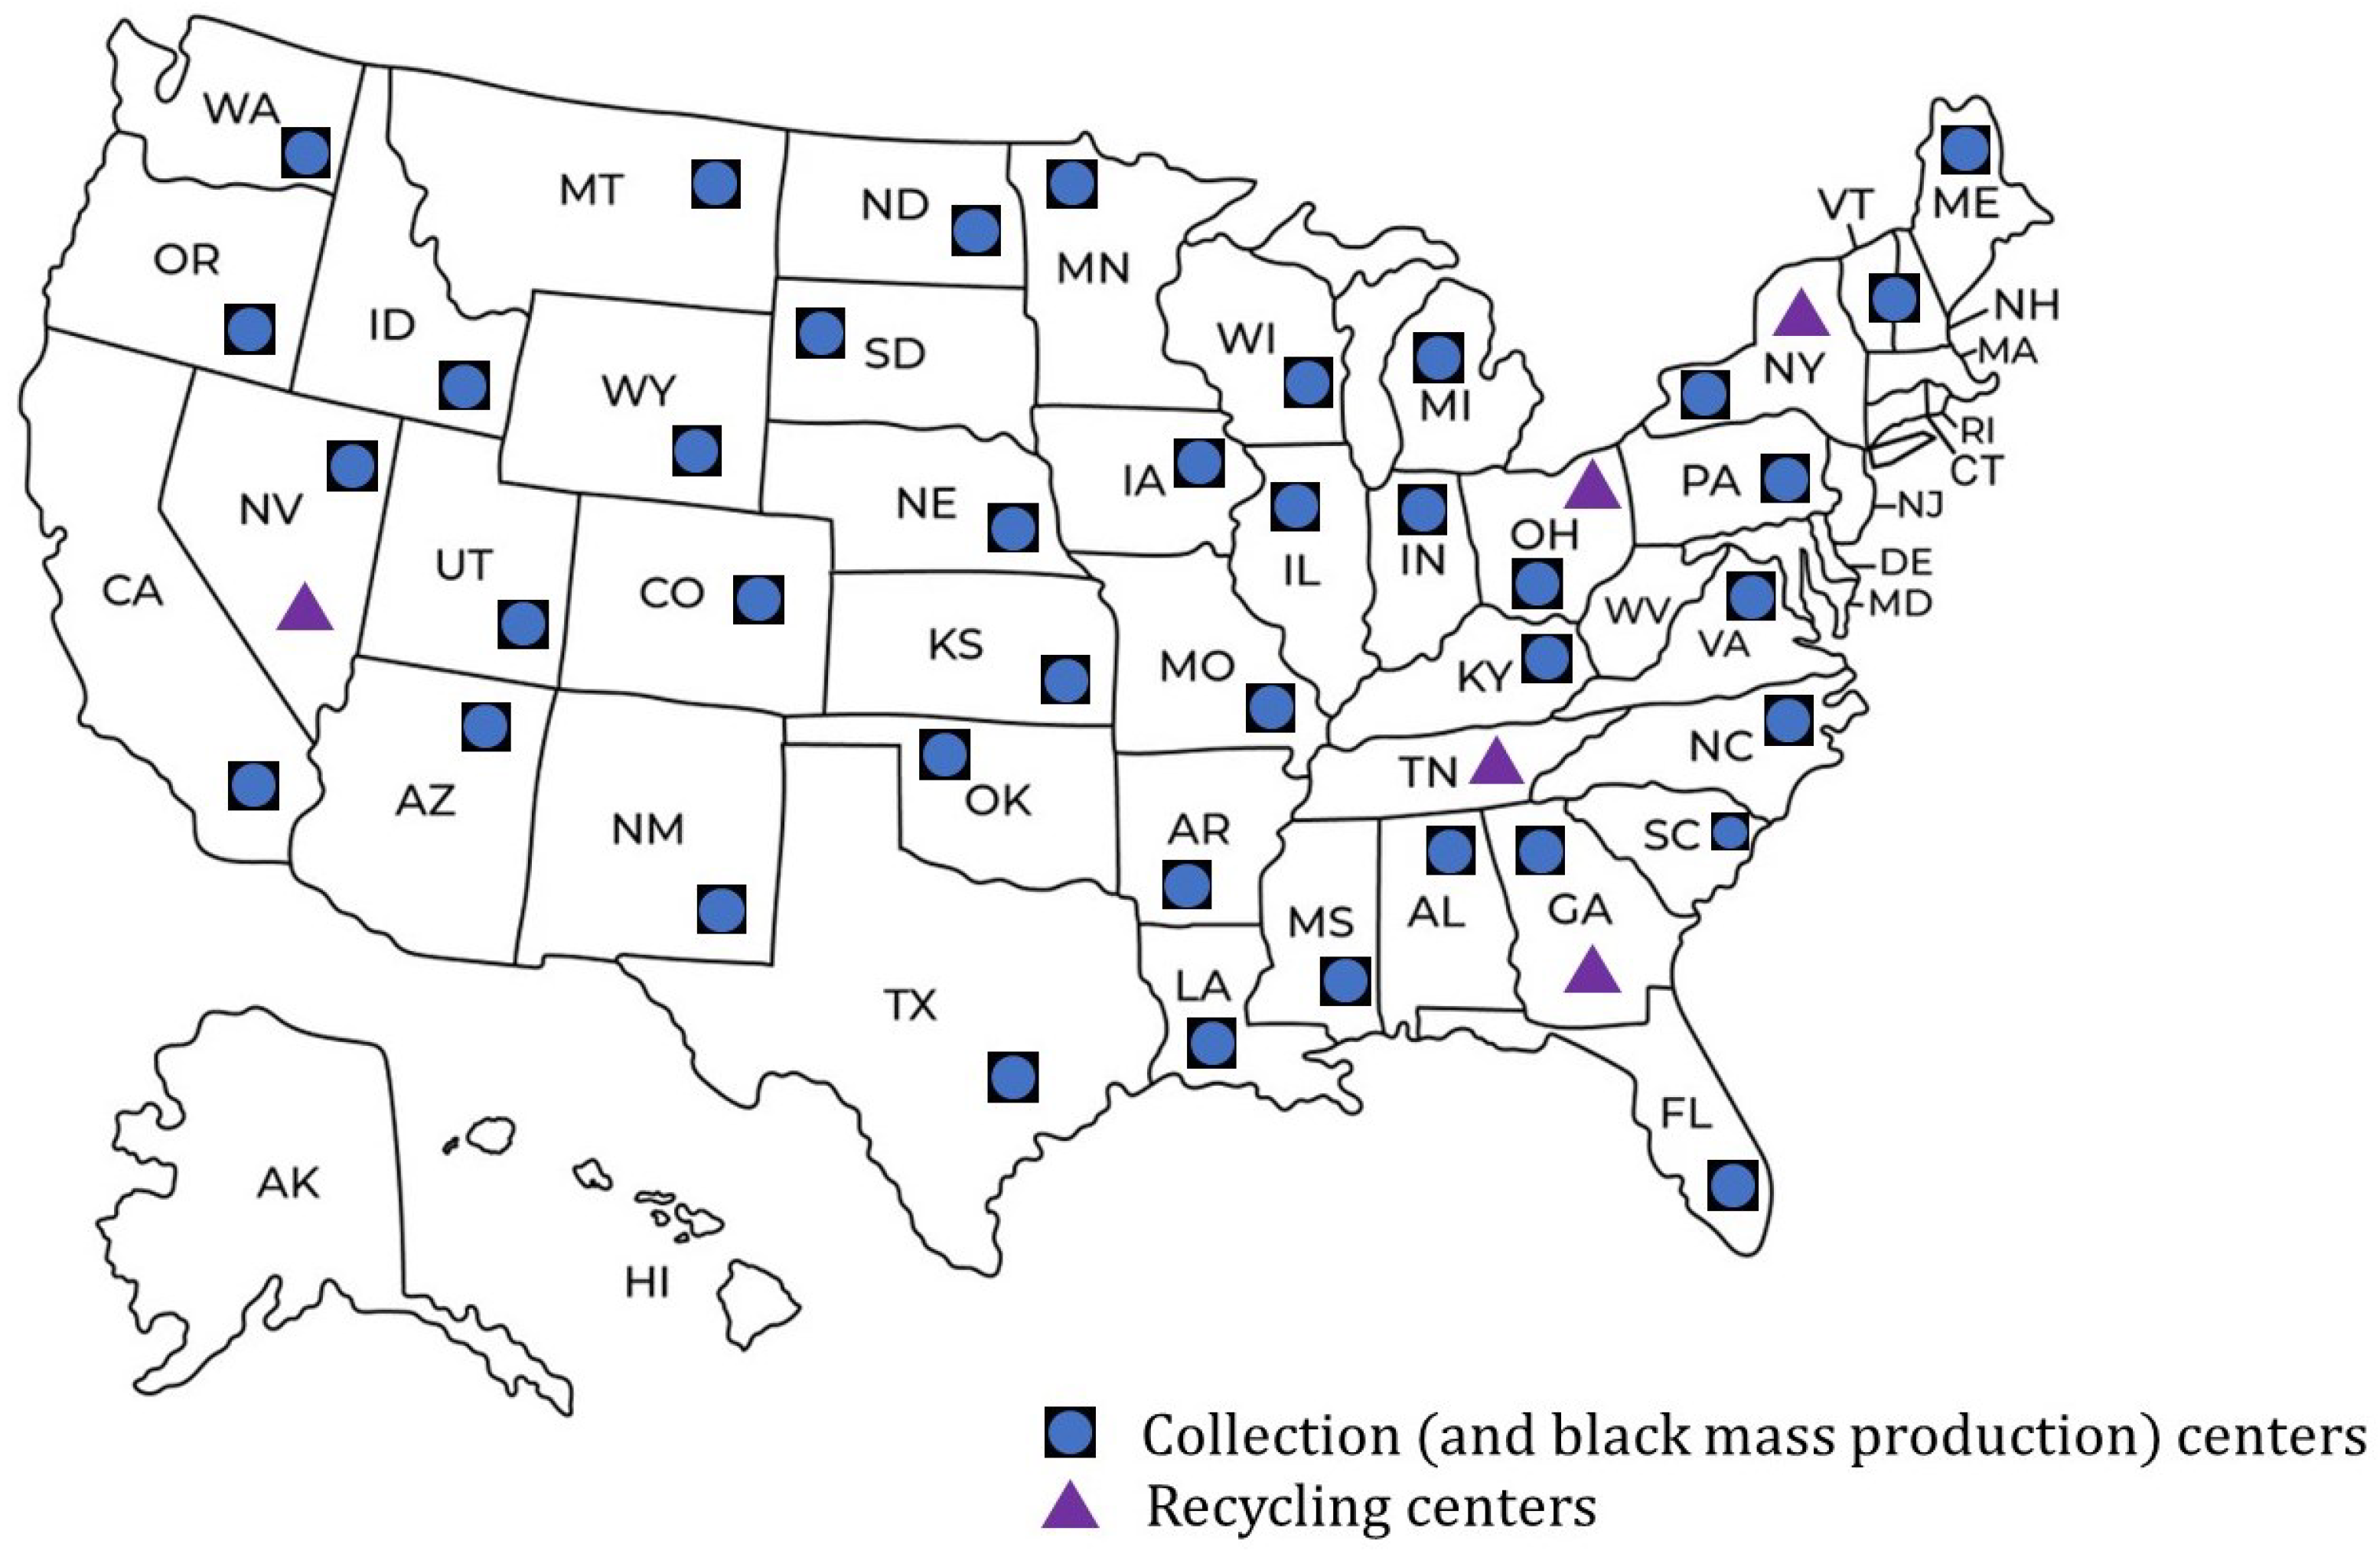
In the centralized model, black-mass (BM) production facilities have a capacity of 100,000 tonnes and are fixed at specific locations, where aggregated EOL LIBs are transported for processing (
Figure 2). In contrast, the decentralized model integrates BM production into collection centers, each with a 1000-tonne capacity, and allows flexible placement of these facilities, as illustrated in
Figure 3.
3.2. Notations
Similar notations to [
3] were adopted for ease of comprehension and comparison.
Sets:
| I | Set of all potential collection center sites |
| J | Set of all potential recycling center sites |
| K | Set of all source locations for LIB scrap/waste |
| Y | Planning periods (2021–2040) |
Constant parameters:
| Parameter | | Value (s) | Source |
| Unit transportation cost of EOL LIBs from originating state to collection centers | | 1 USD 0.00015; 2 USD 0.0092 per kg-mile | [3,27,28] |
| Unit transportation cost of black mass from collection centers to recycling centers | | USD 0.00015 | [3,27,28] |
| End-of-life lithium-ion batteries yearly quantities | | 20% year-on-year growth rate | [3,27,28] |
| Maximum capacity of collection center | | 3 1000 tons; 4 100,000 tons | [3,27,28] |
| Maximum capacity of recycling center | | 50,000 tons | [3,27,28] |
| Operating cost of collection center | | USD 3.8 per kg black mass | [3,27,28] |
| Operating cost of recycling center | | USD 2.5 per kg black mass | [3,27,28] |
| Fixed cost of collection center (black-mass production—100,000 tons/year) | | USD 10,000,000 per facility | [3,27,28] |
| Fixed cost of collection center (black-mass production—1000 tons/year) | | USD 5 150,000 per facility | [3,27,28] |
| Fixed cost of recycling center (100,000 tons/year) | | USD 60,000,000 per facility | [3,27,28] |
| Collection center/BM facility CO2 emission | | 0.035 tons CO2-eq/kWh | [29] |
| Recycling center CO2 emission | | 0.0025 tons CO2-eq/kWh | [29] |
| Conversion factor from LIBs to BM | | ≈0.39 | [30] |
| Transportation emission factor | | 161.8g CO2 per ton-mile | [31] |
| 1 Non-hazardous LIBs. 2 Hazardous LIBs. 3 Decentralized reverse network version. 4 Centralized version of the
network. 5 Additional overhead/administrative cost for reduced black-mass capacity. |
Decision variables:
| Quantity of LIB transported from source location k to collection center i in year y |
| Quantity of black mass transported from collection center i to designated recycling centers j in year y |
| Number of active collection centers i in year y |
| Quantity of EOL LIBs processed at collection center/BM facility i in year y |
| Quantity of BM processed at recycling center j in year y |
| Number of recycling center that is opened in location j |
3.3. Mathematical Model
A deterministic optimization model with centralized and decentralized variants is proposed for reverse logistics networks, with the objective of minimizing total network costs while capturing CO2 emissions throughout the lithium-ion battery recycling chain, from collection to black-mass processing and critical metal recovery. The following expressions help to define the objective function (the minimization of total cost) in the reverse logistics network.
The cost of transporting end-of-life LIBs and black mass in the network is as follows:
The cost of investment and operating collection centers (and black-mass facilities) is as follows:
The cost of investment and operation of recycling centers is as follows:
Combining the cost expressions above, the total cost of the reverse logistics network zooming is given as
Equation (
5) captures the cost of transporting EOL LIBs to collection centers (Equation (
1)), which is not applicable in the decentralized version of the model
*, the cost of black-mass production (Equation (
3)), the cost of transporting black mass (Equation (
2)), and the cost recycling (Equation (
4)).
In general, the objective function of cost minimization is captured in Equation (
6).
In addition, the equivalent CO
2 emissions in the reverse logistics network is tracked using the expression
The optimization model is subject to constraints (
8)–(
14).
Material (LIBs and black mass) flow balance:
Capacity balance (for collection and recycling centers):
4. Case Study
The optimized model was applied to the US lithium reverse logistics network to compare the cost and CO
2 emissions of the proposed decentralized and traditional centralized configurations. The case study includes the 48 contiguous US states as collection centers. In the decentralized model, each state also functions as a black-mass (BM) production facility (
Figure 3). In contrast, the centralized model designates 10 states (NV, TX, OH, TN, AZ, NY, MI, IN, GA, and AL) as BM production sites (
Figure 2), while five states (NV, OH, TN, NY, and GA) serve as recycling hubs in both models. These locations were selected based on data from the NREL LIB supply chain database [
32], considering factors such as feedstock availability, income tax rates, and electricity costs [
3].
Model Assumptions
The following were the assumptions used in the optimization model:
A combined 2021 Li-Cycle study [
30] was used as the end-of-life LIBs (which includes manufacturing scraps, electric vehicles, and other sources of LIBs waste) estimate for the base year 2021, and a 20% year-over-year growth projection [
8] rate was the basis for the EOL LIBs demand used in this study. The EOL LIBs was distributed to contiguous states in the US based on data from vehicle registration counts by state [
33].
Instantaneous fulfillment of collection/recycling centers in the same investment year decision.
The traditional centralized version (
Figure 2) of the network distinguishes the collection of EOL LIBs from the black-mass production facility; this set-up not only ensures a higher volume-to-weight ratio of transported EOL LIBs to black-mass production facilities but also raises the reverse logistics hazard level due to transported of LIBs from collection centers to black-mass production plants.
The proposed decentralized version (
Figure 3) of the reverse logistics network assumes small-scale collection centers of LIBs that doubles as black-mass production centers, resulting in transportation cost savings of EOL LIBs to BM facilities evident in the centralized reverse logistics network.
For the centralized version of the model, we assume no activity/process was carried out at the collection centers; that is, the collection center was a mere temporal holding stage of the EOL LIBs before being transported to the black-mass facility for preprocessing activities.
Due to the comparatively small capacity of the black-mass production facility in the decentralized network model relative to the centralized counterpart, the fixed investment cost was inflated by 50% to account for administrative overhead required at the various scaled-down BM production facilities.
CO2 emissions consideration was only for the collection centers/black-mass production facilities and recycling plants operations; indirect emissions contribution from transportation of the materials between players in the network were not considered.
5. Results
This section summarizes the objective functions, total costs of the reverse supply chain network, and CO2 emissions for centralized (traditional) and decentralized (proposed) lithium reverse logistics models. The models were implemented in Python 3.12.4 and solved using Gurobi Optimizer 12.0 via the GurobiPy interface. Computations were performed on a system equipped with a 12th Gen Intel® Core™ i7-1265U processor (1.8 GHz, 12 logical cores) and 32 GB RAM.
The decentralized lithium reverse logistics model comprised 6221 continuous variables, 2045 integer variables, and 6270 constraints. The model was solved in less than 2 s, yielding a total network cost (infrastructure and operational) of USD 81.5 billion, as detailed in
Table 1 and
Table 2. Although the solution did not reach full optimality, the solver achieved an optimality gap of 0.0091%, which is considered acceptable given the sub-second runtime and the negligible deviation from the optimal solution.
The centralized reverse logistics network was modeled in two phases as an MILP optimization problem. Phase one optimized the transportation of EOL LIBs to designated black-mass (BM) facilities, with 1040 constraints and 10,220 variables, all eliminated by the presolver in 0.01 s. Phase 2 optimized the distribution of BM to the recycling centers, involving 2781 constraints and 2171 variables (1156 continuous and 1015 integer), with 1481 constraints and 166 variables removed during pre-solving. The combined model, with 3821 constraints, was solved in less than 2 s, producing a total network cost of USD 140.2 billion and an optimality gap of approximately 0.0097%.
Table 2 presents the infrastructure required—collection centers/black-mass (BM) production facilities and recycling plants—for both reverse logistics networks over the planning horizon of 2021–2040. Due to their smaller capacity, the decentralized model requires a significantly higher number of collection centers, which also serve as BM production sites. These facilities are rapidly deployed to match the growing volume of end-of-life (EOL) LIBs. In contrast, the centralized model relies on fewer, higher-capacity BM facilities. Although reconfiguration of preprocessing operations has minimal impact on total carbon emissions, the primary emission difference between the two models arises from transportation: moving EOL LIBs to BM facilities and transporting BM to recycling plants. As shown in
Table 3, this distinction contributes significantly to broader climate mitigation efforts.
Based on operational and infrastructure cost analyses from 2021 to 2040 highlighted in
Table 4, the decentralized reverse logistics network—despite incurring approximately 7% higher infrastructure investment due to the high number of modular collection of LIBs and BM processing centers—achieves nearly USD 60 billion in operational and transportation cost savings. In general, this decentralized model results in a 42% total cost reduction compared to the “traditional” centralized network.
Table 5 presents the comparative material flow in both reverse logistics networks. While the total quantities of EOL LIBs and black mass are preserved across both models, the decentralized network eliminates the material flow between collection centers and black-mass production facilities as these functions are co-located. This structural difference directly contributes to the cost savings observed in the decentralized model, as shown in
Table 1.
6. Discussion
The proposed modified lithium reverse logistics network, a decentralized model, is a revision of the preprocessing phase—disassembling, crushing, and black-mass production—of the centralized network model. The decentralized model clearly benefits from the cost savings associated with transporting hazardous LIB transport from collection points to BM production facilities and the reduced weight-to-volume ratio of black-mass transport compared to EOL LIBs. From the perspective of CO
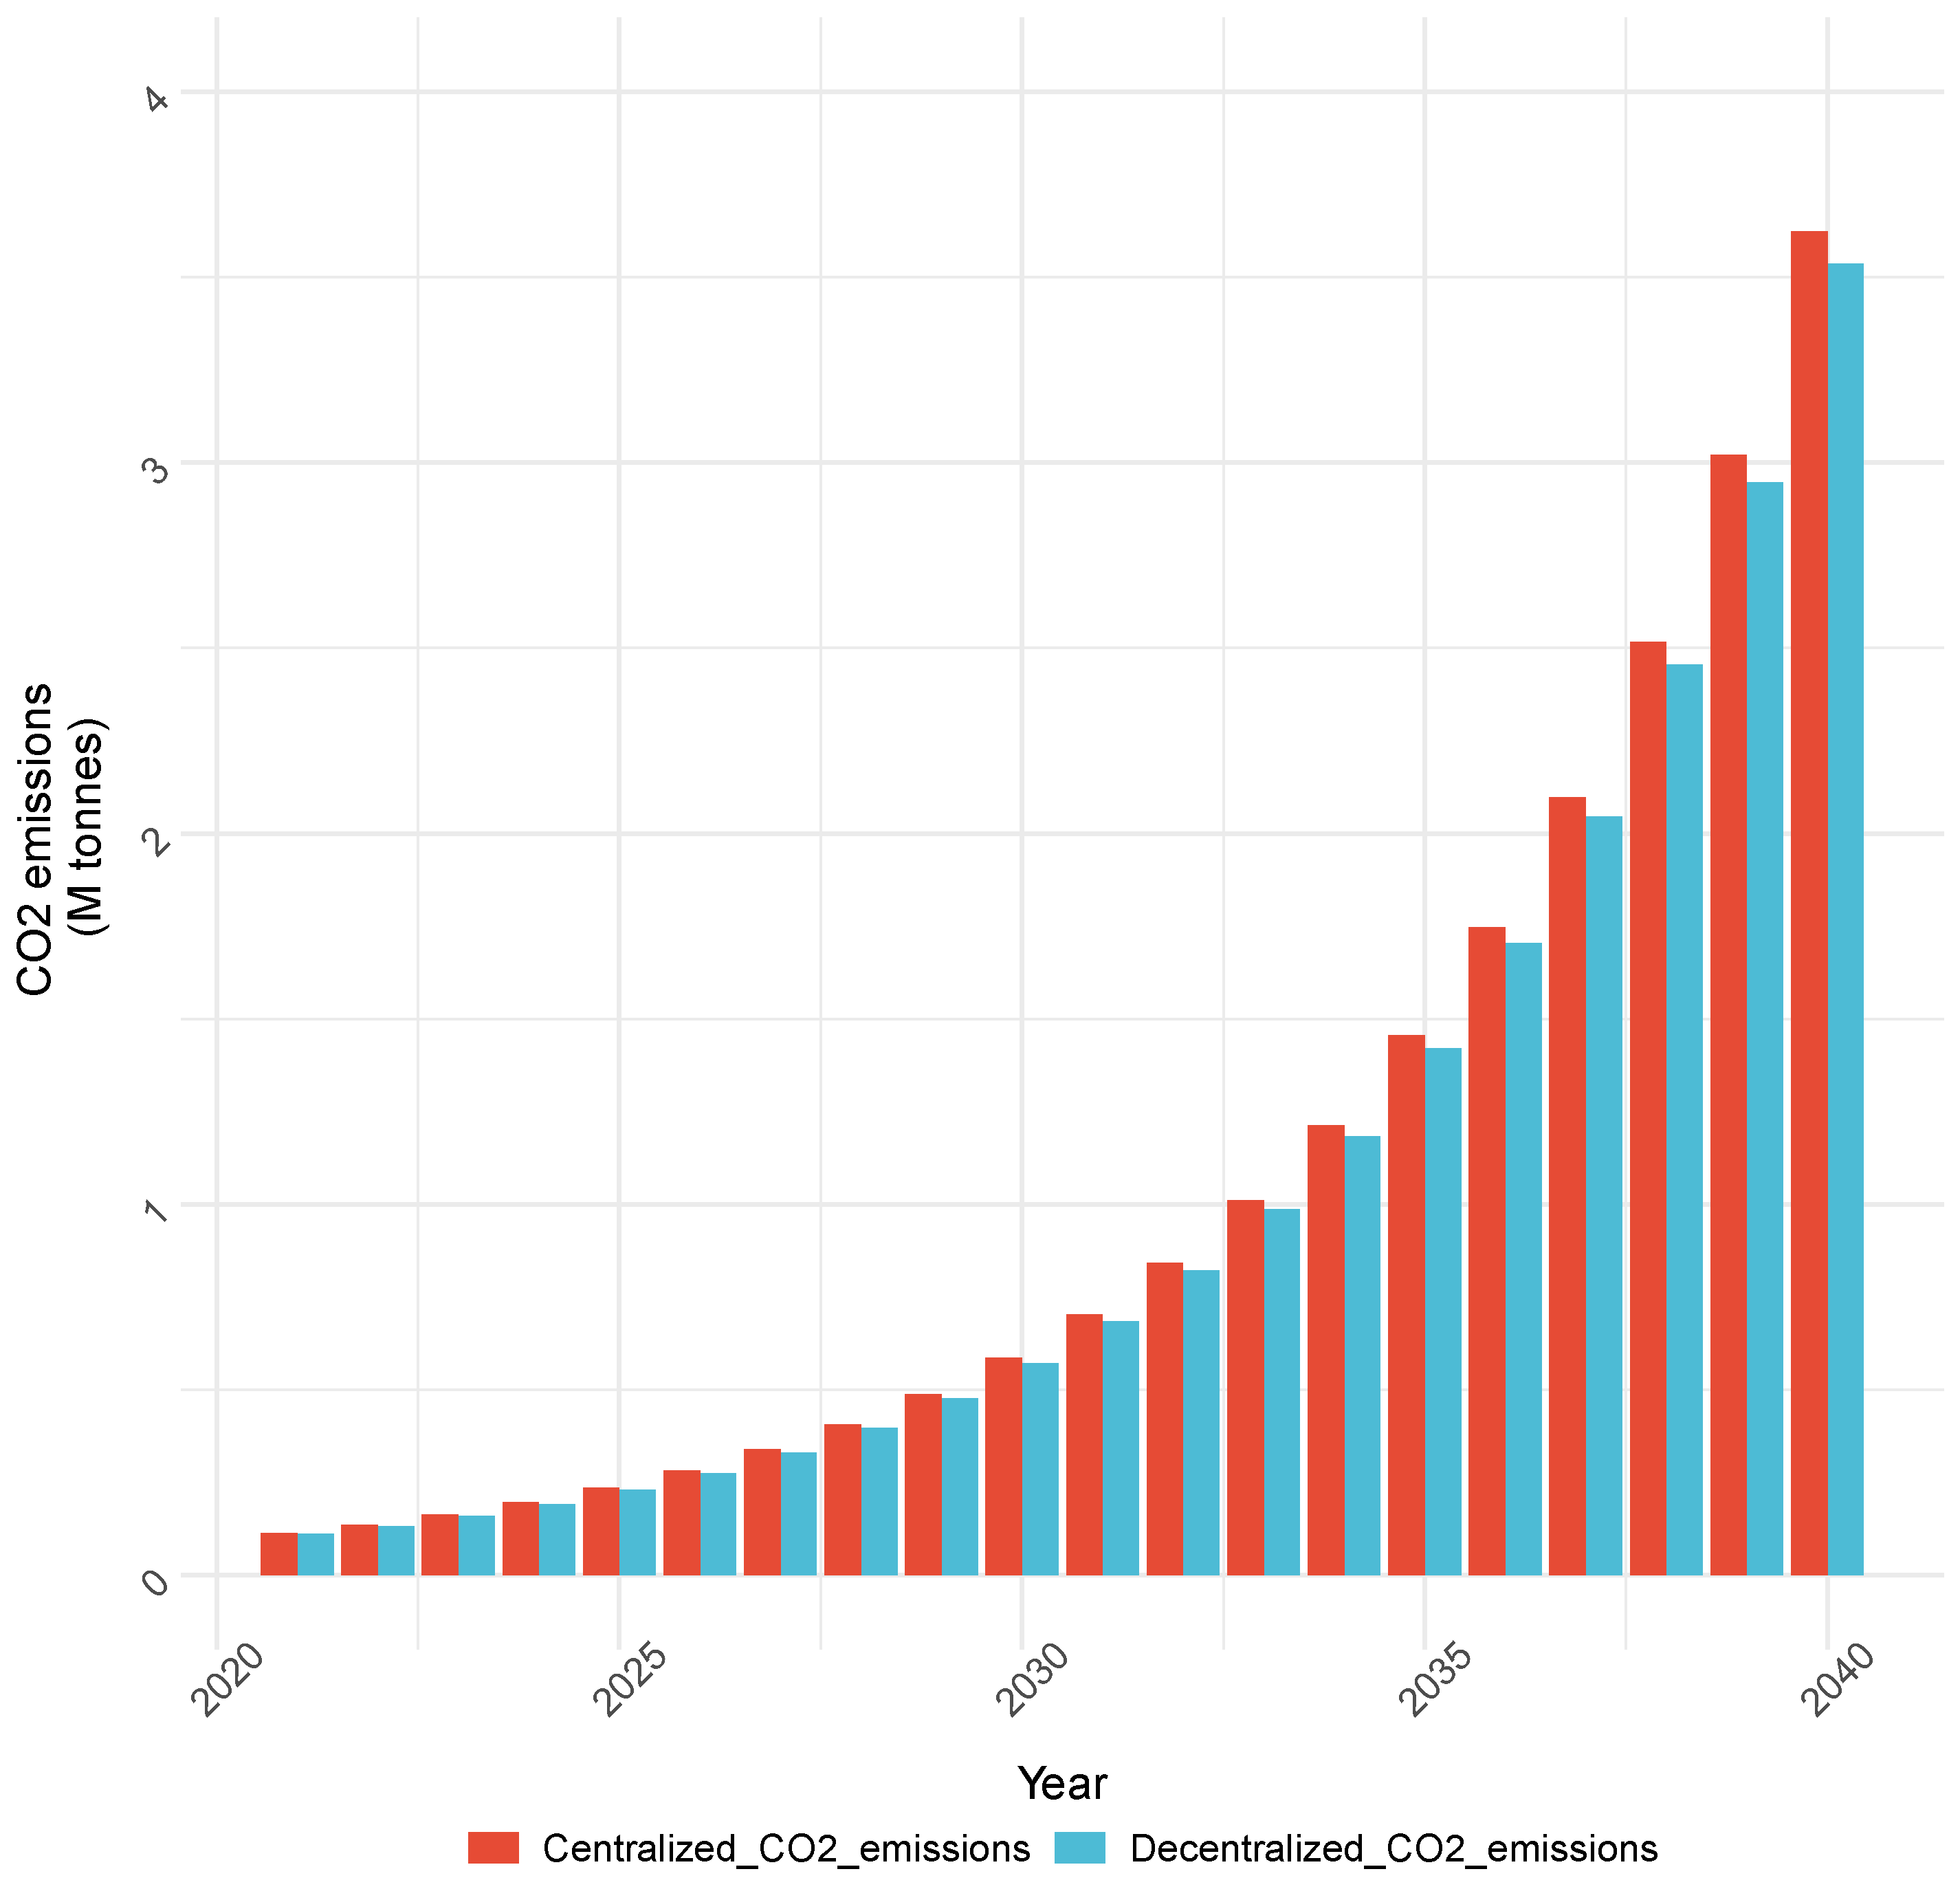
2 emissions from both reverse logistics models, the decentralized version of the network model showed an approximate 20.66 megatons contribution of CO
2 to the environment during the time frame considered, as shown in
Table 3, while the centralized version of the lithium reverse logistics network contributes about 1.025 times the carbon emissions of the decentralized version of the model.
6.1. Key Insights
An overview of the comparative analysis between traditional (centralized) and proposed (decentralized) reverse logistics network models reveals the following key insights.
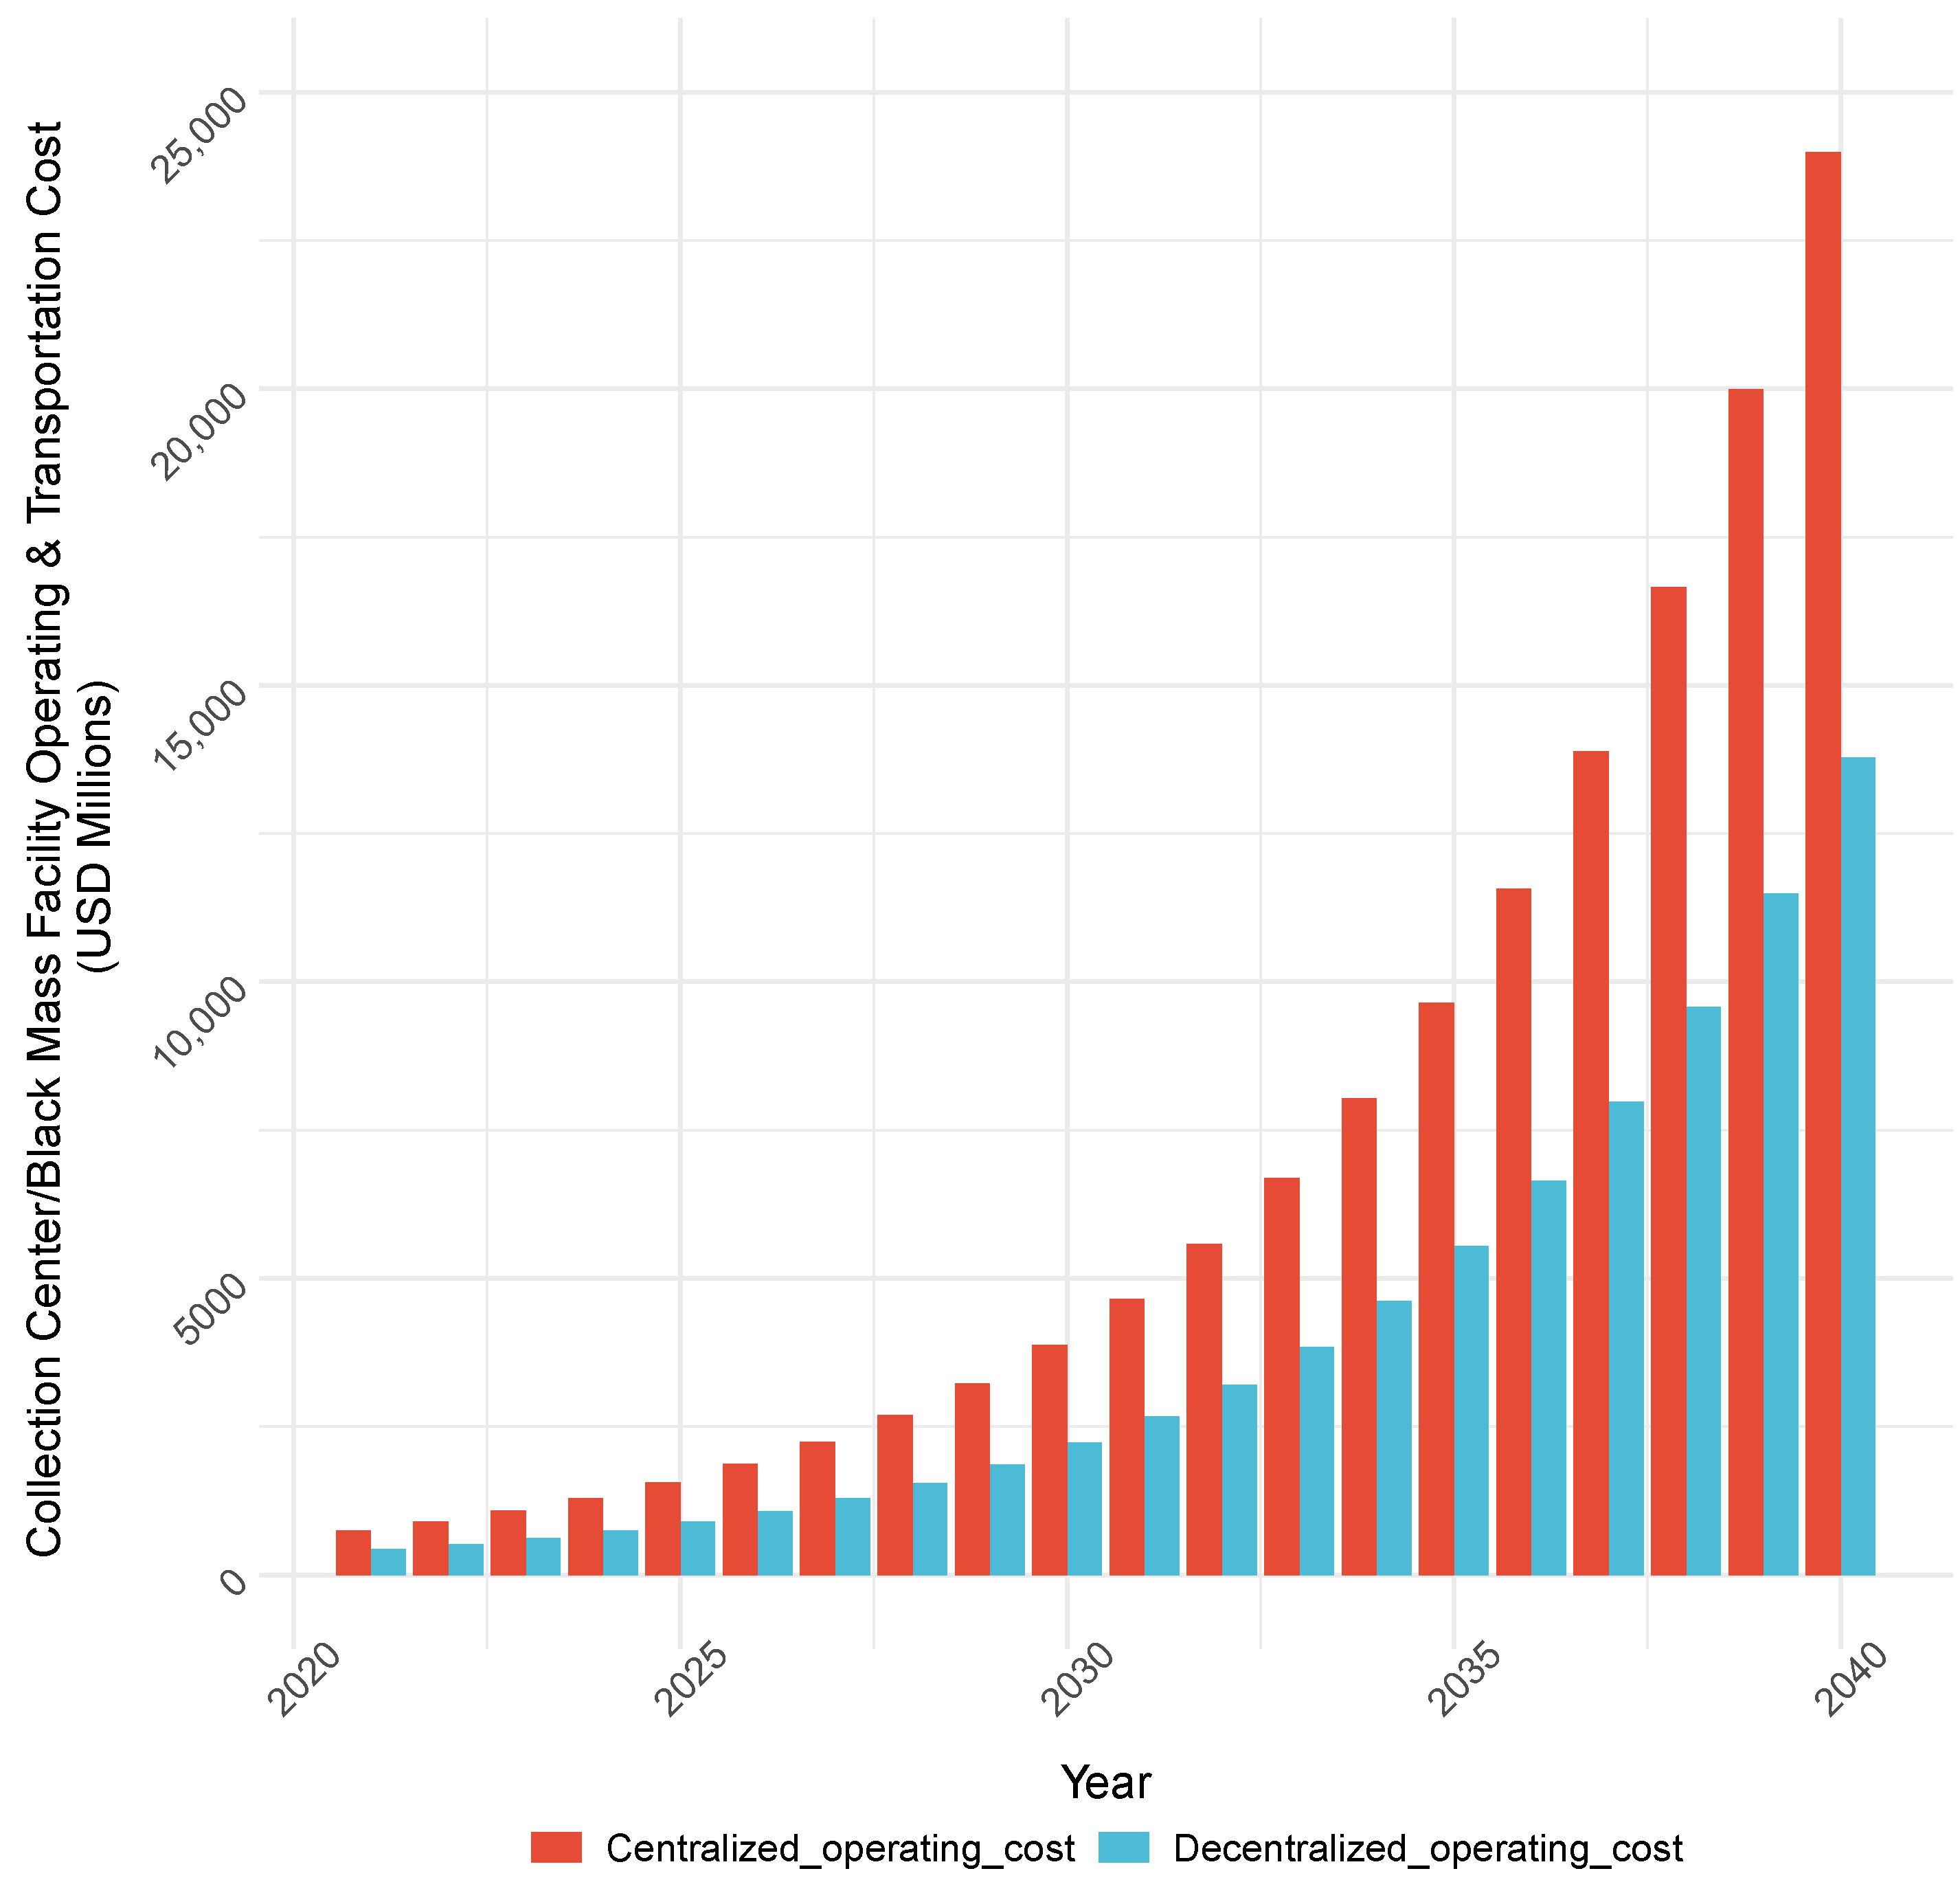
The cost advantage of the decentralized reverse logistics network is primarily driven by the high transportation cost associated with the centralized model. Transporting end-of-life (EOL) LIBs—characterized by a high volume-to-weight ratio and hazardous classification—from widespread collection centers to centralized black-mass (BM) production facilities accounts for approximately the extra total cost implication in the centralized network. In contrast, the decentralized model eliminates this costly transport step by integrating BM production at the collection centers.
Figure 4 shows the propagation of operating cost in both centralized and decentralized networks year on year. It is evident that cost of supporting centralized reverse logistic network operations is significantly higher compared to the proposed decentralized model, which can largely be explained by the huge transportation cost in and around players in the centralized model.
Table 2, however, shows infrastructure cost implications in both networks. Because of the small capacity employed in the decentralized network, large small-scale black-mass-production facilities are required to meet the growing EOL LIBs, resulting in a high investment cost over the period of analysis in this study. Similarly, increased black-mass production capacities were used in the centralized network version, implying minimal administrative and overhead cost compared to the decentralized model as shown in
Table 2. This variation in the capacity of collection center/black-mass facility required by both models is responsible for the high inefficiency in the centralized network caused by low facility usage rate as evident in a comparative review of
Figure 5.
Table 1,
Table 2, and
Table 4 collectively provide a comprehensive cost analysis of the two reverse logistics networks. As illustrated in
Figure 4 and supported by
Table 1, the decentralized network’s elimination of extensive EOL LIB and BM transportation costs significantly outweighs the centralized network’s marginal savings in infrastructure investment in the reverse supply chain network.
The transportation cost of EOL LIBs from collection points to black-mass production facilities in the centralized model was calculated using hazardous material transport factors, resulting in significantly high logistics costs. Even under a scenario where EOL LIBs are treated as non-hazardous—thus applying lower transport cost factors—the centralized reverse logistics network still incurs a higher total cost of USD 82.5 billion. In comparison, the decentralized network remains more cost-effective, outperforming the centralized model by approximately 1.1%, equating to a savings of around USD 1 billion.
Figure 6 illustrates the trend of direct CO
2 emissions from lithium recycling operations across both network models. Since both models process equivalent volumes of EOL LIBs and black mass, their operational emissions are nearly identical, as confirmed in
Table 3. However, the decentralized model achieves additional CO
2 savings by minimizing transportation-related emissions inherent in the centralized network. Beyond emission reduction, the decentralized model promotes a more uniform spatial distribution of carbon emissions, supporting equitable carbon credit allocation based on state-level EOL LIB generation. This structure also facilitates a balanced distribution of the workforce required for recycling operations across geographic regions.
A decentralized black-mass network places processing facilities near the sources of waste lithium-ion batteries (LIBs), resulting in a more equitable distribution of carbon emissions and localized job creation. Regions that generate more end-of-life LIBs benefit from greater employment opportunities. These socio-economic benefits, such as job creation, can be leveraged to craft targeted government policies and incentives for transportation electrification and broader green economic development. In contrast, centralized reverse logistics models concentrate facilities in a few locations, limiting these socio-economic advantages.
Also, given the constant capacity and cost incurred by operating similar recycling facilities in both reverse logistics network models, variation in network costs can be zoned in on the different collection center/black-mass facility capacities and operational mode.
Figure 5 clearly highlights how the usage rate of black-mass facility capacity in both models tracked the available EOL LIBs to process. The decentralized reverse logistic network model was able to respond swiftly to changing demand for more black-mass facility capacity need with respect to the growing EOL LIBs waste as shown in
Figure 5b compared to the centralized network model (
Figure 5a), which built out excess capacity of black-mass plants than required at any given year. In essence, the centralized model had built-in waste in the capacity of BM facility not in use year to year, while unused BM capacity was minimal in decentralized version of the network.
One of the model assumptions in Model Assumptions Section (ii) addressed the instantaneous fulfillment of infrastructure need in the same year it is required. In a real-world scenario, this is not the case; the time required to fulfill infrastructure is largely dependent on the size of the black-mass facility being built. The decentralized version of the reverse logistics network utilizes a 1000-tonne black-mass facility, while the centralized model version uses a 100,000-tonne one. This further highlights the resiliency advantage of the decentralized reverse logistics network as it requires less time to fulfill infrastructure needs than the centralized network.
6.2. Limitations/Future Work
The comparative analysis effort detailed in this work, though useful, is relatively simplistic. An expansion of the work will yield robust evaluation of both models and capture real-world scenarios as discussed below;
Update the model to capture end-to-end operations in the reverse logistics network, that is, from acquisition of LIB feedstock, collection centers, black-mass production, recycling, and resale of recovered materials. This will allow for other financial performance metrics (such as revenue, profit, etc.) to be explored.
Evaluation of non-financial performance metric, like resilience, in the model will enhance the robustness of the model given the tumultuous terrain of lithium (and other critical minerals).
7. Conclusions
A comparative analysis of decentralized and centralized lithium reverse logistics networks reveals that the decentralized model consistently outperforms the centralized model in both financial and environmental metrics. Although traditional infrastructure planning has favored centralized systems, integrating decentralized elements into future network designs offers significant advantages. Hybridizing these approaches can reduce overall costs, improve environmental outcomes, and improve the resilience of the network system.
The proposed framework provides a basis for establishing a robust and resilient lithium reverse logistic network while minimizing the cost and environmental impacts of the operations. The proposed model also provides information for decision-makers on operational reorganization decisions that are required to improve productivity while improving the carbon footprint.
Author Contributions
Conceptualization, E.C.J.J. and O.S.A.; methodology, O.S.A.; software, O.S.A.; validation, E.C.J.J. and O.S.A.; formal analysis, O.S.A.; investigation, O.S.A.; resources, E.C.J.J.; data curation, O.S.A.; writing—original draft preparation, O.S.A.; writing—review and editing, E.C.J.J. and O.S.A.; visualization, O.S.A.; supervision, E.C.J.J.; project administration, E.C.J.J.; funding acquisition, E.C.J.J. All authors have read and agreed to the published version of the manuscript.
Funding
This research received no external funding.
Data Availability Statement
The original data and parametric assumptions used in this study are included in the article. Further inquiries can be directed to the corresponding author.
Conflicts of Interest
The authors declare no conflicts of interest.
Abbreviations
The following abbreviations are used in this manuscript:
| EOL | End-of-life |
| LIBs | Lithium-ion batteries |
| BM | Black mass |
| SC | Supply chain |
| USD | Dollar currency ($) |
| US | United States |
| CO2 | Carbon dioxide |
| MILP | Mixed integer linear programming |
| QP | Quadratic programming |
| EVs | Electric vehicles |
References
- Leary, J. China’s Trade Embargo on Critical Minerals to the United States—A Ripple Effect of the New Trump Administration; Herbert Smith Freehills: London, UK, 2024; Available online: https://www.herbertsmithfreehills.com/insights/2024-12/chinas-trade-embargo-on-critical-minerals-to-the-united-states (accessed on 26 December 2024).
- Lv, A.; Munroe, T. China Bans Export of Critical Minerals to US as Trade Tensions Escalate; Reuters: London, UK, 2024; Available online: https://www.reuters.com/markets/commodities/china-bans-exports-gallium-germanium-antimony-us-2024-12-03/ (accessed on 26 December 2024).
- Saha, A.; Jin, H. Stochastic optimization of value recovery network for Li-ion batteries in the United States under price and return volume uncertainties. Resour. Conserv. Recycl. 2024, 206, 107623. [Google Scholar] [CrossRef]
- Bae, H.; Kim, Y. Technologies of lithium recycling from waste lithium ion batteries: A review. Mater. Adv. 2021, 2, 3234–3250. Available online: https://pubs.rsc.org/en/content/articlehtml/2021/ma/d1ma00216c (accessed on 1 June 2025). [CrossRef]
- Environmental Protection Agency, U.S. Lithium-Ion Battery Recycling. 2024. Available online: https://www.epa.gov/hw/lithium-ion-battery-recycling#:~:text=Safe%20recycling%20of%20lithium%2Dion,more%20sustainable%20approach%20than%20disposal (accessed on 26 December 2024).
- Delevingne, L.; Glazener, W.; Grégoir, L.; Henderson, K. Climate Risk and Decarbonization: What Every Mining CEO Needs to Know; McKinsey Sustainability: New York, NY, USA, 2020; Available online: https://www.mckinsey.com/capabilities/sustainability/our-insights/climate-risk-and-decarbonization-what-every-mining-ceo-needs-to-know (accessed on 26 December 2024).
- Department of Energy, U.S., United States National Blueprint for Lithium Batteries. 2021. Available online: https://www.energy.gov/sites/default/files/2021-06/FCAB%20National%20Blueprint%20Lithium%20Batteries%200621_0.pdf (accessed on 27 December 2024).
- BloombergNEF. Energy Storage Investments Boom as Battery Costs Halve in the Next Decade. 2019. Available online: https://about.bnef.com/blog/energy-storage-investments-boom-battery-costs-halve-next-decade/ (accessed on 27 December 2024).
- National Mining Association. U.S. Reaches Highest Recorded Mineral Import Reliance; National Mining Association: Washington, DC, USA, 2023; Available online: https://nma.org/2023/01/31/u-s-reaches-highest-recorded-mineral-import-reliance/ (accessed on 27 December 2024).
- U.S. Geological Survey. Mineral Commodity Summaries 2025. Available online: https://pubs.usgs.gov/publication/mcs2025 (accessed on 7 May 2025).
- Graham, J.; Rupp, J.; Brungard, E. Lithium in the Green Energy Transition: The Quest for Both Sustainability and Security. Sustainability 2021, 13, 11274. [Google Scholar] [CrossRef]
- Jones, E.C., Jr. Climate and Trade Policy for Risk Management: The Need for Geopolitical Analytical Frameworks for Supply Chain and Energy System Modeling. Curr. Sustain. Renew. Energy Rep. 2025, 12, 9. [Google Scholar] [CrossRef]
- European Parliament. Circular Economy: Definition, Importance and Benefits; Topics European Parliament: London, UK, 2023; Available online: https://www.europarl.europa.eu/topics/en/article/20151201STO05603/circular-economy-definition-importance-and-benefits#:~:text=The%20circular%20economy%20is%20a,cycle%20of%20products%20is%20extended. (accessed on 19 December 2024).
- Choi, H.; Kim, M.; Roh, H.; Hwang, D.; Yoon, Y.; Kang, Y.; Jeon, T. A Material Flow Analysis of Electric Vehicle Lithium-ion Batteries: Sustainable Supply Chain Management Strategies. Sustainability 2025, 17, 4560. [Google Scholar] [CrossRef]
- UN Trade & Development. Now 8 Billion and Counting: Where the World’s Population Has Grown Most and Why That Matters; UNCTAD: United Nations Publications 2022. Available online: https://unctad.org/data-visualization/now-8-billion-and-counting-where-worlds-population-has-grown-most-and-why (accessed on 12 August 2024).
- Busch, P.; Chen, Y.; Ogbonna, P.; Kendall, A. Effects of demand and recycling on the when and where of lithium extraction. Nat. Sustain. 2025, 8, 773–783. [Google Scholar] [CrossRef]
- Leiserson, C.; Thompson, N.; Emer, J.; Kuszmaul, B.; Lampson, B.; Sanchez, D.; Schardl, T. There’s plenty of room at the Top: What will drive computer performance after Moore’s law? Sci. J. 2020, 368, eaam9744. [Google Scholar] [CrossRef] [PubMed]
- World Health Organization. Electronic Waste (e-Waste). 2023. Available online: https://www.who.int/news-room/fact-sheets/detail/electronic-waste-(e-waste) (accessed on 1 July 2024).
- Mayyas, A.; Steward, D.; Mann, M. The case for recycling: Overview and challenges in the material supply chain for automotive li-ion batteries. Sustain. Mater. Technol. 2019, 19, e00087. Available online: https://www.sciencedirect.com/science/article/pii/S2214993718302926 (accessed on 17 May 2025). [CrossRef]
- Hendrickson, T.; Kavvada, O.; Shah, N.; Sathre, R.; Scown, C. Life-cycle implications and supply chain logistics of electric vehicle battery recycling in California. Environ. Res. Lett. 2015, 10, 014011. [Google Scholar] [CrossRef]
- Huster, S.; Glöser-Chahoud, S.; Rosenberg, S.; Schultmann, F. A simulation model for assessing the potential of remanufacturing electric vehicle batteries as spare parts. J. Clean. Prod. 2022, 363, 132225. Available online: https://www.sciencedirect.com/science/article/pii/S0959652622018303 (accessed on 17 May 2025). [CrossRef]
- Wasesa, M.; Hidayat, T.; Andariesta, D.; Natha, M.; Attazahri, A.; Afrianto, M.; Mubarok, M.; Zulhan, Z.; Putro, U. Economic and environmental assessments of an integrated lithium-ion battery waste recycling supply chain: A hybrid simulation approach. J. Clean. Prod. 2022, 379, 134625. Available online: https://www.sciencedirect.com/science/article/pii/S095965262204197X (accessed on 17 May 2025). [CrossRef]
- Tadaros, M.; Migdalas, A.; Samuelsson, B.; Segerstedt, A. Location of facilities and network design for reverse logistics of lithium-ion batteries in Sweden. Oper. Res. 2022, 22, 895–915. [Google Scholar] [CrossRef]
- Atitebi, O.; Dumre, K.; Jones, E. Supporting a Lithium Circular Economy via Reverse Logistics: Improving the Preprocessing Stage of the Lithium-Ion Battery Recycling Supply Chain. Energies 2025, 18, 651. [Google Scholar] [CrossRef]
- Ali, H.; Khan, H.; Pecht, M. Preprocessing of spent lithium-ion batteries for recycling: Need, methods, and trends. Renew. Sustain. Energy Rev. 2022, 168, 112809. [Google Scholar] [CrossRef]
- New York Government. Safety Tips and Precautions Dangers of Lithium-Ion Batteries. Available online: https://www.nyc.gov/assets/fdny/downloads/pdf/codes/dangers-of-lithium-ion-batteries.pdf (accessed on 29 August 2024).
- Dai, Q.; Spangenberger, J.; Ahmed, S.; Gaines, L.; Kelly, J.; Wang, M. EverBatt: A Closed-loop Battery Recycling Cost and Environmental Impacts Model. 2019. Available online: https://www.osti.gov/biblio/1530874 (accessed on 17 May 2025).
- Diaz, L.; Strauss, M.; Adhikari, B.; Klaehn, J.; McNally, J.; Lister, T. Electrochemical-assisted leaching of active materials from lithium ion batteries. Resour. Conserv. Recycl. 2020, 161, 104900. Available online: https://www.sciencedirect.com/science/article/pii/S0921344920302184 (accessed on 6 March 2025). [CrossRef]
- Jones, E. Lithium Supply Chain Optimization: A Global Analysis of Critical Minerals for Batteries. Energies 2024, 17, 2685. [Google Scholar] [CrossRef]
- Li-Cycle Li-Cycle Upsized Hub and Strategic Collaboration with LG. Investor Presentation. 2021. Available online: https://s27.q4cdn.com/432858399/files/doc_presentations/2021/12/SLIDES-LG-Collaboration-and-Hub-Upsize-LICY-Investor-Presentation-12.14.2021-v-Final-for-posting.pdf (accessed on 17 November 2024).
- Mathers, J.; Craft, E.; Norsworthy, M.; Wolfe, J. The Green Freight Handbook—A Practical Guide for Developing a Sustainable Freight Transportation Strategy for Business. Environmental Defense Fund, 2015. Available online: https://library.edf.org/AssetLink/c6l6u662aa027518edh624a0775kyi82.pdf?_gl=1*5cnyvq*_gcl_au*MTMxMjk2NjgzNC4xNzUwMTU0MDMw*_ga*NzkwNTg1OTY2LjE3NTAxNTQwMzA.*_ga_2B3856Y9QW*czE3NTAxNjUwNzIkbzIkZzEkdDE3NTAxNjU0MzAkajYwJGwwJGgw (accessed on 17 June 2025).
- National Renewable Energy Laboratory. NAATBatt Lithium-Ion Battery Supply Chain Database | Transportation and Mobility Research. 2022. Available online: https://www.nrel.gov/transportation/li-ion-battery-supply-chain-database (accessed on 2 June 2025).
- U.S. Department of Energy: Office of Energy Efficiency and Renewable. Vehicle Registration Counts by State. Alternative Fuels Data Center. 2023. Available online: https://afdc.energy.gov/vehicle-registration?year=2023 (accessed on 17 November 2024).
| Disclaimer/Publisher’s Note: The statements, opinions and data contained in all publications are solely those of the individual author(s) and contributor(s) and not of MDPI and/or the editor(s). MDPI and/or the editor(s) disclaim responsibility for any injury to people or property resulting from any ideas, methods, instructions or products referred to in the content. |
© 2025 by the authors. Licensee MDPI, Basel, Switzerland. This article is an open access article distributed under the terms and conditions of the Creative Commons Attribution (CC BY) license (https://creativecommons.org/licenses/by/4.0/).


