
Container Traffic in the Colombian Caribbean: A Competitiveness Analysis of the Port of Santa Marta Through a Technical–Economic Combination Framework

 ,
, 

Abstract
1. Introduction
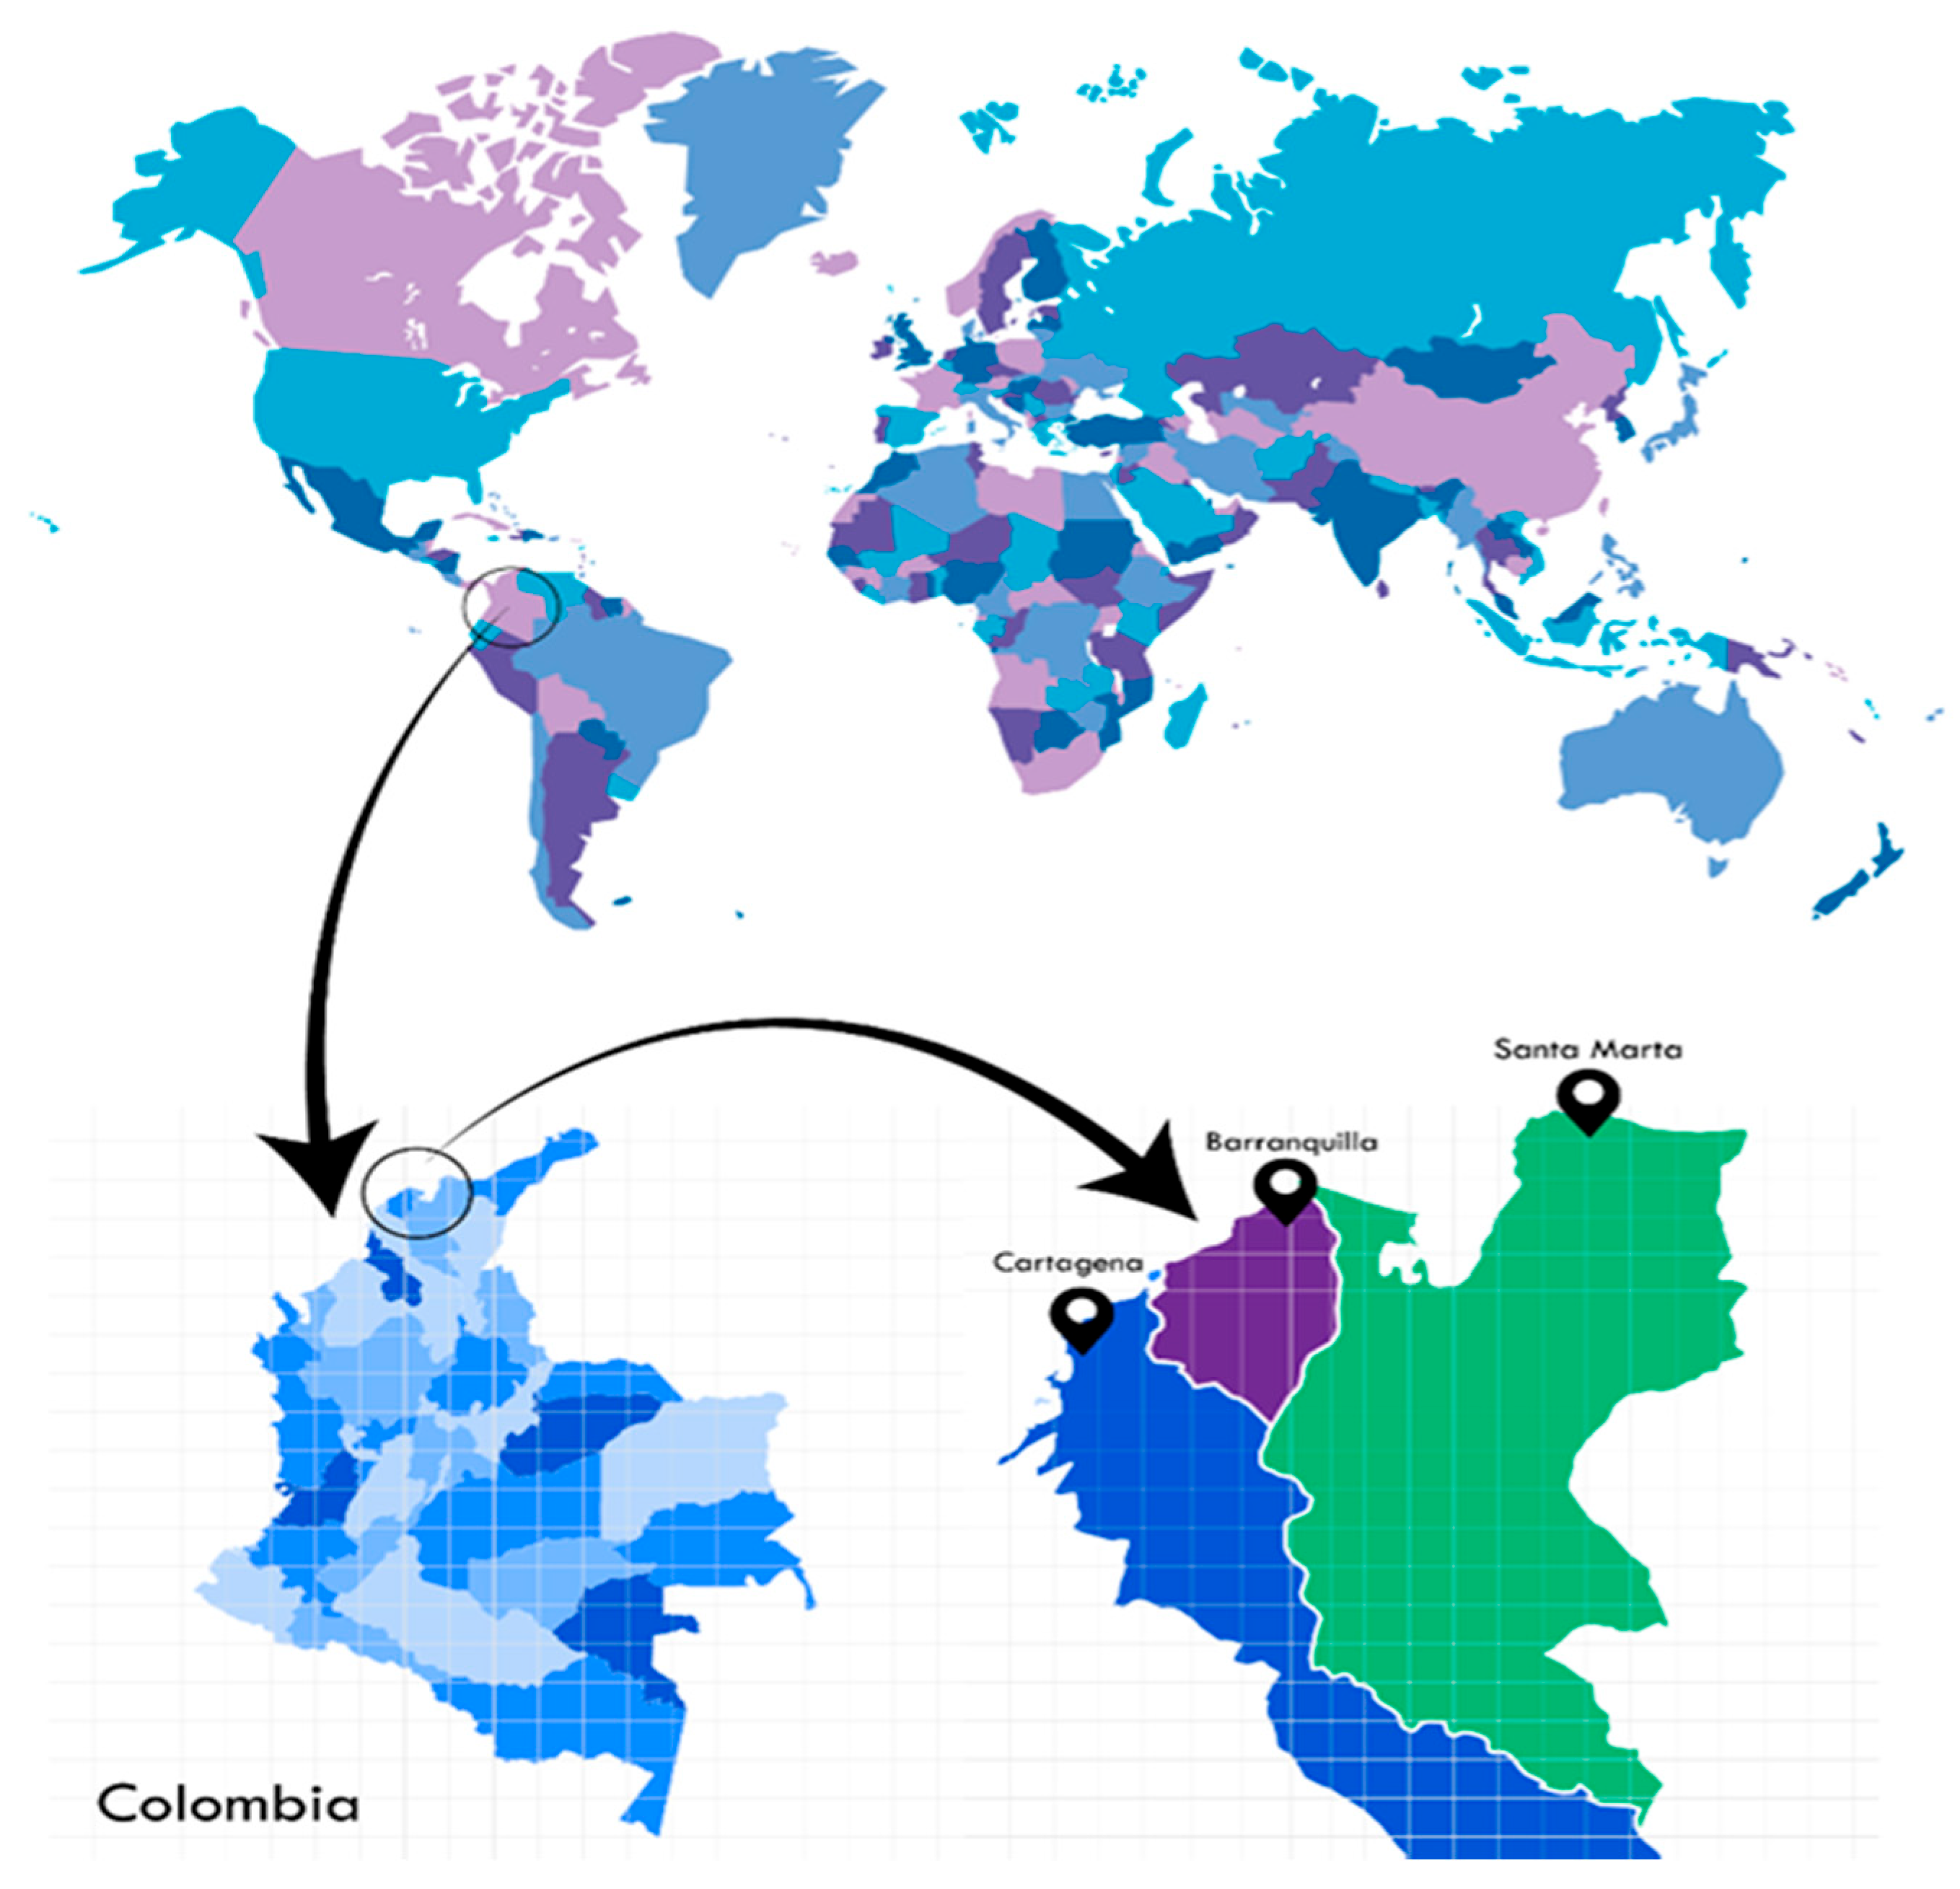
Overview of Santa Marta’s Maritime Traffic
2. Literature Review
3. Materials and Methods
Data Description
4. Methodology
Applied Model
5. Results and Discussions
5.1. Key Findings from Interaction Insights
5.1.1. Port Condition Factor
- Santa Marta boasts strong maritime infrastructure (INF-ACCES: 2.174), facilitating efficient ship entry and exit. This capability plays a key role in attracting shipping lines and ensuring rapid turnaround times, significantly enhancing the port’s global connectivity. Santa Marta’s natural deep-water harbor is a significant advantage, accommodating large vessels such as post-Panamax ships. However, the port needs to address infrastructural improvements to fully leverage this natural benefit.
- Storage and road transport (INFR–WARE: −2.413, INFR-ROAD: −2.495)—Insufficient storage capacity results in congestion and operational delays. Additionally, inadequate and unsafe road infrastructure hampers the efficient movement of goods, negatively impacting the port’s overall competitiveness.
- Although infrastructure provides a solid foundation, further investment in superstructure, such as the addition of more container cranes, is essential to enhance operational capacity and improve overall port efficiency.
- Two important aspects (LAB-ROAD: −5.087) were identified. First, there may be inefficiencies in the management of the labor force involved in road transport, resulting in delays, miscommunication, and bottlenecks in the flow of goods. This could be attributed to inadequate staffing, insufficient training, or a lack of proper oversight in logistical operations. Second, it also suggests that road transport workers may be operating under suboptimal conditions, negatively impacting their performance, safety, and overall efficiency. These conditions may include long working hours, inadequate facilities, or unsafe road infrastructure.
- The implementation of advanced technologies in storage (WARE) has significantly enhanced inventory management and cargo traceability, improving overall operational efficiency (TEC LOG–WARE: 5.719). Virtual platforms for handling payments and cargo manifests provide a competitive edge. However, response times on these platforms require improvements to maximize their potential.
- The positive impact of infrastructure and technology (INFR–TEC LOG)—Notable positive interactions in infrastructure (INFR) and technology and communication systems (TEC LOG) highlight that investments in these areas have a direct, beneficial impact on the port’s operational performance and competitiveness.
5.1.2. Competition in the Port
- An advantage of road transport over external competition (ECO-ROAD: 2.660) suggests that the Port of Santa Marta benefits from good land connectivity, facilitating the efficient movement of cargo to and from the port. It is particularly advantageous as the closest Caribbean port to major production centers in Colombia. However, there is a lack of adequate road infrastructure, good route conditions, and reliable land transport services, and there is a need to establish logistical agreements to optimize the flow of goods.
- State of internal competition (B1)—A healthy competitive environment within the port community fosters innovation and efficiency.
- State of external competition (B2)—Intense competition from ports such as Barranquilla and Cartagena presents challenges. Cartagena, in particular, exceeds efficiency levels and ranks among top LAC HUB terminals, while Barranquilla faces issues with maritime access and outdated equipment.
- External competition and maritime transport (ECO–SHIP: −2.544)—This reflects the perception that the port faces difficulties in adapting to trends and changes in the global maritime industry, such as digitalization, sustainability, and the increasing competition from other ports. The negative results may indicate a general perception among experts that the Port of Santa Marta is not fully leveraging its competitive advantages or that there are significant areas for improvement in terms of management, operations, or the promotion of its services.
- Road and rail connectivity—Improving road security and optimizing cargo handling operations to the rail system is crucial (ICOOP—RAIL: −4.790). For the Port of Santa Marta, the internal cooperation in terms of rail transport should ideally be characterized by a strategic collaboration between the Port of Santa Marta and the railway companies operating in the region, primarily Fenoco S.A. (acronyms in Spanish for Ferrocarriles del Norte de Colombia, the sole service provider). However, this cooperation is not fully effective and remains essential for optimizing the port’s logistics chain, particularly for transporting bulk cargo, such as coal, from the mines in the interior of the country to the port facilities. Rail transport plays a critical role in reducing transportation costs, improving operational efficiency, and mitigating environmental impact compared to other modes of transport, such as road transport. Through future service agreements, the better coordination of schedules, and joint investment in rail and port infrastructure, both parties aim to maximize transport capacity and ensure the punctuality and safety of operations.
5.1.3. Government or Public Sector
- At the public policy level, there is a perception of insufficient support from the national government to strengthen the port. The absence of clear policies and adequate regulatory frameworks to encourage investment in infrastructure and technology has been a recurring obstacle for Santa Marta, preventing it from achieving sustained growth. The national government could focus its efforts on improving the port’s energy efficiency, promoting digitalization, and adopting sustainable technologies to enhance its long-term competitiveness.
- The concrete and specific implementation of public policies should be carried out along two paths. First, we propose the introduction of specific tax incentives to encourage private investment in sustainable port technologies, such as cold chain electrification and low-emission handling equipment. Second, we outline a roadmap for Public–Private Partnerships (PPPs) to improve intermodal connectivity, particularly rail and road access to the port. This proposal is framed within the legal and institutional context of Colombia’s Public-Private Partnerships (PPPs) Law 1508 of 2012, which ensures regulatory harmonization and viability.
5.2. Open-Ended Responses and Recommendations
- Tourism and Cruise Ship TrafficThe Port of Santa Marta serves not only as a commercial gateway but also as an important hub for international cruise tourism. While this dual functionality supports the city’s broader economic base, it creates operational tensions. Cruise ship arrivals frequently occupy berths and terminal resources otherwise designated for container operations, causing delays and inefficiencies. A dedicated berth or a defined cruise schedule—possibly coordinated with container ship rotations—would allow for the better separation of functions and optimized berth utilization.
- Empty Container Handling SchedulesOne of the recurring inefficiencies identified in the port’s operational structure is the lack of predefined schedules for handling empty containers. This results in unpredictable peaks in yard occupation and truck congestion. Implementing fixed time slots or window scheduling for empty container movements would not only increase terminal efficiency, but also facilitate better planning for inland logistics operators and reduce gate congestion.
- Investment in Superstructure and Terminal EquipmentCurrent infrastructure constraints, particularly the limited availability of modern container handling equipment such as ship-to-shore cranes, restrict the terminal’s ability to scale operations or handle larger vessels. Strategic investment in superstructure—especially in post-Panamax cranes, automated stacking systems, and cold chain infrastructure—would enhance handling capacity, reduce turnaround times, and make the terminal more attractive to major shipping lines.
- Security and Road Access InfrastructureSecurity and access limitations remain major concerns for shippers and port users. The access road infrastructure leading to the port is not only insufficient in capacity but also poses safety risks due to poor lighting, limited surveillance, and vulnerability to theft. Improving physical security, implementing smart surveillance systems, and expanding road lanes or creating segregated cargo corridors could substantially increase the reliability and attractiveness of the port’s hinterland connectivity.
- Enhancing Agricultural Export TrafficSanta Marta is located near some of Colombia’s most productive agricultural regions. Increasing containerized agricultural exports—particularly in cold chain commodities such as bananas, avocados, and palm oil—represents a strategic opportunity to boost regional economic integration and increase the port’s cargo diversity. Tailored incentives for agro-exporters, as well as infrastructure for perishable goods handling, could consolidate this segment as a competitive advantage.
- Conflict Between Coal and Container TrafficCurrently, the coexistence of coal export operations and containerized cargo in the same port environment presents a significant operational and environmental conflict. Coal handling generates high levels of dust and particulate pollution, which pose a threat to containerized cargo—especially food products and pharmaceuticals, which require strict sanitary conditions. In the medium term, authorities and concessionaires should evaluate the possibility of segregating or even relocating coal operations outside of container handling areas to reduce contamination risks and enhance the port’s appeal to high-value, sensitive cargo.
5.3. Limitations of the Proposed Framework
6. Conclusions
7. Competitiveness Assessment
Author Contributions
Funding
Data Availability Statement
Conflicts of Interest
Appendix A

References
- Kellett, P. City profile Santa Marta. Pergamon 1997, 14, 393–402. [Google Scholar]
- SuperTransporte. Tráfico Portuario en Colombia; SuperTransporte: Bogotá, DC, USA, 2023. Available online: https://www.supertransporte.gov.co/index.php/superintendencia-delegada-de-puertos/estadisticas-trafico-portuario-en-colombia/ (accessed on 24 May 2024).
- Congress of the Republic of Colombia. Law 01 of 1991; Congress of the Republic of Colombia: Bogotá, DC, USA, 1991. Available online: https://www.funcionpublica.gov.co/eva/gestornormativo/norma.php?i=67055 (accessed on 24 July 2024).
- Cano-Leiva, J.; Cantos-Sanchez, P.; Sempere-Monerris, J.J. The effect of privately managed terminals on the technical efficiency of the Spanish port system. Case Stud. Transp. Policy 2023, 13, 101026. [Google Scholar] [CrossRef]
- Vega, L.; Cantillo, V.; Arellana, J. Assessing the impact of major infrastructure projects on port choice decision: The Colombian case. Transp. Res. Part A Policy Pract. 2019, 120, 132–148. [Google Scholar] [CrossRef]
- Serebrisky, T.; Sarriera, J.M.; Suárez-Alemán, A.; Araya, G.; Briceño-Garmendía, C.; Schwartz, J. Exploring the drivers of port efficiency in Latin America and the Caribbean. Transp. Policy 2016, 45, 31–45. [Google Scholar] [CrossRef]
- Bichou, K.; Gray, R. A critical review of conventional terminology for classifying seaports. Transp. Res. Part A Policy Pract. 2005, 39, 75–92. [Google Scholar] [CrossRef]
- Garza, N.; Ovalle, M.C. Tourism and housing prices in Santa Marta, Colombia: Spatial determinants and interactions. Habitat Int. 2019, 87, 36–43. [Google Scholar] [CrossRef]
- Patel, H.; Chang, C.T. Beyond throughput: Evaluating maritime port competitiveness using MABAC and Bayesian methods. Comput. Ind. Eng. 2024, 192, 110248. [Google Scholar] [CrossRef]
- Tongzon, J.; Heng, W. Port privatization, efficiency and competitiveness: Some empirical evidence from container ports (terminals). Transp. Res. Part A Policy Pract. 2005, 39, 405–424. [Google Scholar] [CrossRef]
- Haezendonck, E.; Pison, G.; Rousseeuw, P.; Struyf, A.; Verbeke, A. The Competitive Advantage of Seaports. Int. J. Marit. Econ. 2000, 2, 69–82. [Google Scholar] [CrossRef]
- Acosta, M.; Coronado, D.; Cerban, M.M. Port competitiveness in container traffic from an internal point of view: The experience of the Port of Algeciras Bay. Marit. Policy Manag. 2007, 34, 501–520. [Google Scholar] [CrossRef]
- Acosta, M.; Coronado, D.; Del Mar Cerban, M. Bunkering competition and competitiveness at the ports of the Gibraltar Strait. J. Transp. Geogr. 2011, 19, 911–916. [Google Scholar] [CrossRef]
- Kaliszewski, A.; Kozłowski, A.; Dąbrowski, J.; Klimek, H. Key factors of container port competitiveness: A global shipping lines perspective. Mar. Policy 2020, 117, 103896. [Google Scholar] [CrossRef]
- Chang, Y.T.; Talley, W.K. Port Competitiveness, Efficiency, and Supply Chains: A Literature Review. Transp. J. 2019, 58, 1–20. [Google Scholar] [CrossRef]
- Wilmsmeier, G.; Hoffmann, J.; Sanchez, R.J. The Impact of Port Characteristics on International Maritime Transport Costs. Res. Transp. Econ. 2006, 16, 117–140. [Google Scholar] [CrossRef]
- Yeo, G.T.; Roe, M.; Dinwoodie, J. Evaluating the Competitiveness of Container Ports in Korea and China. Transp. Res. Part A Policy Pract. 2008, 42, 910–921. [Google Scholar] [CrossRef]
- Parola, F.; Risitano, M.; Ferretti, M.; Panetti, E. The drivers of port competitiveness: A critical review. Transp. Rev. 2017, 37, 116–138. [Google Scholar] [CrossRef]
- Moya, J.M.; Valero, M.F. Port choice in container market: A literature review. Transp. Rev. 2017, 37, 300–321. [Google Scholar] [CrossRef]
- Luo, M.; Chen, F.; Zhang, J. Relationships among port competition, cooperation and competitiveness: A literature review. Transp. Policy 2022, 118, 1–9. [Google Scholar] [CrossRef]
- Cullinane, K.; Fei, W.T.; Cullinane, S. Container terminal development in mainland China and its impact on the competitiveness of the port of Hong Kong. Transp. Rev. 2004, 24, 33–56. [Google Scholar] [CrossRef]
- Trade, U.N.; Unctad, D. Review of Maritime Transport Executive Summary. Available online: https://unctad.org/system/files/official-document/rmt2020_en.pdf (accessed on 20 January 2024).
- Michael, O.O. Assessing the contribution of containerization to the development of Western Ports, Lagos Nigeria. J. Int. Logist. Trade 2019, 17, 12–20. [Google Scholar] [CrossRef]
- Kaliszewski, A.; Kozłowski, A.; Dąbrowski, J.; Klimek, H. LinkedIn survey reveals competitiveness factors of container terminals: Forwarders’ view. Transp. Policy 2021, 106, 131–140. [Google Scholar] [CrossRef]
- Rugman, A.M.; Verbeke, A. Foreign Subsidiaries and Multinational Strategic Management: An Extension and Correction of Porter’s Single Diamond Framework. MIR Manag. Int. Rev. 1993, 33, 71–84. [Google Scholar]
- Baştuğ, S.; Haralambides, H.; Esmer, S.; Eminoğlu, E. Port competitiveness: Do container terminal operators and liner shipping companies see eye to eye? Mar. Policy 2022, 135, 104866. [Google Scholar] [CrossRef]
- Pabón-Noguera, A.; Carrasco-García, M.G.; Ruíz-Aguilar, J.J.; Rodríguez-García, M.I.; Cerbán-Jimenez, M.; Domínguez, I.J.T. Multicriteria Decision Model for Port Evaluation and Ranking: An Analysis of Container Terminals in Latin America and the Caribbean Using PCA-TOPSIS Methodologies. Appl. Sci. 2024, 14, 6174. [Google Scholar] [CrossRef]
- Zhang, X.; Roe, M. Port Competition. In Maritime Container Port Security; Springer: Berlin/Heidelberg, Germany, 2019; pp. 59–85. [Google Scholar] [CrossRef]
- Miller, K.; Hyodo, T. Assessment of port efficiency within Latin America. J. Shipp. Trade 2022, 7, 1–27. [Google Scholar] [CrossRef]
- Montoya-Rojas, G.A.; García, M.A.; Bello-Escobar, S.; Singh, K.P. Analysis of the interrelations between biogeographic systems and the dynamics of the Port-Waterfront Cities: Cartagena de Indias, Colombia. Ocean. Coast. Manag. 2020, 185, 105055. [Google Scholar] [CrossRef]
- Notteboom, T.E.; Rodrigue, J.P. Port Regionalization: Towards a New Phase in Port Development. Marit. Policy Manag. 2005, 32, 297–313. [Google Scholar] [CrossRef]
- da Costa, D.S.; de Assis Carvalho, M.V.G.S.; de Figueiredo, N.M.; de Moraes, H.B.; Ferreira, R.C.B. The efficiency of container terminals in the northern region of Brazil. Util. Policy 2021, 72, 101278. [Google Scholar] [CrossRef]
- Hubert, M.; Rousseeuw, P. Robust regression with both continuous and binary regressors. J. Stat. Plan. Inference 1997, 57, 153–163. [Google Scholar] [CrossRef]
- Delgado, E.R.M.; Ríos, E.B.R.; Casasola, D.B.; del, M. Cerbán Jiménez, M. Artisanal fishery in Ecuador. A case study of Manta city and its economic policies to improve competitiveness of the sector. Mar. Policy 2021, 124, 104313. [Google Scholar] [CrossRef]

| Port Society | Container Cargo | Bulk Cargo (No Coal) | General Cargo | Bulk Cargo (Coal) | Liquide Cargo | Tons |
|---|---|---|---|---|---|---|
| PS Buenaventura | 3,772,617 | 3,543,649 | 1,382,622 | - | 840,017 | 9,538,905 |
| PS Santa Marta SA | 1,167,308 | 3,835,740 | 341,389 | 1,155,975 | 366,389 | 6,866,801 |
| PS Cartagena | 6,765,064 | - | 26,277 | - | - | 6,791,341 |
| PS Barranquilla | 1,398,486 | 1,485,862 | 398,197 | 870,472 | 14,440 | 4,167,457 |
| PS Tumaco Pacific Port SA | - | - | 6999 | - | 52,421 | 59,420 |
| Tons (Imp/Exp) | 13,103,475 | 8,865,251 | 2,155,484 | 2,026,447 | 1,273,267 | 27,364,563 |
| Percentage | 47.88% | 32.40% | 7.88% | 7.41% | 4.65% | 100% |
| Other Movements | SPR Santa Marta | Colombian Caribbean Ports | World | Europe Union | China | LAC Entire Port System | USA |
|---|---|---|---|---|---|---|---|
| TEU movements 2023 | 82,570 | 3,544,724 | 840,635,534 | 102,751,696 | 262,605,700 | 58,669,478 | 60,554,285 |
| Percentage of Santa Marta in relation to the total in each case. | 2.5% | 0.0097% | 0.08% | 0.031% | 0.14% | 0.13% |
| Aspect | Detail |
|---|---|
| Methodologies Applied |
|
| Criteria Studied |
|
| Geographical Areas |
|
| Operator/Company | Number of Answers | Name 1 |
|---|---|---|
| Maritime and Customs Agency | 10 | Seaboard de Colombia; Frontier del Caribe SA; Gerleninco SA; Caribe SA; Multiport SA; SCS Aduanera de Colombia; Oceánica SA; Deep Blue SA |
| Port Operator | 4 | OPERLOG (Operadores Logísticos) |
| Road Transport | 2 | AP Transportes; Construlogística SA |
| Rail Transport | 2 | FENOCO (Ferrocarriles Nacionales de Colombia) |
| Local Port Authority | 2 | Harbour Master Local Office |
| Container Terminal | 2 | - |
| Local Mayor’s Office | 2 | Office of Development and Sustainability |
| Various experts | 6 | - |
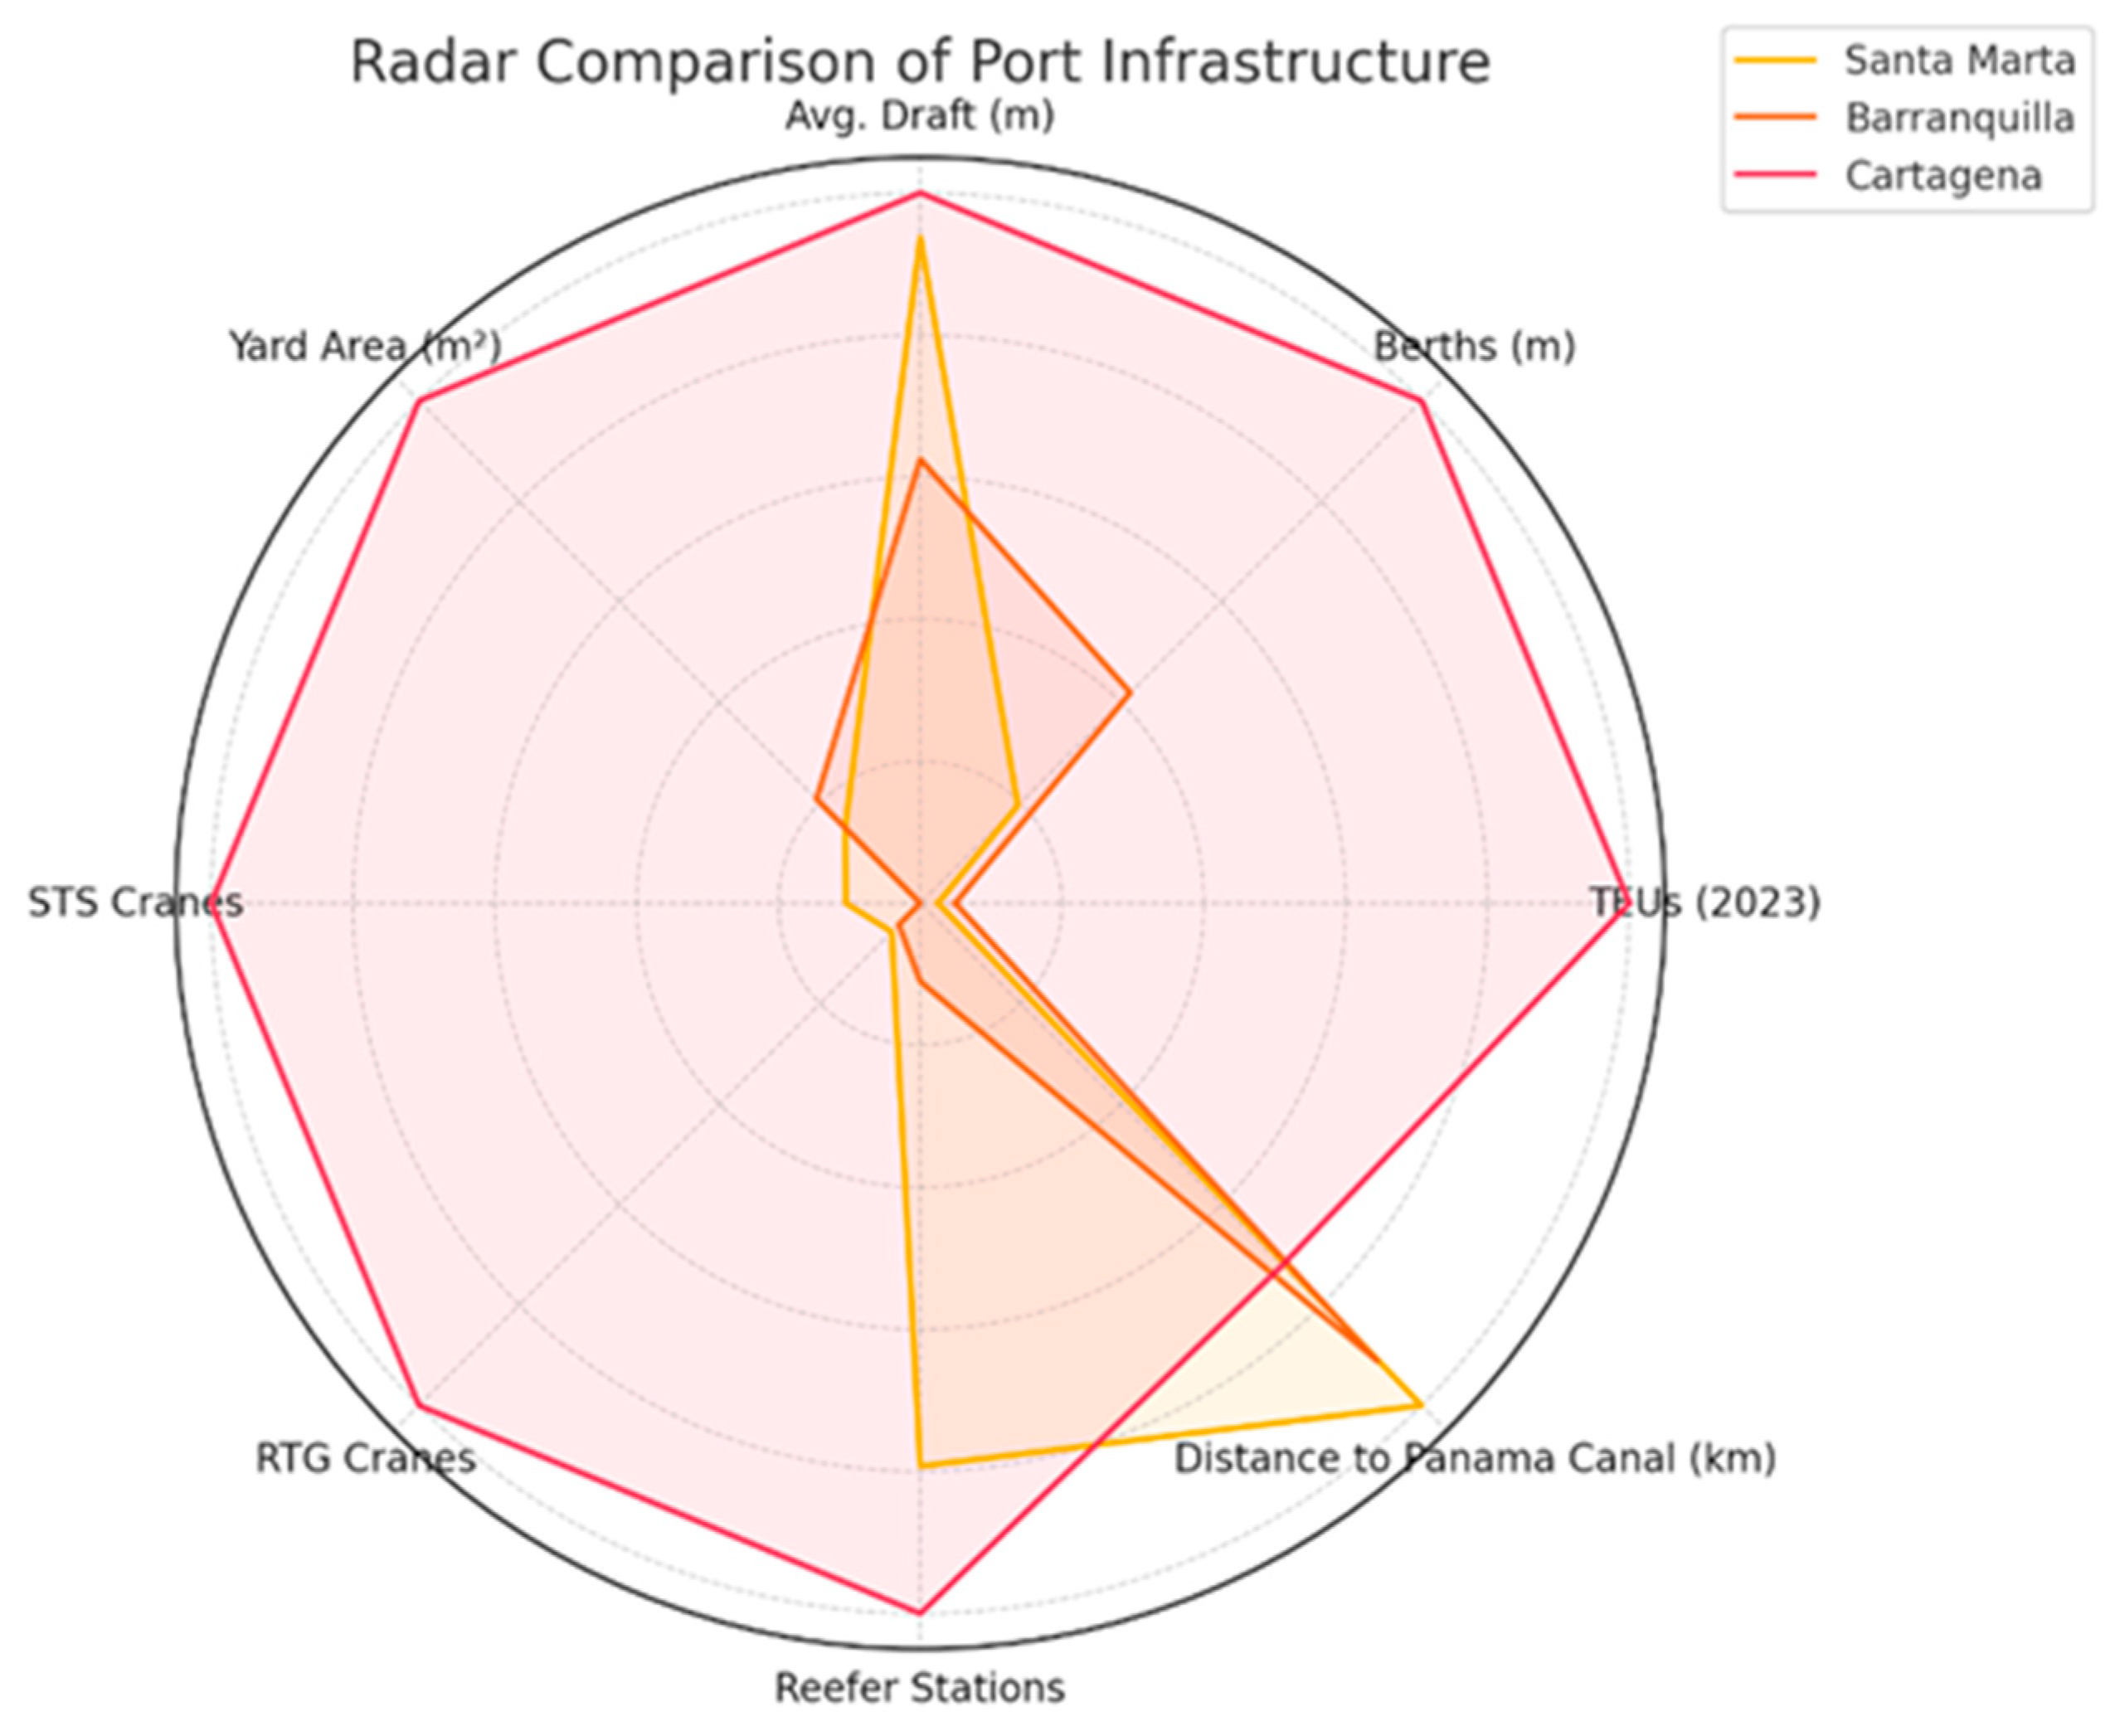
| Port | Berth (m) | Draft Ave. (m) | Yard (m2) | Quay Crane (n) | Gantry Crane (n) | Mobile Harbor Crane (n) | Average Distance to Production/ Consumption Centers (km) | Reffer Stations (n) | Container Terminals (n) | Panama Canal Distance (km) |
|---|---|---|---|---|---|---|---|---|---|---|
| Santa Marta | 325 | 15 | 87,000 | 2 | 4 | 0 | 941 | 1300 | 1 | 790 |
| Barranquilla | 700 | 10 | 120,000 | 0 | 3 | 4 | 978 | 181 | 1 | 720 |
| Cartagena | 1670 | 16 | 580,000 | 19 | 70 | 0 | 1060 | 1640 | 2 | 570 |
| Port | Year | |||||||||
|---|---|---|---|---|---|---|---|---|---|---|
| 2014 | 2015 | 2016 | 2017 | 2018 | 2019 | 2020 | 2021 | 2022 | 2023 | |
| Santa Marta | 71,219 | 120,468 | 120,543 | 120,000 | 104,521 | 124,439 | 129,294 | 62,773 | 77,093 | 82,570 |
| Barranquilla | 92,346 | 136,624 | 137,683 | 125,943 | 160,104 | 160,892 | 146,563 | 172,655 | 187,534 | 163,154 |
| Cartagena | 2,037,000 | 2,135,508 | 2,245,588 | 2,094,539 | 2,406,339 | 2,932,000 | 3,127,000 | 3,344,000 | 3,145,449 | 3,299,000 |
| Buenaventura | 855,400 | 911,533 | 865,749 | 920,000 | 1,369,140 | 1,453,000 | 1,018,840 | 1,082,746 | 1,211,000 | 1,061,256 |
| Port Characteristics | Santa Marta | Barranquilla | Cartagena |
|---|---|---|---|
| Shipping Lines | MSC, Maersk, CMA CGM, Hapag-Lloyd, Sealand | MSC, Maersk, CMA CGM, Hapag-Lloyd, Sealand | MSC, Maersk, CMA CGM, Hapag-Lloyd, Evergreen, COSCO |
| Destinations/ (Foreland) | North America, Europe, Caribbean, South America | North America, Europe, Caribbean, South America | North America, Europe, Asia, South America, Caribbean |
| Annual Vessel calls | 1200 | 1300 | 3100 |
| Key cargo types | Bananas, Coffee, Coal, Palm Oil | Steel products, Machinery, Chemicals, Food products | Coffee, Flowers, Coal, Consumer goods |
| Standardized Matrix, Z | ACCES | SHIP | WARE | LOAD | VAL | ROAD | RAIL | |
|---|---|---|---|---|---|---|---|---|
| A1 | INFR | 0.5234 | 0.2357 | −0.2166 | −0.4483 | −0.0856 | −0.5447 | −0.2705 |
| A2 | SUP | 0.3131 | −0.2878 | −0.1199 | −0.6511 | −0.3573 | −0.2409 | −0.5149 |
| A3 | LABORAL | 1.081 | 0.702 | 0.9348 | 0.3157 | 0.5258 | −0.2198 | 0.305 |
| A4 | TEC LOG | 0.1564 | −0.0067 | 0.7716 | −0.3432 | −0.2735 | −0.3729 | −0.6431 |
| B1 | ICO | −0.05 | −0.2154 | −0.4042 | −0.5599 | −0.4116 | −0.3562 | −0.9764 |
| B2 | ECO | 0.0601 | −0.2866 | 0.0259 | −0.1649 | −0.0727 | 0.0791 | −0.404 |
| B3 | ICOOP | 0.8012 | 0.6976 | 0.7614 | 0.4466 | 0.5909 | 0.4699 | −0.4723 |
| C1 | ICLI | 0.9329 | 0.8115 | 0.8396 | 0.4242 | 0.6431 | 0.6131 | 0.3301 |
| D1 | LGOV | −0.2479 | −0.255 | −0.4563 | −0.5807 | −0.3781 | −0.459 | −0.6329 |
| D2 | CGOV | 0.2109 | −0.1228 | −0.2576 | −0.3324 | −0.2227 | −0.2754 | −0.4107 |
| Estimated Matrix, Z | ACCES | SHIP | WARE | LOAD | VAL | ROAD | RAIL | |
|---|---|---|---|---|---|---|---|---|
| A1 | INFR | 0.2629 | 0.012 | 0.0726 | −0.3046 | −0.1194 | −0.2459 | −0.4842 |
| A2 | SUP | 0.1125 | −0.1383 | −0.0777 | −0.4549 | −0.2697 | −0.3962 | −0.6345 |
| A3 | LABORAL | 0.8987 | 0.6479 | 0.7085 | 0.3312 | 0.5164 | 0.3899 | 0.1516 |
| A4 | TEC LOG | 0.2765 | 0.0256 | 0.0862 | −0.291 | −0.1058 | −0.2323 | −0.4706 |
| B1 | ICO | −0.0467 | −0.2976 | −0.237 | −0.6142 | −0.429 | −0.5555 | −0.7938 |
| B2 | ECO | 0.2691 | 0.0183 | 0.0789 | −0.2984 | −0.1132 | −0.2397 | −0.478 |
| B3 | ICOOP | 0.8488 | 0.598 | 0.6586 | 0.2814 | 0.4666 | 0.3401 | 0.1018 |
| C1 | ICLI | 1.0345 | 0.7836 | 0.8442 | 0.467 | 0.6522 | 0.5257 | 0.2874 |
| D1 | LGOV | −0.0519 | −0.3027 | −0.2421 | −0.6194 | −0.4342 | −0.5607 | −0.7989 |
| D2 | CGOV | 0.1766 | −0.0743 | −0.0137 | −0.3909 | −0.2057 | −0.3322 | −0.5705 |
| Matrix of Competitiveness | ACCES | SHIP | WARE | LOAD | VAL | ROAD | RAIL | |
|---|---|---|---|---|---|---|---|---|
| A1 | INFR | 2.174 | 1.866 | −2.413 | −1.199 | 0.282 | −2.493 | 1.783 |
| A2 | SUP | 1.674 | −1.247 | −0.352 | −1.637 | −0.731 | 1.296 | 0.998 |
| A3 | LABORAL | 1.519 | 0.451 | 1.888 | −0.129 | 0.078 | −5.087 | 1.280 |
| A4 | TEC LOG | −1.002 | −0.270 | 5.719 | −0.436 | −1.399 | −1.173 | −1.439 |
| B1 | ICO | −0.028 | 0.686 | −1.395 | 0.453 | 0.145 | 1.663 | −1.524 |
| B2 | ECO | −1.744 | −2.544 | −0.442 | 1.114 | 0.338 | 2.660 | 0.617 |
| B3 | ICOOP | −0.397 | 0.831 | 0.858 | 1.378 | 1.037 | 1.083 | −4.790 |
| C1 | ICLI | −0.848 | 0.233 | −0.038 | −0.357 | −0.076 | 0.729 | 0.356 |
| D1 | LGOV | −1.635 | 0.398 | −1.787 | 0.323 | 0.468 | 0.849 | 1.385 |
| D2 | CGOV | 0.286 | −0.405 | −2.035 | 0.488 | −0.142 | 0.474 | 1.333 |
| Variable | Estimate | SE | t Stat | p Value |
|---|---|---|---|---|
| Intercept | 0.151641289 | 0.104741343 | 1.447769181 | 0.15380143 |
| x1 | 0 | 0 | ||
| x2 | −0.635833768 | 0.117104382 | −5.429632589 | 0.00000158 |
| x3 | −0.786153128 | 0.117104382 | −6.71326824 | 0.00000002 |
| x4 | 0 | 0 | ||
| x5 | −0.622230823 | 0.117104382 | −5.313471733 | 0.00000238 |
| x6 | −0.945447174 | 0.117104382 | −8.073542245 | 0.000000000 |
| x7 | −0.62961171 | 0.117104382 | −5.376500011 | 0.00000191 |
| x8 | −0.049862416 | 0.117104382 | −0.425794626 | 0.67204910 |
| x9 | 0.135755629 | 0.117104382 | 1.159270278 | 0.25174507 |
| x10 | −0.950591085 | 0.117104382 | −8.117468104 | 0.00000000 |
| x11 | −0.722138686 | 0.117104382 | −6.16662395 | 0.00000011 |
| x12 | 0.747059248 | 0.097976555 | 7.624877663 | 0.00000000 |
| x13 | 0.496224765 | 0.097976555 | 5.064729656 | 0.00000571 |
| x14 | 0.556839188 | 0.097976555 | 5.683392181 | 0.00000064 |
| x15 | 0.179574022 | 0.097976555 | 1.83282645 | 0.07266890 |
| x16 | 0.364798792 | 0.097976555 | 3.723327395 | 0.00049195 |
| x17 | 0.238294176 | 0.097976555 | 2.432155074 | 0.01855856 |
| x18 | 0 | 0 |
| Main Positive Residual | Main Negative Residual | |||||
|---|---|---|---|---|---|---|
| Order | Matrix Position | Value | Competitiveness Advantage | Matrix Position | Value | Competitiveness Disadvantage |
| 1 | 24 | 5.719 | TEC LOG-WARE | 20 | −5.087 | LABORAL-ROAD |
| 2 | 41 | 2.660 | ECO-ROAD | 49 | −4.790 | ICOOP-RAIL |
| 3 | 1 | 2.174 | INF-ACCES | 37 | −2.544 | ECO-SHIP |
| 4 | 6 | −2.493 | INFR-ROAD | |||
| 5 | 3 | −2.413 | INFR-WARE | |||
| Dimension | Assessed Aspect | Technical Description | Strategic Focus/Observation | Strategic Alignment |
|---|---|---|---|---|
| Strategic Location and Specialized Infrastructure | Favorable geographic position; strong performance in refrigerated and bulk cargo handling. | Competitive insertion into global trade routes. Container traffic still presents several improvement areas. | Operational Competitiveness/Global Value Chains | |
| Strength/ Challenge | Storage Capacity and Road Infrastructure | Physical constraints lead to inefficiencies and congestion. | Requires investment in yard Expansion and access road upgrades. | SDG 9 (Infrastructure)/National Logistics Policy |
| Challenge | Limited Government Support | Lack of coordinated action at local and national levels on port and transport infrastructure. | Requires inter-institutional coordination and prioritization in public investment agendas. | Port Governance/Public Policy |
| Strategic Proposal | Tax Incentives for Clean Port Technologies | Implementation of tax exemptions, green credits, and support for low-emission technologies (LNG, green hydrogen, electrified systems). | Requires alignment with national ministries and access to multilateral financing Instruments. | SDG 13 (Climate Action)/IMO 2050 Decarbonization |
| Strategic Proposal | Public–Private Partnerships (PPPs) for Infrastructure and Connectivity | Use of PPPs under Colombia’s Law 1508 of 2012 to improve access roads, rail connectivity, and intermodal terminals. | Suitable for collaboration with FENOCO and for unlocking large-scale infrastructure financing. | SDG 9 (Innovation)/Colombian PPP Law 1508 |
| Strategic Proposal | Positioning as a Value-Added Agro-Export Hub | Development of agro-industrial free zones, partnerships with regional producers, and international trade promotion. | Supports the shift from an extractive cargo model to a diversified, employment-generating logistics platform. | SDG 8 (Decent Work and Economic Growth)/Regional Food Security |
Disclaimer/Publisher’s Note: The statements, opinions and data contained in all publications are solely those of the individual author(s) and contributor(s) and not of MDPI and/or the editor(s). MDPI and/or the editor(s) disclaim responsibility for any injury to people or property resulting from any ideas, methods, instructions or products referred to in the content. |
© 2025 by the authors. Licensee MDPI, Basel, Switzerland. This article is an open access article distributed under the terms and conditions of the Creative Commons Attribution (CC BY) license (https://creativecommons.org/licenses/by/4.0/).
Share and Cite
Noguera, A.d.S.P.; Cerbán Jiménez, M.d.M.; Ruiz Aguilar, J.J. Container Traffic in the Colombian Caribbean: A Competitiveness Analysis of the Port of Santa Marta Through a Technical–Economic Combination Framework. Logistics 2025, 9, 84. https://doi.org/10.3390/logistics9030084
Noguera AdSP, Cerbán Jiménez MdM, Ruiz Aguilar JJ. Container Traffic in the Colombian Caribbean: A Competitiveness Analysis of the Port of Santa Marta Through a Technical–Economic Combination Framework. Logistics. 2025; 9(3):84. https://doi.org/10.3390/logistics9030084
Chicago/Turabian StyleNoguera, Adriana del Socorro Pabón, María del Mar Cerbán Jiménez, and Juan Jesús Ruiz Aguilar. 2025. "Container Traffic in the Colombian Caribbean: A Competitiveness Analysis of the Port of Santa Marta Through a Technical–Economic Combination Framework" Logistics 9, no. 3: 84. https://doi.org/10.3390/logistics9030084
APA StyleNoguera, A. d. S. P., Cerbán Jiménez, M. d. M., & Ruiz Aguilar, J. J. (2025). Container Traffic in the Colombian Caribbean: A Competitiveness Analysis of the Port of Santa Marta Through a Technical–Economic Combination Framework. Logistics, 9(3), 84. https://doi.org/10.3390/logistics9030084